
2-2-2016 – Lets Check This Puppy Out
It has only been 1 trading day since the 2 weekend reports were released, but we can still check this puppy out and see if everything is as expected. To the charts!…
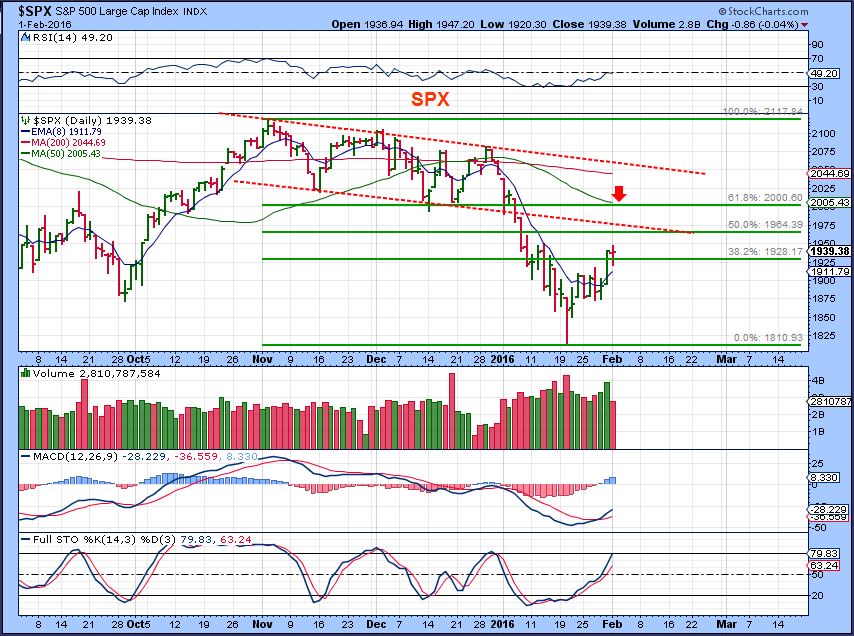
SPX – The markets sold off, but were bought back as the day ended. We still have plenty of time for upside to continue.
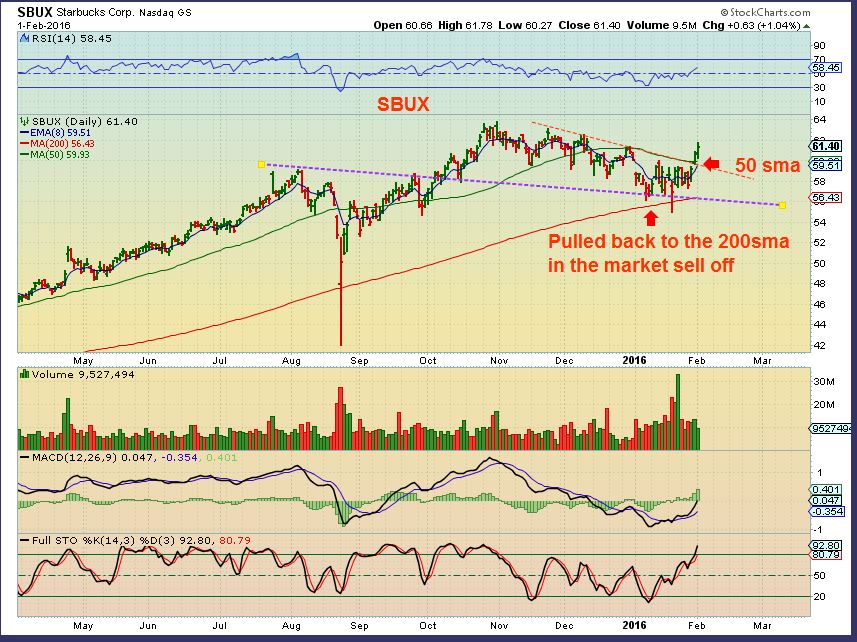
I found a stock that I liked. I have mentioned in the weekend report that I found several that didnt sell off in an ugly way with the markets , so I look to them as possible leaders in the bounce.
SBUX – Overall acting well. This could break out to new highs.
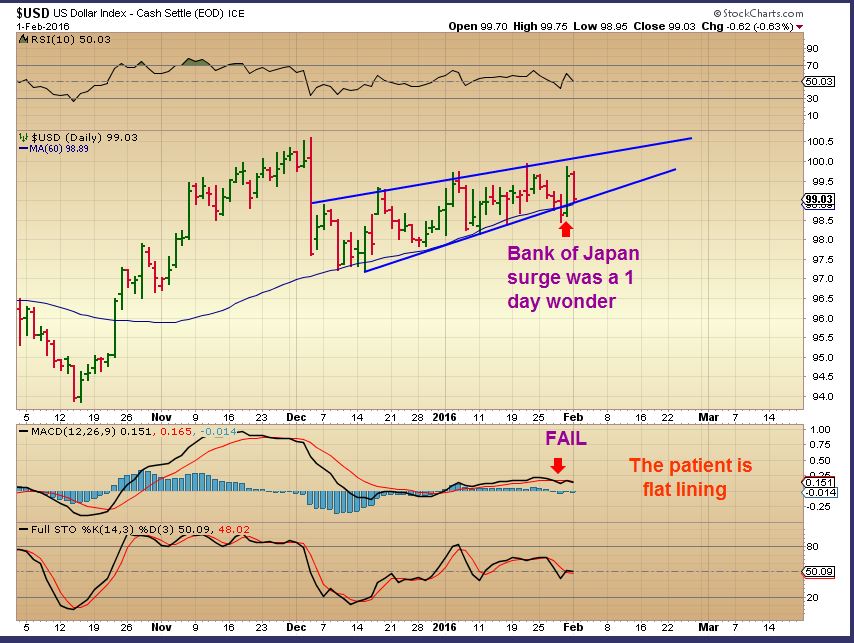
USD – I still see weakness in the dollar, despite the ‘BOJ’ surge. I do not see this as a strong climb higher, but it can continue to act like this.
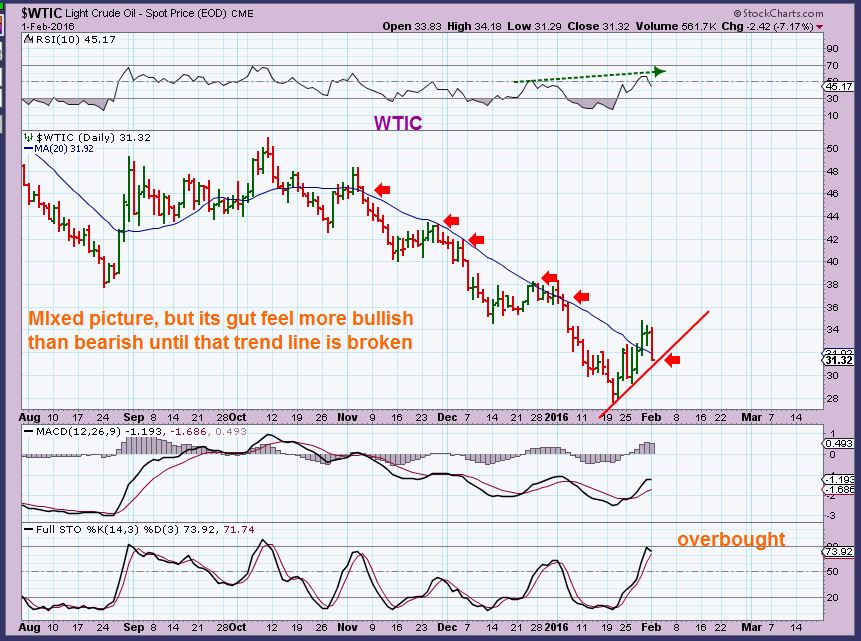
WTIC – If you’ve been here for the past few months, you know that I had a $26.06 target for OIL and have pointed out that OIL struggles at the 20sma on each bounce ( Each daily cycle low). Oil again lost that 20sma . Was it another false break? The trend line has held up, but if Oil continues lower, the drop could get even uglier.
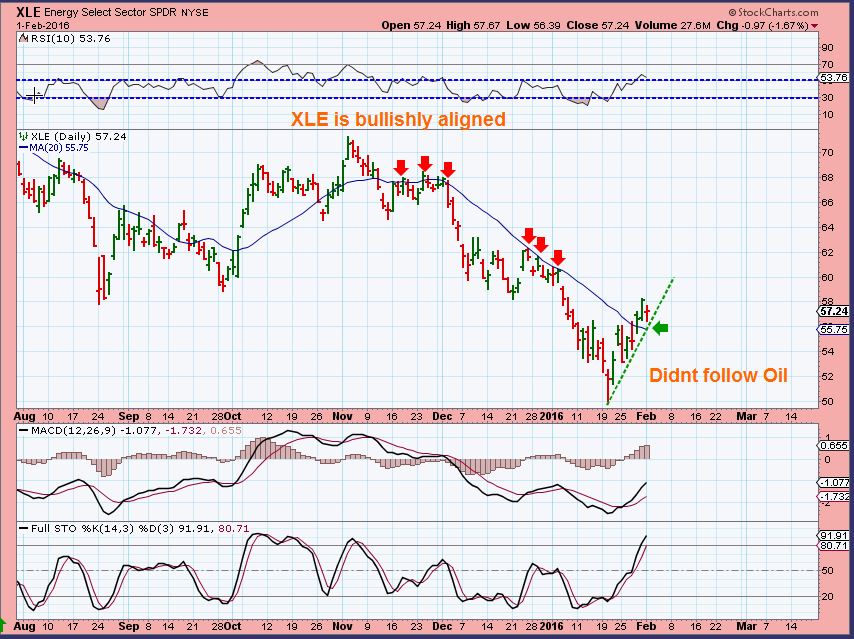
XLE – I have recommended ‘Trading” this sector only for experienced and nimble traders that are in front of their screens, since it has been moving very quickly. Many stocks jumping 20-40% in a day (in both directions). The Energy sector isnt showing the same weakness as OIL , so I am keeping an eye on both.
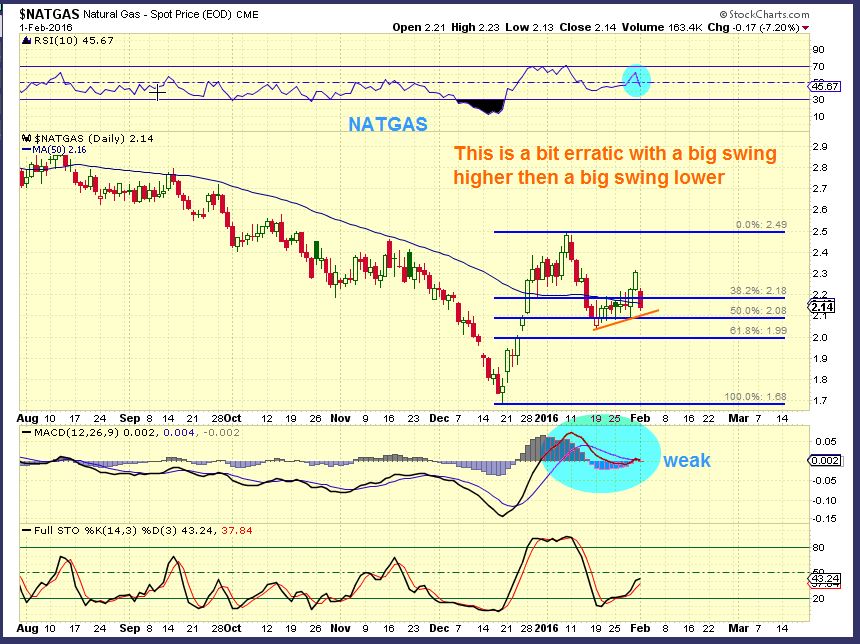
NATGAS – Natgas is not finding follow through after that nice POP on Friday. That can be a problem for the traders here using a 3x ETF. Caution is warranted until it picks a direction. It is a fickle chart.
.
GOLD SILVER & MINERS
.
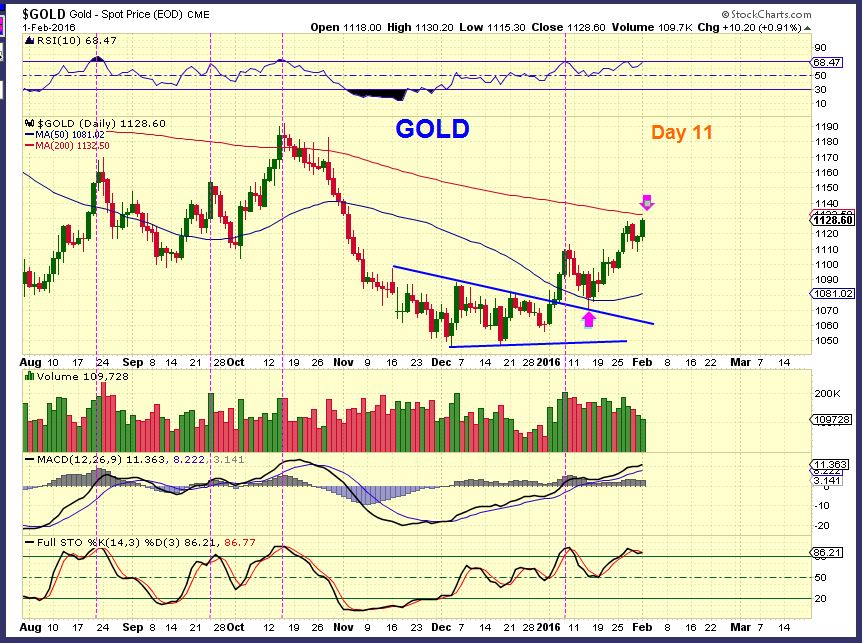
GOLD – Gold is acting very well, but is also at an area that it can stall. I see strength, and it has the look in this set up that it actually wants to break above the 200sma and not slow up. Noteworthy is the fact that many miners have done this too. I will have charts below.
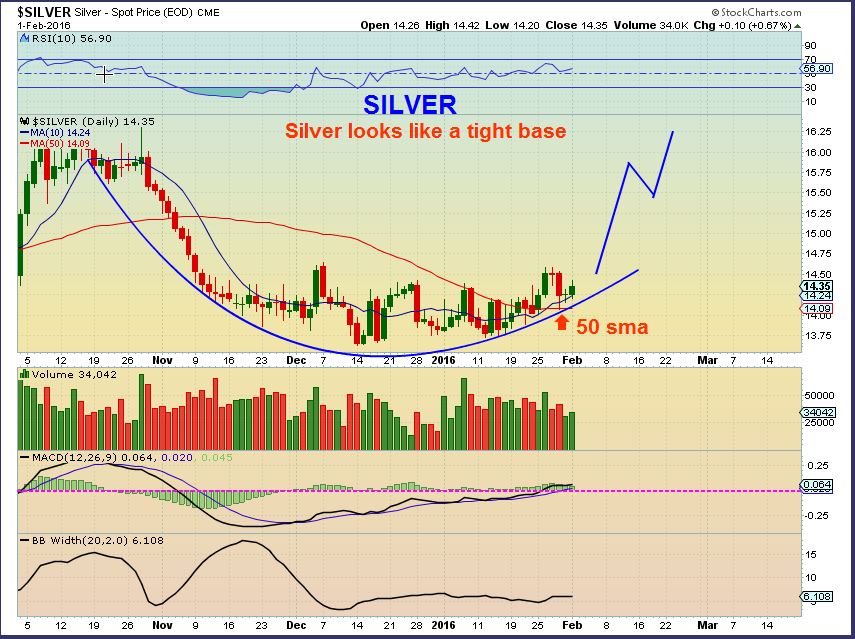
Silver – I hear people saying that “Silver has no strength. Silver is weak. Silver can’t get out of its own way.” That is not what I see. Silvers RSI almost hit 70% on this sideways move, that is not weak. This may become an explosive base, and some silver stocks are beginning to move higher.
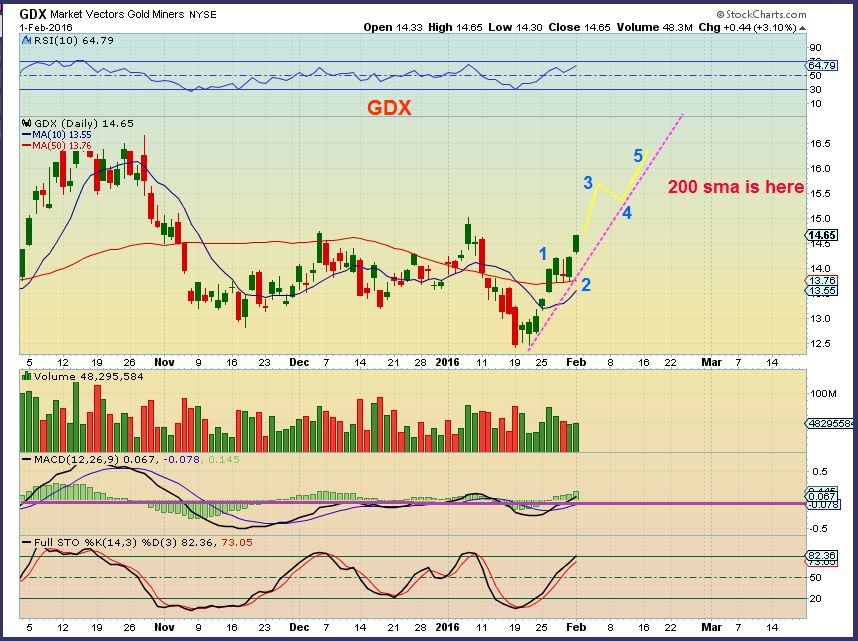
GDX – The 1-2-3-4-5 is just a guess, just an idea of strength, it is not a guaranteed price projection. The reason I put it there is because many think that GDX is at resistance ( The prior Jan high and Dec high ) and overbought. Some are tempted to sell. Locking in profit is fine, but looking at this possibility is also beneficial , because I am seeing individual Miners break right through prior resistance. We will look at examples.
.
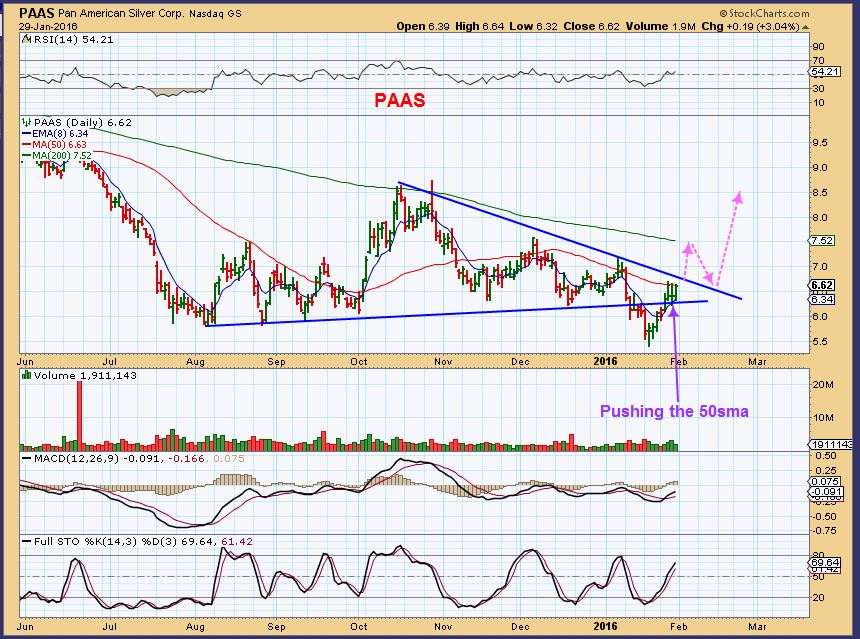
PAAS was approaching a down trend resistance, and also was pushing on the 50sma. Since Silver isnt surging higher, it would probably pause, right? That crawl at the 50sma was tight, so instead I projected a possible break out & tag of the 200sma first.
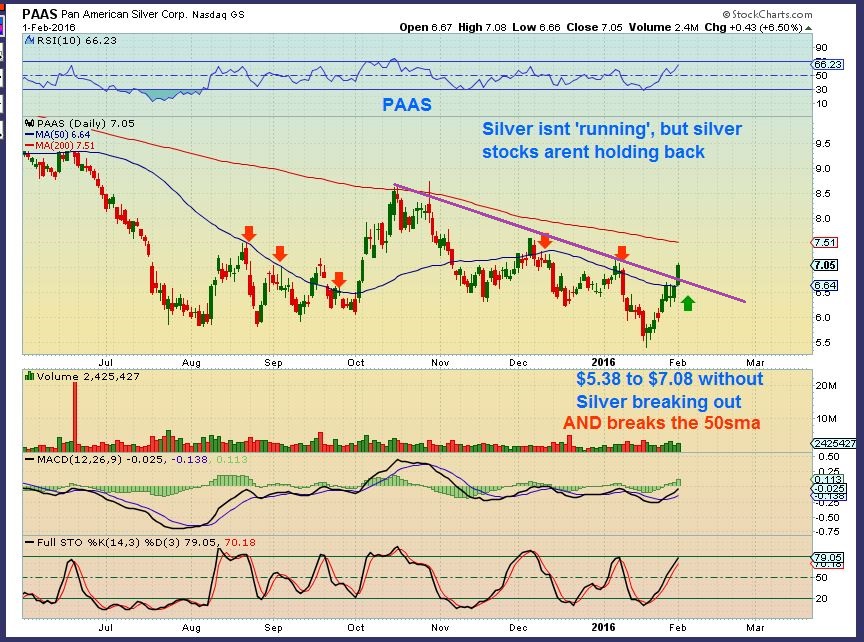
PAAS Feb 1- Silver was lack luster, but the Miners are showing strength.
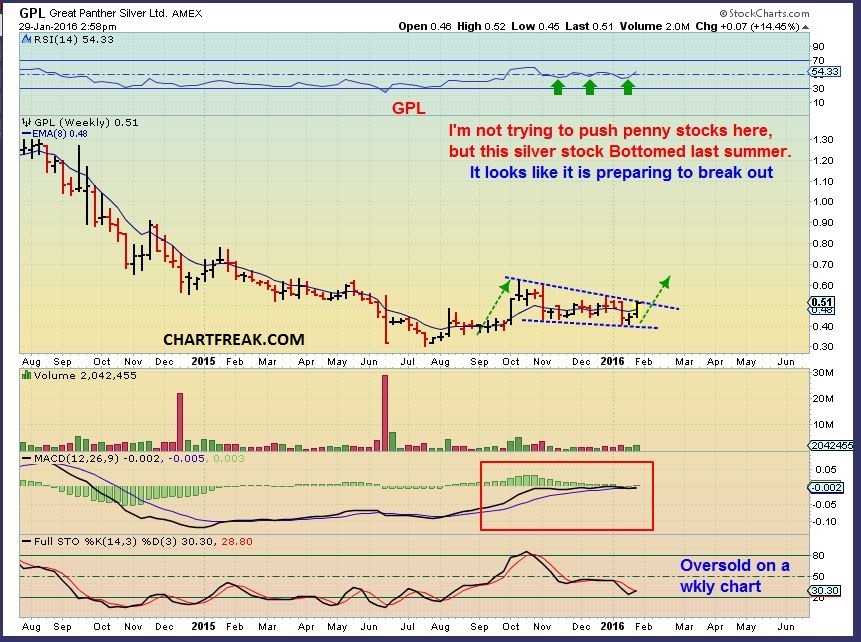
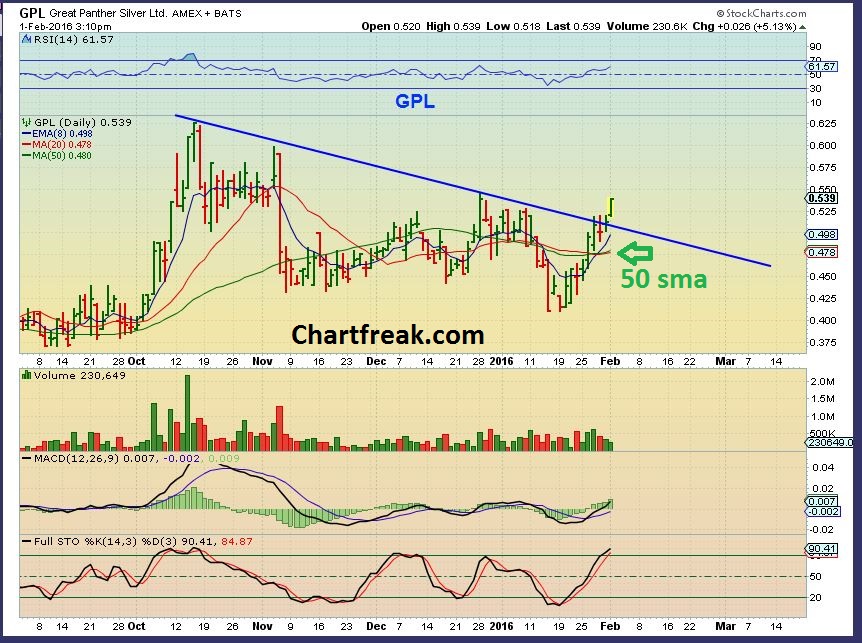
GPL – Another silver stock that is moving against resistance and looks like it will break out ( from the weekend report) .
GPL FEB 1-
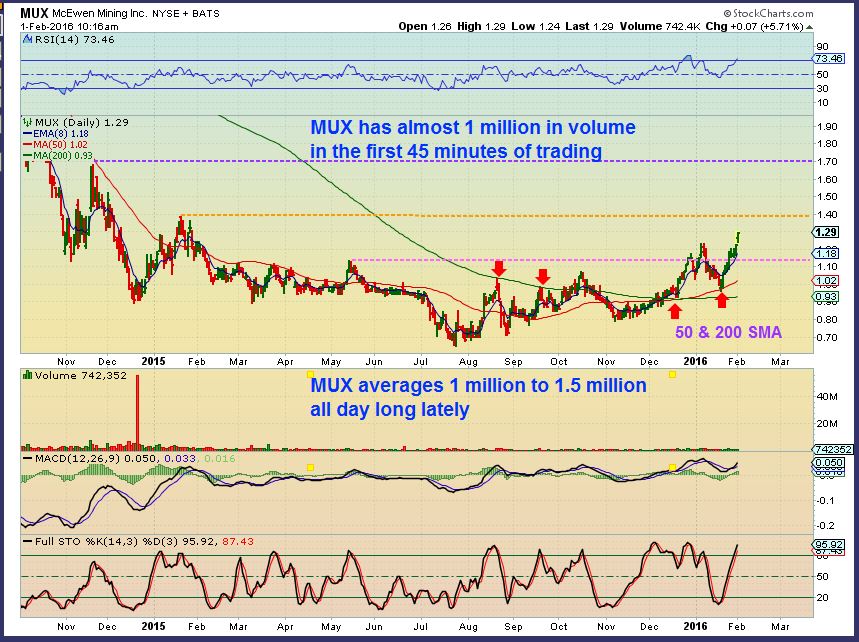
MUX – This was also at a point where it could have paused and pulled back . It broke out. We have been conditioned inside of these 6 month base formations to expect stocks to run up & fail. Run up & fail. Run up and Fail. These are now breaking out. 🙂
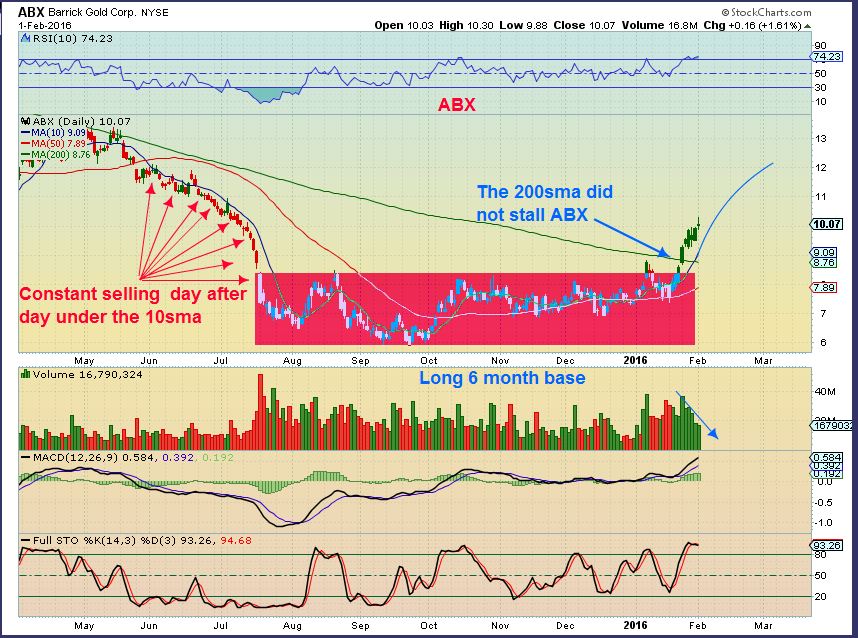
ABX – Repeat after me, “We have been conditioned inside of these 6 month base formations to expect stocks to run up & fail. Run up & fail. Run up and Fail.” That constant selling on the left side of the chart Might be similar to the constant buying that we are starting to notice on the right hand side. We wont know until later. If someone sold at the 200sma and is waiting for a pullback to buy? Maybe & maybe not.
NEM – (From the weekend report) This too reached the 200sma and I mentioned that it could get a pause. Notice that it is overbought, but often I write ” Overbought, but it can stay that way under bullish moves.”
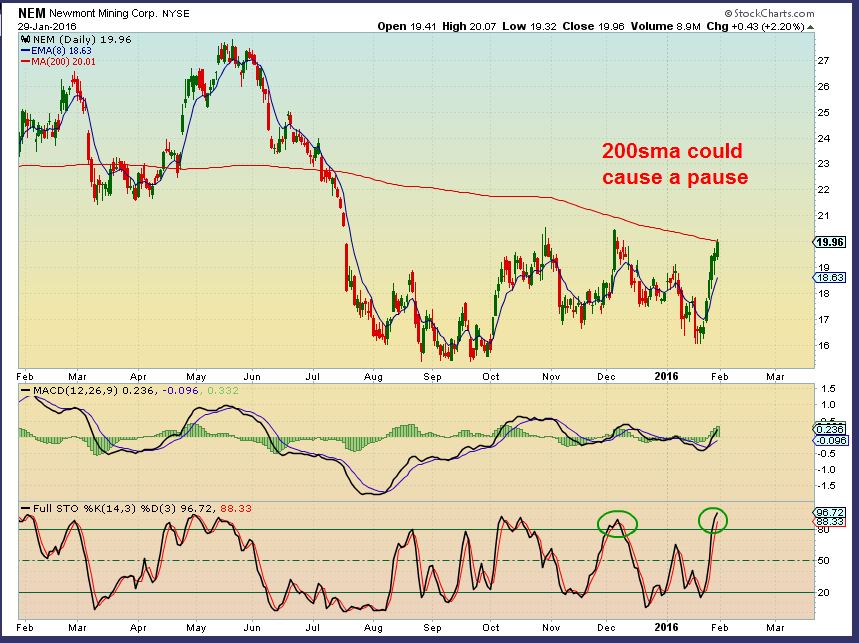
NEM WKLY ( from the weekend report) – I showed the weekly and it looks ready to break out, so I wasn’t looking for a big pause. Maybe a sideways crawl along the 200sma. I also wrote that pushing higher in NEM , ABX, and GG could push GDX higher.
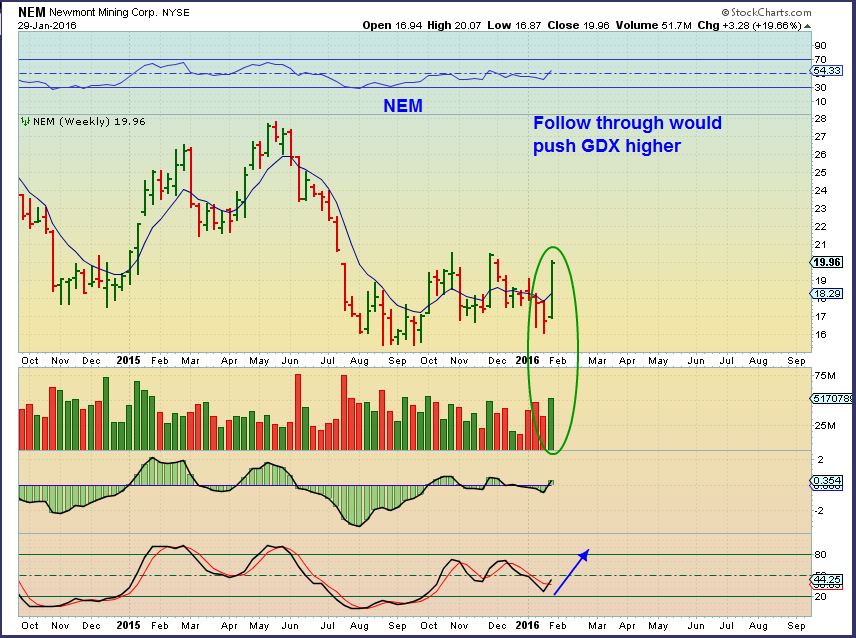
NEM FEB 1- No Pause. A break from a base of this size above the 200sma can just keep crawling higher as technical buyers begin to accumulate positions.

So when to sell? We have just started a move in Miners out of an ICL. If you are a trader and you want to lock in gains, that is fine. Some will sell one stock that “appears” extended, and enter a lagger. THAT is the trader. If you are a medium term trader and have been looking to buy and hold for more than 2 days, we have been in that period since the shake out lows last week. Finally, a move that is showing stamina. It wont last forever, and there are several ways that this could play out. Only time will tell, so to manage positions you could use a rising stop? Just ride out this first and second daily cycle and see where it ends for you ( Not always wise to do in 3xetfs by the way).
For the sake of time, I want to release this report at 8:15 a.m. Some try to read these at morning break at work or before work. I will add a few more charts below , please come back for those. I will write in the comments section below the report when I am finished. I will go back and fix any typos too 🙂
~ALEX
.
Below I will show you 2 ideas. Either could happen, and at this point I cannot tell you which one will, so you have to trade based on what you want for yourself. Lock in profits and wait for an entry ( pullback or just another lagging stock?). Sell partial position and let the rest ride to lock in profit? Sell an extended stock, enter a lagger? Etc. That said, I must say that I expect that this 1st daily cycle in Miners is strong, the 2nd one will be too whether this is a bear mkt rally or more. Lets review …
.
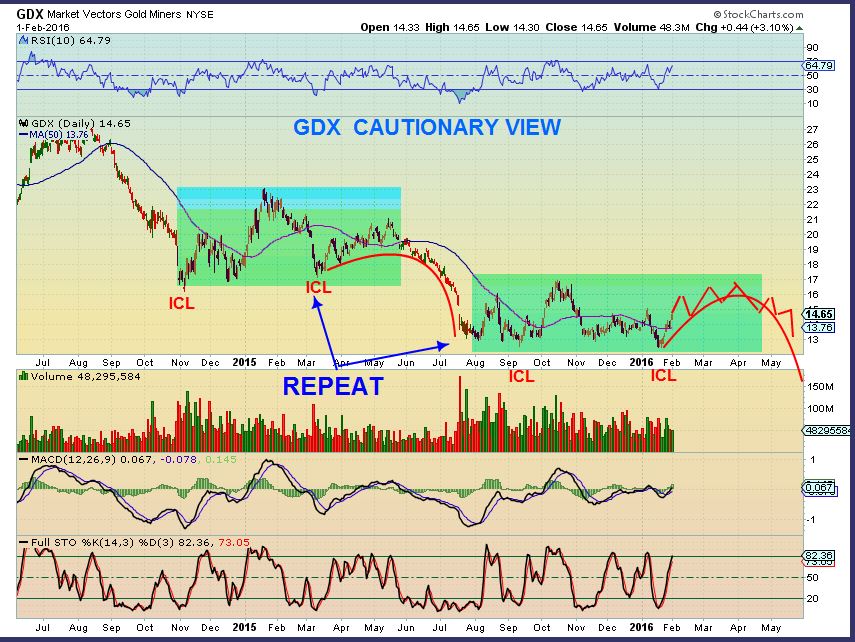
GDX – Let me start with a BEARISH VIEW. It shows that we are getting a strong move higher now ( but that also happened in March) moving out of the 2nd ICL. Don’t they look similar? It ran higher & sideways for 2 daily cycles and topped in may. So we had 2 months higher ( 2 daily cycles) and then she rolled over. THAT is why I say that we just started a move out of an ICL in mid January , and we have 2 months from there to go. Then we get more cautious. Now lets see the Bullish view too.
GDX BULLISH – Some may think that this is too Bullish, overly generous, but I have precedence to this type of move. It is very bullish, and there are other Bullish ideas that are a little less vertical too, but I have seen this before. 6 months of accumulating near the lows by BULLS is lost in a stop run. Smart money takes positions . Those bulls that were shaken out may hesitate to get back in at the ‘shaky’ lows, but they WILL re-enter later and push price higher. Smart money will add too, and the move out of the lows can remain strong for a while.
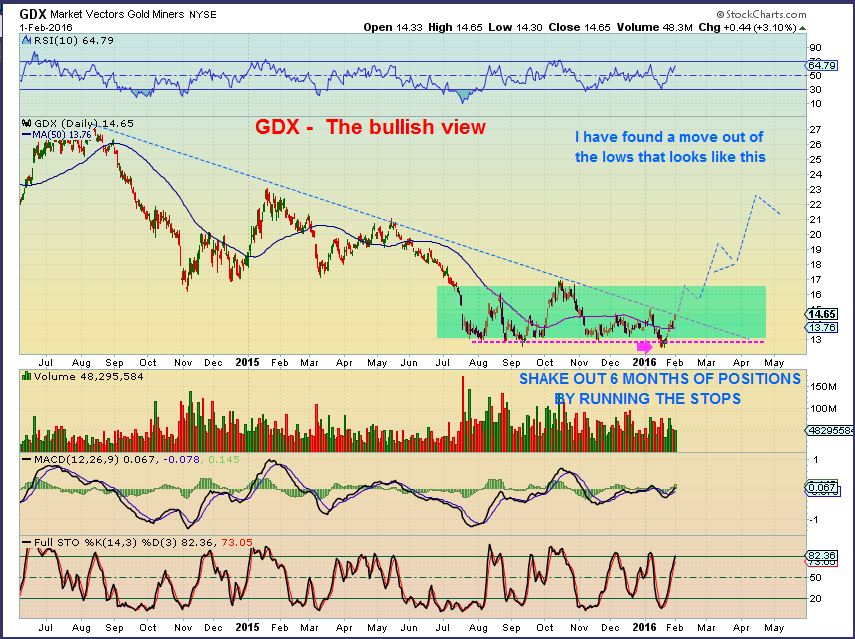
At this point, I cannot tell exactly how this will play out, but I lean toward the BULLISH scenario where lows could be in place. How we rise from there needs to be watched, and I will do that. Those shake out lows wiped 6 months of accumulation off of the slate. That is how lows form often. Other things that I am watching lean toward the bullish side too, and I will share those in the future weekend reports, as I have in the past. So for now, I like the set ups in Miners and expect higher price ( and dips) for the next few weeks.
.
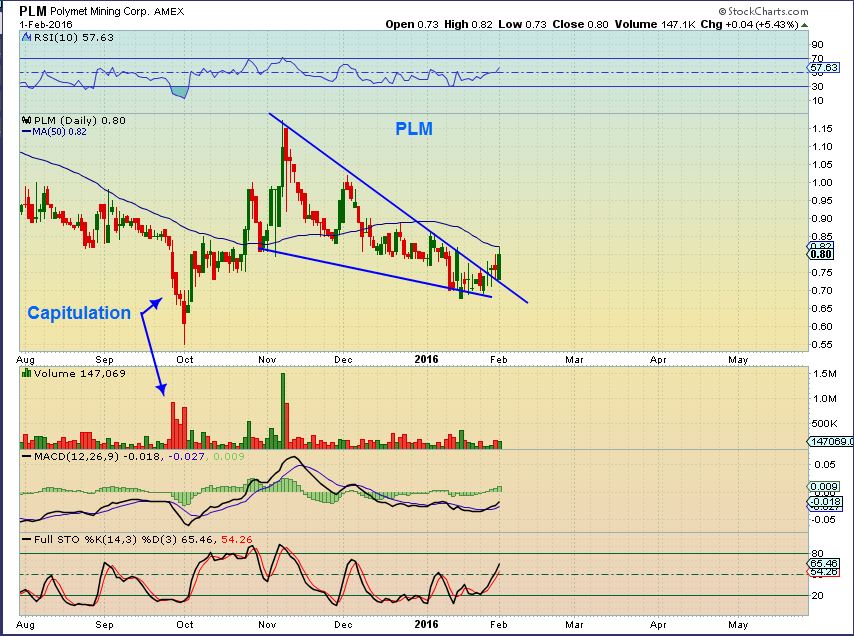
I wanted to post PLM. Someone emailed me last fall on the sudden surge and I mentioned waiting for a good set up to develop, they usually do. Currently I see a wedge and a break out, held down by the 50sma. It could be bought here with a stop below the wedge, or buy a break above the 50sma and place a stop there.


giggle… someone ate their wheaties this morn… funnyguy
*excellent ‘trade management’ reminders … tx
** i appreciate when u show ‘possible’ paths — and not at all becuz I study EWs – but becuz it’s a poignant reminder to anyone — ‘leave open the possibility’ — plan ahead & allow for at least a portion of your “runners to run’ ….. ;o)
Thx Maria –
You’ll appreciate the end of the report then too, if I can get things going again 🙂
Alex, thanks for the great charts. I am the one saying gold is at resistance. I still see more upside. I think we flip over the 200sma then struggle for two days to make a new high. If I see that I’ll sell. If it continues to move higher I’ll stay in. I see the pattern now as similar to Aug-Oct 2012. RSI climbing an ascending trend line. Could be wrong, but that’s how I’m playing it for now.
Hi Bill,
Yes, I looked at your chart and I was seeing the same thing, but I do see some things different this time ( a bit more bullish short term). I am not trading Gold right now personally anyways, I am trading Miners- and they are just rising from a shake out ICL- so its a bit separate in my opinion.
I just have to cover GOLD in the report for those in UGLD or trading futures, etc.
Gold is following Yesterdays path. Should finish Today above 1130. Yes!
Hey all, Sorry about this but I was working from my laptop and Firefox locked up ( still down) and it didn’t save the additional info that I had added. I will try to add what I had here, but it will take a little longer. Sorry for the delay.
One chart was PLM. Someone had asked me about buying it last fall when it ran higher and I mentioned waiting for a better set up. It may be ready now ( just under the 50sma ) . Breaking from a wedge.
Additional Charts were added
Took the PLM trade, up 5% thanks. We really need GOLD to bust that 200sma.
Oh yeah, it just poked above the 50sma. Hope that works out for you .
Sold PLM, up 8%. Thanks
nice trade!
I love owning MUX!
Ditto . The weekly chart that I posted really looks encouraging longer term too.
Anybody on the REN rollercoaster? Wow
No – Does it feel like this ride? ( refresh)
.
I’m not on the coaster but I would imagine! Lol. Poor bastards. Is that Maria?
Yeah, everyone behind him , right? 🙂
FnHilariousBill…. giggle.
.. I don’t ‘do’ rollercoasters…or ferriswheels for that matter.. prefer 2get my thrills in other* ways. yucky upside down rides where my legs end up over my head…
well, actually…. i take that back … I …..
…shoot.. i did it again…didnt i….
Yes, you did!
did u figure out the scripts?
Not really, I had some help! They didn’t explain anything but did help some
Very good possibility of starting wave 5 down (alt. wave 3) of Major 1 on SPX, hitting 50% retrace yesterday……imho……especially if it breaks b’s lows at 1872.70.
I was also watching the 1-2-3-4-5 count on the daily charts and thought of that 5 too ( That is was missing).
I look at that reversal at the lows labelled 3 however, and technically it just looks like a solid low / reversal in place.
So with your count, is it possible that we just get a ‘test ‘ of the low, slightly higher as a ‘5’? Can we get a truncated 5 here? I can see that – but I just didnt think the lows would be broken yet.
By the way, I ask this because I was looking at the recent lows as an ICL , not a DCL and I wouldnt expect an ICL to be broken so soon.
On top of the world w skis on sry I will ba back later tho
uhh.. no taunting…. kennnnnnnnnn
No worries, do a cork screw 720 and get back to me when you can
How many weeks in a normal ICL on the SPX ?
Sure it is certainly a possibility…..but I have a feeling we break below 1812.29 for wave 5 of Major 1 or my alt. count for a wave 3 of Major 1. We could be in a wave 2 up instead of wave 4 of Major 1 if so SPX breaks higher above 1947.20 which would then put the SPX at your weekly rounded top chart line.
I just do not see NEW highs without another round of QE of some sort ……. if the Fed chooses to go another round I will not hesitate to go long…….with leverage.
ooo…… decisive….
Lol I know…….It felt good too !!!
A part of me wishes the Fed does Print ! But that decision if made would be Very dangerous imo.
*hott
If you use slightly lower resolution on your chart, maybe the trendline is still holding? The low today on S&P was within 20 cents of the 10-day SMA. If we gap down and reverse by 1030AM might be ok. If we go lower tomorrow that confirms a wave 5 count upcoming. I haven’t done the Fib math yet, but that takes us into the 1700s on S&P easily. I need a better bounce to set up my shorts. Come on!!
Personally, I dont see any real damage to the charts SO FAR ( SPY QQQ IWM), the drop is normal.
I was thinking that we saw an ICL so that should put the lows in for a couple of weeks. If it was only a DCL, we could drop further. .
refresh
.
Sure looks like a bear flag to me …….. 😉
About ready to break that lower channel TL.
Stochs getting overbought on the daily also.
Should be interesting……..:)
CF, how would you set stops on a penny stock like GPL? At the trend line? At the MAs? The chart looks fantastic but I’m not sure where I’d set a stop. Small position size is the main key, I would think.
Hi Dallas, Yes and Yes 🙂
.
Stops always depend on 1. Where I bought the stock 2. Do I have multiple buys on the way up? 3. Am i just I’m trying to lock in profits? That is a bit different a from stop below my original buy price. 4. My risk tolerance. Some people that I know ALWAYS place a stop right below their buy ( they get stopped out repeatedly, but they cant stomach losses of any size). Other use a 5-10% stop loss in an uptrend. etc
.
So , refresh for a chart. If you were buying it right here for the possible current back test shown, you could place a stop a little below your buy , or a bit below the 50sma .
.
hmmm looks like an interesting article… anyone else see/experience this??
will add to my long list of ‘things to study’ 😉
http://www.bloomberg.com/news/articles/2016-02-01/millennial-splurge-on-lifegoals-giving-leisure-stocks-a-boost
GDX gap fill, or something else going on?
and filled!
Look at NG on the 50sma.
MUX went green ( so far)
The African stocks continue to be strong
USEG interesting chart
man.. i never quite ‘understood’ when you said people ‘get left behind’ …
but .. wow… pretty impressive…
Yeah, Lately it has been BUY THE DIP on an intra-day basis, but most are looking for a 3 day pull back or something to enter, so they get left behind for now.
I’m not saying that it wont come, it will when the daily cycle low comes into play , but right now Miners are being bought on each intraday dip.
Look at GDX using an 8 ema. That is nice so far : )
Actually, pull up a chart of DRD and use an 8 ema. THATS HOW I GOT LEFT BEHIND : )
.
(refresh, I’ll save you the time in case your working)
.
nice ….
thank u sweetthing
Check out SBGL and HMY too … Its like some kind of magic line or something. Maybe we can get GDX & GDXJ to do that this time? : )
i actually am .. right now.. L .. O .. L
2funny
in the past, my time horizon was always longer term…. so I wasn’t concerned with ‘intraday’
.. but it’s pretty amazing…. really
…. makes it difficult for me to go back to swinging .. where things used to be ‘smooth’ .. now I struggle … sigh
We’ve been catching bear market rallies. If we bottom and these start moving like they did 2000 to 2008 and 2009-2012, T/A works like a well oiled machine on these. You can trade or invest them any way you want.
You can actually buy & hold the ICL’s in a bull with leverage , and trade the 3rd or 4th daily cycles . (So in your world, Buy & Hold some positions in the 1-2-3, and trade the 4 & 5 when it gets a little weaker . 🙂
Trade a-b-c down , then start again at that next ICL, which may only be 50% drop of the first 1-2-3-4-5.
😉
yes daddy…
thank u
Sit up straight and stop foollin’ around young lady.
… thank u for the reminder, too .. about the bear rallies — it’s been tough trying to hold follow along holding thru the waves — … yes- stoked and ready …bring on the bull (please) 😉
*so appreciate your steadfast counsel to guide us ‘to it & thru it’ …
** ps. im beauty… ur the beast .. in case u didnt get that …
giggle
Cant wait till the come out with the cartoon ” Lil Brat and the Patient One”
.
Maybe the Gifs will be a little more accurate 🙂
I’m tired of these stoopid BMRs, they can kiss my …
i hear ya cason… :o)
soon grasshopper … soon….
** u must of heard me say … ahhhhhh .. THATSSSSS what CF means… while looking at those charts…
SPX hit 50% retrace yesterday – I didn’t buy HDGE
Perhaps will get another chance if SPX pops to 62% and meets the falling 50 sma.
http://stockcharts.com/h-sc/ui?s=%24SPX&p=D&b=6&g=0&id=p48429605845&a=440989258
I looked at FAZ and that looks like a bull flag and HDGE even more so, but there wasnt much volume on HDGE.
I was holding out for higher. Darn. By the time I know I was wrong, it will be too late already…
I’m counting on Alex to give us the all-clear for an SPX bounce to 2,000, then buy something inverse.
Easy-peasy … I wish.
Yeah, my analysis led me to believe we had the all clear. Oops. Stopped out of TNA today. Had good entry, was just above break even, no loss but was upsetting b/c I thought we motored higher today. Heartbroken.
Alex,
well done once again. your conviction and your chart plus your advice is very valuable. I am on your wave length.
Thank You Marinho, I appreciate that.
I’m really hoping that since we are starting from a deep shake out low in GDX/ GDXJ, we get a good multi week ride mostly higher and then we’ll see where we are.
I HOPE we see final lows in place, I but dont want to get too complacent. Gotta keep the hairs standing up on the back of your neck just in case. Best wishes to all of us! 🙂
SPX update……TL break !
Take a look at GS, JPM, BAC, MS , etc
THAT could start another leg down : )
Is that a bull flag on FAZ tza and sds? HMMMM
Will be expecting 100% clarity before the bacon is crisp tomorrow A.M.
Just kidding:)
giggle
well.. i have it following same wave count as mux, drd, sbgl …. sooooo
https://www.tradingview.com/x/M44pBgKe/
Concur
Alex,
In your opinion was 1/21/16 an ICL in Oil ?
I was thinking it was possible , but a little on the early side. We could have another daily cycle I think.
Well…….that’s too bad.
Maria whatcha got for a Oil count. In a wave 2 down by chance ?
yes dear…
I’ll have to show u mine later… 😉
im at work still… prob till 6 cuz i was sooo naughty today …couldnt rip my eyeballz away from the charts…:-x
no worries
dang.. mux is ‘exceeding’ my target… hmmm… will it head for 261% before correcting in 4??
https://www.tradingview.com/x/FLxlikQa/
I almost bought Muxie at .86 Almost. 🙁
Gold and Silver priced in Canadian dollars (by way of CEF/A) is making my day.
Discount to Net Asset Value is still 8% – but shrinking.
http://stockcharts.com/h-sc/ui?s=CEF%2FA.TO&p=W&b=6&g=0&id=p48485901212&a=443698750
Alex, was thinking of buying AG was hoping to set a buy order at like 2.70 hoping that gap gets filled ,cause it really seems like all Gaps get filled also what do you think of CDE? Thanks brah
Hi Steven,
I see that gap on AG, and it mat fill, but I think it depends on whether Silver POPS or not. If silver runs, the silver stocks may bot go back below their 8ema for a while.
I’ll add it to the report Im writing. 🙂
Barchart momentum index oversold at today’s close http://www.barchart.com/charts/stocks/$BCMM
If we gap lower and reverse, wave 4 up may still be intact and would be long entry to btw 1970-2000 (pending where 50-day ends up). Wave 5 confirmation upon lower day tomorrow, targets well below 1800. 🙁