
Part 2 – They Bought Something, Did You?
Over the past few weeks , there have been a lot of buying opportunities. Long precious Metals, ETFs that allow you to Short the markets, etc. I have about about 50 more charts (in addition to Part 1 of this weekend report) to further discuss the buying opportunities currently forming. To the charts …
.
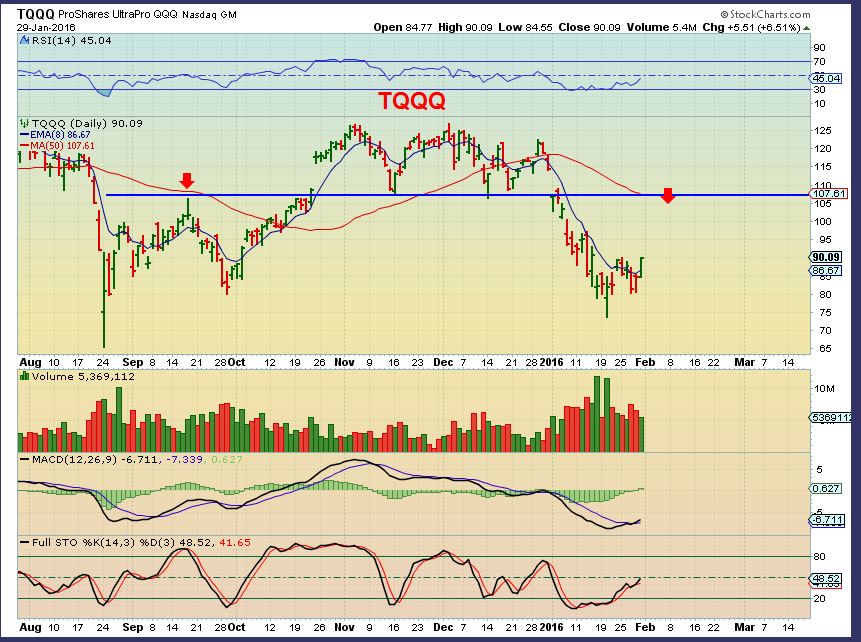
When The NASDAQ back tested that break…
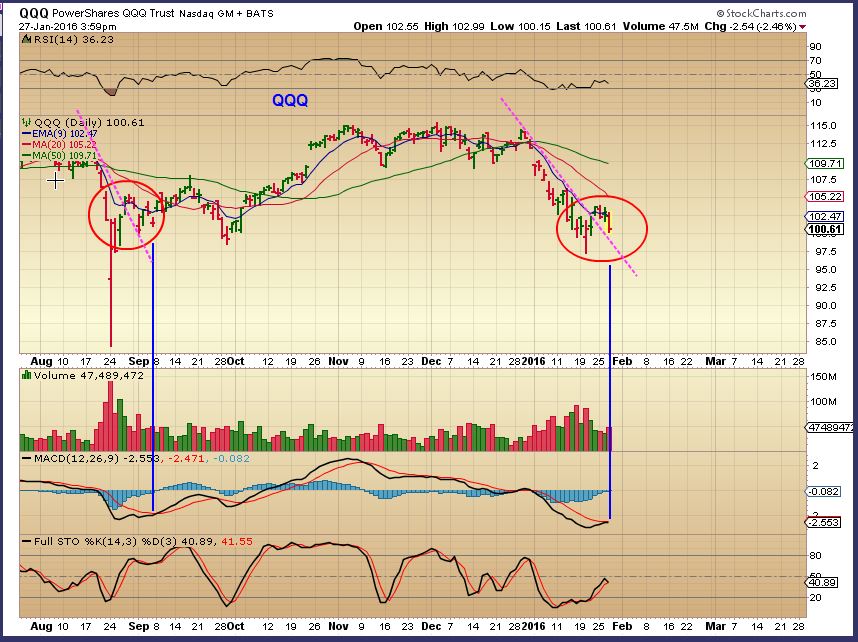
You could have bought TQQQ low risk at $80 with a stop right below the lows. Since I think there is more upside, it is still a buy if you ask me. Especially if we get a dip in the markets. See also ETFs like UPRO, SOX, AND TNA
There is much more…
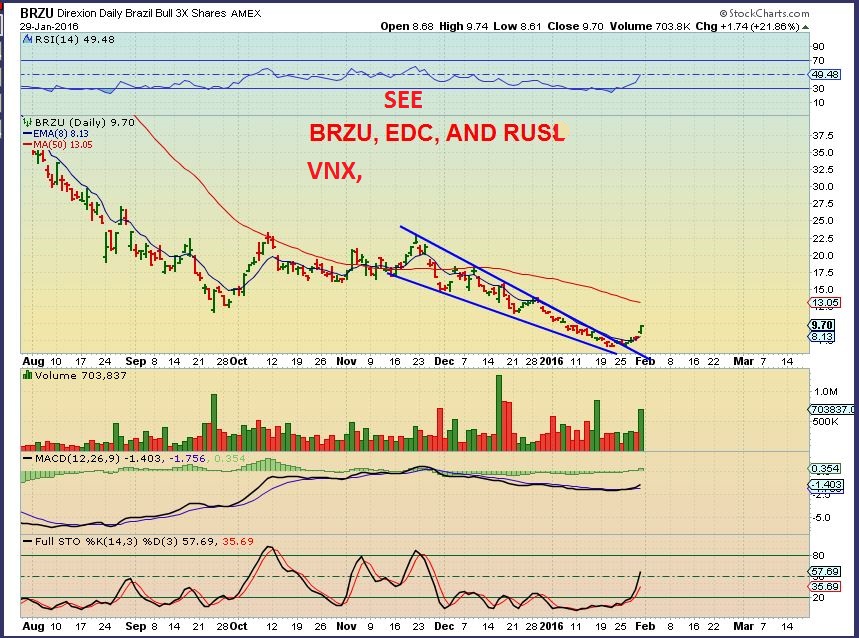
Emerging Markets, BRZU, EDC RUSL, VNX, etc have turned up for what I think should be a multi week bounce too.
.
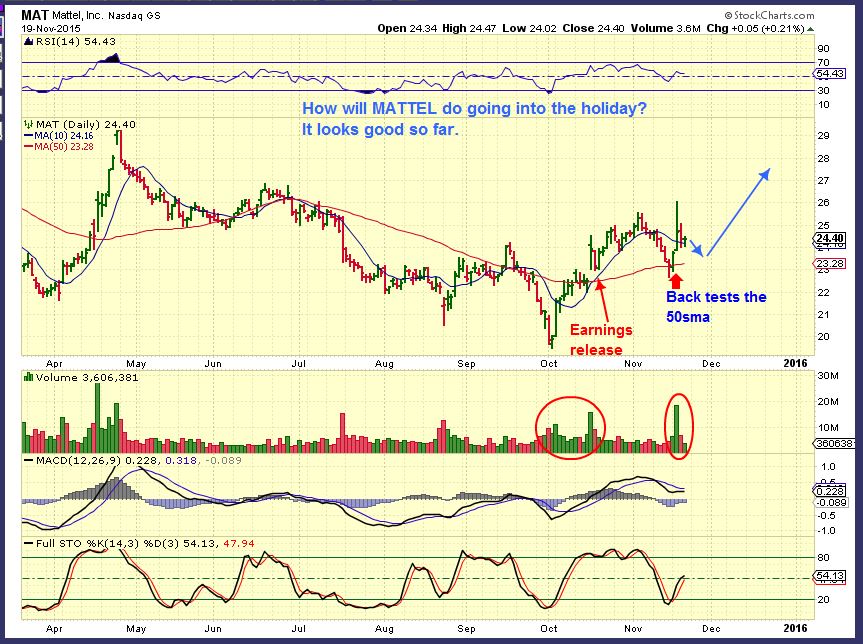
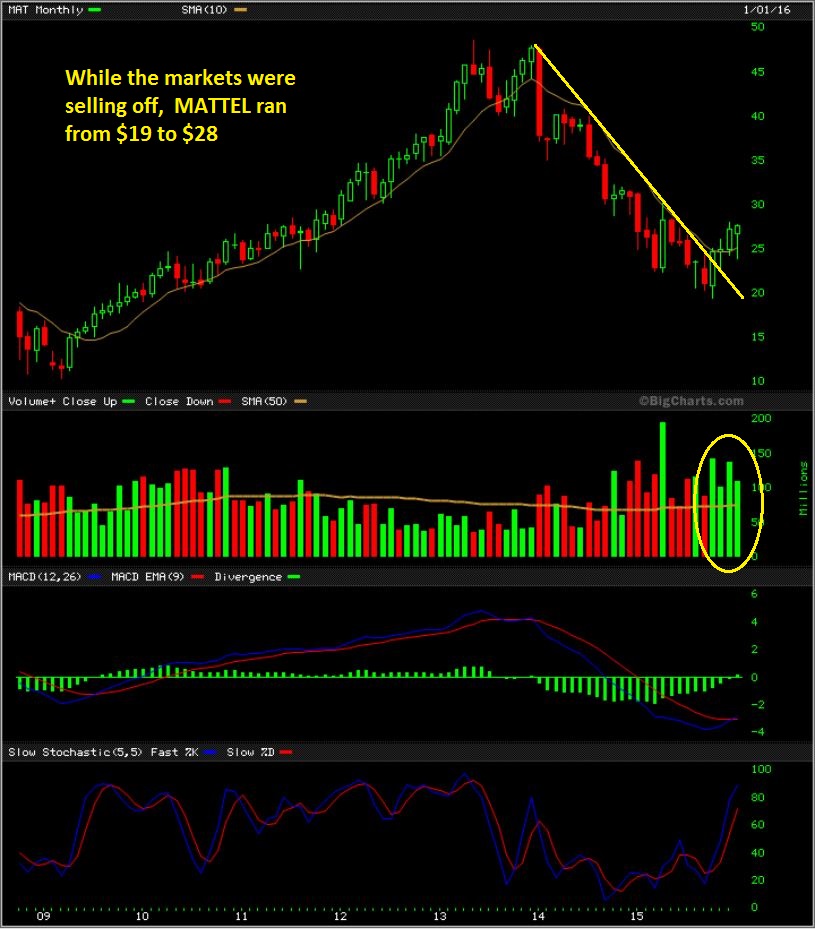
Do you remember that as we entered the market sell off, I was pointing out some stocks that had good set ups and even held up as the markets sold off? There was Mattel, Wal-MArt, Target, ANFI, DANG, etc . Some of them actually did very well, even during the sell off, so I wanted to take a minute to check out those charts. If they were strong in the sell off, they may be stronger at the bounce.
MATTEL looked good at the end of November, running from $19 to $24. What happened during the sell off?
MAT MONTHLY – It continued to $28 and still looks great.
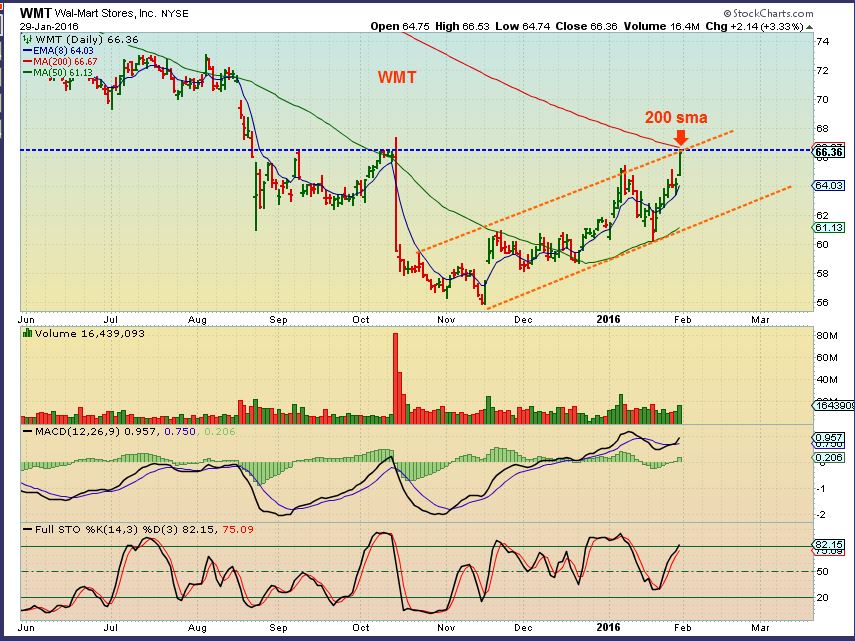
WALMART – during the market sell off (Which was all of January), WMT was making a come back.
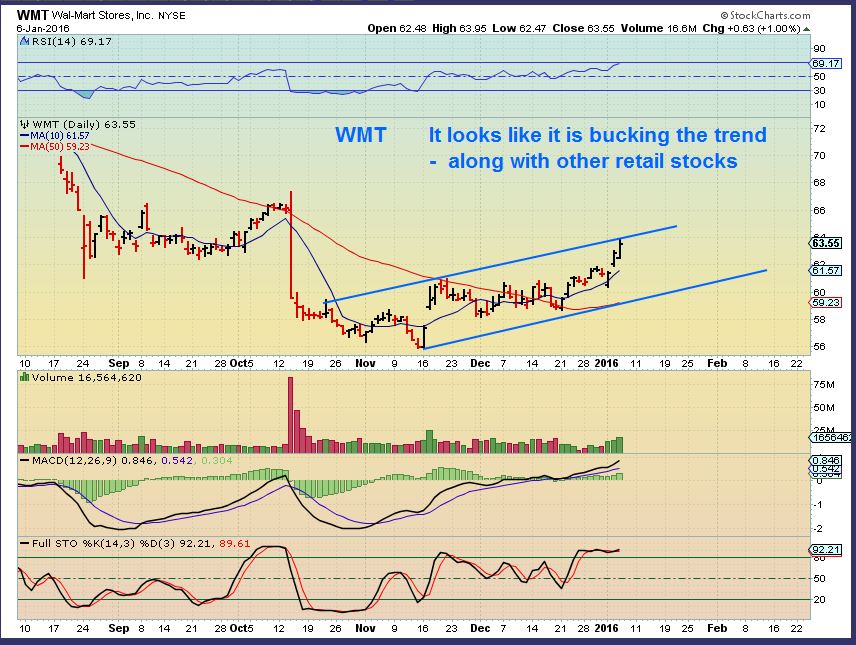
It surged towards the 200sma and other resistance points, so it may pause and pullback. If you bought it, I’d sell some and watch the pullback if it cant break higher. With a market bounce, it may break out here.
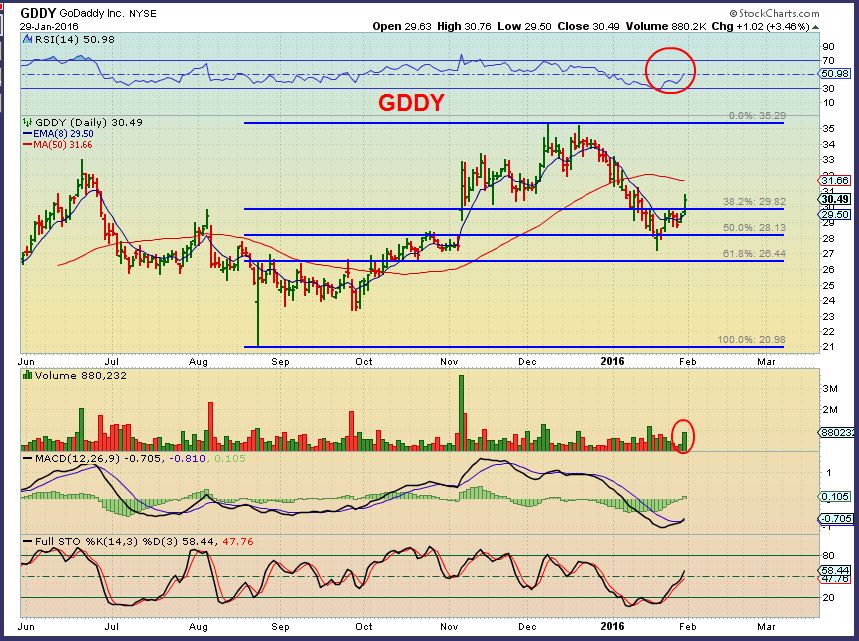
GDDY – The set up was good, but the markets were about to sell off throughout January
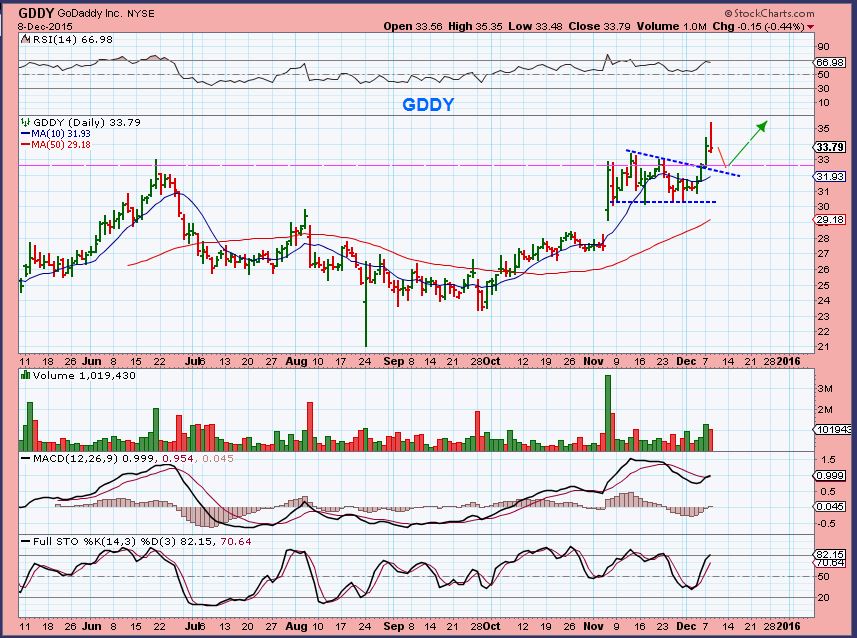
GDDY- The overall sell off was normal ( 50%) , and looks ready to move higher. GDDY showed strength because during the strong sell off, GDDY is where it was at the start of January. The NYSE isnt even close. This may run nicely.
.
Lets just look at possible stocks beaten down and ready to bounce.
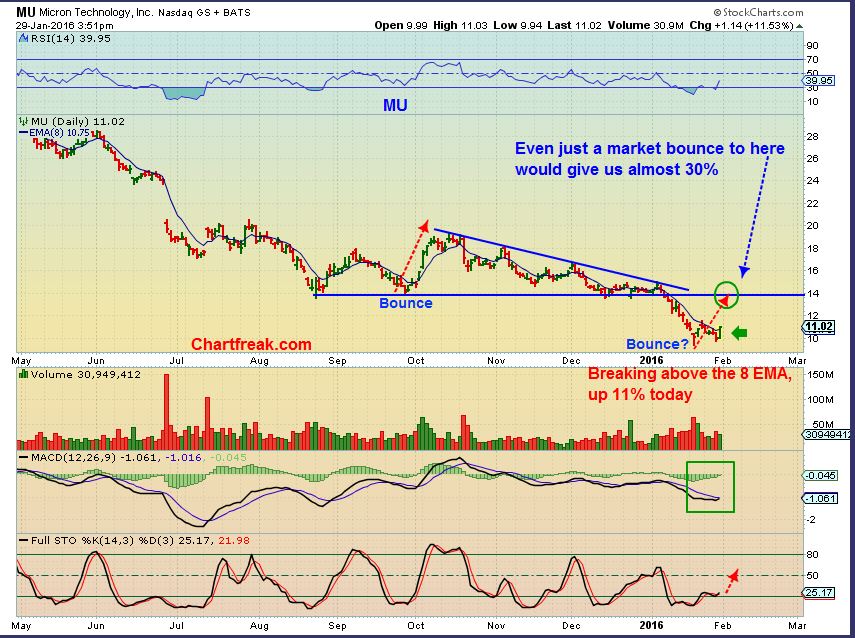
MU – MU had a small bounce and a higher low. This bounce could be a good % -Gainer. TASR & GPRO are at lows and could bounce too. TWTR pre-market is up over $1. Interesting.
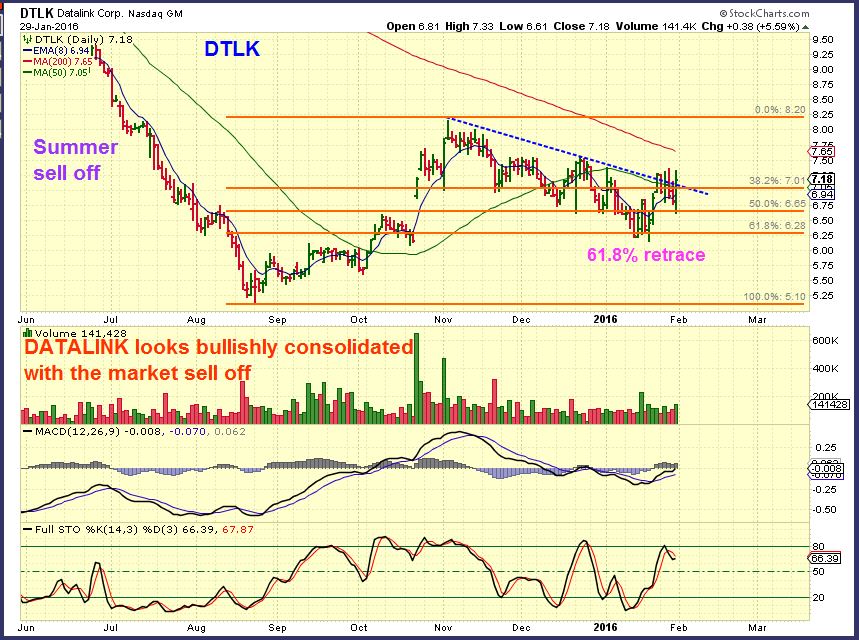
DTLK – Januarys sell off was not bad. It showed strength and is breaking out.
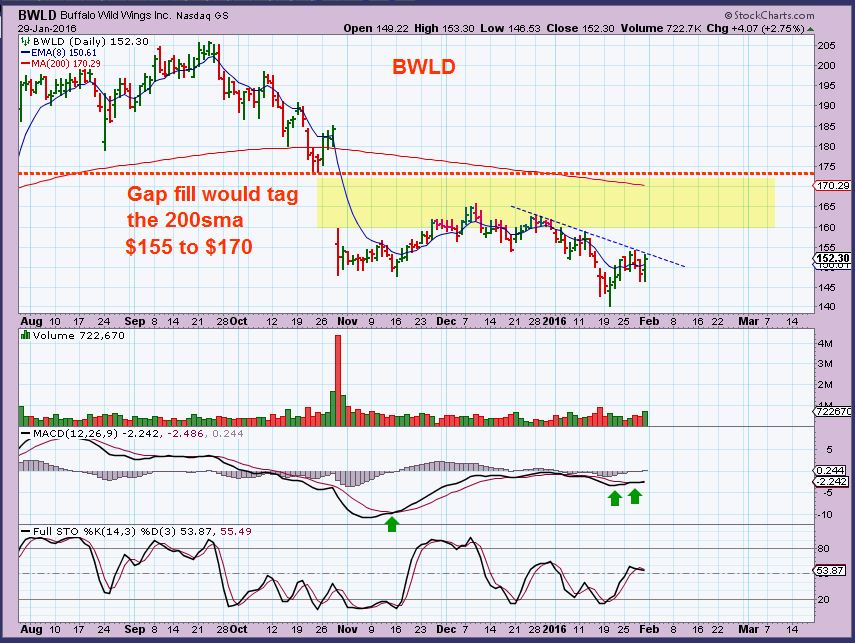
BWLD – Double bottom, strength in the pop Friday.
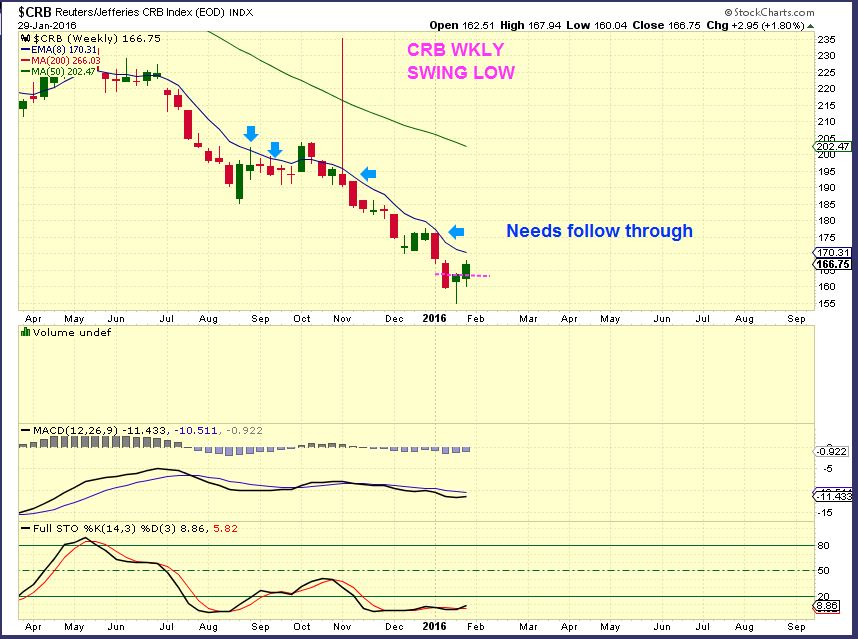
CRB – The CRB has a weekly swing low and this could be an ICL. The commodities have been sold off relentlessly. The CRB moves in harmony with OIL, and we have a low in Oil ( Final low or temporary remains to be seen).
So Lets look at a few Commodity ,Oil, & Energy stocks to see if we see some bullish action.
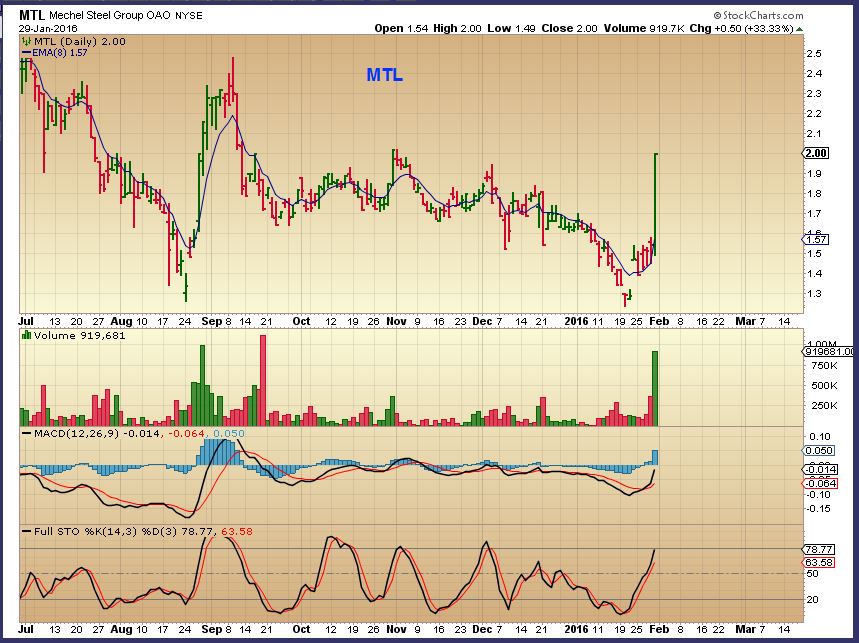
MTL – Steel
CENX – Aluminum
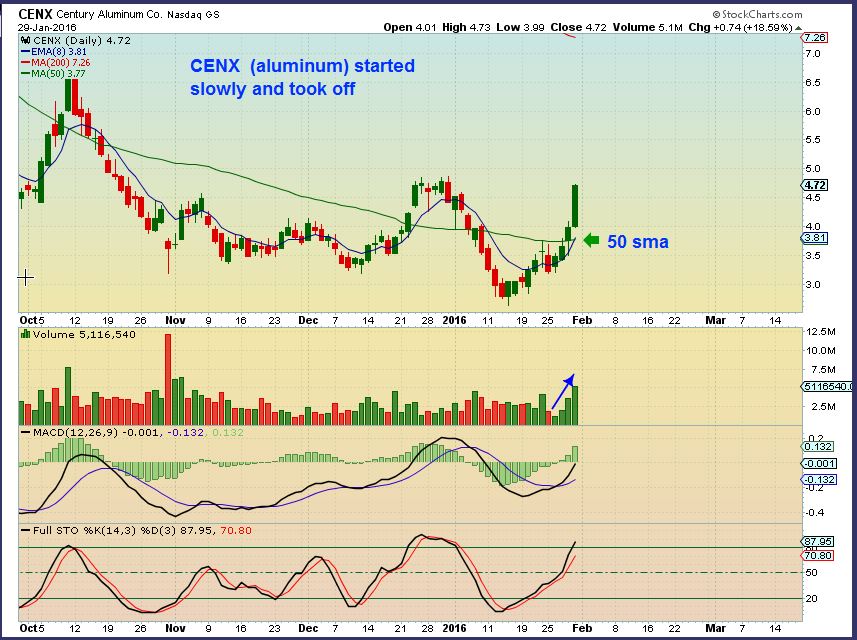
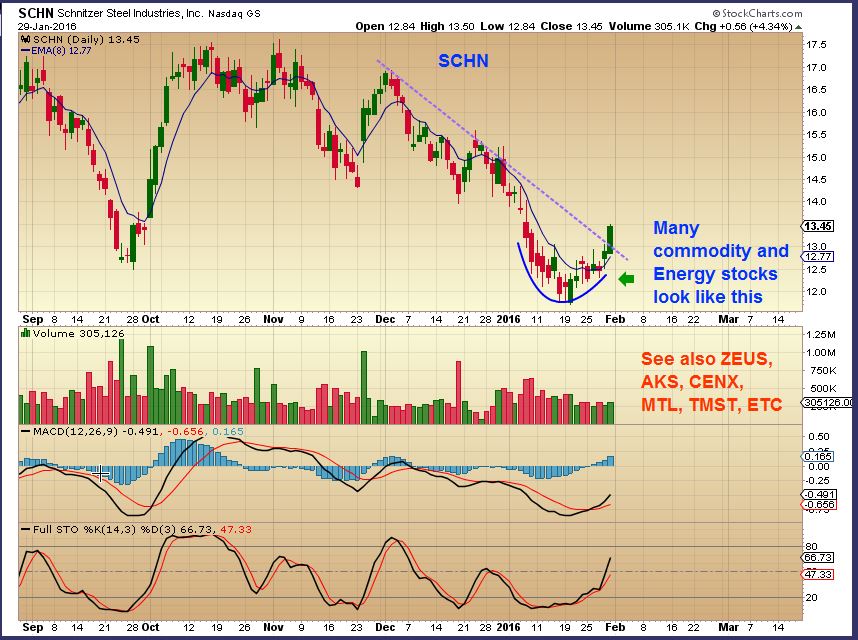
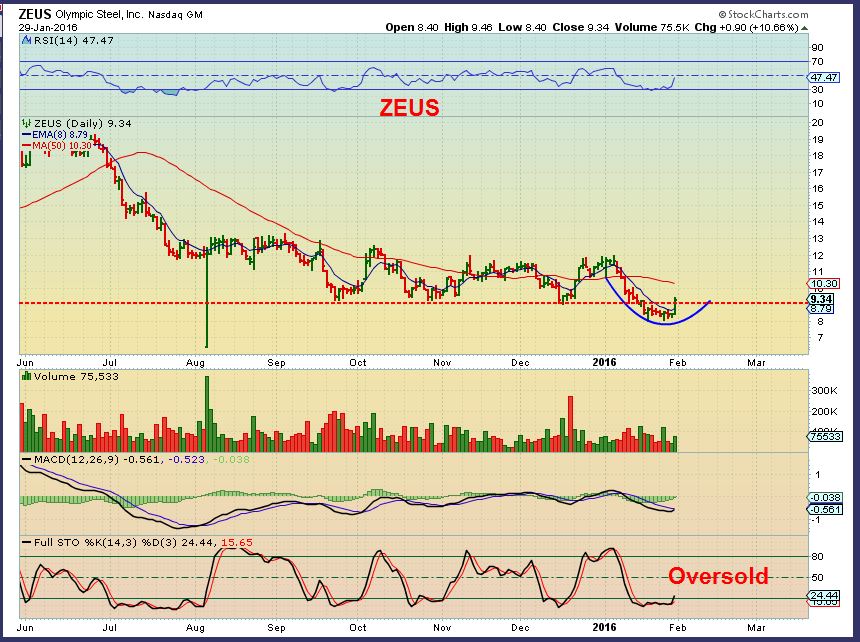
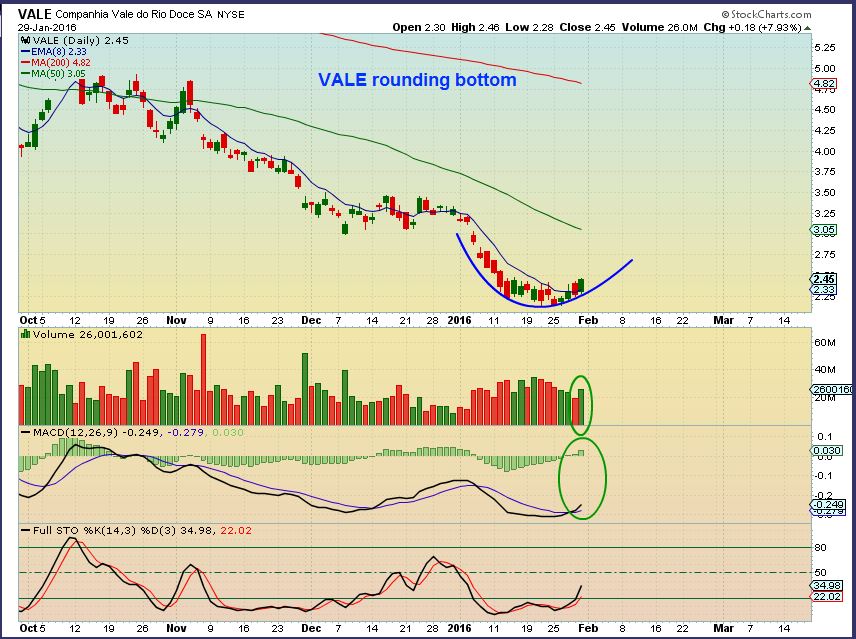
So we have SCHN, VALE, AKS, X, FCX, ZEUS that we can see may be low risk buys, with stops closely below .
Lets look at OIL / ENERGY stocks. You will see that some have already taken off upside and others have very similar set ups to what they had before moving higher. As long as oil stabilizes or continues higher, these stocks are gaining 20%+ in a day. THEY CAN LOSE THAT MUCH TOO on an off day, so please – Know your trading experience / talent. At lows, these may just be for ‘ traders’. Use stops, and maybe only trade these if you can be in front of the screen. Start small in position size. Remember that bad news , earnings release can drop them pretty quickly.
Now with that out of the way…
HAL – Popular Energy companys may start getting some buying attention. This could be bought with a stop below $30. I expect it to run higher, but it can always back test the recent break out. See also the names on the chart.
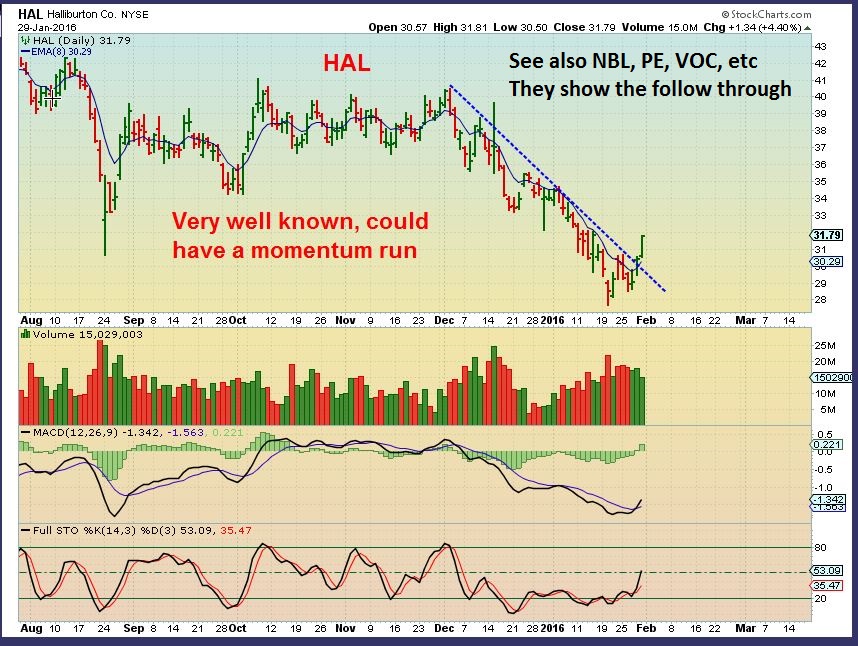
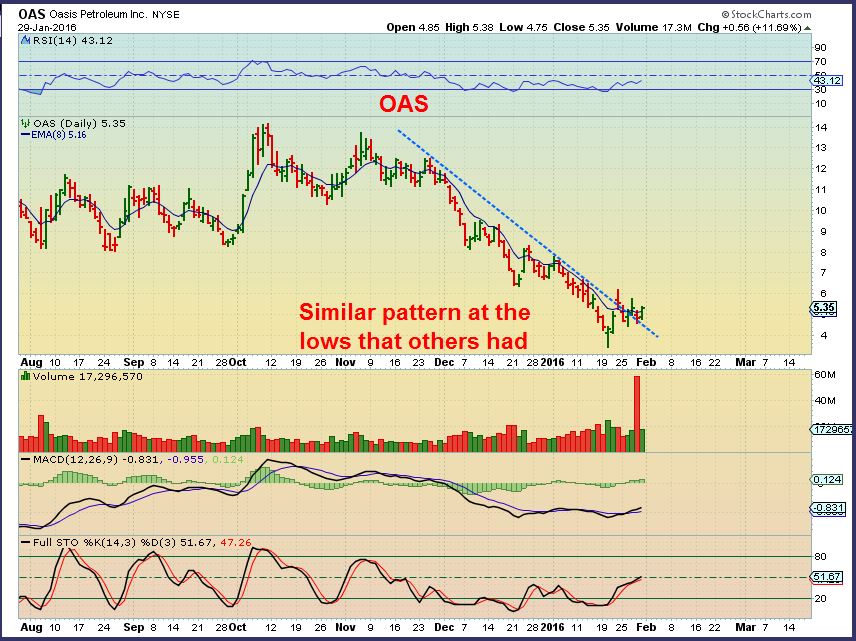
NOTE: Notice the pattern at the lows on HAL chart above. 1. A push higher off of the lows 2. a dip down to a higher low 3. Then a run higher. Then notice that that pattern is in many Oil stocks now.
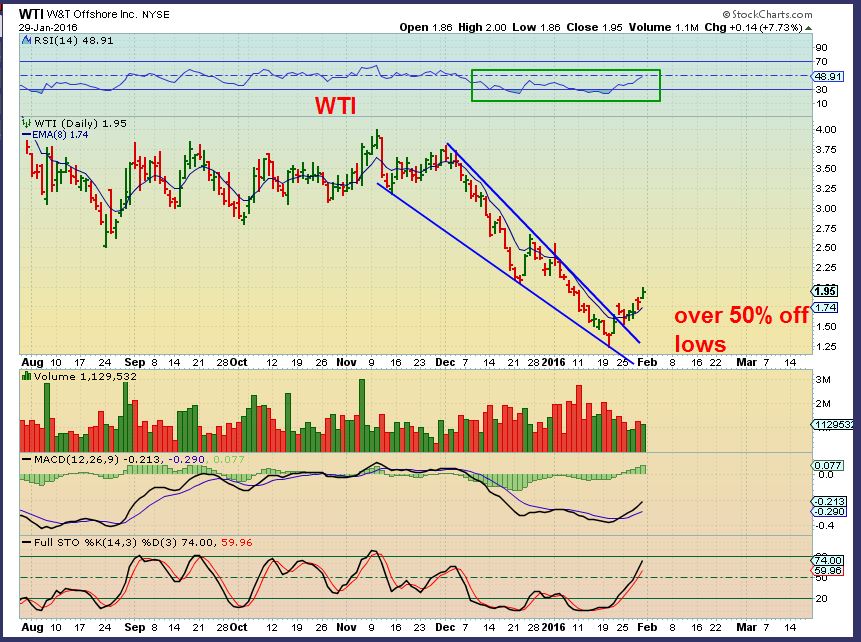
WTI had that bottom. This can run a lot higher.
OAS – has that same bottom pattern and looks like a buy right here
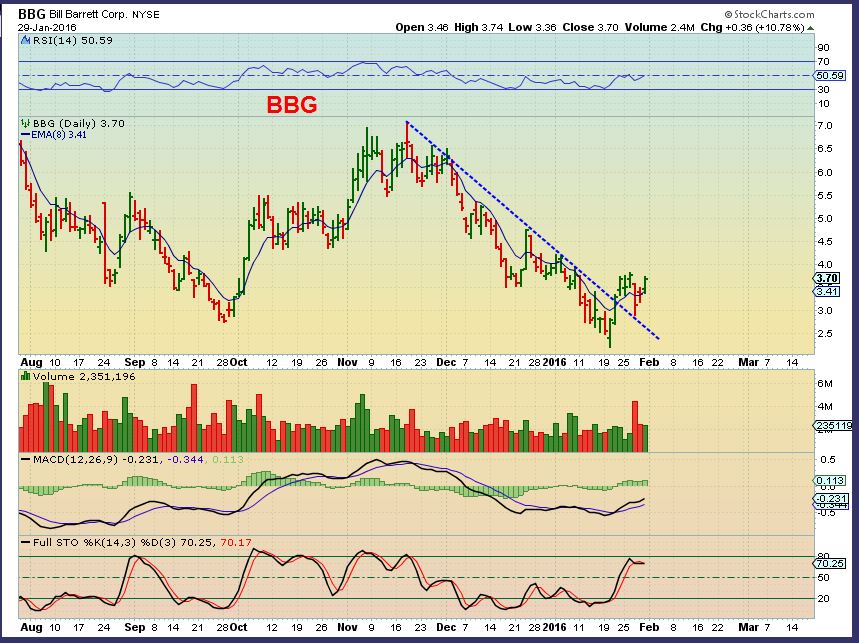
BBG – Has the same bottom pattern with a higher low. A buy on the dip to the trend line (back test) but also could be bought right here , since the potential upside is big.
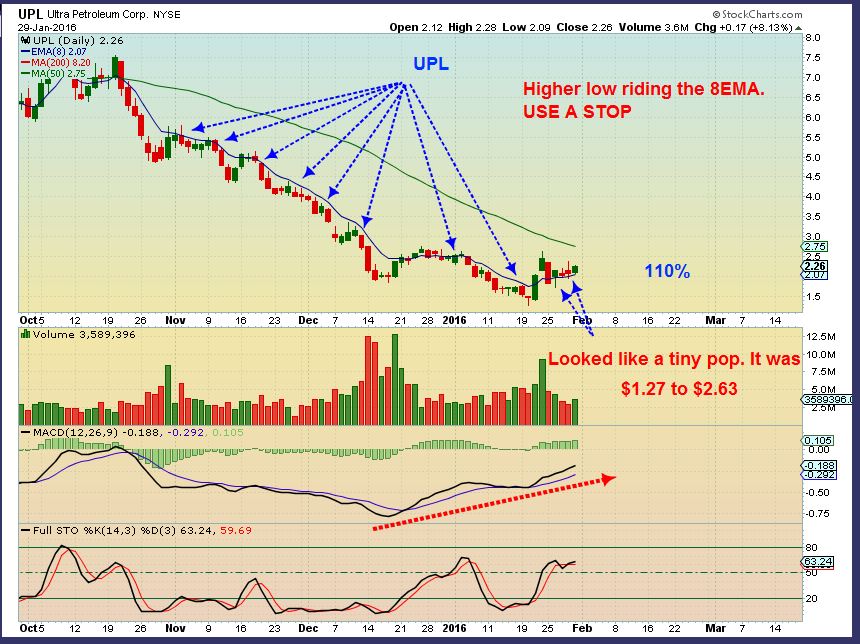
UPL – Similar bottom with a higher low. I wanted to pint out why it shows strength. It finally got above the 8 ema and rests on top of it. Do you see the price on the right? If this formed a cup, it would be at $6 or $7 in 2 months.
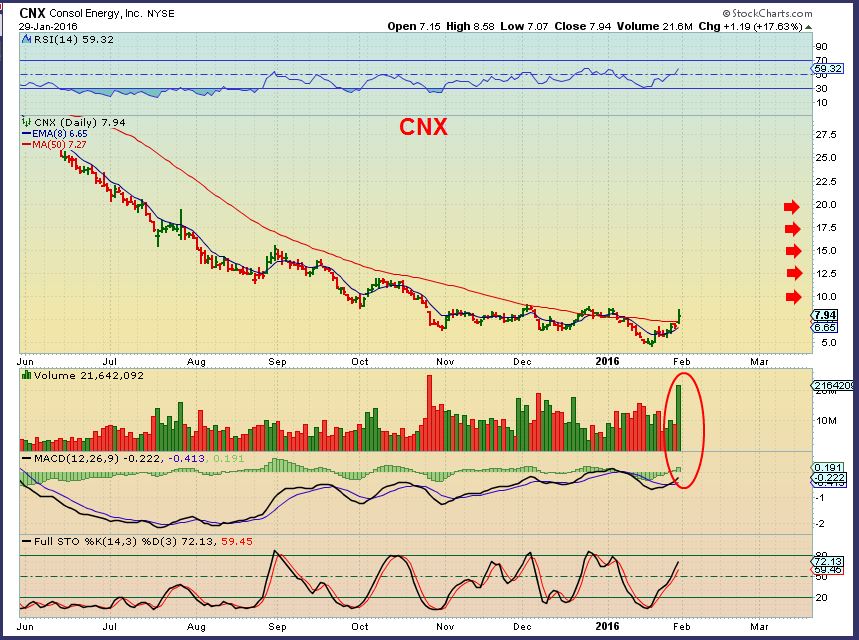
CNX – See the bottom here? It was the same higher low formation 1 week ago. Then it surged higher with Oil moving higher. Check out the big picture on this one ( 2nd chart).
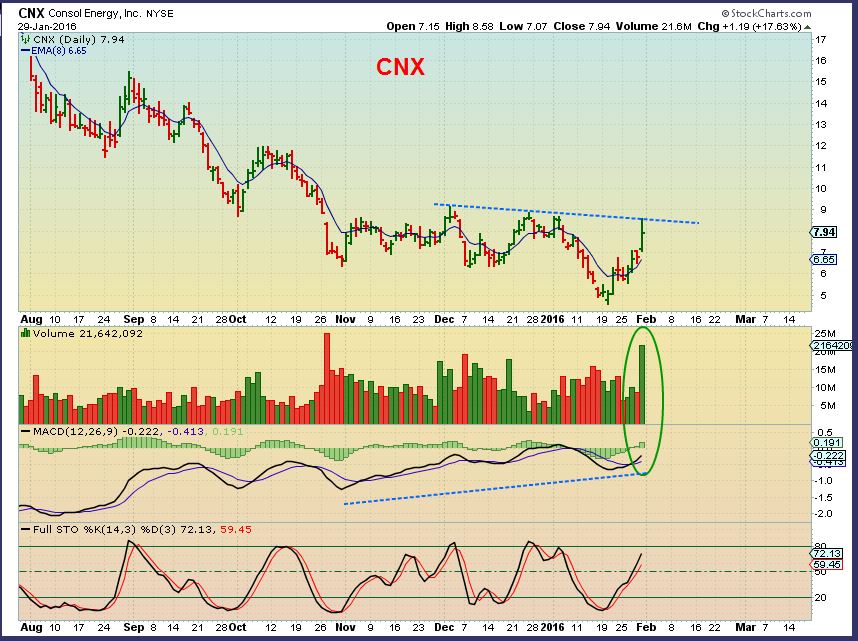
CNX 2
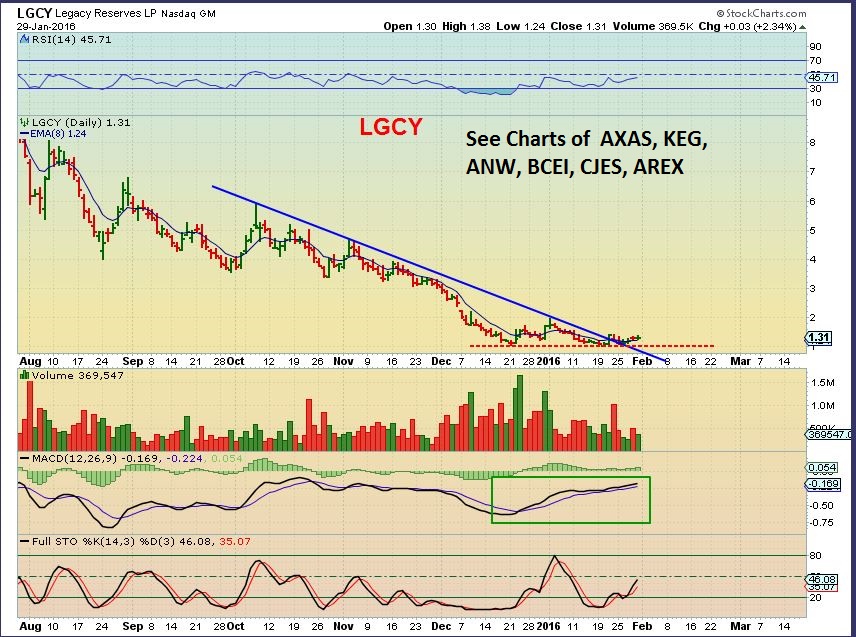
LGCY – Double bottom with strong MACD divergence? Could be bought with a stop below lows. The sell off was swift since last summer. The recovery could be too if the CRB & OIL have bottomed.
DQ – DQ just ran from $11.50 to $15.50, but here it looks like it has so much more room to run.
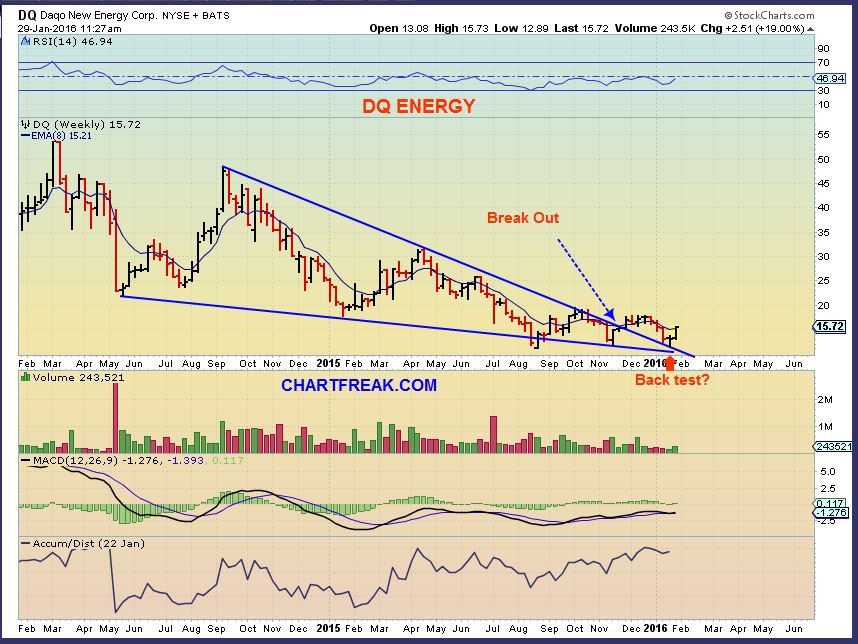
If oil recovers to $50, $60, $70, you can see the potential that some of these trades could have. At this point, they are risky, so USE STOPS, small positions, be safe.
.
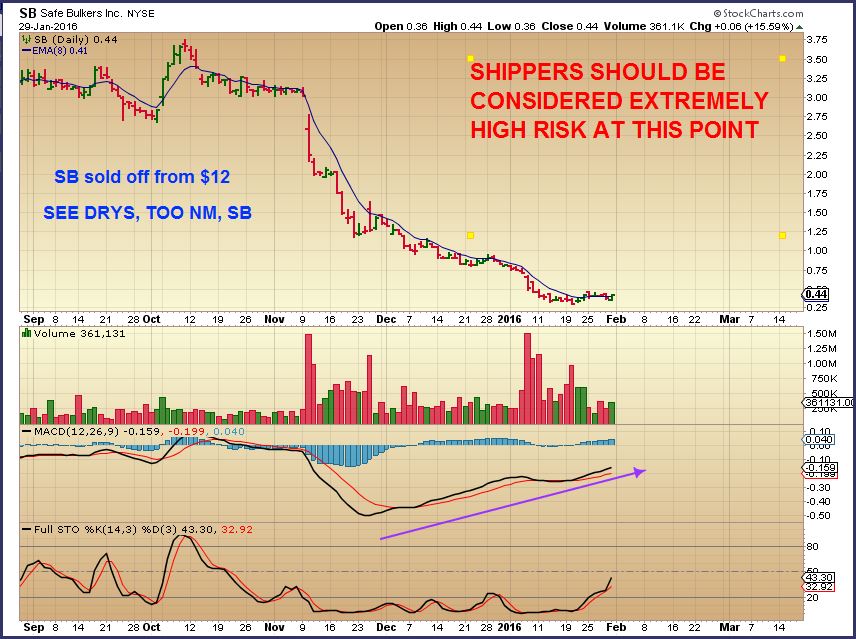
I have been mentioning SOLAR STOCKS looking good and SHIPPERS are interesting too. Both are a bot too risky for me to mention here now, but if you want to see the charts, you can look up 1 yr charts of (SOLAR) SCTY, FSLR, JKS, JASO, SOL, TSL, CSIQ. And SHIPPERS – DRYS, SB, NM, SHIP, TNK, NAT, ETC
.
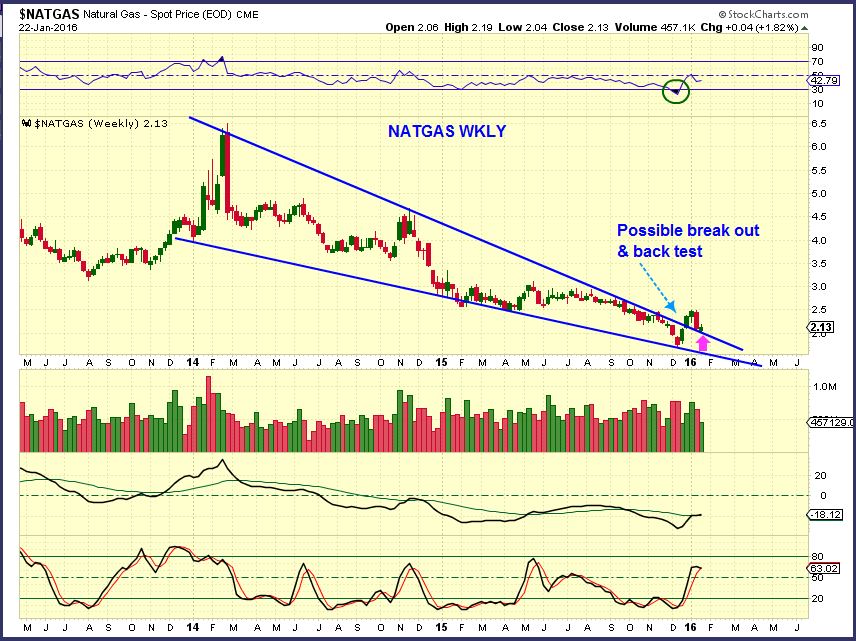
NATGAS REMINDER CHART FROM JAN 22
.
.
LETS GO BACK TO GOLD, MINERS
.
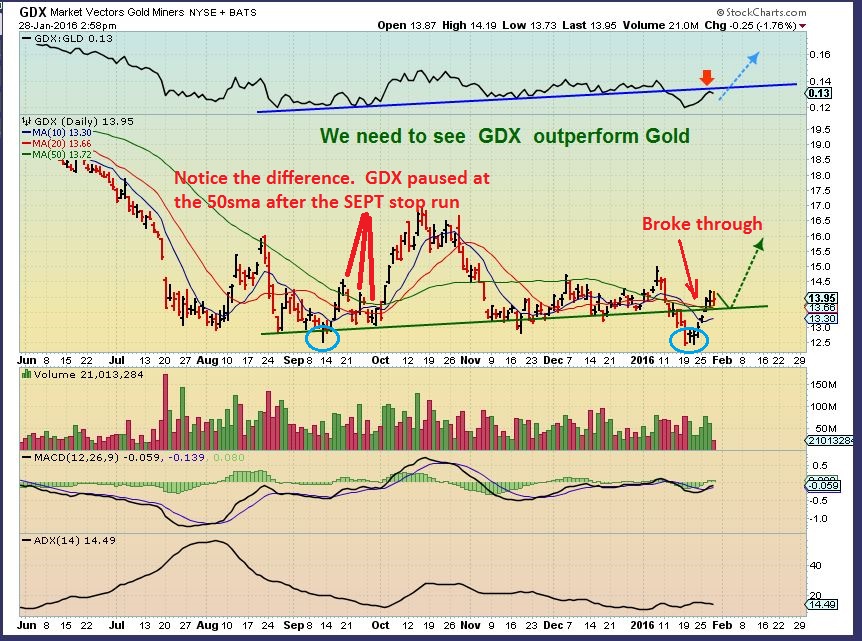
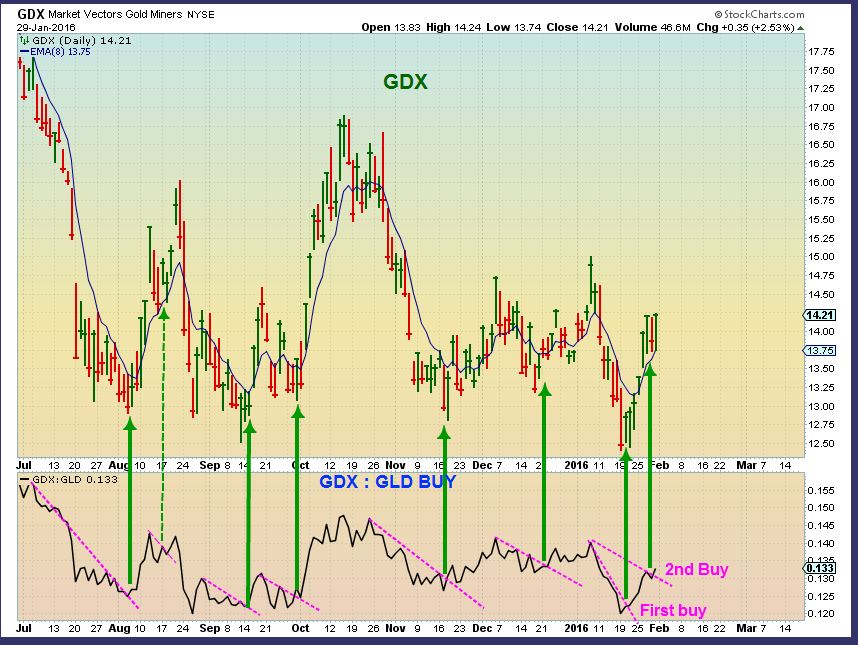
Looking at GDX, I am being asked , ” Will it continue higher or pullback?” Honestly I cannot tell for sure. I think it will do what Gold does Monday. Clues could also be in ABX, NEM, GG
NEM could break out soon on a wkly chart. The set up is bullish, so GDX could go higher , but…
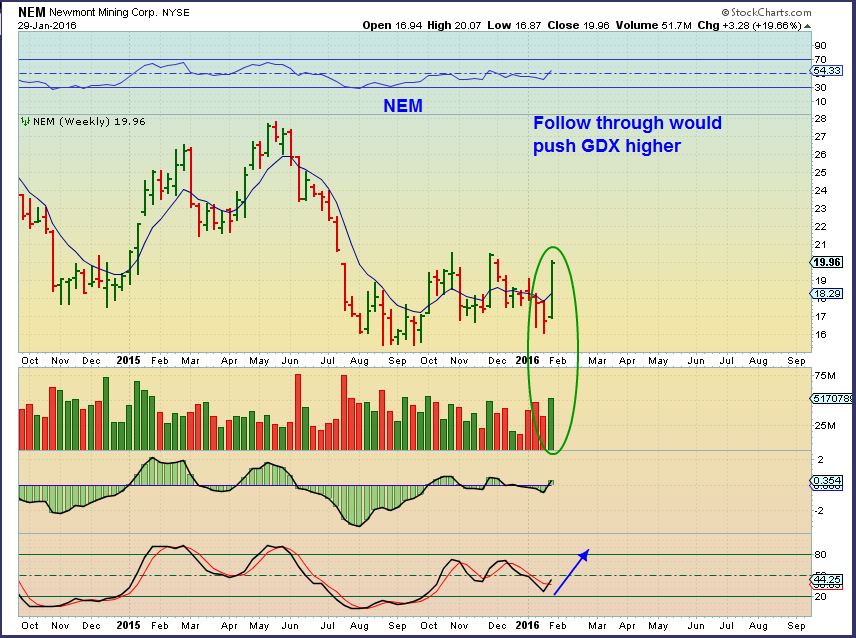
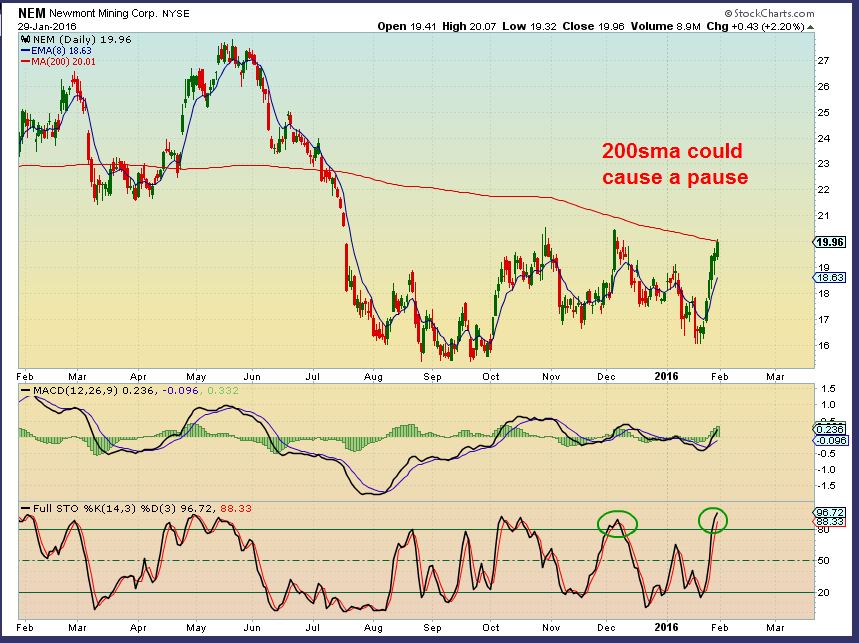
NEM – It is also overbought and at a resistance point (The 200sma) on the daily. GDX could pause. Does the 200sma have to stop it?
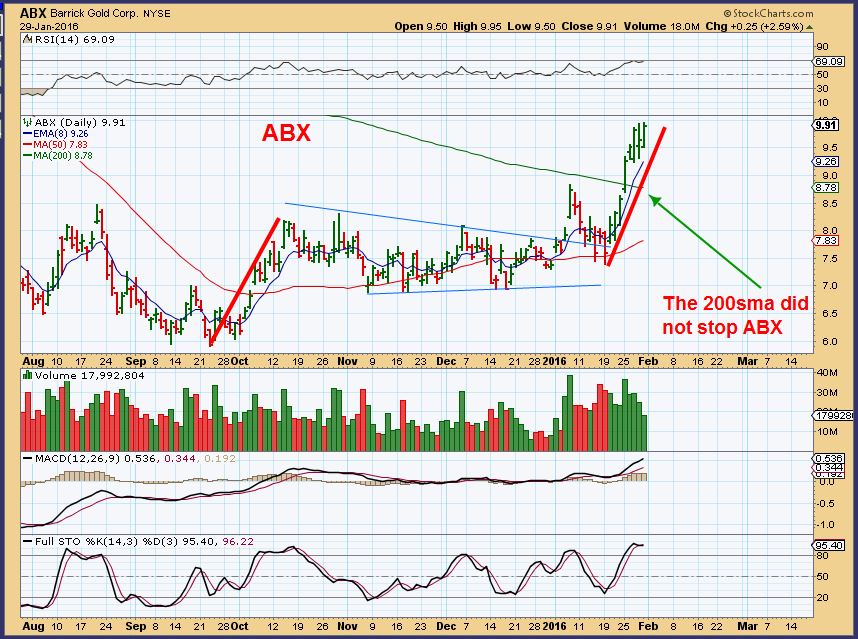
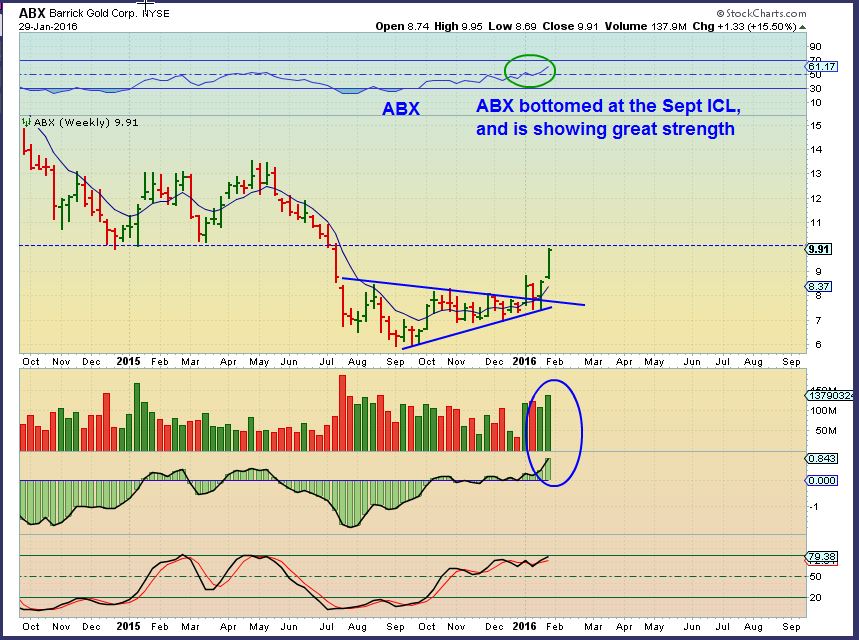
ABX- The 200sma did NOT stop ABX. ABX does look like it will pause or pull back now, however.
ABX WKLY – Also shows a possible pause at resistance. This could help to stall GDX.
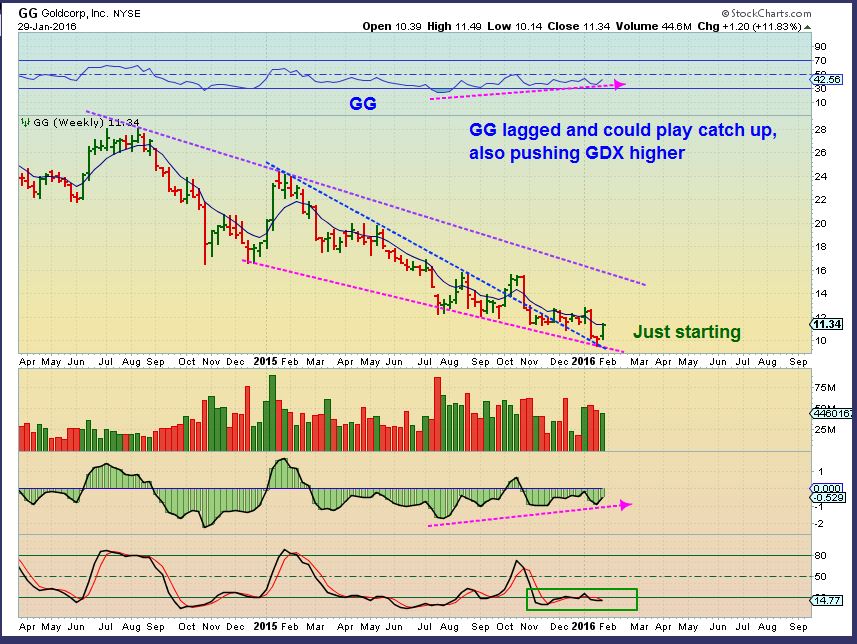
GG – GG was lagging and looks like it could actually play catch up. That would help GDX. If so , we may see a pause in ABX, NEM, at least holding GDX above the 50sma. Thats a Maybe 🙂
.
Lets take a look at a couple of other Miners that have a bullish look to them. Silver looks like it would like to burst higher this week, as pointed out in the 1st weekend report.
.
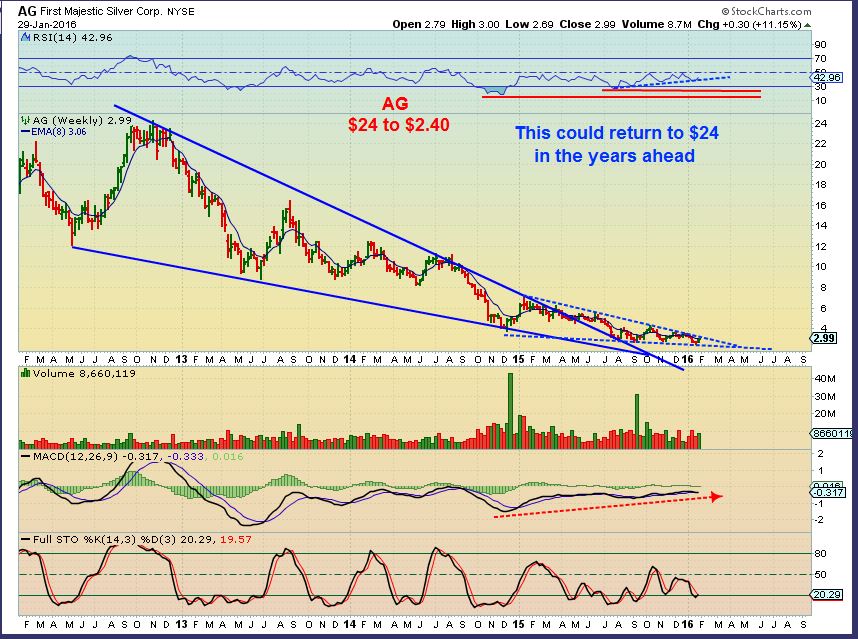
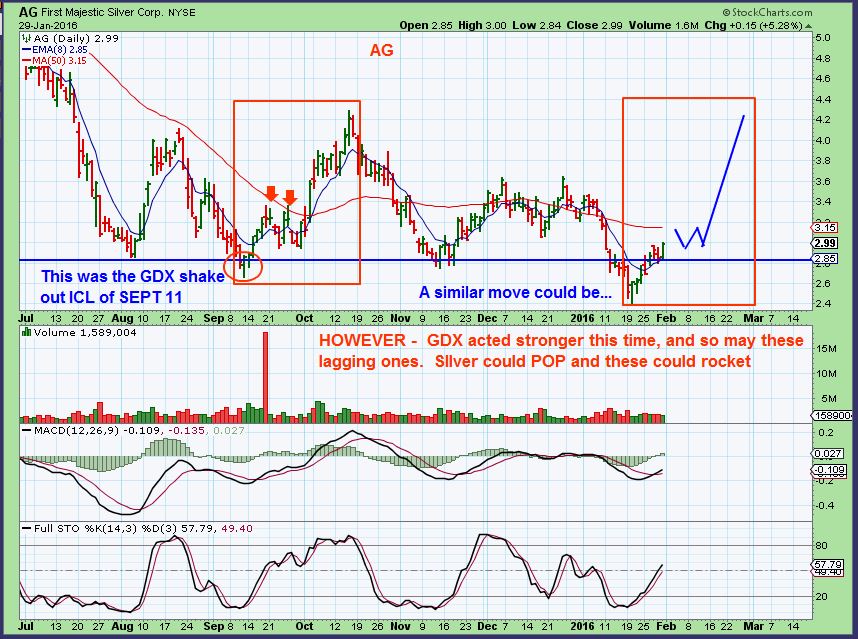
AG WKLY – This looks close to breaking out, with huge upside over time when the final lows are in.
Notice that GDX couldnt break above the 50sma after the SEPT stop run, but it broke right through this time.
AG DAILY – Since GDX was NOT stopped at the 50sma on this run , maybe AG will not be stopped here either.
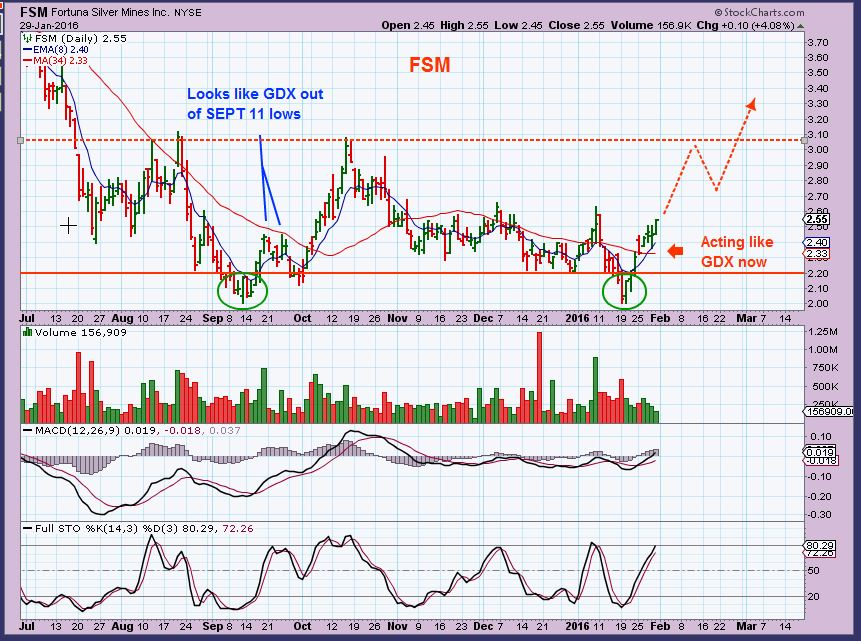
FSM – FSM was stopped at the 50sma last Sept, but not this time, so we are seeing more follow through in Miners this time.
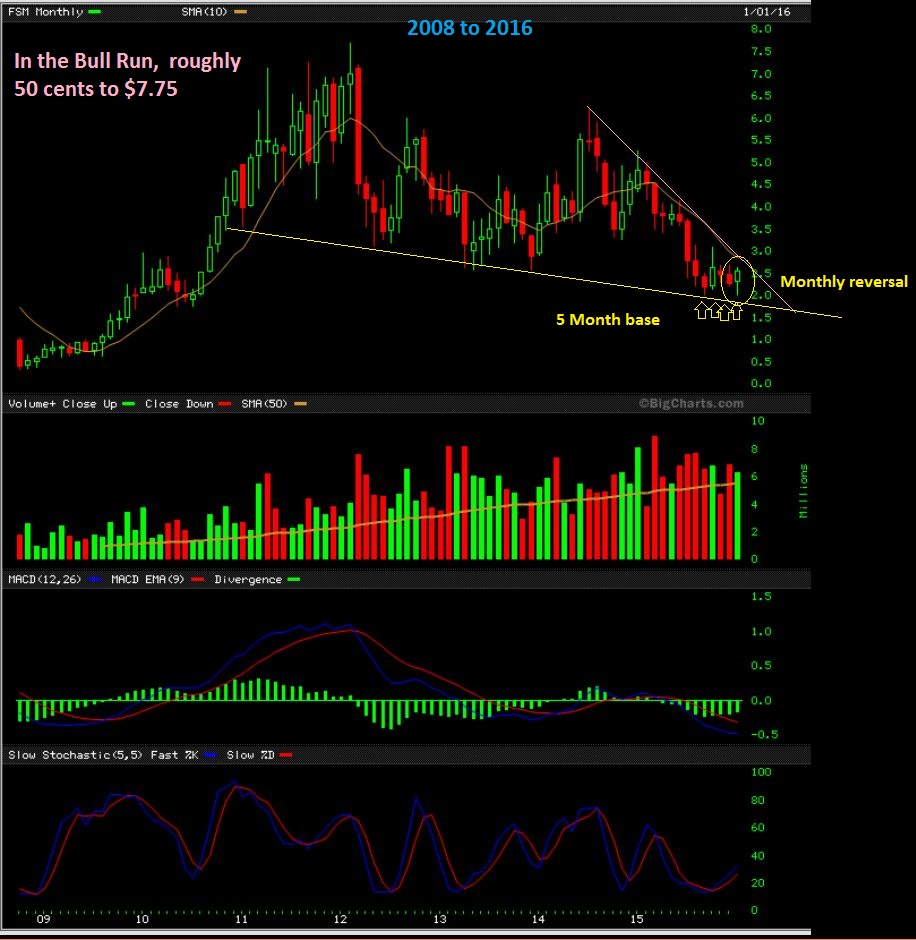
FSM MONTHLY – The Monthly chart has a reversal candle at lows and remains oversold.
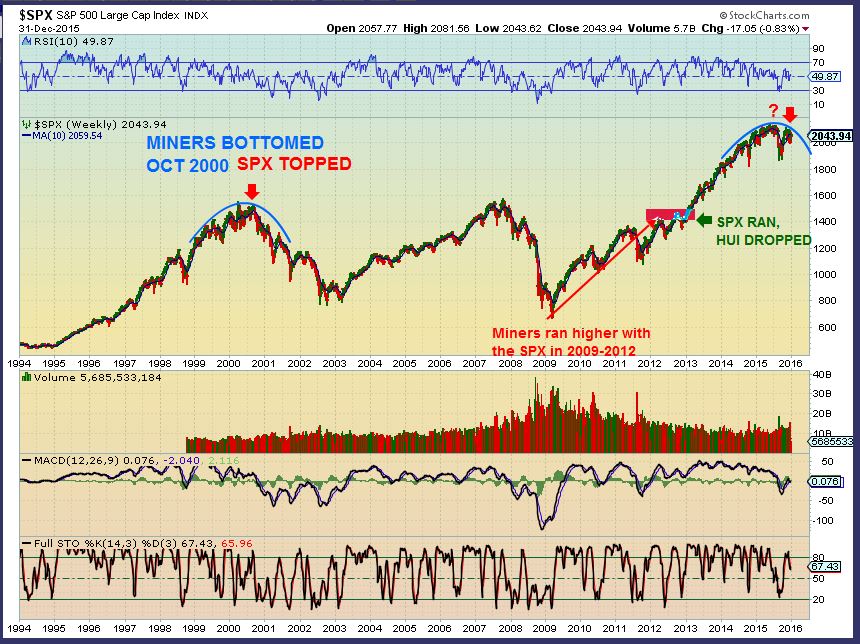
I want to point out again, what I pointed out coming into 2016. When the Stock Market topped in 2000, Miners Bottomed. We then saw a rapid sell off through almost all of January, and Miners were perking up. The Stock Market now looks even much more like 2000 after January.
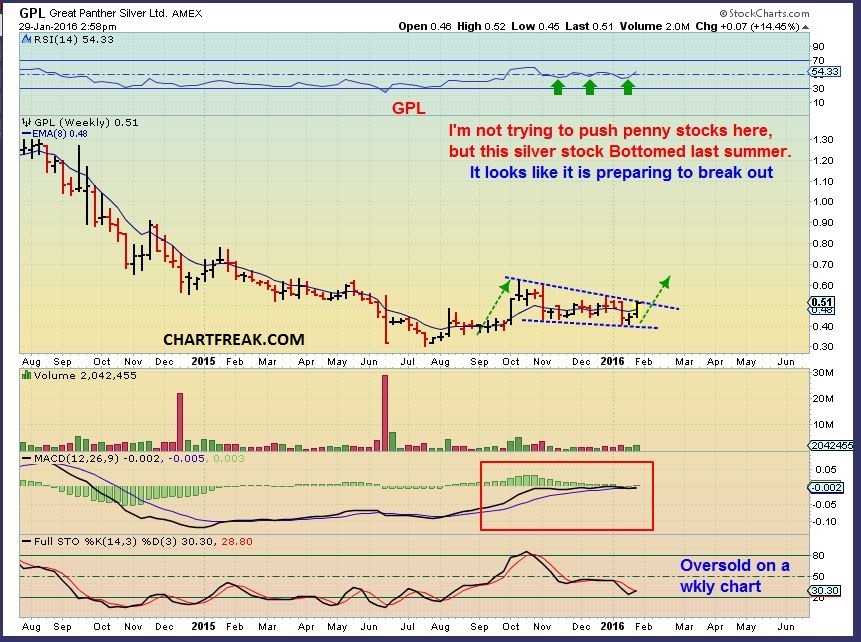
GPL – This is another Junior Silver Minor that looked bullish , while Silver broke to new lows in December. It bottomed in the summer of 2015 and looks close to a break out here.
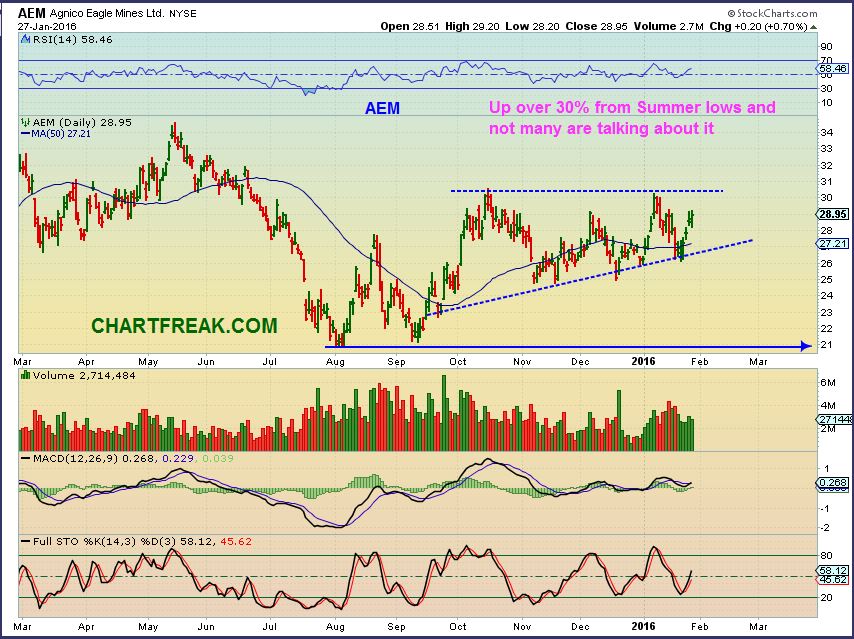
AEM – This was Wednesday. AEM almost hit $30 Friday and is close to a major break out too in my opinion. I was pointing out in this chart Wednesday that it bottomed last summer. Many stocks bottomed last summer and the Bears are not noticing. If they continue to short the move higher, it adds fuel to the fire.
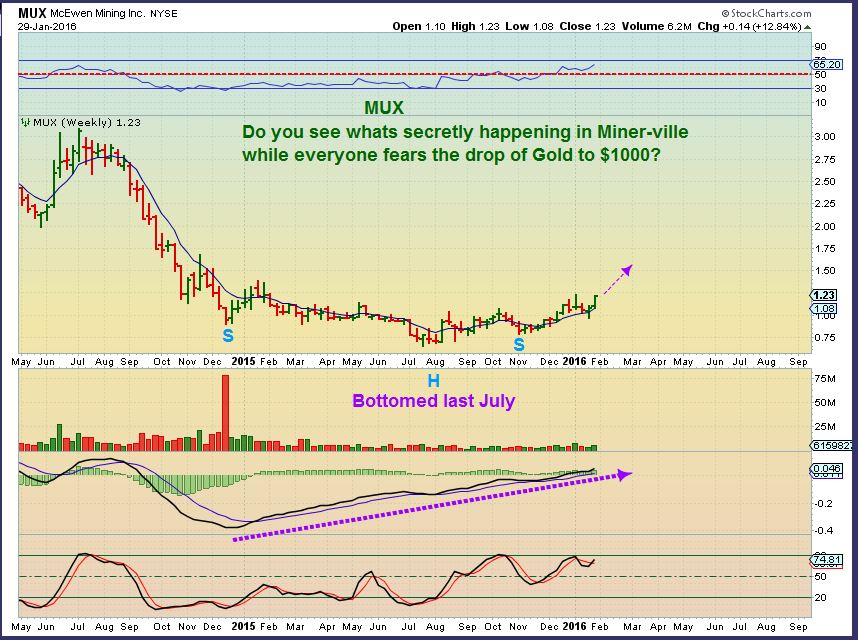
MUX WKLY- Another junior mining stock that has almost doubled and formed a very bullish base while Gold broke to new lows in December 2015
.
So the point that I am trying to make is to emphasize again what I have been saying since last summer… MINERS bottomed in late 2000 and Gold bottomed in early 2001. While Gold just dropped to new lows in December , Many miners bottomed already ( And GDX GDXJ did a stop run). Others are putting in bases that look like bottoms.
.
It is now difficult for me to find good ” Low risk entry points’ or ‘Miners set up to buy’, because the buy was in last weeks weekend report with that shake out in both GDX & GDXJ. Many Miners have run higher. There are no guarantees of immediate higher prices, unless you find a lagger that looks set up to run. The good news is that it’s early in the daily cycle, and any pullback should have more upside to follow. IF I was on the sidelines, I’d take a small position in something above the 50sma and buy more on any pullbacks when we get them. This is the 1st daily cycle of an ICL in Miners. Upside could be good for weeks.
GDX : GLD The sideways move in GDX at the 50sma gave a possible 2nd buy last week with a stop under the 50sma for traders.
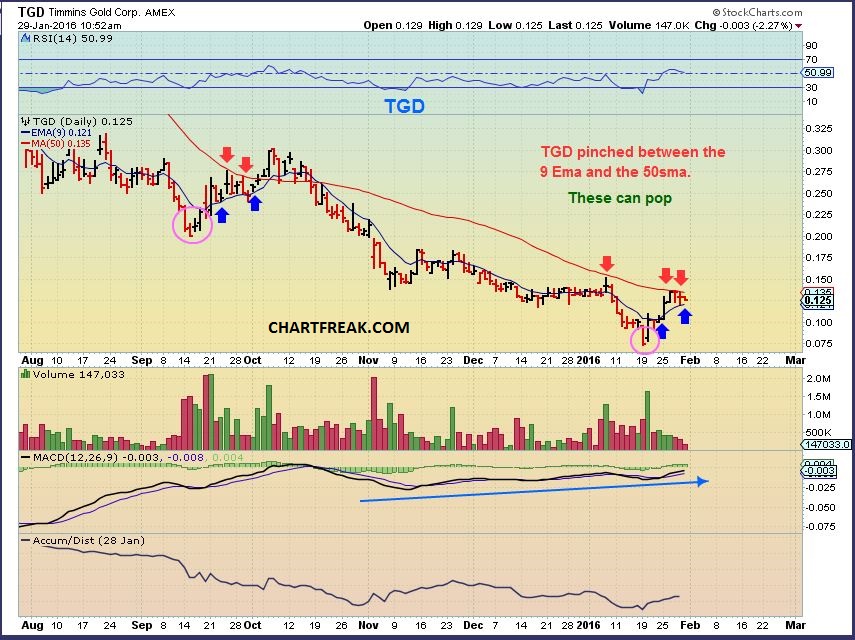
Again, I’m not pushing penny stocks, but this stock is squeezing in an interesting way. I think that it will POP further, but a company this cheap could be financially ‘iffy’ until Golds price rises, so I am just pointing this out.
TGD – See how it is pinched between the moving averages for days? It almost doubled in the last 2 weeks. I’m not saying to buy this, but why not watch it and see how it plays out?
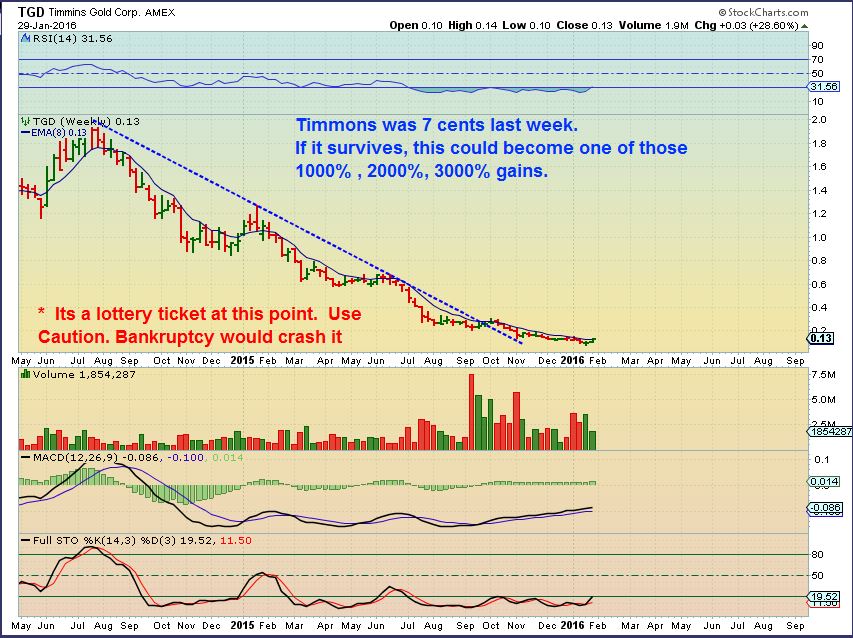
TGD – The weekly chart is compelling.
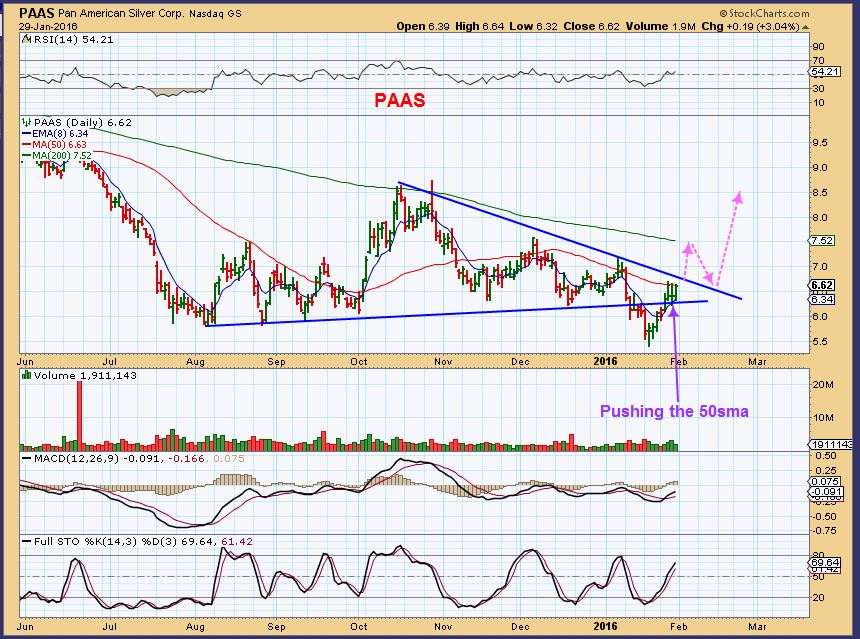
PAAS – No way of knowing how it will play out ( This is just a guess), but PAAS is pushing on the 50 sma after a shake out type sell off.
 SO that is it for now. I just wanted to add a 2nd part to the weekend report, showing some possible trade ideas and really emphasizing that what we are seeing in Miners could be adding another bullish confirmation to the Big Picture Scenario mentioned here since last Spring really. A character change in the markets that could be hugely profitable as 2016 goes on. Thanks for being here at Chartfreak and happy trading!
.


WHAAAAT?? 50 charts? lmao
No football this weekend?
.. im laughing so hard right now… ahhhh .. that felt good… back to work 😉
looking forward 2 reading… ;o)
We can expect 2 charts next Monday?
LOL – Exactly… The Superbowl will produce a famine in chartfreak land.
I’ll try to get it done before then 🙂
CF, looks to me that SA is lagging and could be starting a move higher. Might be a good starter if someone is looking to enter miners.
SA is pushing against the 50sma. If it breaks above that again, I also think it will draw in more buyers (Nothing wrong with getting in early).
Also BTG was lack luster, but may be starting higher too.
BTG is up 8 % all of a sudden . nice.
I was worried that MUX might have a double top and then a pullback, but with Today’s action pushing to a higher high, we probably have a AB=CD move which could run it much higher
I like the look of MUX a lot. Mux had 500,000 volume in the 1st 15 minutes. CHeck that out on a chart . It has had 1 to 1.5 million total all day. I think it is breaking out .
Also, they already had earnings Jan 16, and it looked pretty good for current conditions.
.
http://www.marketwatch.com/story/mcewen-mining-reports-record-production-in-2015-q4-production-results-and-2016-outlook-2016-01-13?siteid=bigcharts&dist=bigcharts
Hmm, ABX and AEM are right at resistance now. Good time to take some profits and hope for a dip?
Nothing wrong with taking some profits if your position is large, but the way things look , Miners may just go sideways art resistance levels and then burst higher. We are in the first daily cycle , and I do expect higher prices, so it depends on your trading plan.
Just a trade? Want to hold some until 2nd daily cycle peaks? Sell and add lower if possible? Sell partial and try that?
I’ve been doing a little of both with Energy , but mostly I added at the Shake out lows in Miners and havent sold, because GDX broke above the 50sma on its first try and held there for a few days.
Thanks, CF. I love that you include commentary on how to trade the charts. I’m a decent chartist but still struggle with executing trades even when the charts are correct.
Well, discipline isnt always my strong point. I’ll say , ” I’m going to buy that dip , maybe it;ll test the 50sma.”…Then it keeps going higher, I take a small position, and it dips to the 50sma.
I refused to buy DRD, HMY SBGL until they pulled back good, and they havent : )
It happens 🙂
… I just happen to know someone who would be happy to step up & help u with that discipline problem… meow
I need to install an ignore button in here somewhere… lol
Alex, I saw your weekly chart on Gold, still shows room higher. I’m looking at the daily chart of XAUUSD and we are getting close to the 200dma. The last few times we approached it and made it through just to have it roll over and pullback. Just keep an eye on it. We might not get there until later in the week.
Hi Bill. What is xasusd?
Gold. I see you are talking about my Gold chart.
Thx, I was watching the 200sma on Gold too, but I will say this, as pointed out in the report, GDX is acting stronger than the shake out lows in Sept 2015. It stalled at the 50sma then, broke through this time.
I’m watching to see if Gold acts stronger than the July Lows.
🙂 fingers crossed
SA hot that 200sma, dropped and is heading back up. This can be a way to build steam and break above. Its just really odd how that imaginary line actually isnt so imaginary, huh?
nice closes…at or near highs on individual miners.. 🙂
muxie……. thinks she’s a 3fer… 😉
Refresh, XAUUSD
Hi Alex, Any initial thoughts on OIL. I know you had posted two scenarios in the weekend report. Now that oil is trending lowe, do you see scenario 2 playing out where you expect i to rol over to 26 ? Any initial thoughts ? Trying to figure out what should do with UWTI
Its a tough call at this point . We used that “closing over the 20sma” as a key for confidence.
Today it drifted below the 20 sma now, but Oil itself looks fine. It hasn’t compromised the trend line. The trouble is that you are in a 3x etf. By the time it does look compromised if it is going to, you have a losing position.
.
. refresh for a chart, I drew in todays candle.
.
Thanks, Alex !
Some of near term action may depend on Wed oil inventories. Until/unless production slows it will be really hard for this to turn around. Oil rig count continues to drop and global consumption forecast to eventually pick up later in the year. Entering a seasonal slow period for oil as refineries will be going offline for maintenance and switch back to summer blend. Go back and look at Alex’s weekly chart from 2015 and see how it made first low in winter, bounced and then put in the ICL in April. We could be following that same pattern now, got a DCL for decent trade now and will put in another and final low early spring. As/if we identify ICL, one could feel pretty confident going heavy then for sure.
SLOW PROGRESS, but we do have the break out .
.
Refresh for 2 charts
.
Its frustrating that GDX was trading at $15 when gold was at $1110. Now that gold is at $1128 GDX is only able to make it to $14.63
Is GOLD ready for a rest? Refresh for chart!
I’ve been thinking pog has got to roll next couple of days? then
I plugged in 70 mas for the 100 and compared to 50 for dec.’14 as well as aug.’15? maybe just beginning?
or has sentiment cleared the deck. Nice chart thanks.
Most of the previous highs actually break thru the 200sma before they turn over. I am looking for a break of my Horizontal red line on the RSI then two days in a row where price stalls. Look for tails at the top of the candle. I also previously noted where the RSI climbs a line (like the red arrow on the RSI chart currently). In this case we may just stay overbought for some time.
I think we are similar to July-October 2012 right now. The RSI pattern is similar. Small pullbacks, easy to miss the train.
REN? what? wait? +20%
Thanks alex.
I’m an IC as well as DCL hunter. You’ve been hitting them, and I know how much work you’ve put in, so exceptionally complimented by your experience as well Thanks again.
However, it’s when to sell where I need help 🙂 pretty please. Breakouts today have emboldened my view for this week…