
Lets Just Ignore The Elephant In The Room
So lets just pretend that today is just a Wednesday like any other Wednesday. Things are playing out exactly as expected. To the charts!
.
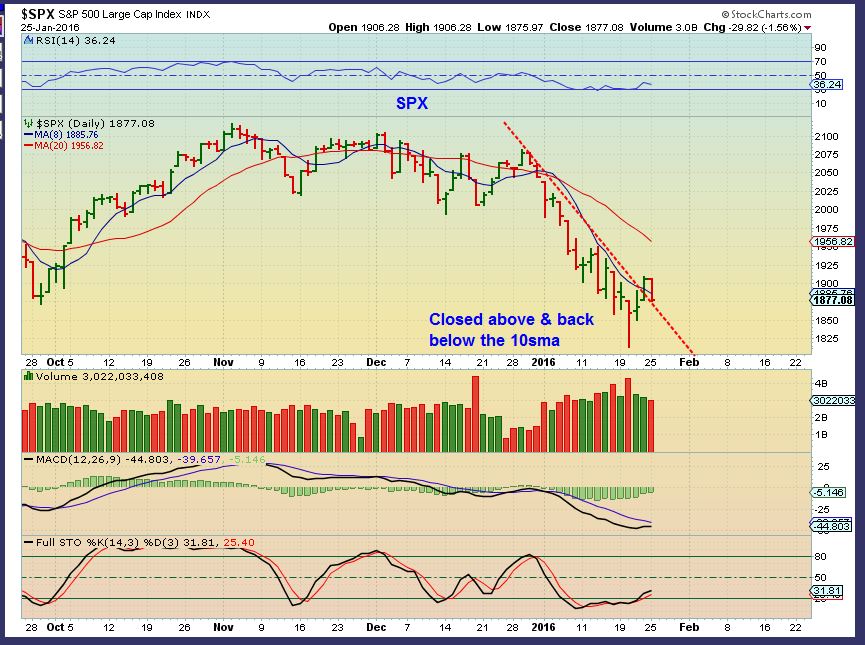
SPX Monday – I called the reversal last week a trade-able low, and the Quick sell off Monday just a back test of the trend line.
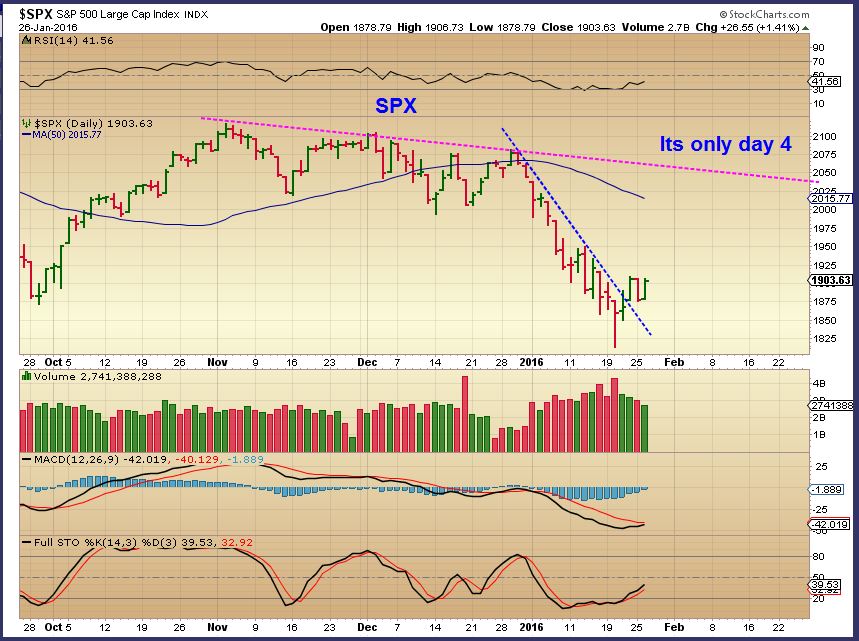
SPX TUESDAY – It’s only day 4 , so I expect this run higher to continue.
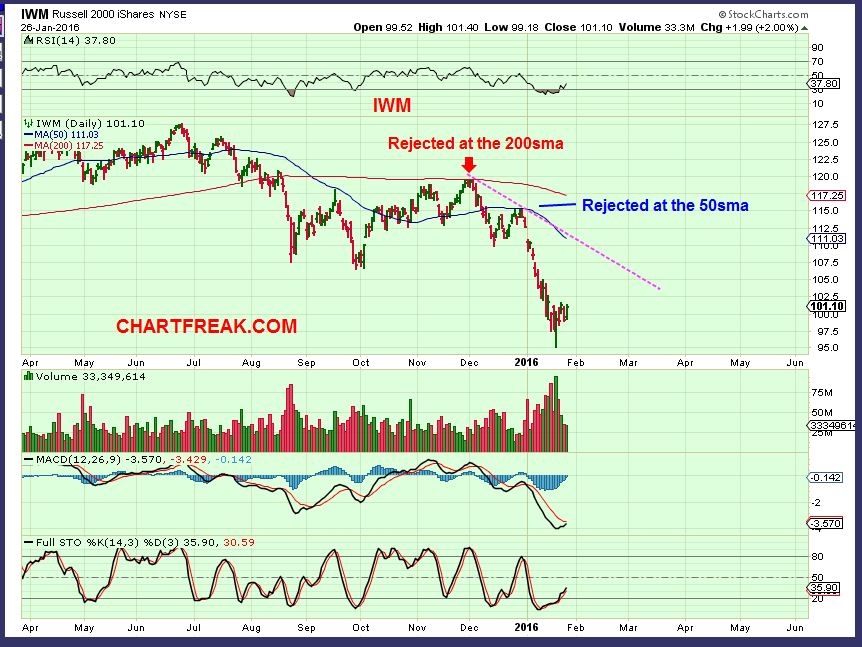
IWM – I’ve discussed this market move higher as probably just a bounce. It can last for weeks, but I believe that the markets will draw in the “Buy the dips” bulls, and then drop again. Time will tell. For now I look at the IWM, TRAN , RUT, BKX, and other areas and cant see this bounce fully recovering. Notice how the IWM never recovered from the summer slam. It went sideways and was rejected at the 200sma, 50sma, etc. THAT could be what we see for the SPX next. The IWM may only recover 1/2 of this last drop.
.
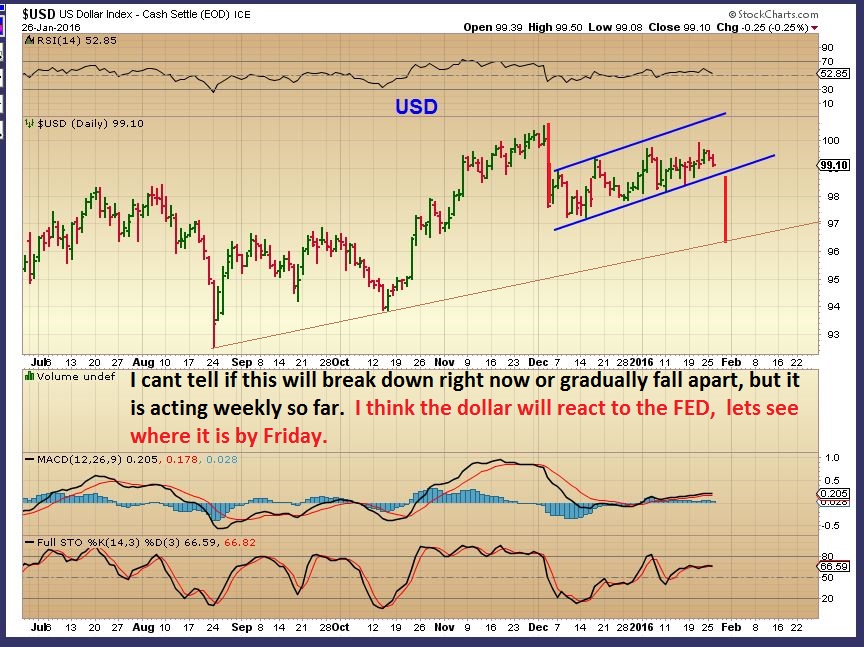
USD – Ok, I cant ignore the Elephant anymore. I think that the dollar will react one way or another to the FED MTG, so we’ll have to see how this looks by Thursday/ Friday. I drew in a drop because the dollar looks weak to me. ( Chart should say ‘weakly’).
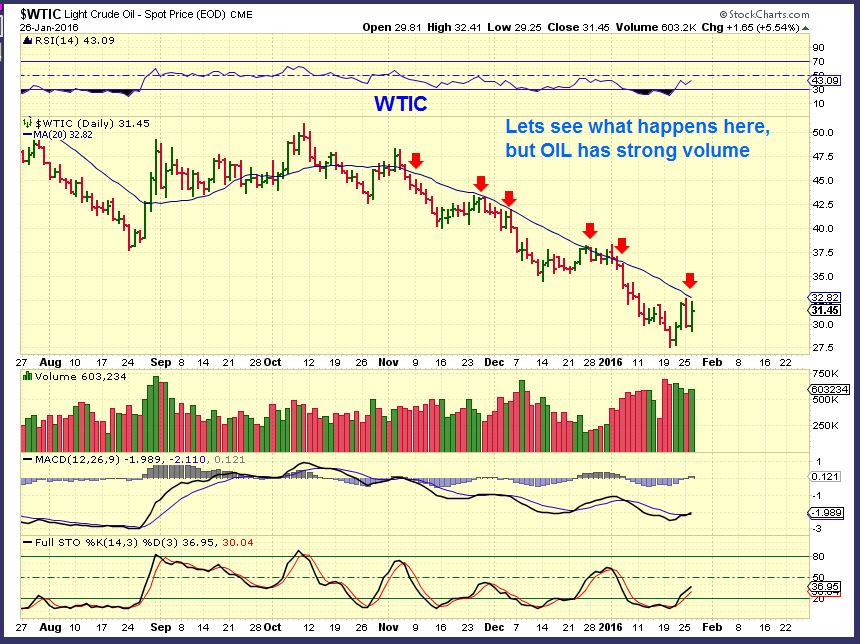
WTIC – Oil was stopped at the 20sma ( Again) . I am looking to see if OIL breaks out higher here, we may have more than a daily cycle low. This may be THE lows and only time will tell. Many beaten OIL stocks will put in some serious gains if Oil continues higher.
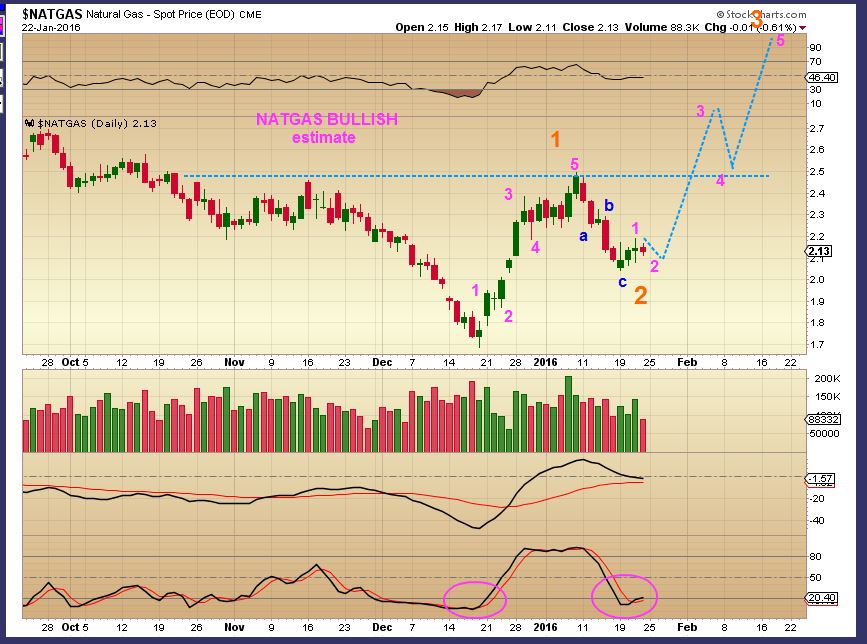
I want to re post my NATGAS chart from the weekend showing higher price possibilities. THIS is still possible, but..
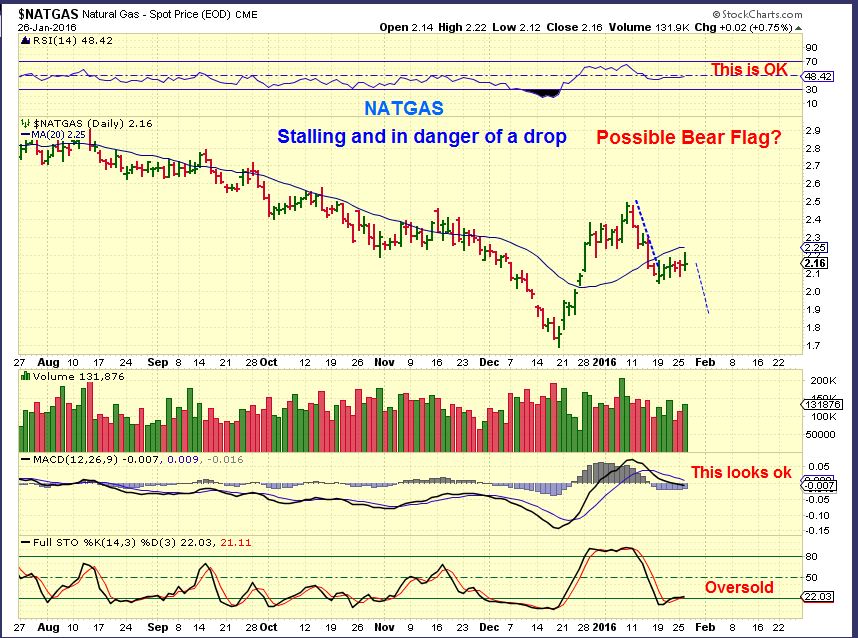
NATGAS – The delay looks like a bear flag, so I want to show this version to add caution. If you trade NATGAS ( UNG, UGAZ, ETC) use stops. The chart looks “O.K.” for the bulls, but we need to move higher soon.
.
Did you notice today that almost everything was looking like it wanted to go higher? The General markets, Oil, and commodities like Gold, Silver, Miners,Copper, etc? I saw set ups in Commodity stocks that looked good too, so I will mention that in here.
Copper – Strong divergence at lower lows.
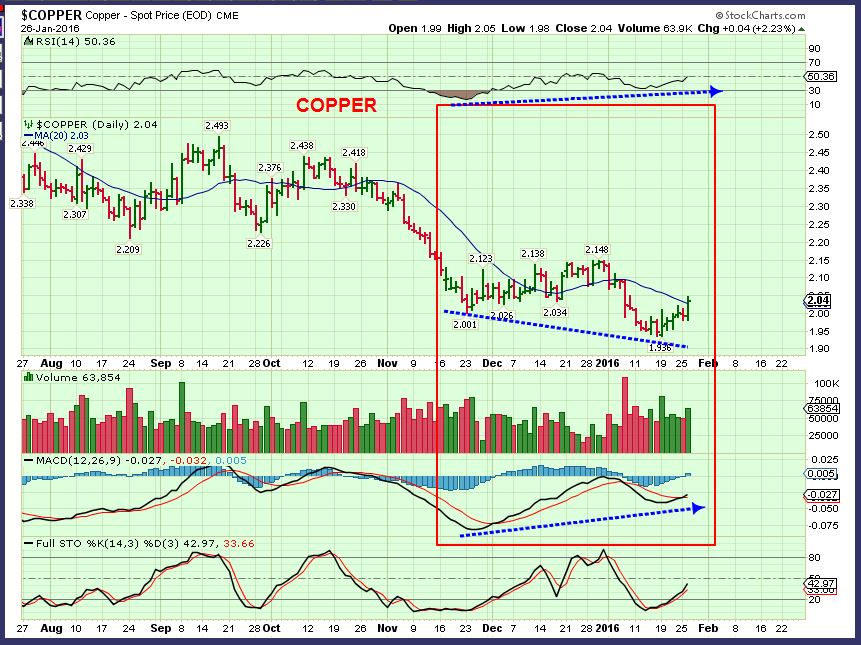
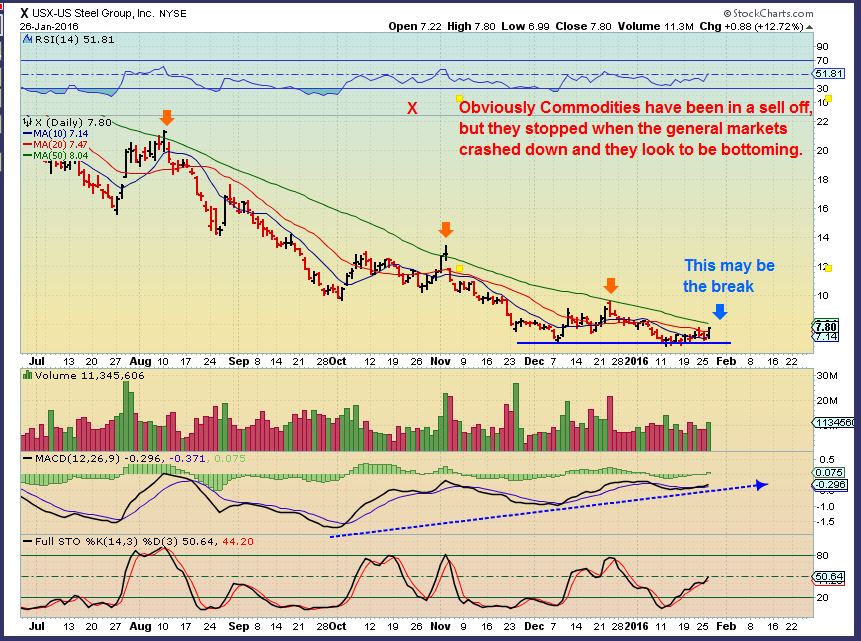
The CRB , along with FCX ( Copper), X, AKS, CENX, AA, etc all may be bottoming. Their charts have various things that give them a bullish look. I’ll be watching these too. Here is an example:
X– Looks like a small move, but it’s up 12% and looks like a bottom. When the markets crashed in January, US STEEL bottomed.
.
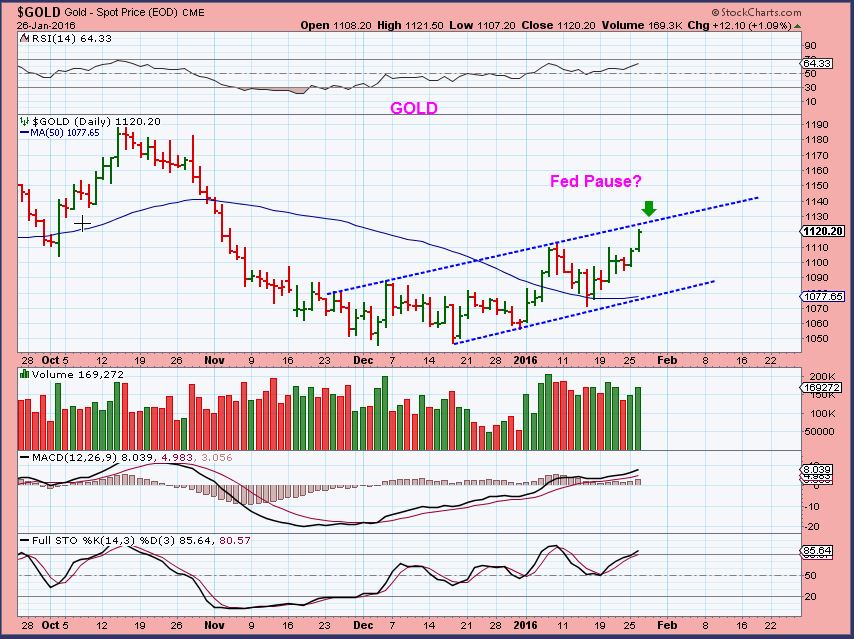
GOLD – I’ve been bullish on Gold for weeks and we are getting our next leg higher. I see a channel when I look at Gold, but we can break out higher if the dollar drops.
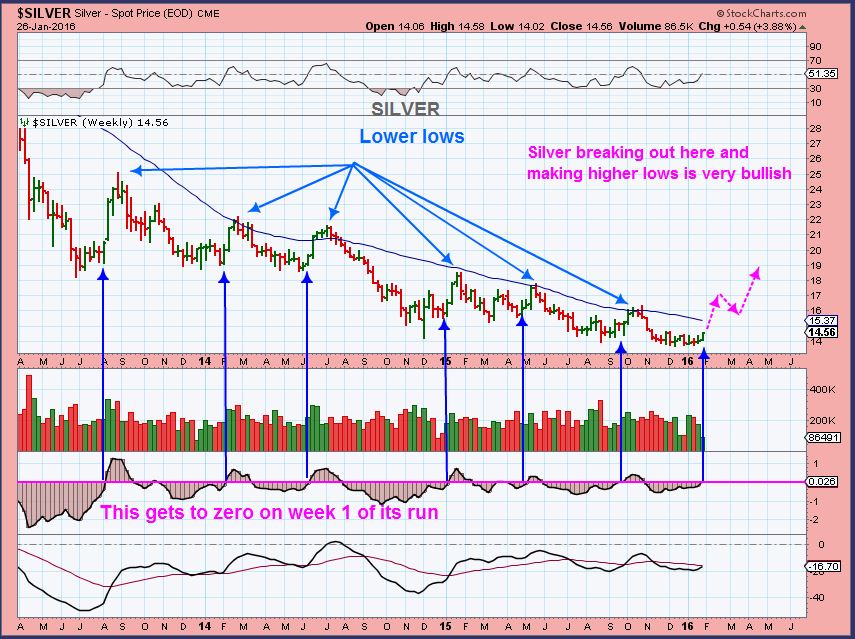
SILVER – Breaking out (Finally).
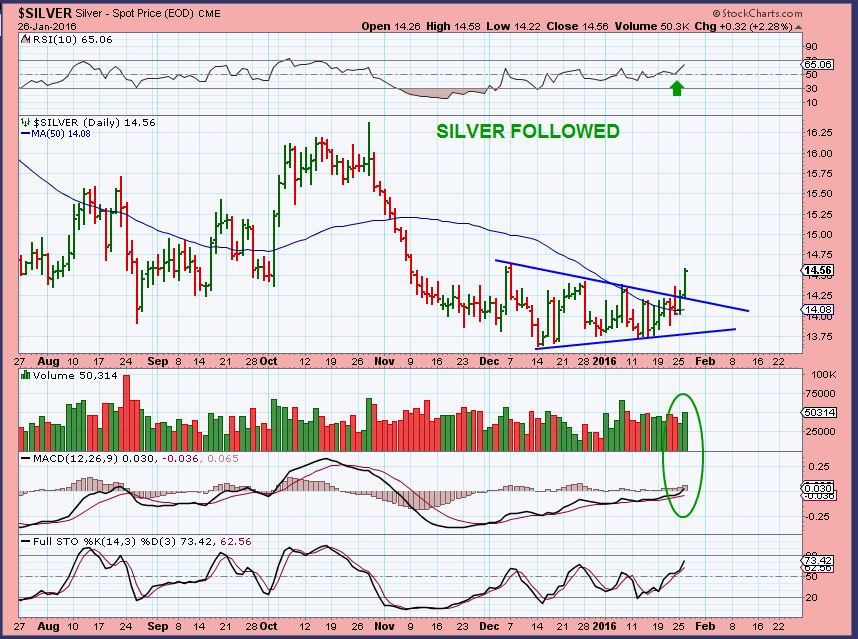
In my weekend report 2 weekends ago and as a reminder on my Jan 20 chart, I pointed out that SILVER goes sideways while Gold runs higher lately. The indicator reaches the zero line right before it pops. It was reaching the zero line, so we should expect a POP in Silver.
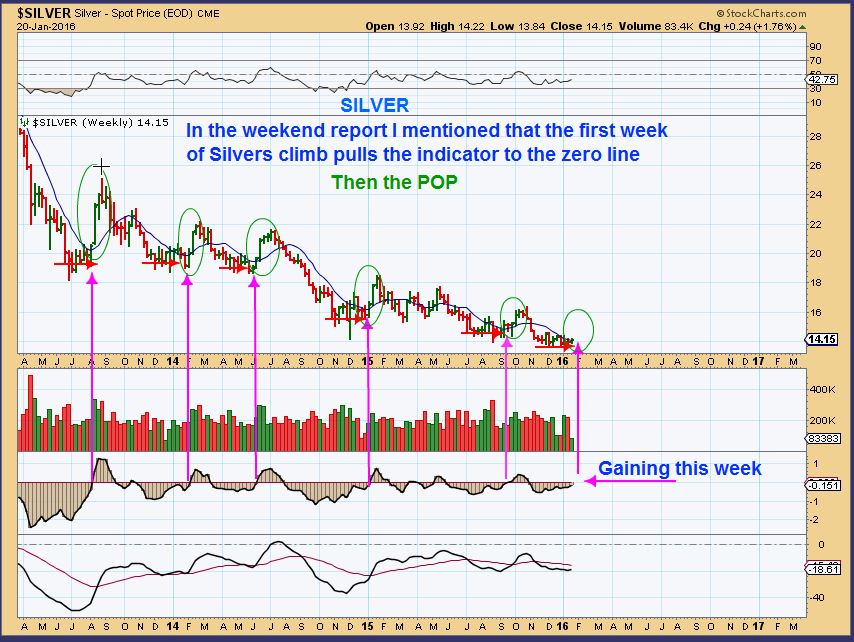
SILVER WKLY – We are there, and we usually have 2 or 3 weeks higher. Now will we make lower highs again, or break higher? ( This chart should say lower highs in blue- sorry) 
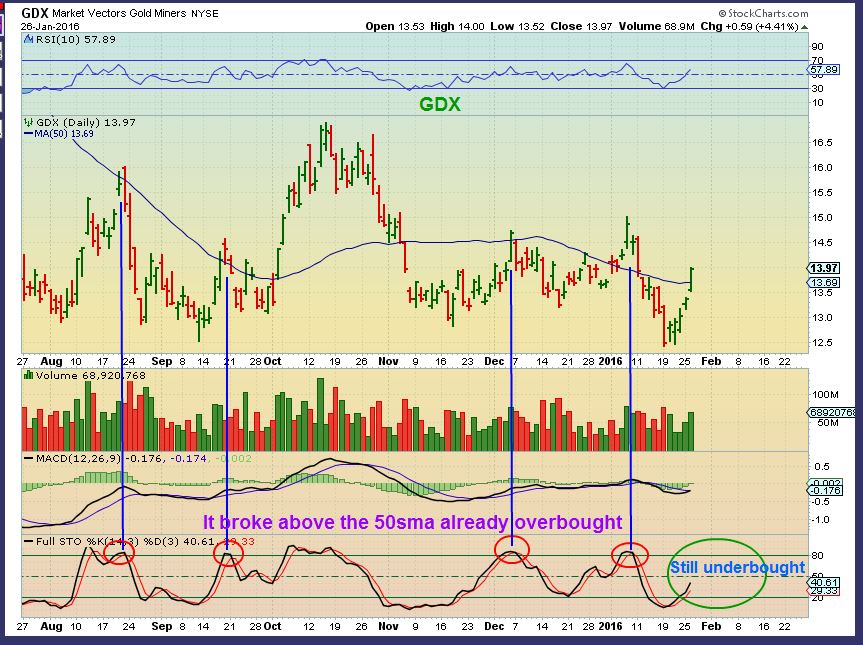
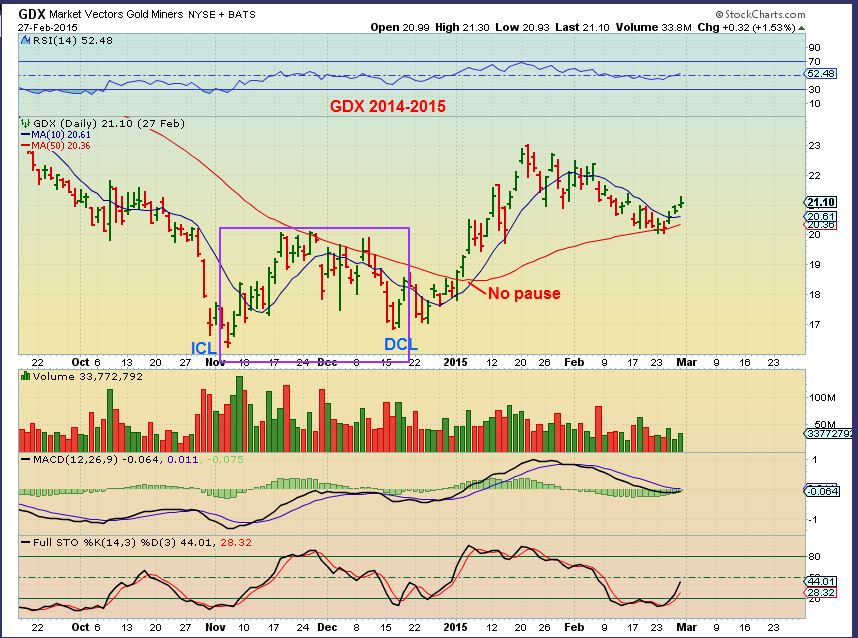
GDX – GDX surged above the 50sma. This is usually bullish, but in the past we have seen it drop back down. THEN I NOTICED : In the past it was already in overbought area of the stochastics, but not this time. Miners just did a shake out, so we are not overbought currently and that could be bullish for follow through.
.
For newer Readers here, I always mention that when we are looking at bottoms forming, not all bottoms look alike. SO lets look at a few bottoms and examine the differences. Not these bottoms…
 …These Bottoms in GDX
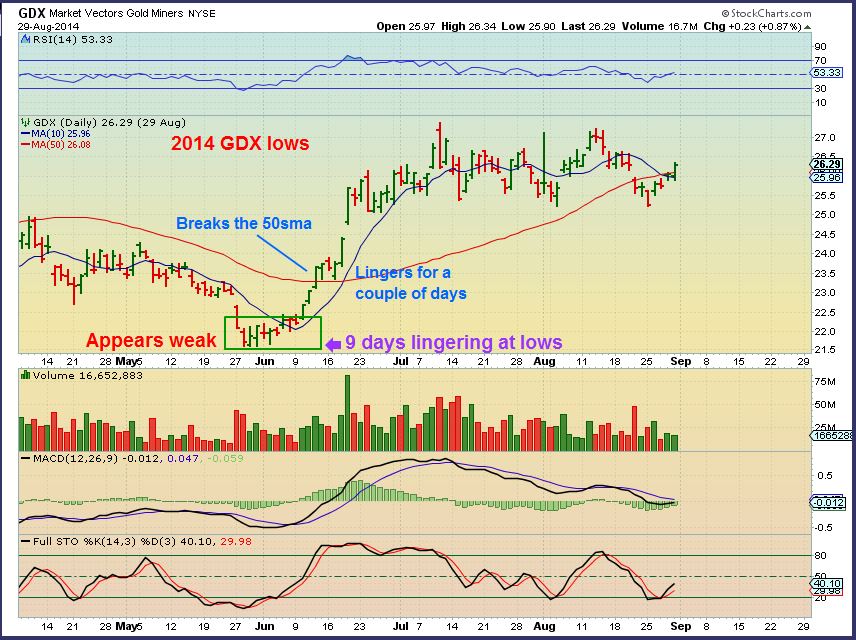
May 2014 GDX – Lingered at the lows for a week and then took off. Above the 50sma it ‘paused’ but it never dropped below the 50 sma again during that run.
GDX 2013 lows – This had a shake out too. It also moved above the 50sma and continued higher until day 23. ( we are only on day 6 today ) . It also only went sideways until the next daily cycle.
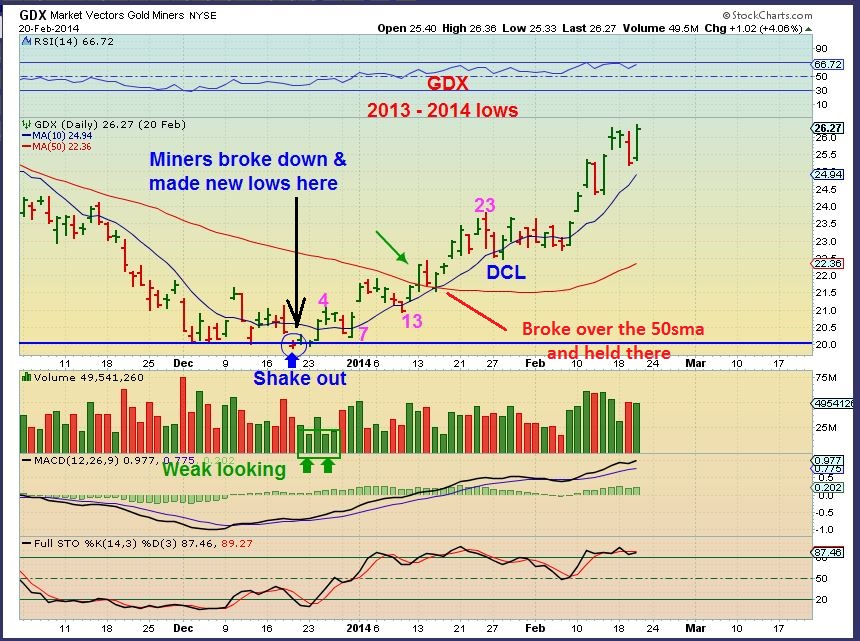
I wanted to show this bottom, because it shows that even when GDX couldnt break above the 50sma on the first daily cycle, it was able to put in a strong run higher on the 2nd daily cycle after a deep dip.
So currently we are in the first daily cycle on day 6 and we have sliced above the 50sma. I wanted to show that we should have more upside in Miners, no matter what happens on Fed Wednesday.
.
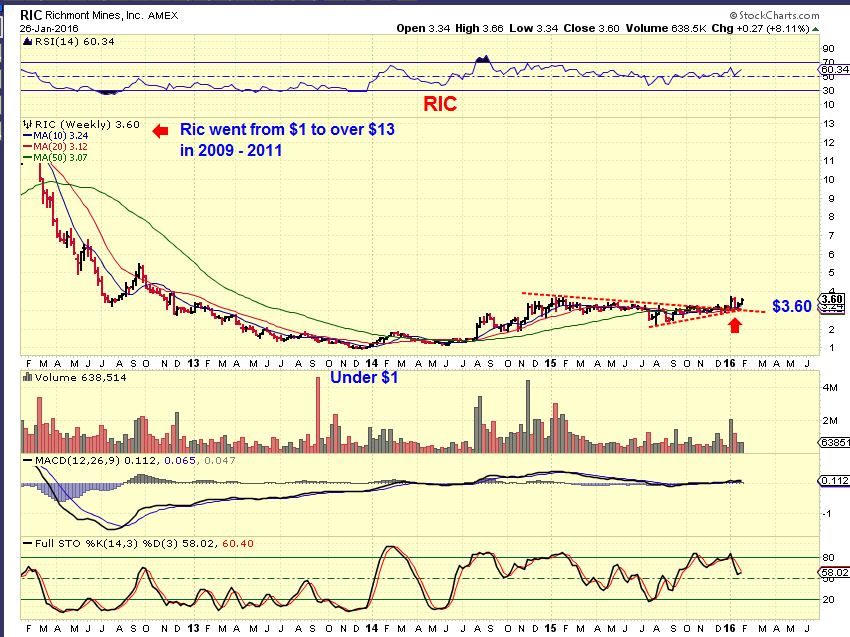
SIDEPOINT: I have pointed out some Miners Bottoming out already in past reports. NG, RIC, LSG, etc etc . I also wanted to show that a few more Miners are starting to look better longer term.
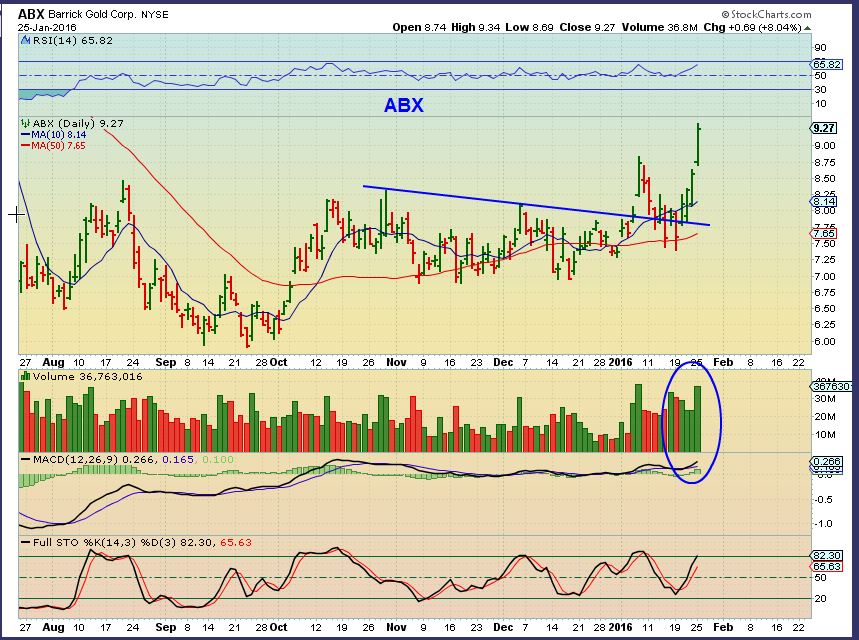
ABX broke out recently. Almost a 100% move, but lets look at the bigger picture.
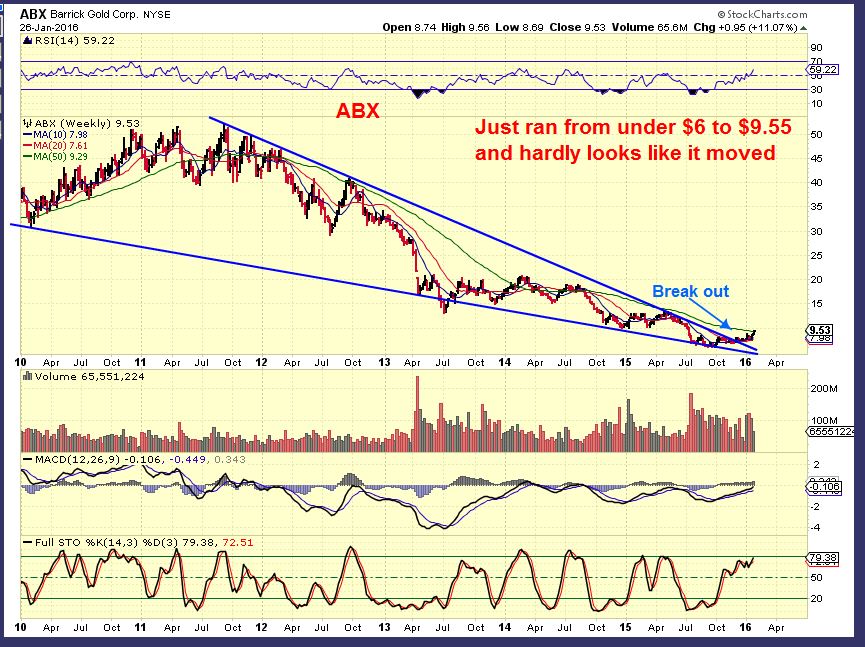
ABX WKLY – Formerly a $50 stock, the recent 100% move looks tiny. This could have a lot more upside when things turn around, and this break out is a nice start.
.
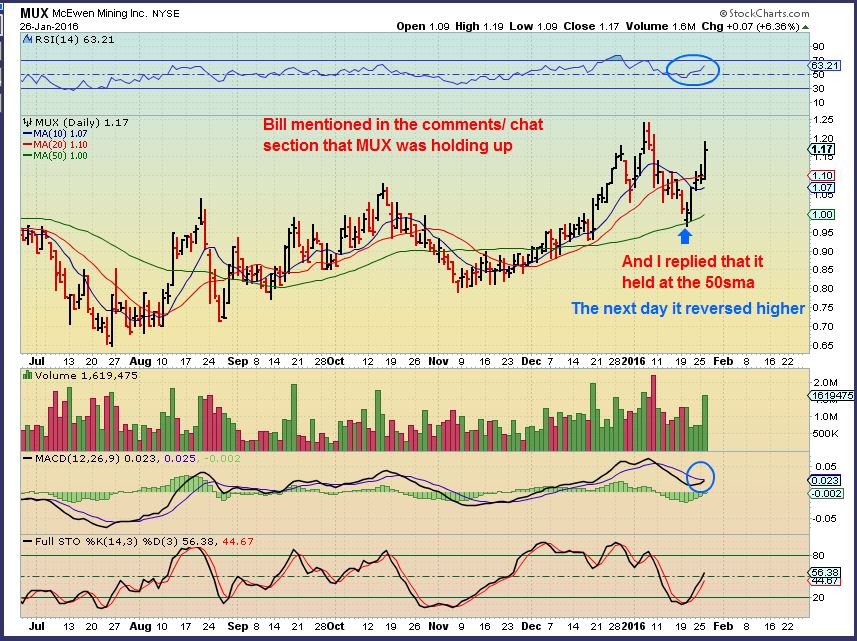
MUX – I also like that this junior has been rising since last summer while Miners just broke to new lows.
MUX WKLY – This is the real pretty view. This looks like a 1 year base that could be ready to move higher.

RIC – Huge Base in a bear market . This former $13 stock has ignored the selling to new lows too, so we do see early signs of some Miners that are trying to buck the trend. We should expect them to out perform later on when the Gold Bull reemerges.
SO for the FED WEDNESDAY, we all know the kind of volatility that the markets can experience short term during this time. From 2 p.m. through Thursday we can get a lot of action. The above report lays out what I expect going forward longer term , despite the short term possible shaking around with the Fed speech . Thanks for being here everyone!


Yellen ain’t the elephant in her own mind.
However your charting remains exceptional.
Thank you so much once again. Hitting the nail with that stop loss shake out.
Thanks Beek!
Nice to hear from you. We should be early in the MINERS count with that stop loss as an ICL and being so recent, so I do expect more upside in the next couple of weeks despite the Fed. I’d like to see if we can get follow through on Fed day, instead of a pullback for a few days though. : )
Lots of nice % moves in Energy again.
CJES, BCEI, CHK, AXAS, OAS, etc
OAS move looks like nothing, but has almost doubled off of the deep reversal lows.
HArd to hold at the jittery lows, but good trading if one dares to buy the dips.
I mentioned in the comments that FCX was a buy at $4 gap fill yesterday. Almost $5 today.
Do you see any that are lagging and may still be a good buy?
I was looking at BCEI and it basically doubled in 2 days. Then it pulled back and I couldnt pull the trigger, now it went from $2 to $3.50 in 2 days, so maybe look for good performers and buy the dips if OIL holds up.
In the meantime I will look for lagger, but I cant tell they’ll catch up unless they have strong volume on the rise ( Thats a good sign) .
Is there a price range that you prefer?
NADL has high volume selling, but price didnt drop much . Looks interesting at a glance
LGCY basing with good volume pops, but let me look around when I get more time and put them in a report if OIL doesnt somehow get smoked by the Fed.
SGY hasnt moved a whole lot, but look what it did in Dec and it looks similar to now. If Oil drops again, these may give up recent gains. If Oil breaks out above the 20sma and can run higher, these will move well I.M.O.
Just looked at RES and MRO. Those set ups look good because bigger funds can buy those and they look like they move rapidly too.
MRO went from about $7-$11 in 3 days. Hit the 20sma and reversed.
RES ran to the 50sma and reversed, so these moving averages are working as resistance on MANY of these. (Maybe a good place to sell position and look for another entry or another stock).
Thanks for the feedback. Earlier today I had a buy limit set for LGCY at 1.14 and it got away from me. Still watching it and may take half position and add on a pullback. Will watch NADL and SGY closely too.
An hour to go, pretty quiet. Miners moving higher, Juniors making moves off the bottom. Gold not moving.
I’m not exactly sure in which direction, but I believe this quietness will pass after the Fed 🙂
hi
Hi Maria!
what’s your weather stick sayn on gold… im watchin this…
anything close?
https://www.tradingview.com/x/dQcj03KC/
I have a weather stick in my screen porch! I wonder how many know what that is? I think its a west coast thing!
lol…. why did I know that…;o)
https://www.tradingview.com/chart/XAUUSD/f76MAI8w/
No change from original post
My guess is that the initial reaction to GDX will be down. Will it hold on the 50sma? Will it break further and fill lower gaps, and then move higher?
I dont know, but holding GDX will find higher prices later. Holding a LOT of NUGT might not be so good if those gaos fill.
This is all just a Pre- fFed guess.
They could even sell GDX off until 3:30 and then buy it back into the close.
Markets are devious around these fed Meetings.
giggle
I LOVE IT WHEN I’M WRONG : )
The initial reaction at this point is positive ( But it’s not even close to 4 p.m. yet)
Gold is going straight up!
Still cant understand SA. That looks like a bear flag so far.
All my indicators are giving me a BUY here on the SA daily chart. FWIW. Looks like 11-05-2014
show me …. 😉
https://www.tradingview.com/chart/SA/FOuVuuy8-SA-LONG/
Here you go, just some quick thoughts on SA
ok .. and here is with a deeper correction… but.. IDK that’s a lot of support there…
https://www.tradingview.com/x/7hflw6U2/
Bear flag is possible for sure. BUT, with the rest of the sector moving higher and early in the cycles I am more positive than negative.
i take that back —- a mad stop run thru that support line sounds actually sounds PERFECT – to trigger a TON of stops there… then they load up b4 the GIANT “3” tidal wave that’s about to hit….
i think i should get a GOLD star for that one…
giggle
How about 2 gold stars?
…. oddly… that reminds me of a picture i have…
giggle
Where is the picture? Can’t post!
lol.. no way..CF will kick me outta here.. 😉
Here’s previous GDX, still looking good.
https://www.tradingview.com/chart/GDX/zAjk5Qdr/
hmmmm … so that’s exactly what I’m thinking… we are in “1” of 3 now… heading up…so wait for a little dip for “2” and load up… or start nibbling…I suppose..(she says w/ a smirk) nommy nom… 😉
me either… i ‘think’ it’s still in “2”
https://www.tradingview.com/x/i7GF03hr/
sorry — i forgot to put the “2” and “3” back where they belong .. lol
ps. “2” can do deep… 99% deep… yowza
https://www.tradingview.com/x/J7acZZ0O/
hi M.. what do you mean by “4. which also becomes 1…”?
like this …
https://www.tradingview.com/x/J1ChuFv8/
i wouldve just thought your corrective wave ends at your labelling of ‘3’.. then ya got your 1-2-3-4-5 impulse
I was looking at it as 1-2-3-4-5 of 1, but that a-b-c down became as long as the 1-2-3-4-5 up?.
Doesn’t look normal to me. ( I’m not an E.W. expert, just a perfectionist, and I want perfect 1-2-3-4-5, a-b-c lengths – not stretched , abnormal contortions. I need to ask Ken).
yeah… good idea..
oh KENNNNNNNY ….. stop playing around out there… teehhee
as an aside CF — im seeing some HUGE corrections/major stop runs – ie. CRK, BBG – of mine — and they are counting as a DEEP ‘2″ … or which would be a “5” of previous wave.
Not to throw cold water on SA ( I own it ) BUT it looks like a bear flag to me.
😉 ohh hi ken
https://uploads.disquscdn.com/images/9db67fa799ec3129c85e713347ae2f95a8c0d29d15bceff38ed729ff52c3b9e9.gif
ps. see my gold star post below on my ‘deep 2″ count..
sounds like a good plan… (I also own SA btw –)
“…. i take that back —- a mad stop run thru that support line sounds actually sounds PERFECT – to trigger a TON of stops there… then they load up b4 the GIANT “3” tidal wave that’s about to hit….”
So after the FED GDX goes higher, sells off, goes higher, sells off…and on a 5 minute chart, that looks like this …
.
refresh .
.
Gold just did another pop after its consolidation from the initial pop after the Fed / GDX just popped form my cup & handle chart.
AND….The dollar drops.
GDXJ just pushed above the 50sma
Hi Alex,
Rode PAAS up and sold it….. worth while looking at any laggards……SSRI? or is that a bear flag? I’m concerned that silver usually moves at 2-3x to gold and we have not seen that today?
thx
Hi Curtis,
Its always a tough call to make that decision in the middle of a move. Most runs higher come off of the lows and then dip down before surging higher ( Most, not all). So that gives it the 1-2-3-4-5 look off of the lows. Buying a lagger can have you buying one that will test the lows if we do dip down.
An example of 2 different bottoms were in the report above under the animals picture. See how the first GDX chart just went up & away, but the next one after the shake out lows, went higher and dropped back a little. We are in that area now. We may move higher, may dip down.
Now look at how FSM, AGI, NGD, etc are coming off of the lows. Looks like short covering and it can continue, so…
To buy a lagger here is 50/50, so if you do, use a stop. CDE played catch up, SAND ( gold) Is trying, so some may play catch up.
I know that That probably wasnt very helpful, but it is how I think out loud when I am in the middle of a move that started a week ago. Almost 6 straight up days for GDX. Buying is 50/50
Thanks Alex,
I’ll probably wait now for a 2-3 day pullback ( if we get one)…like you said we are 6 days into this move.
Thanks Alex – Would you expect Oil to go up now that the USD will be weaker ?
I’m not so sure. I see the dollar dropped and has put another tail on at this point. I also still see OIL struggling at that 20sma, and that has been the end of every move higher lately, so I want to see if it can pop above it.
Odd volume on UCO today .
Ok. Thanks Alex !
G-Nite all…Gotta grab Lunch or Dinner….I forgot to eat today I was so wrapped up in these charts & the Fed : )
Thanks CF, see ya
Alex, nice work on miners and PMs. I doubted so I missed the move. Surprised that it was able to move up once market stabilized and had most asset classes moving up together and you stated above. Nice call, I’ll continue to keep in radar here for upcoming moves higher.
Can we get 2 up days in a row in the market. I mean, seriously is that too much to ask for? Come on!!
I liked oil stabilizing and moving higher after bearish inventory report. So I’m in ERX for a quick spin. Very tight stop, small position, looked good until Ms Yellen report. Sheesh.