
1-23-2016 WEEKEND REPORT
The weekend report will discuss the changes that we have expected for months, and how we now see those changes taking place. Also, as mentioned in the last report, the recent sell off is now changing into a Long position, but for how long? To the charts! 🙂
.
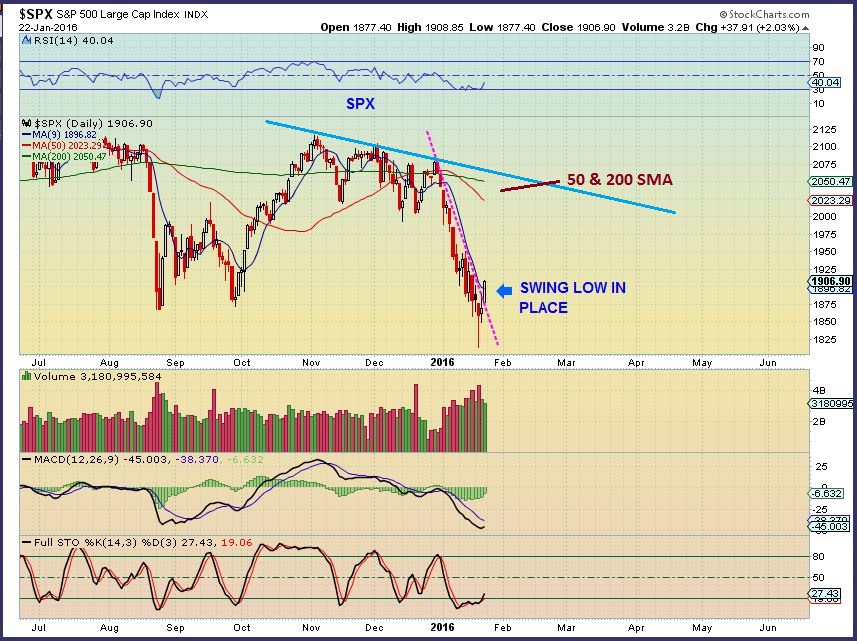
SPX – On Thursday, Jan 21st I mentioned that a swing low was in place ( Bullish for going long). It is safer to wait for follow through with a confirmation break above the 9 sma.
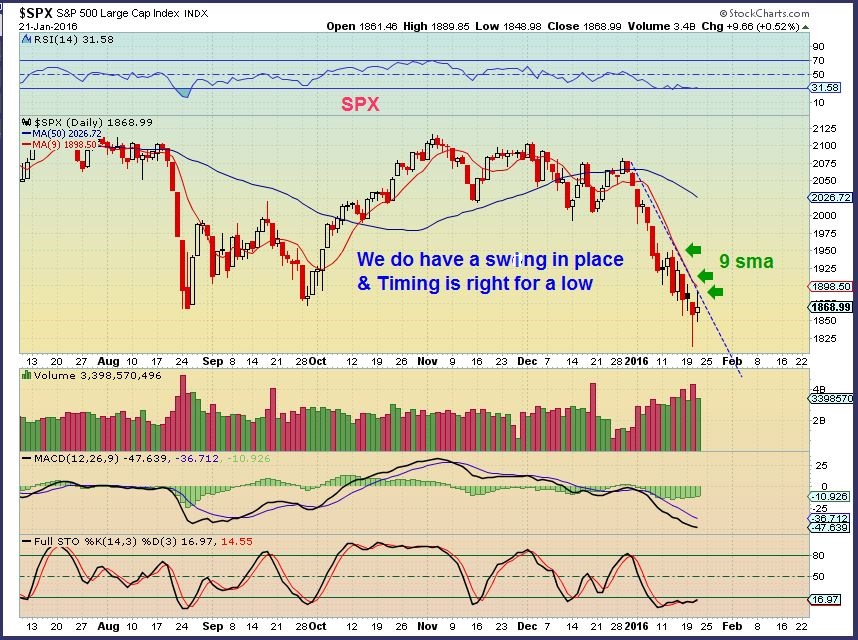
SPX – We had that confirmation on Friday. For traders, going long SSO, TQQQ,IWM, and various stocks was in place.
But please, lets not forget the Big picture too…
(Click on any chart to expand)
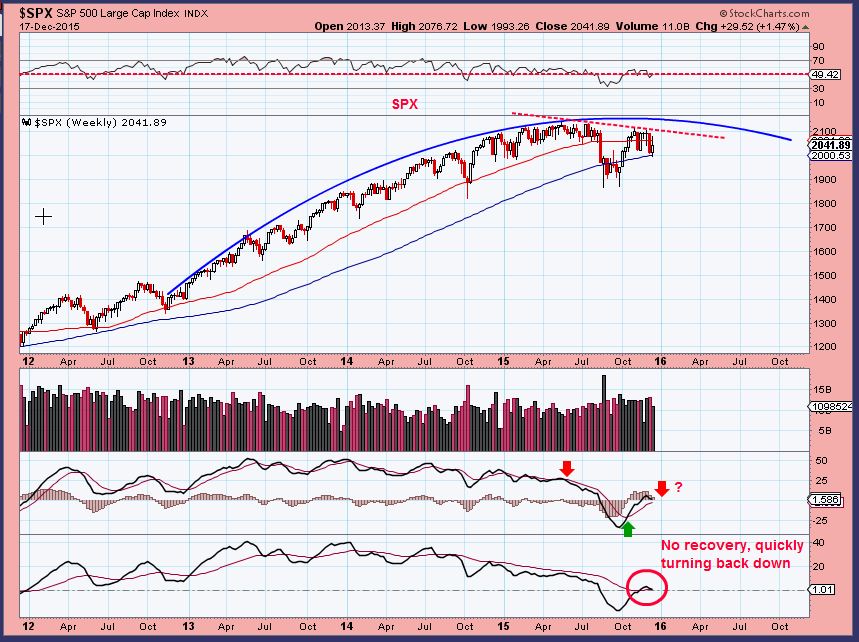
SPX prediction – I have been saying since the Spring of 2015 that the markets looked like they were gradually putting in a top. A rising wedge was the first clue, then certain indicators were pointing out a top. The markets did top in May 2015, but what a long process this topping action was! On Dec 17 I repeated that the markets looked toppy & weak going into the new year. Two of my personal indicators ( bottom windows) showed the weakness in our bounce after the summer sell off.
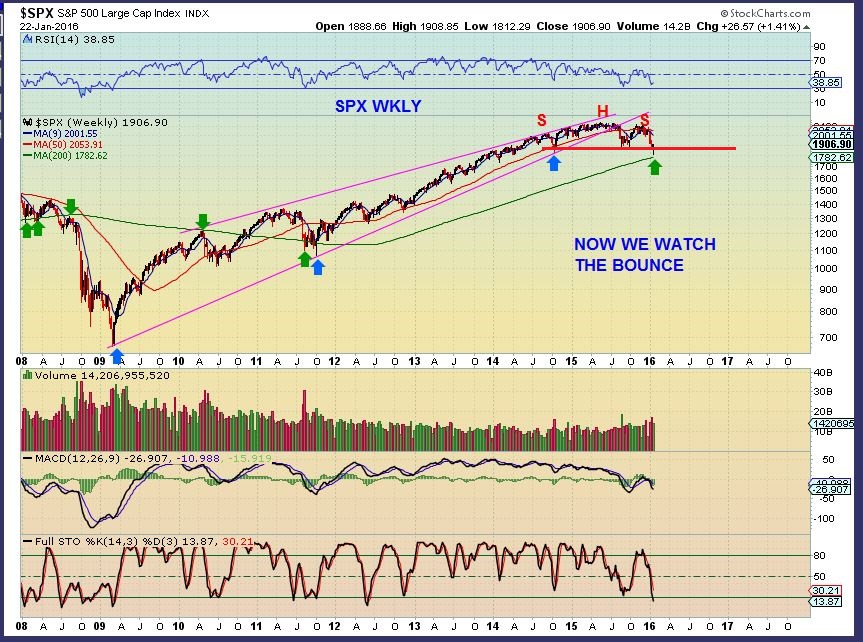
SPX WEEKLY – For the big picture we have a break down & possible H&S top. SO I AM SAYING that I expect a bounce here for a few weeks, but lets keep the big picture in mind too , as we play the long side.This may just be a multi week bounce.
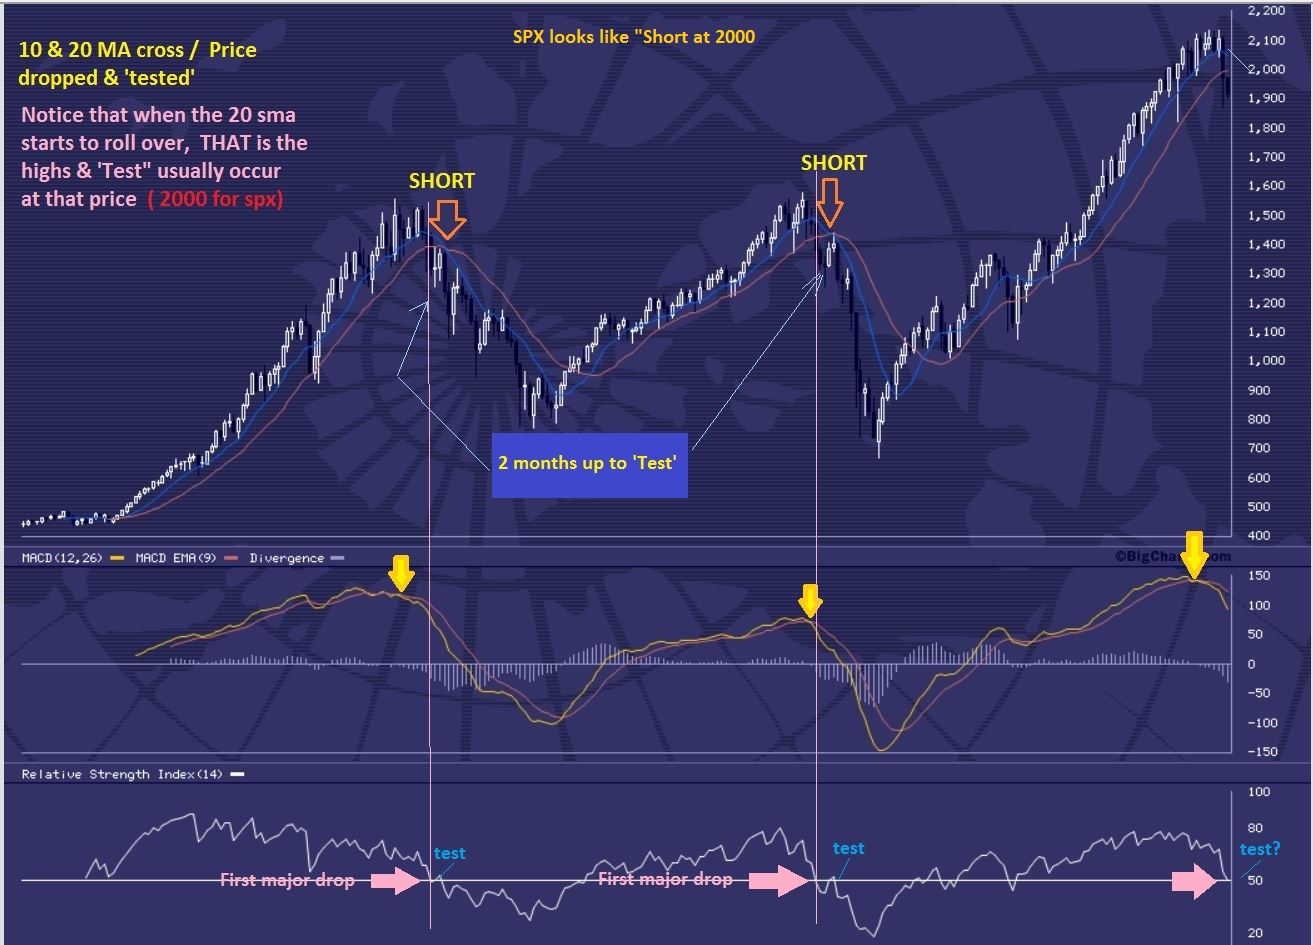
SPX – Do you recall this chart in Sept? I said that it would take months, but that I should watch for a Monthly drop and a cross of the 10 & 20sma. That is about to happen now, so let me show you another Bearish long term chart.
 .
.
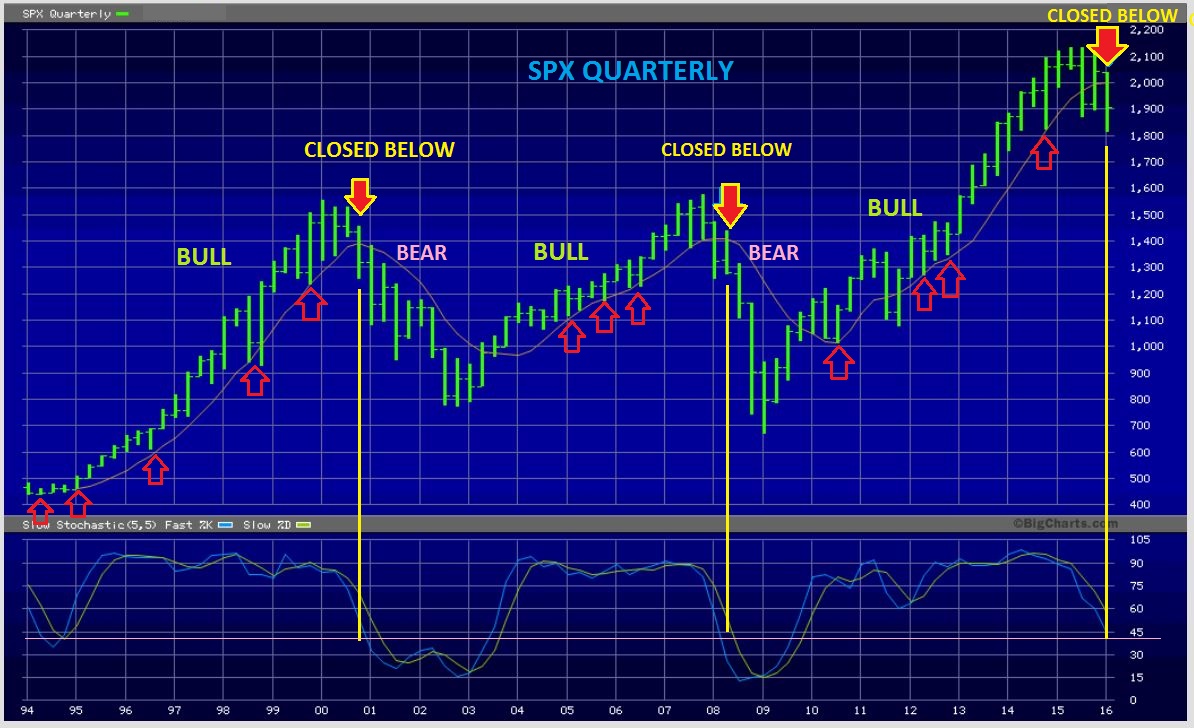
SPX – This chart clearly shows when the last 2 Bull Markets changed into Bear markets. This may be the clearest reminder in my report. A tag of the overhead M.A. occurred next and then the drop continued. Note: In 2011 we dropped and recovered, but every other time was when the Bull ended. We see the same thing happening right now. SPX 2000 will be interesting, be cautious if you are long and we approach that area.
.
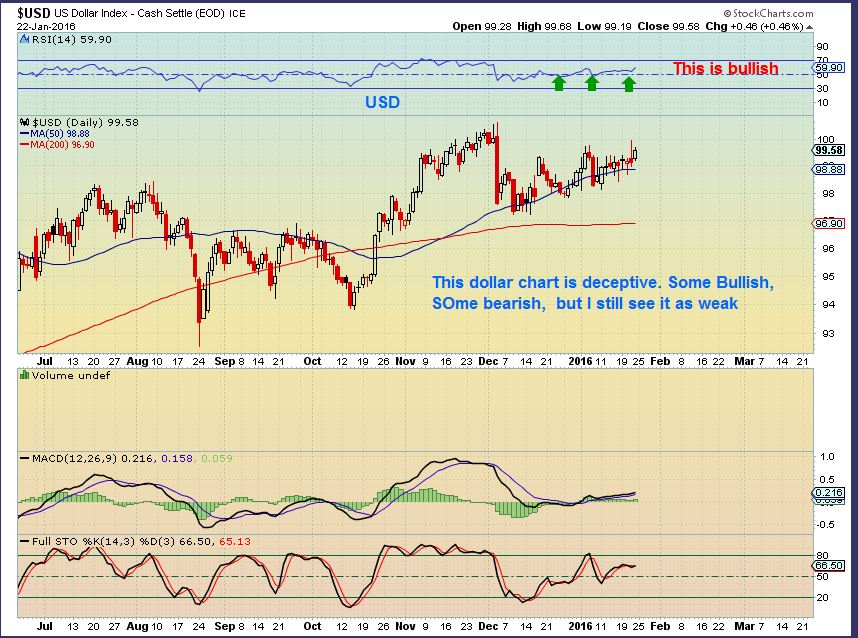
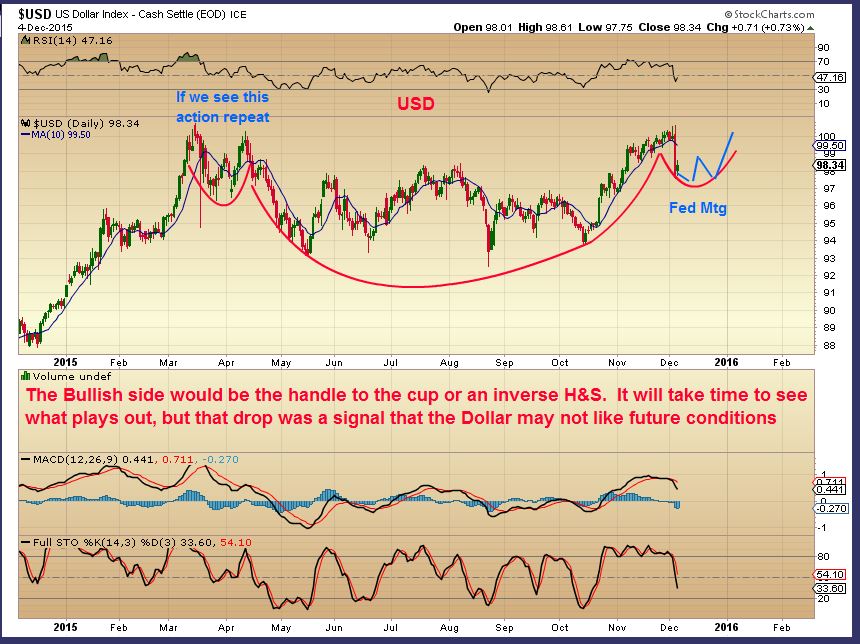
USD – I see weakness, unless this can really POP & Run. There is room to go higher, lets look at a longer time frame…
USD WKLY – I’ve mentioned a double top as possible. This Wkly chart could do the trick.
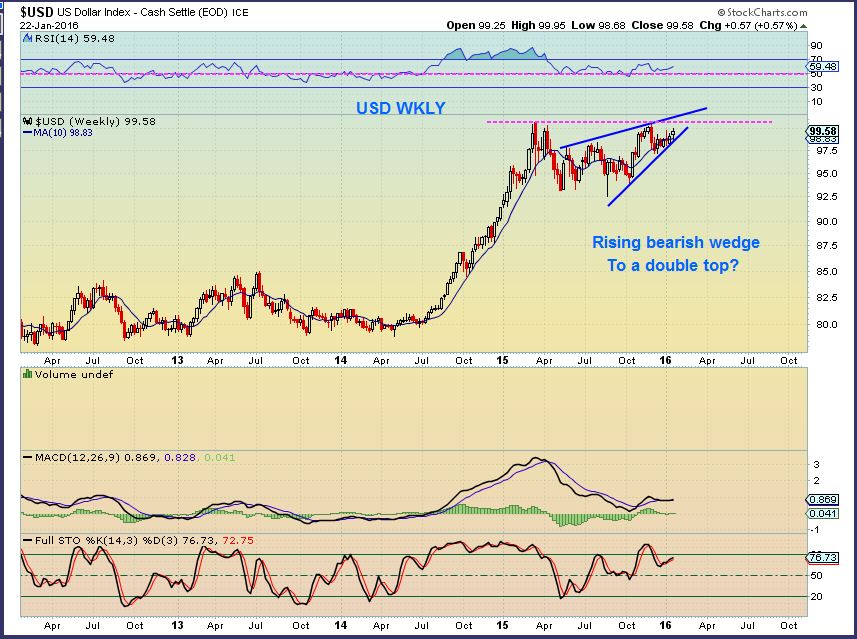
On Dec 4th , I called for a possible Bullish CUP & HANDLE to form here at the highs. That MIGHT be what we are seeing in the chart above , but honestly it looks weak at this point. I will have to watch it further and see if it develops with weakness or strength. Currently I still see weakness ( Double top).
.
4 Views of Oil- Past & present
.
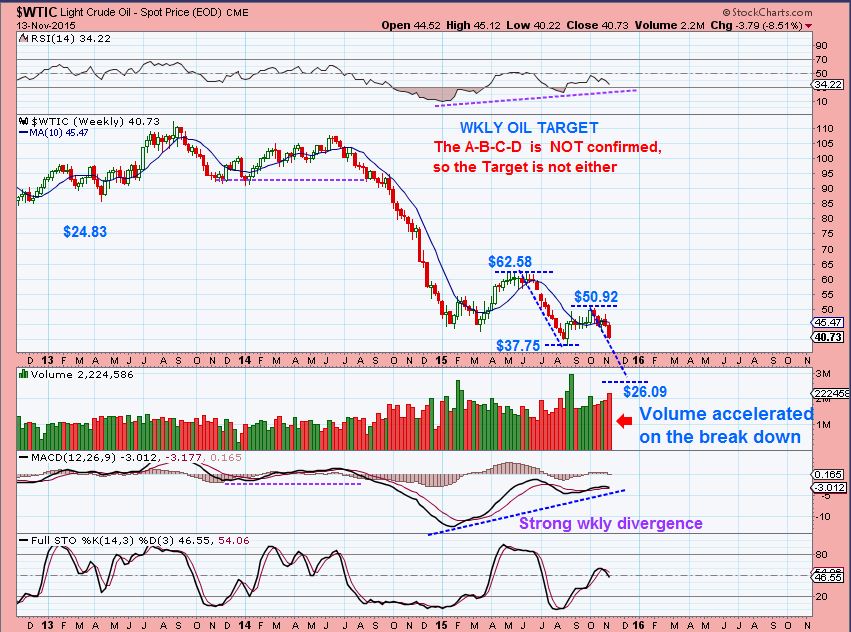
# 1 – In November I called for a possible long term $26.09 wkly target in Oil, when it was above $40.
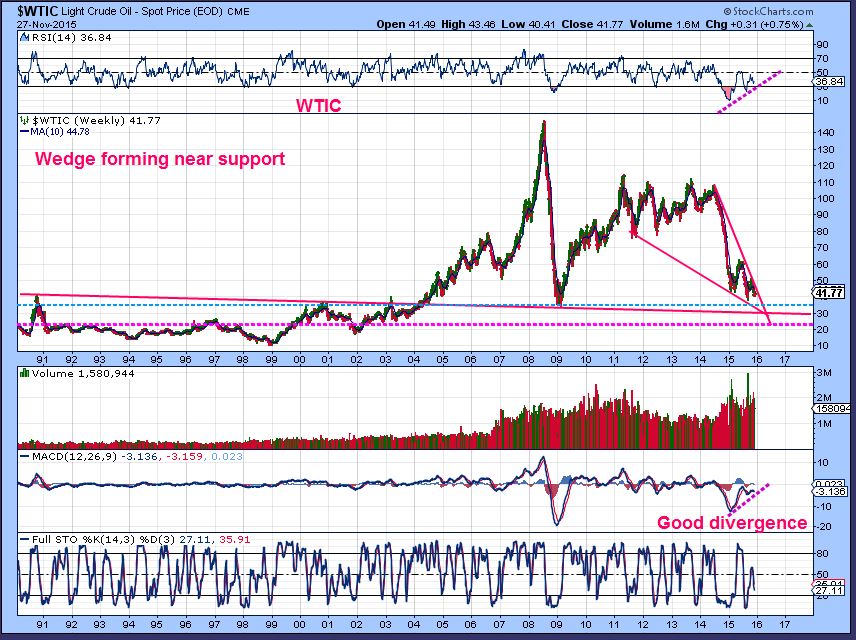
#2 –
We also watched this WEDGE, because a break out from the apex ( Or drop between $25 & $30 and then a break out) could lead to the bottom.
.
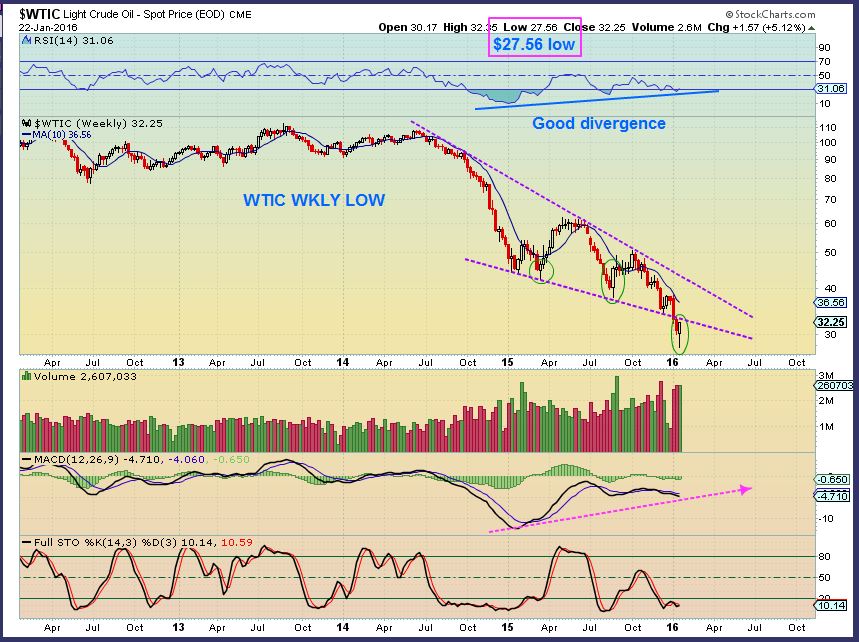
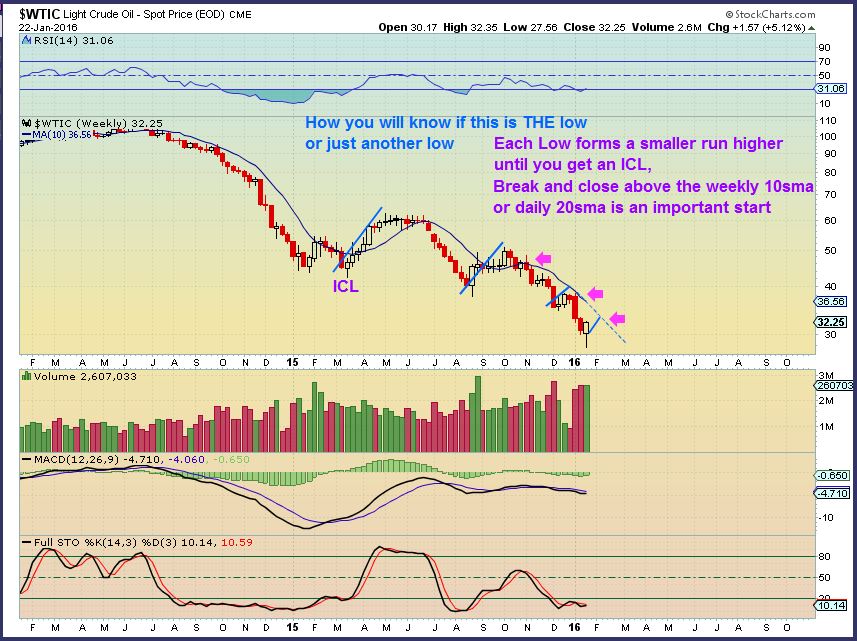
#3 – With recent lows at $27.56 , could that be THE low. Possibly. It is very oversold and this looks like a definite low, with a false break down and that strong Divergence. Yes – This COULD BE THE LOWS. However, We need to keep in mind that we are a tad early for an intermediate CYCLE low, so 1 more daily cycle could bounce & dip into a final low.
#4 – I am trying to think several steps ahead here just in case. So if we get a bounce here and it rolls over, you could still have a break out & back test. We will remain cautious at lows, but going long here has been a good set up in Energy stocks.
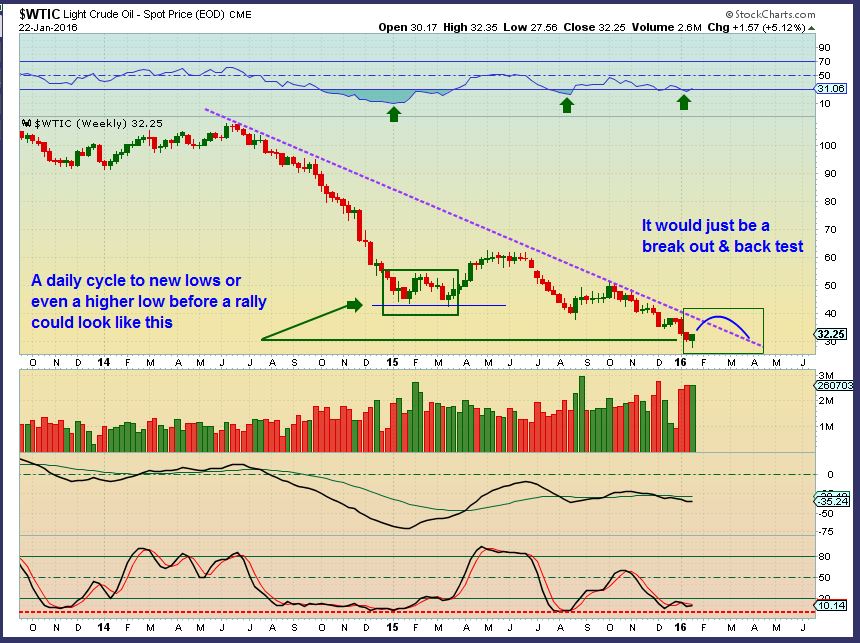
WTIC WKLY BOUNCES – The bounce/ Rally from the ICL was strong, the next bounce from the daily cycle low (DCL) was up & sideways. The next bounce was weak, so will this be a strong rally or final weak bounce? We can look for signs moving forward. That 10SMA on a weekly chart is a big test.
.
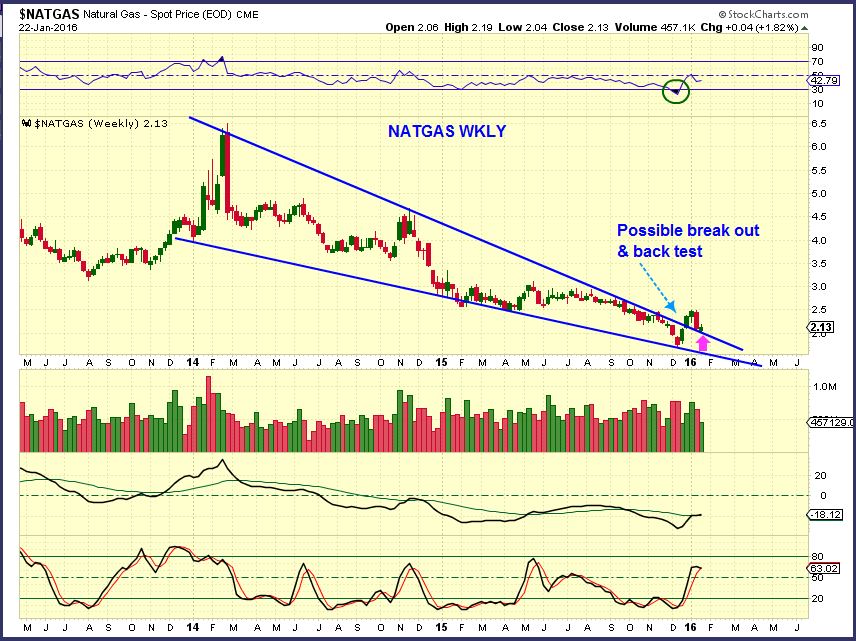
NATGAS –
This was my daily chart in Thursdays report. It is from Wednesday.
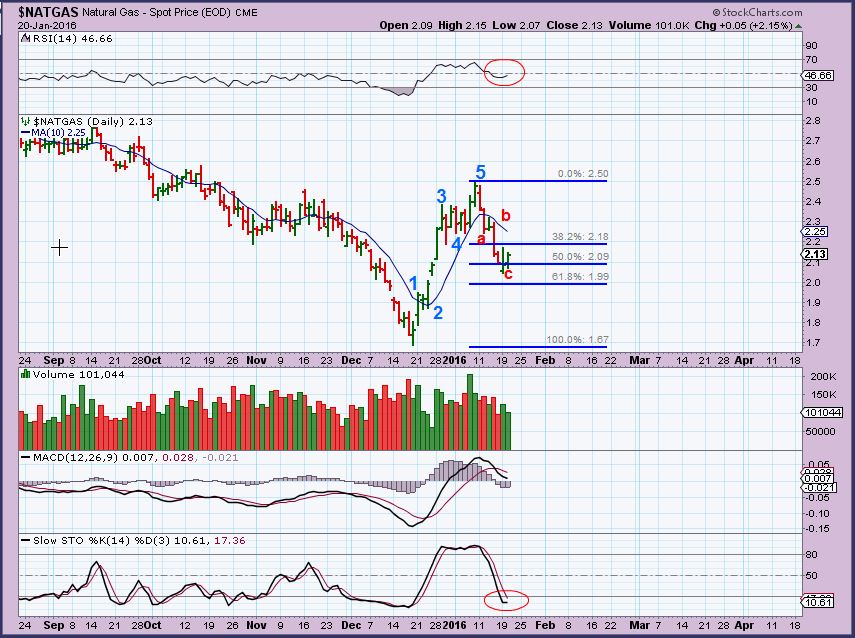
NATGAS BULLISH VIEW – Warning, if this is wrong, that MIGHT be a bear flag that just formed. Any long position in UNG, UGAZ, etc would have a stop if NATGAS dropped below ‘C’ (or roughly $2.00).
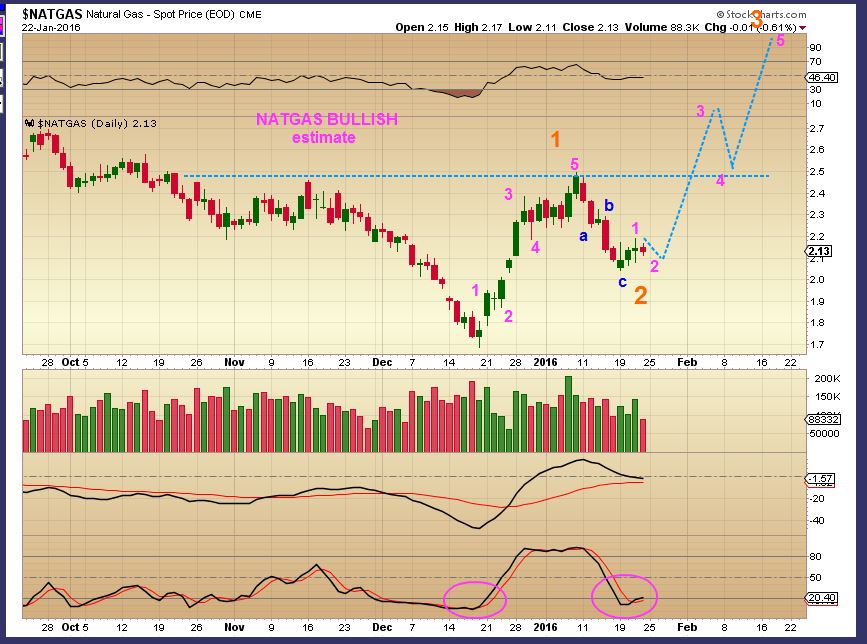
NATGAS – Further bullish possibilities , a break out & back test.
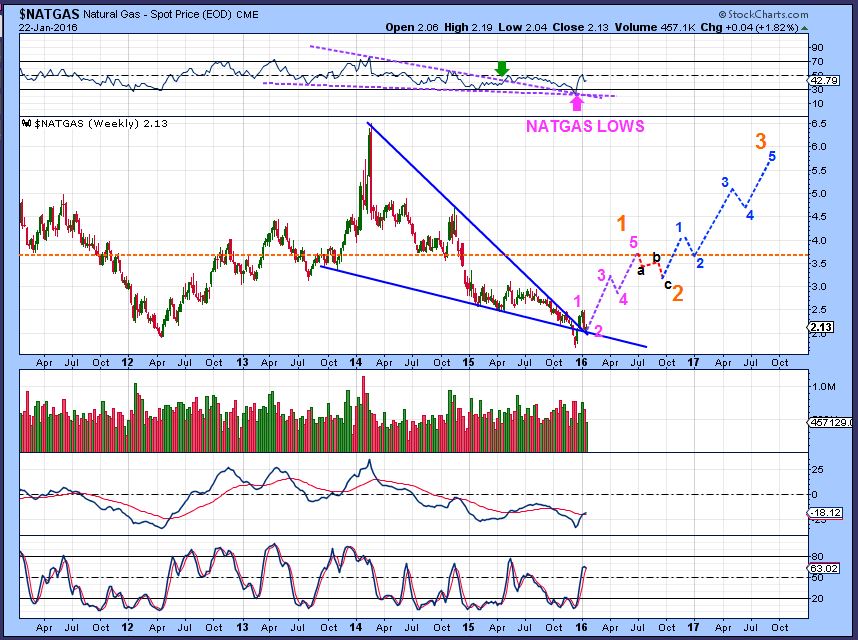
NATGAS – This would be an eventual rise to former highs. It will NOT unfold this smoothly, it is just to point out the bullish case that a final low may be in place.
.
GOLD, SILVER, MINERS
.
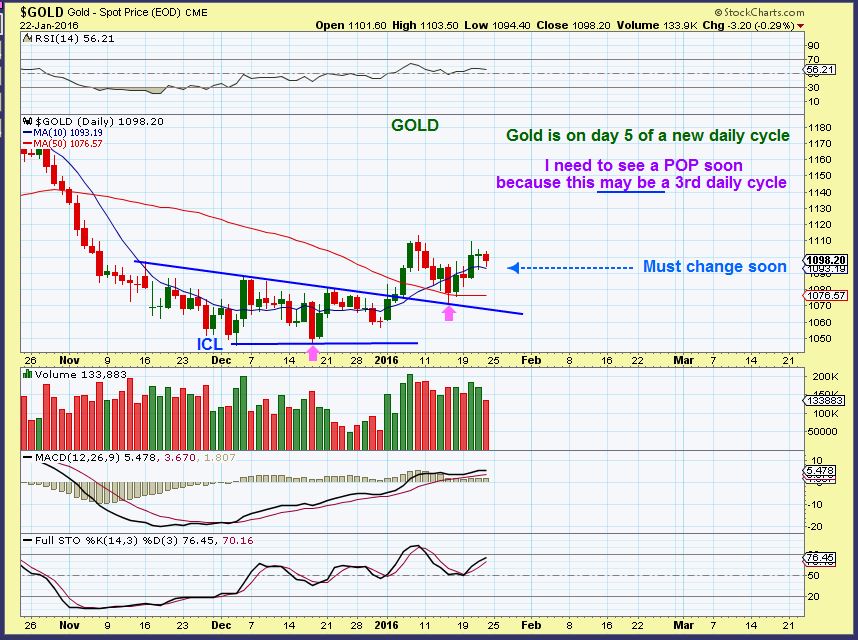
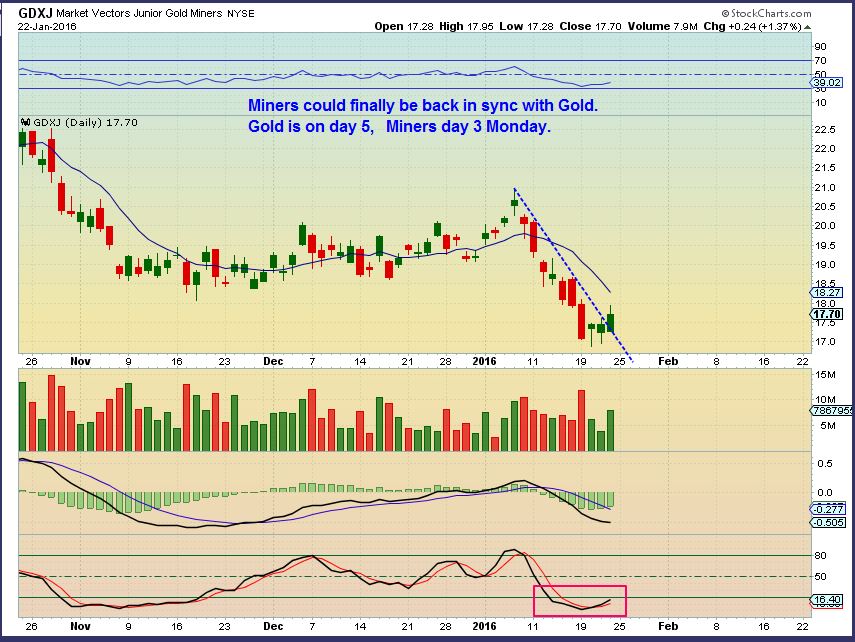
GOLD ‘s COT is still fine. The daily set up remains Bullish, but the delay is brutal. Gold is on day 5 of a new daily cycle. I need to see a pop higher very soon .
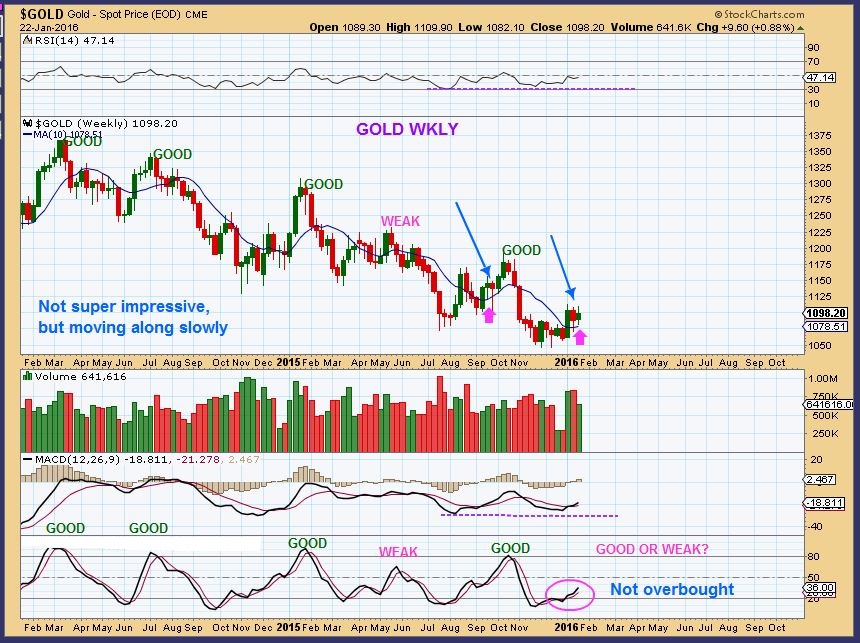
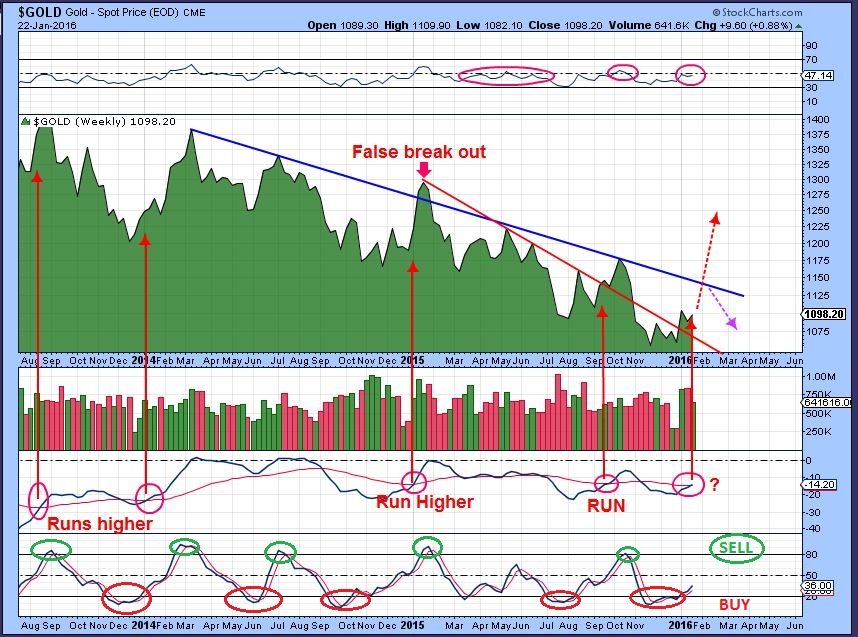
GOLD WKLY – looking at the weekly chart, you can see that the run higher in this phase of the game (ICL to top) tends to be GOOD – EXCEPT FOR MARCH – MAY 2015 WEAK . So far this is rather weak, but it still has time to become a Good run. Gold is oversold & still above the 10 MA, so that is is bullish.
.
GOLD – This looks like it should Run Higher soon. We are closer to the Buy point. So Gold is still oversold & Bullishly aligned, while breaking higher . $1140 target?
.
SILVER – This looks like a large base, but being rejected on the break out attempt is not good. Silver looks 50/50 to me at this point. The MACD is bullish.
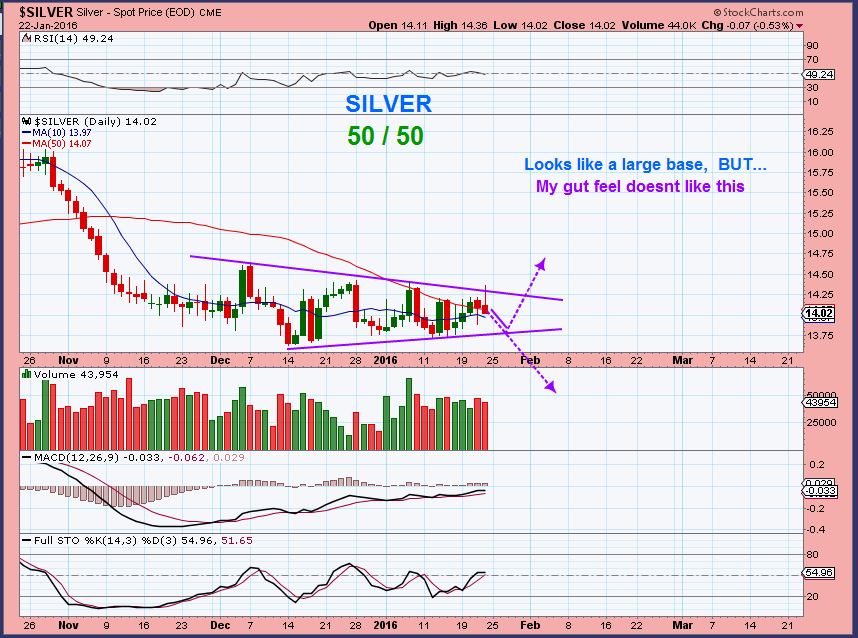
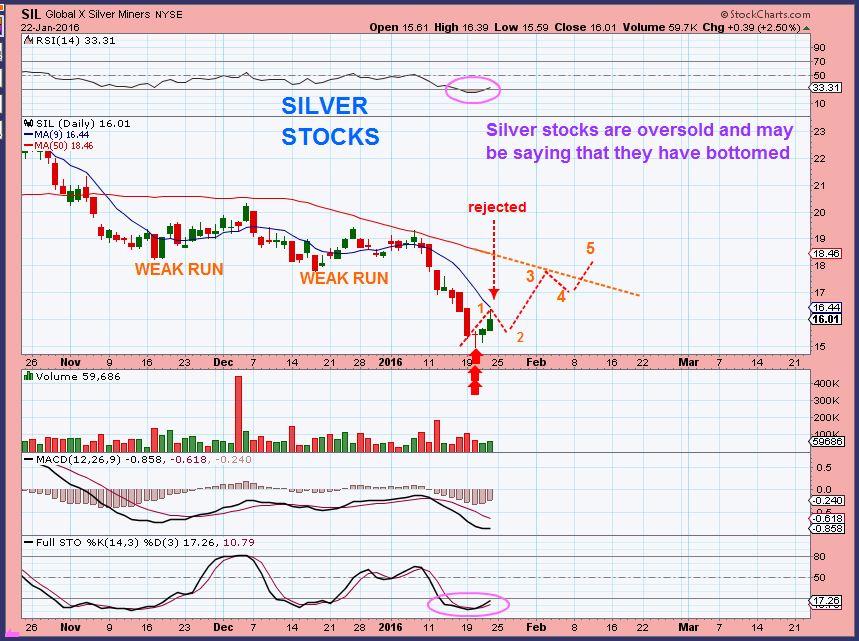
SO I flipped to SIL to check out the Silver Miners ETF. It remains very oversold and looks like it would POP if Silver went higher. If silver dropped, this could be a bear flag. 50 / 50 here too really. Lets check Miners.
.
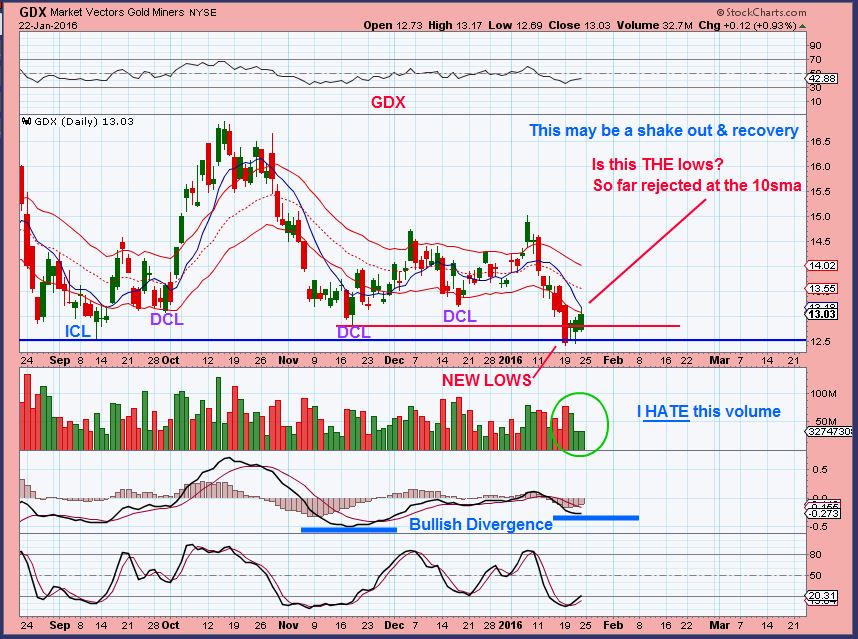
GDX actually looks BULLISH and ready to run higher.
GDX DAILY – A break down and recovery. Oversold. I hate the volume, but that can change.
 .
.
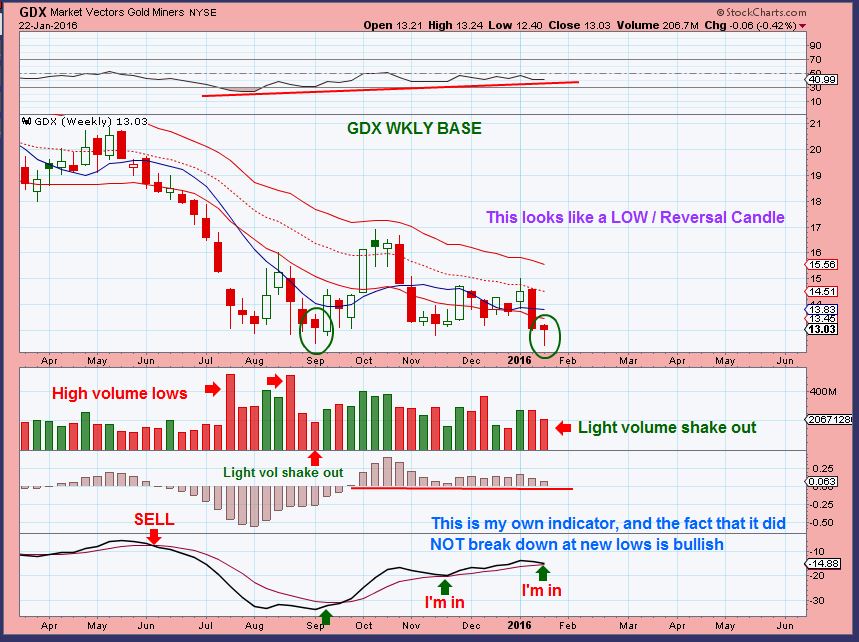
GDXWKLY – This simple weekly chart looks quite Bullish. Its a double bottom with a weekly reversal candle. That light volume that I hated on the daily chart actually caused the ‘ Weekly Test” of the prior lows to happen on light volume. That can be bullish. I remain long Miners.
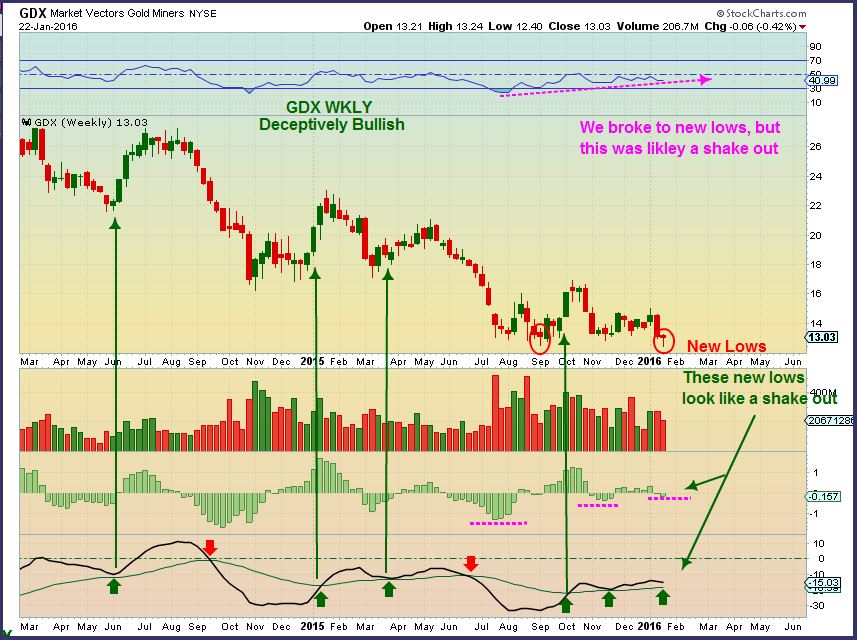
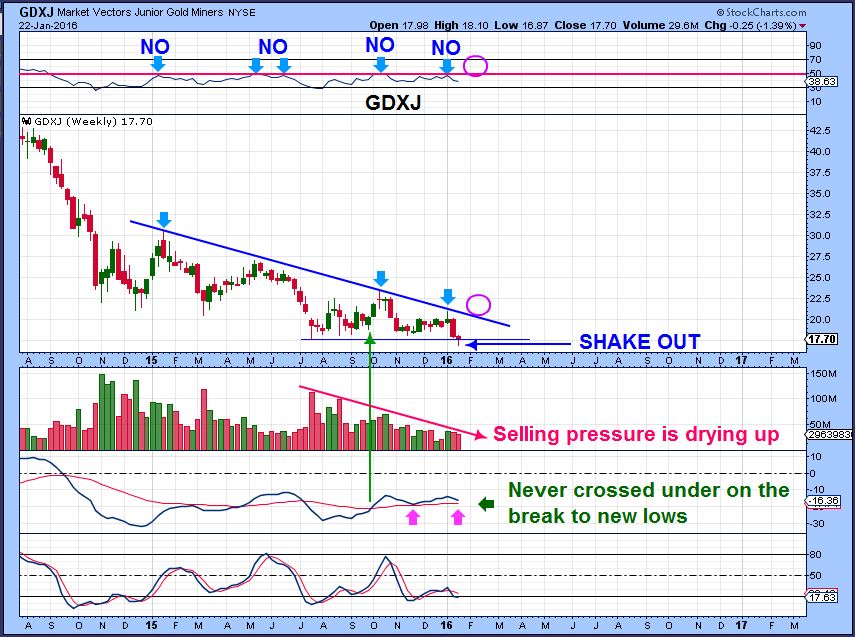
GDX WKLY – another view showing that the weekly new lows looked like a shake out.
.
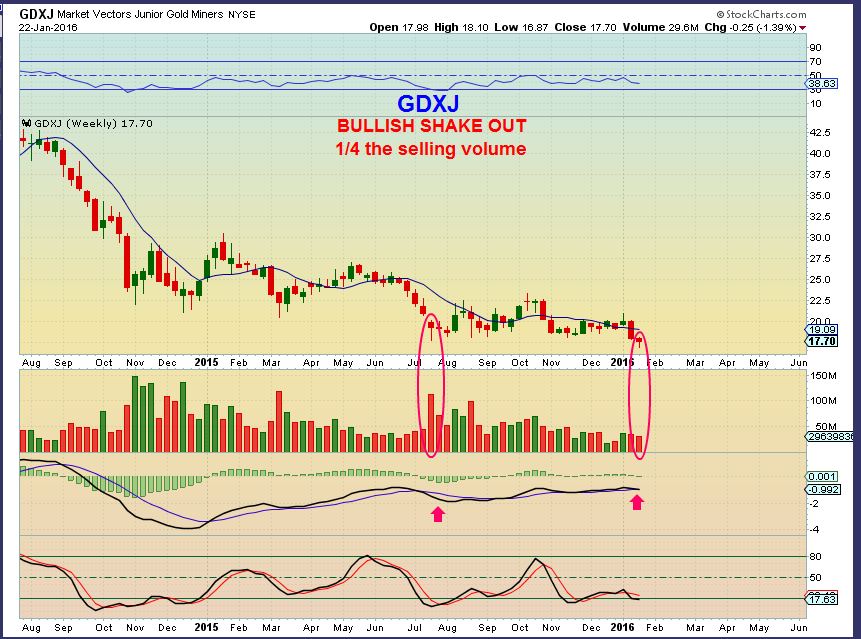
GDXJ WKLY – sellers drying up.
 .
.
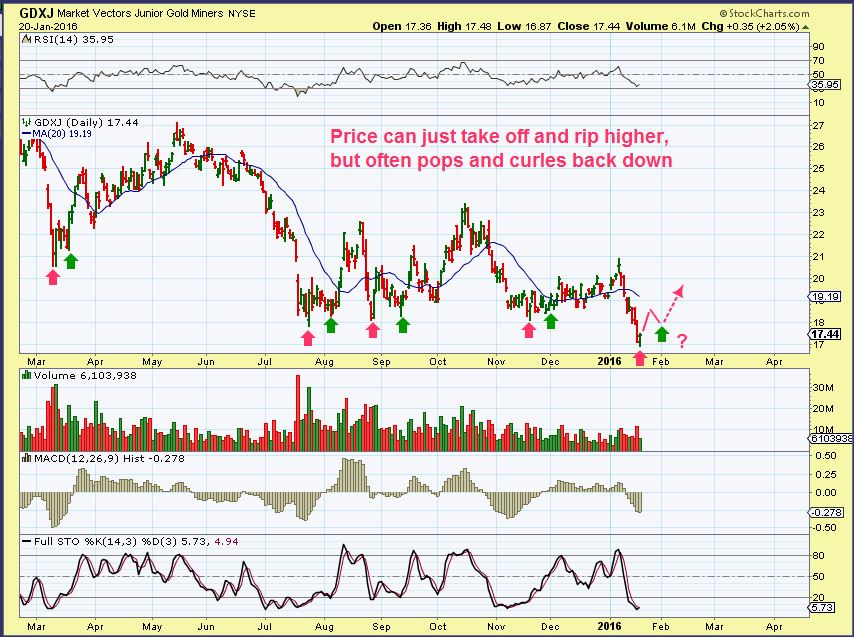
GDXJ DAILY – On Wednesday I pointed out the fact that we could linger at lows and then take off upside.
.
GDXJ broke the trend line , now we want to see a 10 sma break too.
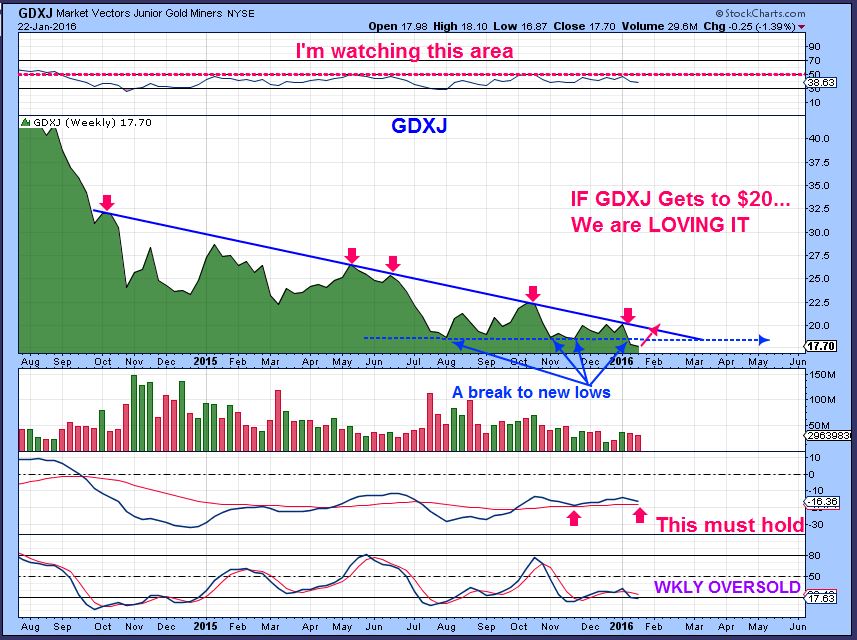
GDXJ WKLY – I accidentally drew 2 weekly GDXJ charts, but saw similar things. Looks like a shake out, reversal candle – where selling pressure is getting very light.
GDXJ – A break & Close above $20 in the future looks like the start of a bull run.
SO I am bullish short term in many areas. The General Markets should bounce and even run for a couple of weeks, but I will be watching it as it gets to overhead resistance. OIL has put in a low. Energy stocks are popping like crazy. Is it a Final low (ICL) or a daily cycle low (DCL) ? I’m watching that 20sma again? Time will tell. Miners look ready to pop & run higher from a double bottom with a weekly reversal candle. Look at the chart of GDXJ above. Stops could be placed right below the weekly candles lows. This week looks bullish in many areas, I look forward to seeing how things act from here. I think we are seeing set ups for long trades in many sectors. At times we get that initial POP and roll to a higher low , so I will look for set ups like that going forward too.
~ALEX
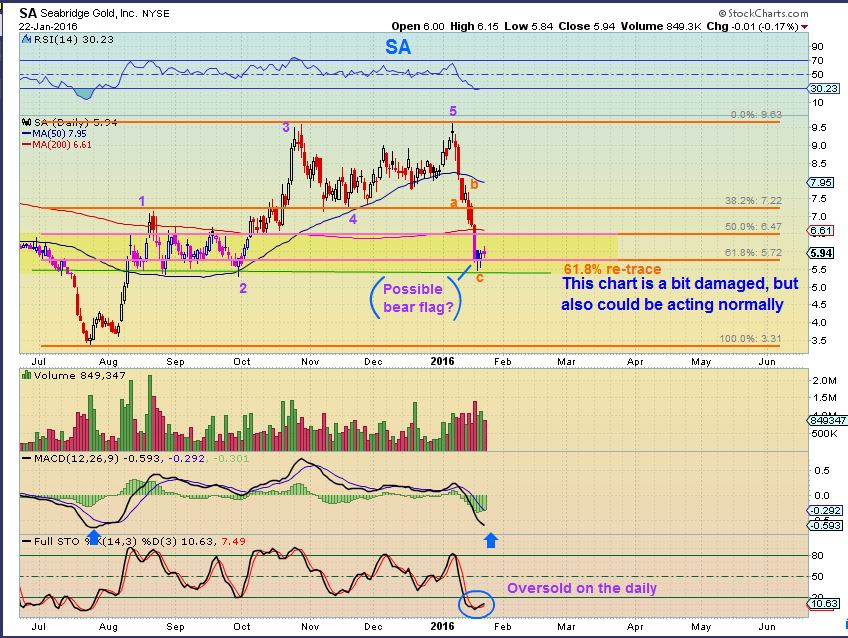
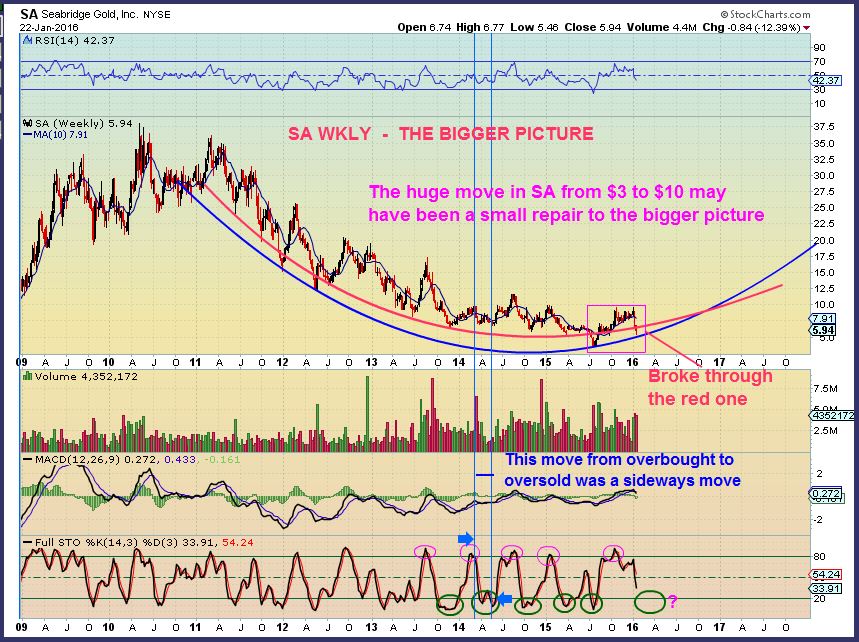
I received an email about SA. This was one of my most bullish Miners this summer, and it was acting correctly from $3 to $10. What is going on lately??? 
Well, after such a huge run up, it may be getting a semi-normal pull back with a little panic in there too. We got the 61.8% retrace. We are on a support area ( Yellow cloud) . We are oversold. Is this going to move higher if GDX / GDXJ pop? Or is that a bear flag forming the last 3 days? We’ll have to wait & see, but lets go to the bigger picture too…
.
SA WEEKLY – You can see that the huge move from $3 to $10 was nothing in the big picture. This stock could return to $37 some day, and this was part of the bottoming process. Rather amazing looking at it this way. Bottoms are a process and sometimes they go straight up, other times they ‘Bottom out” in whatever way they wish. This weekly has more time to get oversold, but I pointed out that a sideways move can accomplish that too.
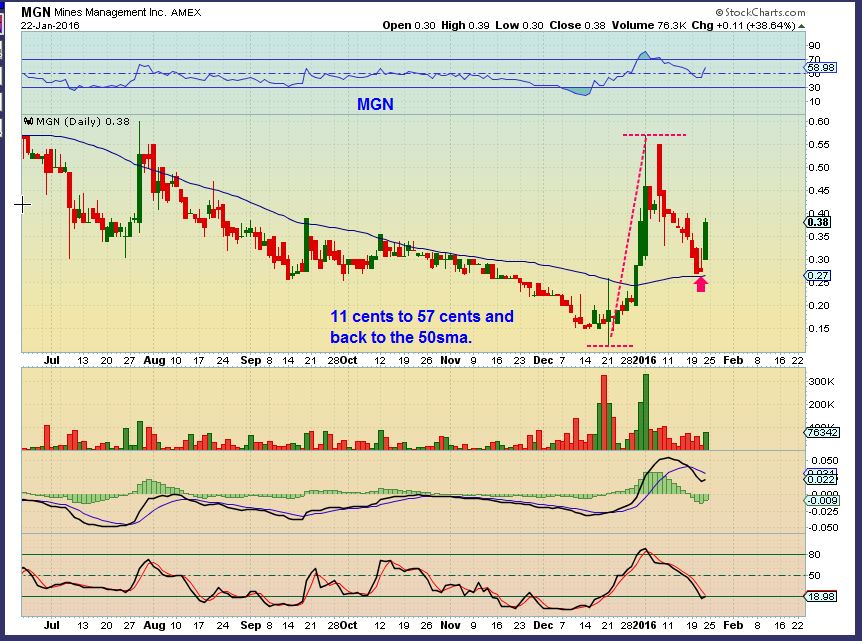
MGN – Bullish Pop


Excellent report Alex.
I was just looking at that monthly 10 & 20 MA cross chart yesterday….excellent chart !
I do have an ask: Would you be willing to cover bonds on your week end reports in the future? I am assuming that those that are in cash are in some sort of bonds so it may behove us to atleast keep a weekly eye on them ?
hey Ken
which report did you post your latest chart with ‘counts’
I didn’t have a chance to study it then & would like to take a look at it again …
tx
M
Hey Maria,
I hope this is the one your looking for ?
tx ken
Your welcome ………
Ms Maria …….. will wave a up be 3 waves or 5 ? 🙂
mmmmm .. yes… good question…
**ask the mountain whilst you’re out there playing around….
LOL……..I will, heading out now, the “mountain” never lies ! 🙂
;o)
#Envious
Gunning for the b this morning by the looks of the futures 🙂
I can from time to time, if it help traders. I used to cover TLT, but it seldom got any comments ( Except Good ole JD).
I think what happens is, when I am writing a weekend report, I look at 3x as many charts as I put in the report. I use a number of different indicators for the same charts of WTIC / GOLD/ GDX, etc etc and I may look at the $USD:$YEN / GDX:GLD / I might look at EDZ , Shanghai, etc etc , but I cant capture & post everything that I look at. It would take too long time wise., so I think I dropped TLT and NATGAS for a while , and brought NATGAS back when it started perking up.
I’ll try to remember bonds for you. What ticker (s) are you looking for?
TLT please. Thanks !
If If SPX is in a corrective wave 4 with a final wave 5 down in near future bonds will/should 🙂 increase in value as a safe haven. imho…….
Yes – It has been during this sell off ( A lot more than Gold & Miners, right?).
Yes indeed.
I think your platform switched oil contracts early (normal, that’s where the volume went), but the front month bottomed out at around 26.15 before expiry. So your target was uncannily bang on.
I know, I was thinking the same thing Kelkun.
It happened to me with NATGAS in December too ( I think it was December) and it messed up my downside target when they raised the price on the charts ( if that makes sense). I was watching that target in Oil and then when it rolled to the new contract , I think price changed .
I have a friend that lived in Scottland and he always says “Spot on” or “Bang on” too : )
great job CF….
MadCool charts… loving how you show the different timeframes & and your use of ‘arrows’ is invaluable to me … really get the ahhhHahh.
Digging the EW counts as well … thanks for including them; really helps confirm possible paths . For some strange reason, even when you don’t include the counts, when I look at your charts in particular, the counts automagically appear – it’s pretty cool I gotta say, but at the same time it’s kind of perplexing**.
I wonder if that happens to other people as well …
**then what follows is usually… either .. “Sweeeet – i have that count” orrrr “what the ….. how did i NOT SEE THAT? ”
lol #TRUE
Hope all you EastCoaster’s are safe and warm … Have a great week!!
Hi Maria, Thanks, and those counts happen to me too, either mid point or especially in hindsight.
Thanks for another excellent report and insights…
I see GDX up in premarket. I know you had suggested a low risk buy middle of last week. When do you think we will have confirmation that the final lows are in. Do you think, its confirmed already ?
Hi GOLDSA
I dont think “The Final Low” will be confirmed until we see improvement on a weekly basis. We need to start seeing higher highs and higher lows to get an uptrend first, so for now I just try to play the move off of these lows ( possibly just temporary lows), And see how it performs as it moves higher.
I have been pointing out ANFI as a stock that was not getting hurt during the sell off. ( refresh for Jan 20 chart)
It just popped about 30% at the open.
.
whew…MGN no slouch either…
And of course those African miners. They just dont pull back enough for me to be comfortable buying the dip, and off thy go higher. ( HMY, DRD, SBGL, etc).
And of course I bought and sold GFI and off it goes too 🙂
Hey Ken,
Just grabbed a quick TLT WKLY. It has been a slow steady climb since November . The climb was a lot steadier and determined in 2014. Could be consolidating into an inverse H&S with a target at new highs, but then it may get overbought. Refresh
.
Not sure if it double tops there or beaks out & continues on. I’ll keep an eye on it.
Thanks Alex !
I did not “see” the H & S formation but I am watching that TL …… maybe it will hit it at the top of wave 4 on SPX. 🙂
When I remove my rose coloured glasses, I see that, really, GDX has a lot to prove before I should be a believer.
I think the GLD/SLV ratio will play an important part – needs to show a weekly close below the moving average.
(refresh for picture)
Hey Irvin – Yes, as a trader shorter term, I say we go up from the shake out as shown in the report, and we do see follow through over the past few days.
Longer term, Miners have been in a bear market and need to do some work.
Now look at DRD, HMY, MGN, SBGL, and a few others, signs of life in a dead sector.
Hi Alex,
I think we don’t have to be afraid that gold this time produces a weak rally as last year May.
The reason that last year January the banks/players who are controlling gold price almost lost the control of gold, because of the SNB decision. That is the reason that gold made a false breakout in January.
After January they didn’t allow gold to produce a strong rally because the bear market was in danger, and they wanted to run the stops later in the summer.
But in these days gold looks much more weak, so even after a nice rally gold price can be controlled…
Thanks Bear Trap
Interesting thoughts. Yeah, bear market rally has been crappier and crappier to the point that you can’t even trade them to the long side anymore. I have no interest in PMs currently.
Almost nobody …
And that is the good recipe to finish the bear market.
Only smart money will have gold miners shares and gold.
Not too worried about market pull back today, too be expected when Short-term indicators closed overbought Friday. Seems orderly vs. fearful looking at intra day price and watching VIX. Glad I didn’t chase WTI Crude on Friday, bit more of a pullback today than I had hoped for, energy getting smashed this AM.
Also suprised gas couldn’t get a better pop based on the Blizzard (news affects the masses even if we don’t trade on it). Inventory numbers for Nat gas are as of previous Friday so we wouldn’t actually get any potential additional useage in numbers until report on 4 Feb. I did my part, burned a ton of gas all weekend, finally finished digging out of 2 feet or snow, now I’m going skiing!
If there is anyone doesn’t we are going lower before too long, today was pretty much absolute proof. The change of character is palpable. I’m definitely going to stick with the roadmap laid out in this weekend’s report.
CLGRF
Very nice break on ABX , GFI setting up nicely
HMY, DRD, GFI, MGN, ABX, SBGL continue the upside after a 1 or 2 day sell off.
omg… did u happen 2 catch that action in CRK … H O L Y
No – until now. Wow.