
1-21-16 – Prepare For A Bounce
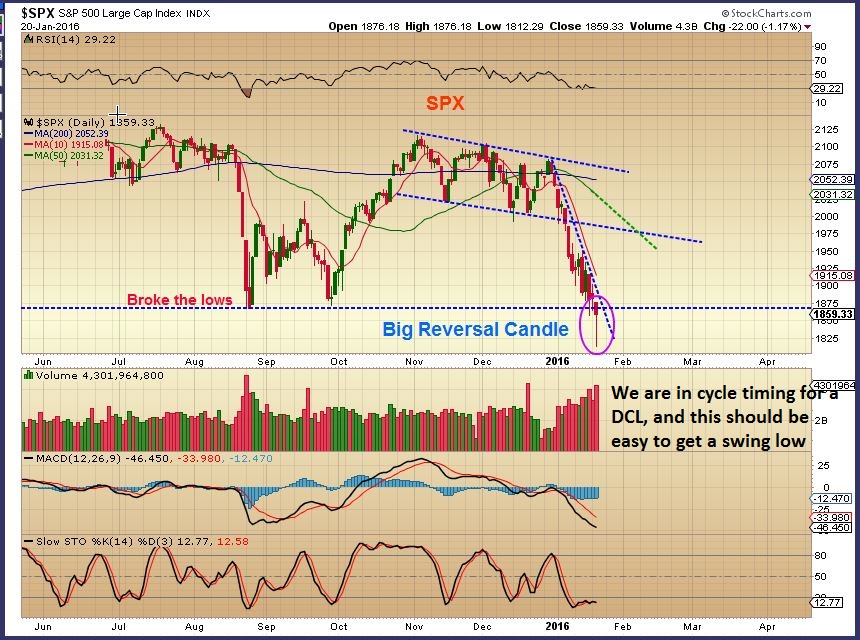
The Dow Jones Industrial Average was down over 550 points yesterday and then rallied back into the end of the day, putting a form of reversal candle in place. Thursday morning the futures are RED, but we are at an extreme point that calls for a bounce/ rally. Yes it could last for days and weeks, but is the selling over? Lets review the markets and some stocks.
.
The SPX put in a large reversal candle too, after breaking below the August lows. 1730 is a normal downside target, but I think we rally first. It should be easy to get a swing low. A move above yesterdays highs begins the process.
What do I expect from this move higher after it starts?
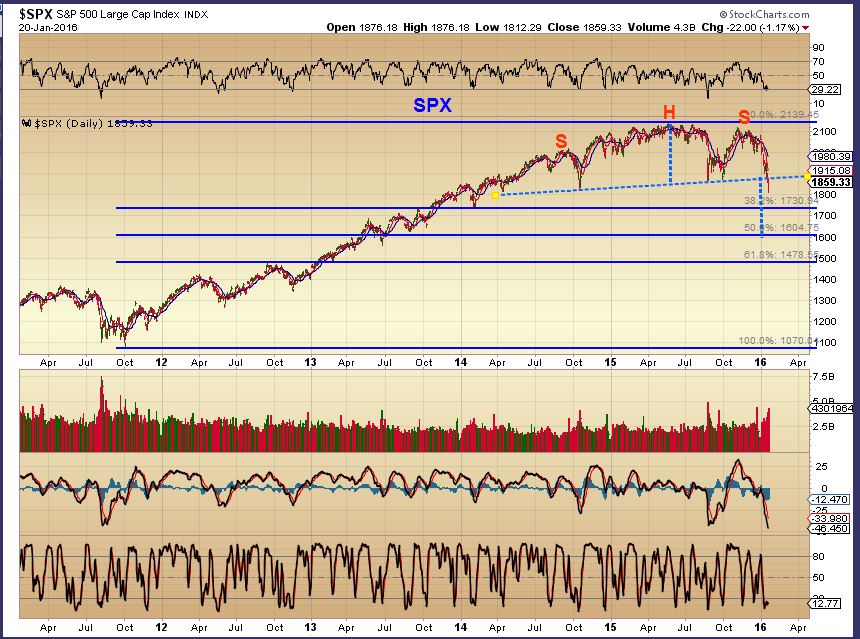
SPX WKLY– You can see the 1730 as a 38.2% retrace, but 1604 is more likely.
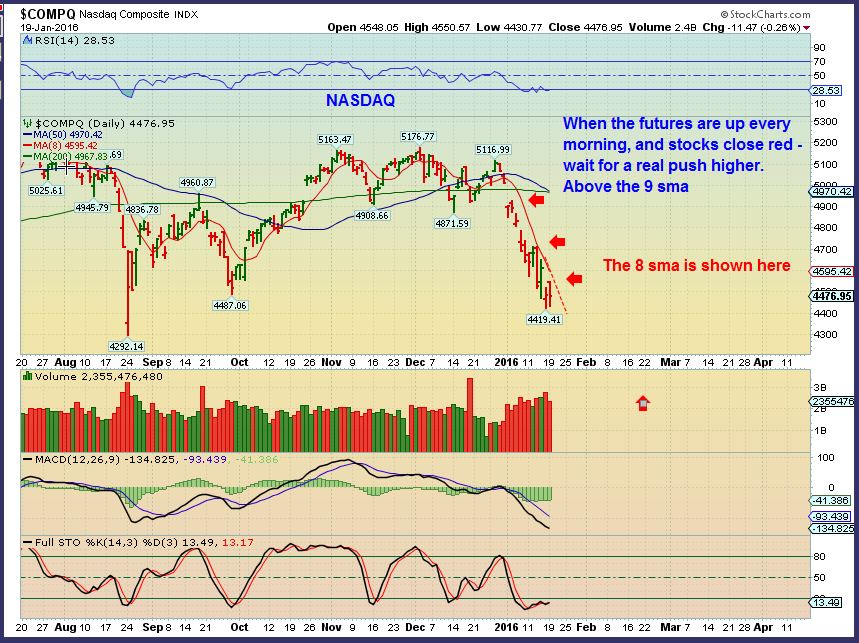
Reminder : Yesterday I said that one should wait for a pop above the 9 or 10sma & used this chart
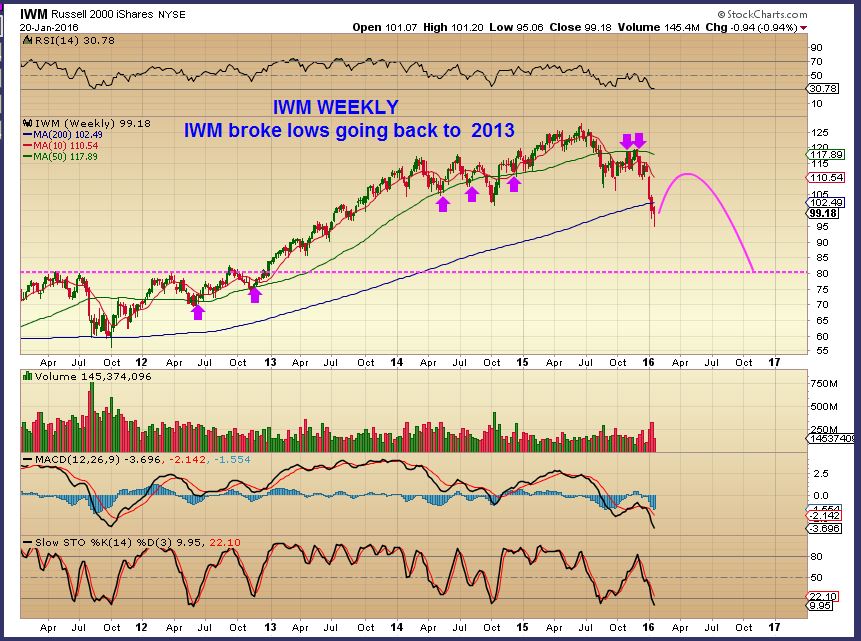
IWM – This is a break down. Unless we get an all out plunge right now, I think we will see something like this. I will explain a bit more in the weekend report.
Notice that all strong reversals do not ‘stick the landing’. They can be short covering, but if at first you dont succeed, try try again? This “Selling” looks to be exhausting for now.
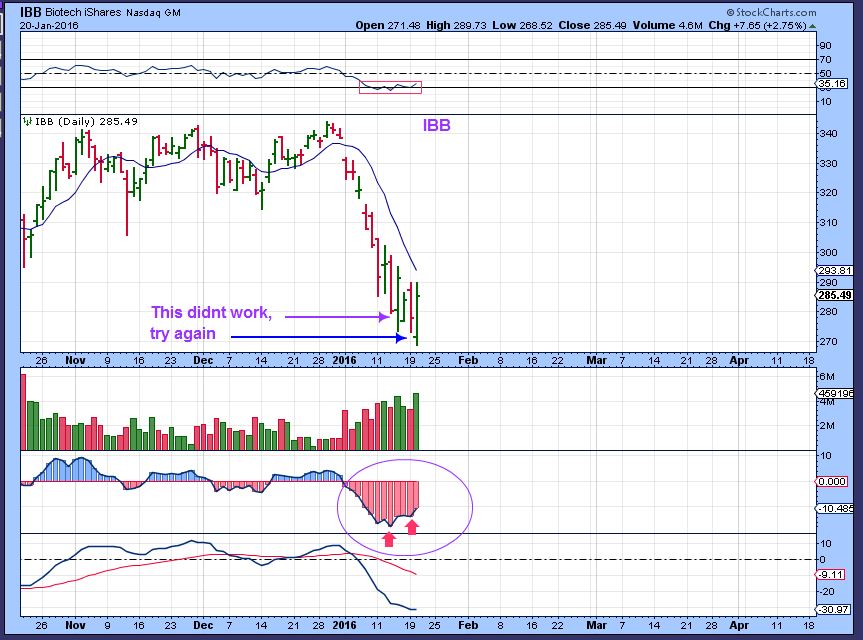
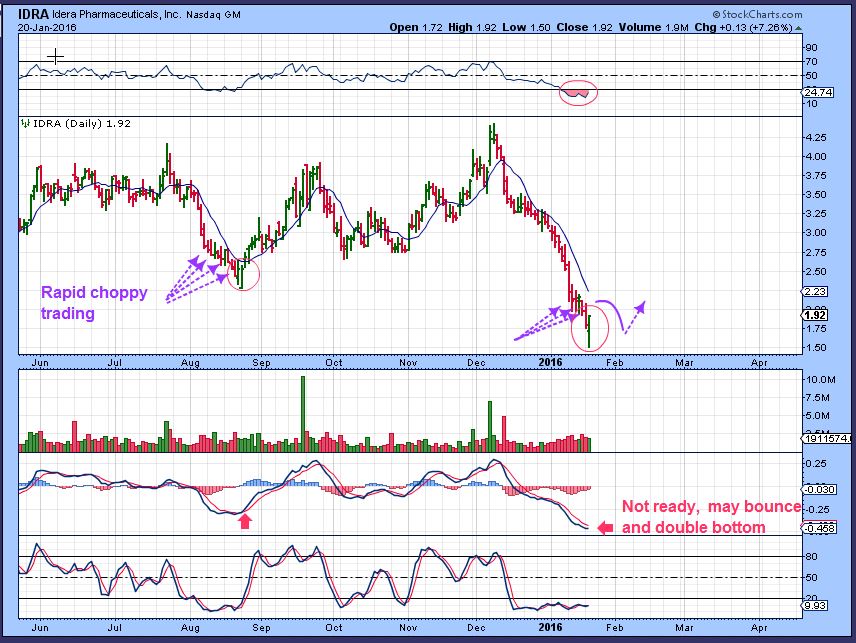
Many Biotech Stocks had real looking reversals, and if we are going to get a decent bounce, some short term traders may want to trade the bounces. IDRA, TROV, ZIOP, etc turned green yesterday. Augusts crash produced a 3 week rally in Idra of over 90+%.
.
WTIC –
Do you remember yesterdays report I pointed out what looked like the start of capitulation volume?
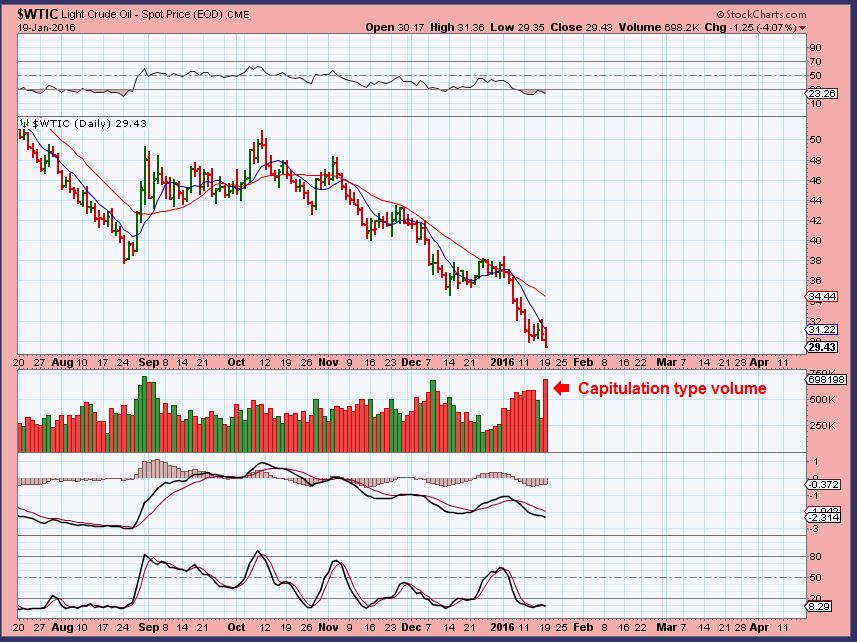
Wednesdays volume dwarfed it ( almost double). IT is too early to call this THE BOTTOM, but that does look like capitulation. Back in NOVEMBER my target was $26+, and this may be close enough. I believe the OIL contract rolled, so the numbers readjusted? Notice how the 20sma was holding oil down ( red arrows), now it even struggled at the 10sma. OIL is tricky, most should wait for proof of lows, though the short covering rally may be fast & furious like NATGAS was.
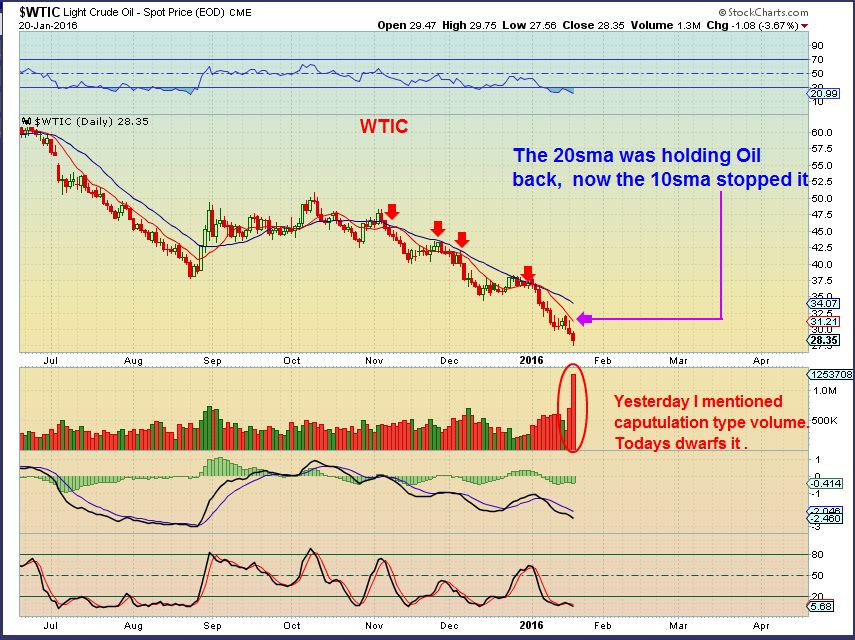
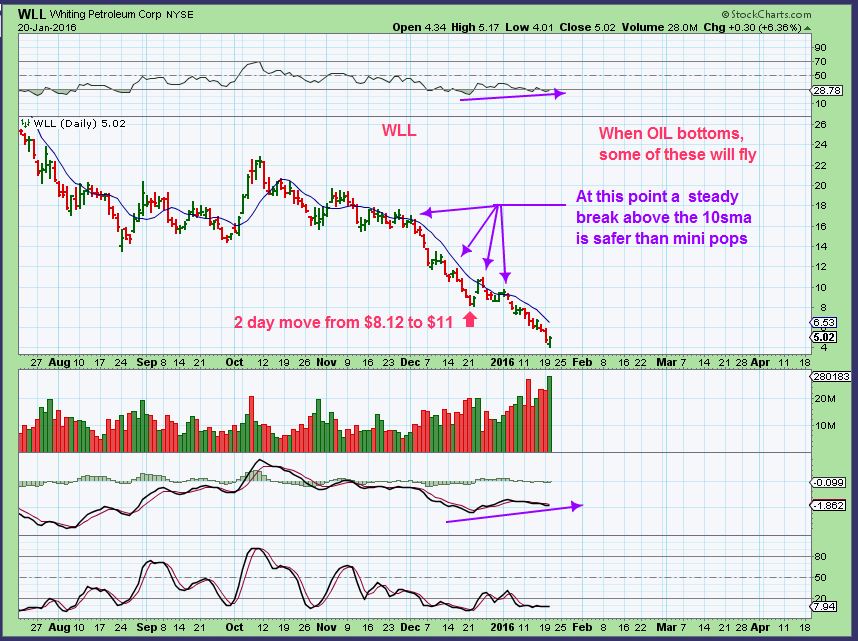
The hard part is that we see our old favorite OIL stocks bouncing 20 – 40 % in 1 day!! The problem is, we see them dip that amount too. I have received emails that people want to trade this bounce. IT IS RISKY. Everyone is waiting for someone to call that bottom in Oil and buy Oil stocks that will double & triple. My advice = ONLY EXPERIENCED TRADERS should trade this area until THE lows are in. With OIL I am watching that 20sma for longer term relief.
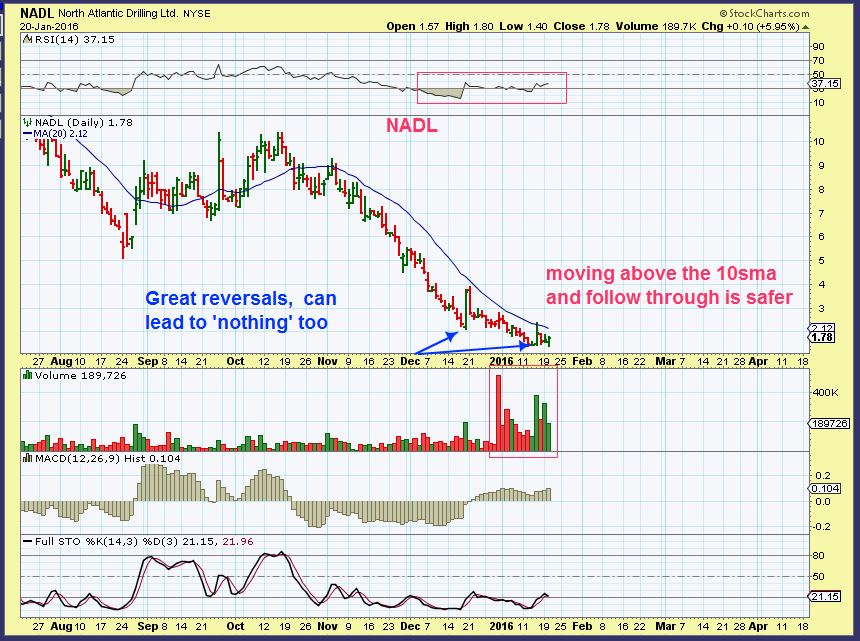
Yes, we saw some reversals yesterday, but you can see that NADL already had 2 large reversals without follow through. We’ll see if these get any follow through above the 10sma, since these could just base out too.
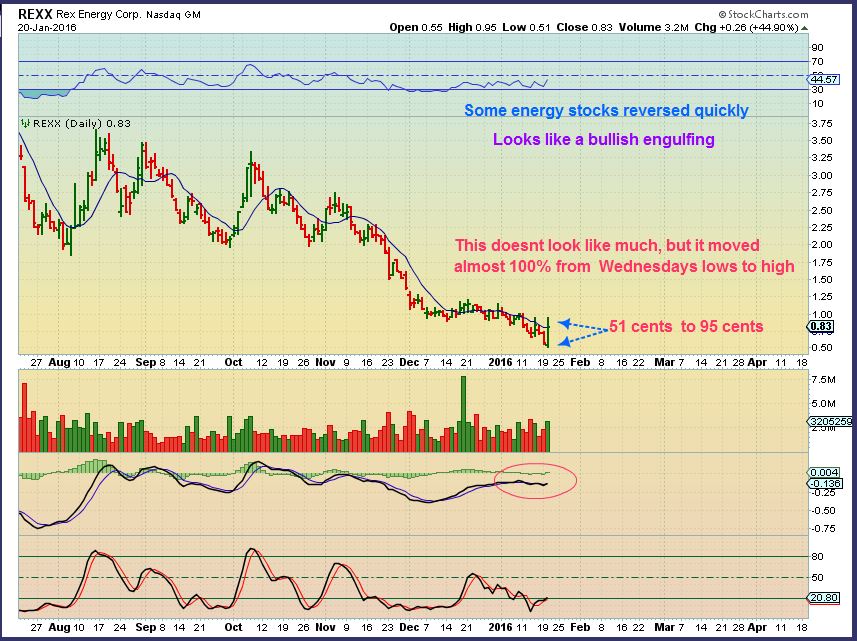
Tempting when you see moves like REXX had yesterday. A 100% move higher from lows to high.
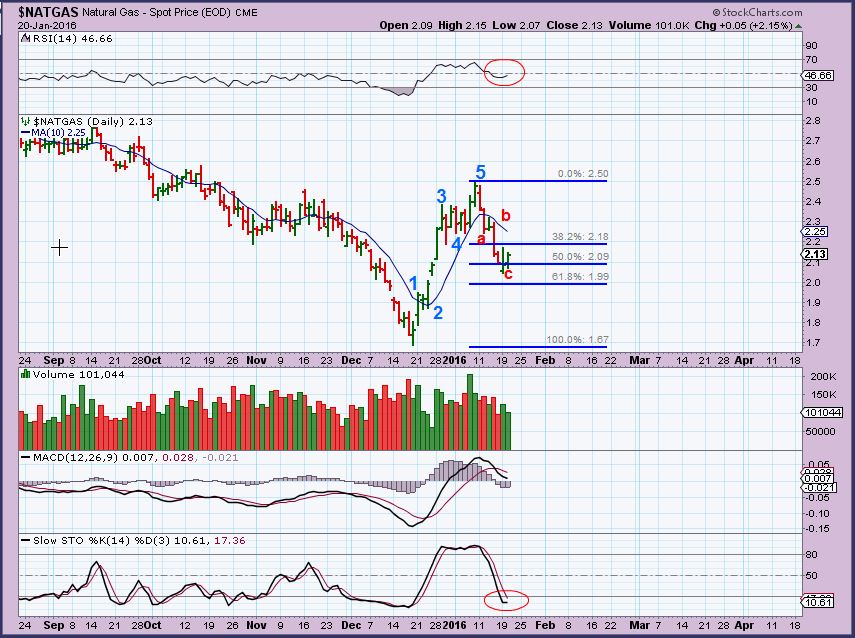
NATGAS – This is a possible count in NATGAS, and that would indicate a move higher. I looked at the Futures this morning and the recent move also looks like a bear flag, so anyone taking a position should keep a stop below recent lows (C) for safety sake.
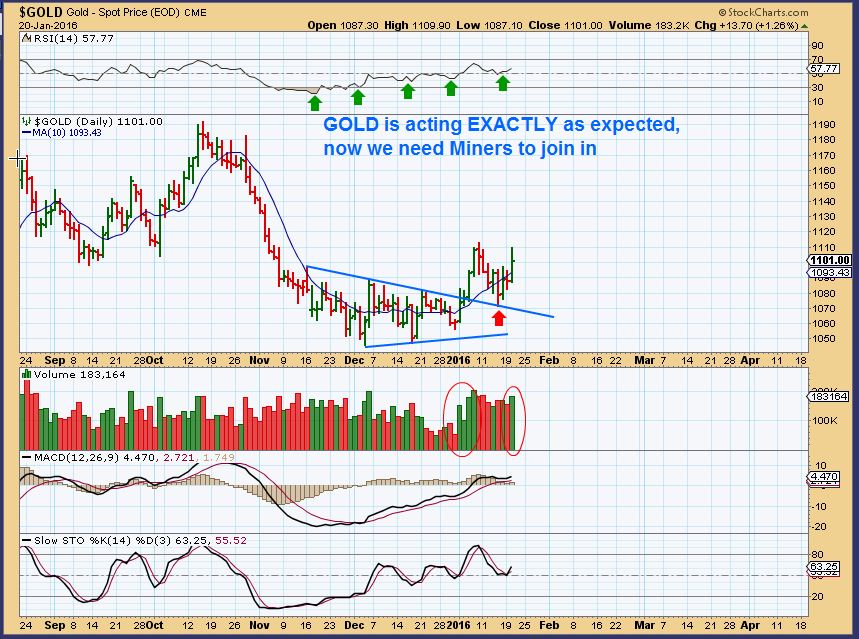
GOLD, SILVER, MINERS
Oh my word, what can I say about this sector that hasn’t been said in the last 10 reports 
GOLD – I dont like to tell the markets what to do, but, “Hey GOLD! You should be moving higher here!” The set up remains Bullish technically and cyclically.
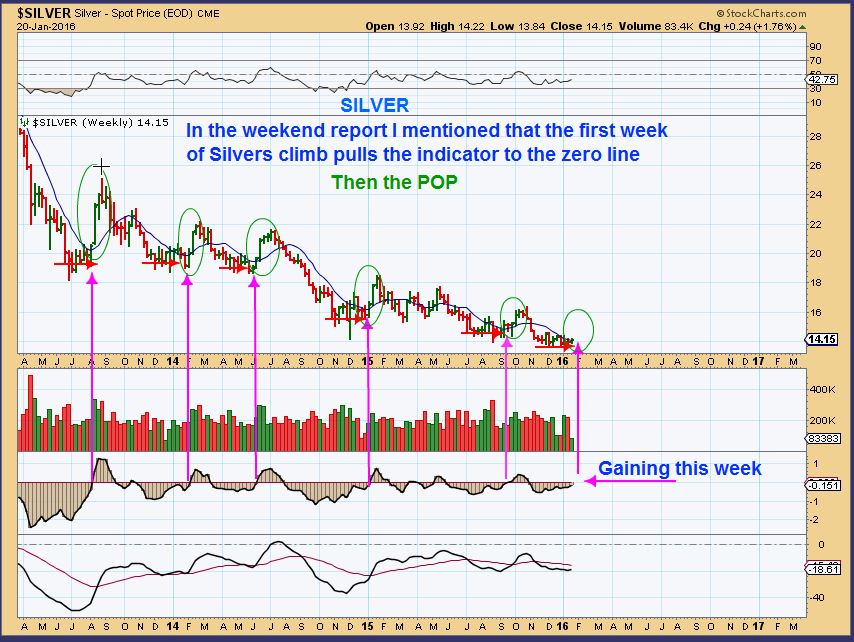
Silver – This week is already pulling the indicator to the Zero line after the sideways move. We usually get a POP after that.
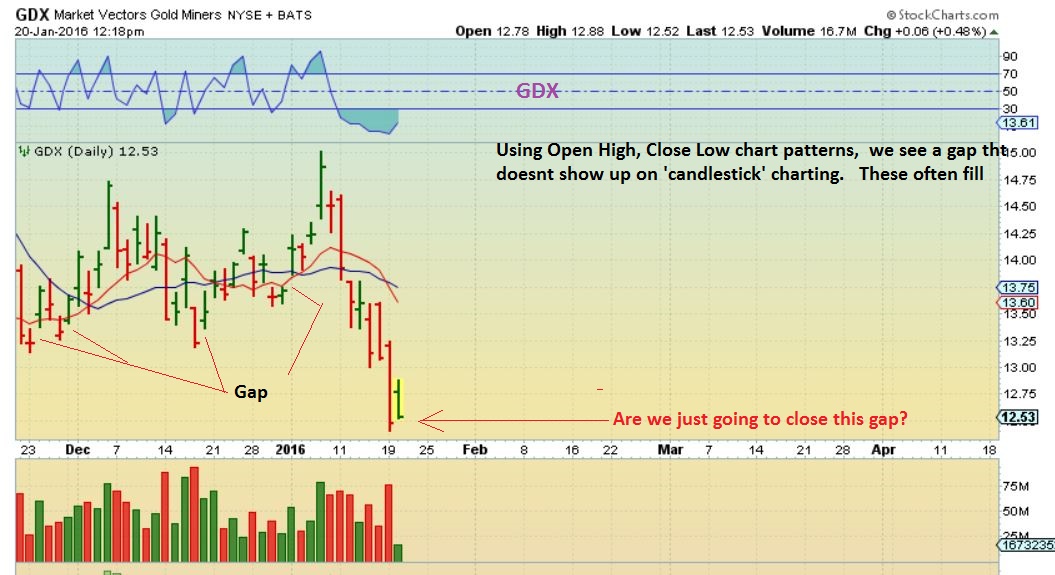
MINERS
GDX Intraday -I drew this chart for a friend of mine. GDX was dropping and many got frustrated that Gold was higher and GDX gapped open and dropped, so I pointed out GAPS that often fill, ( better now than later).
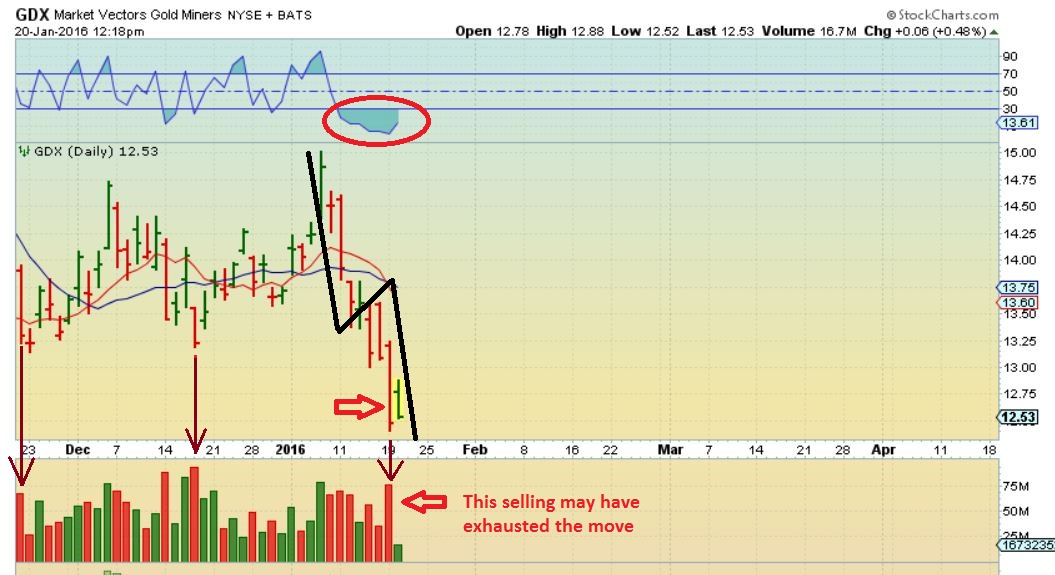
GDX – I also see a measured move that may be complete, and drew this at Noon. Possibly the selling was exhausted in the Tuesday drop.
BY the end of the day, we reversed higher and even recovered the break down. So that gap filled and we have a reversal so far. If Gold moves higher, maybe we can get Miners to follow through, even rally?
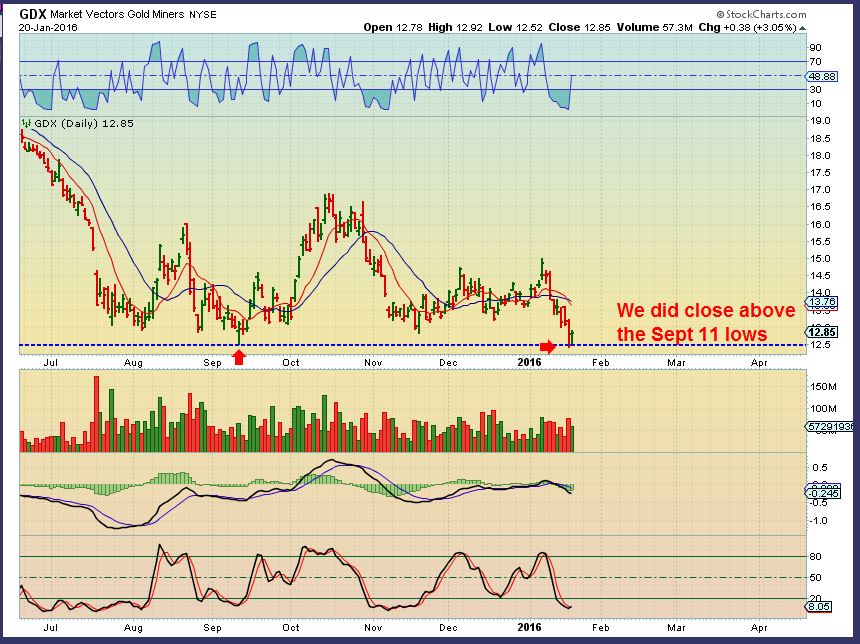
This usually leads to further upside. We want to see this hold or improve Thursday & Friday for a bullish weekly chart. IF IT CANT, Miners are very weak.
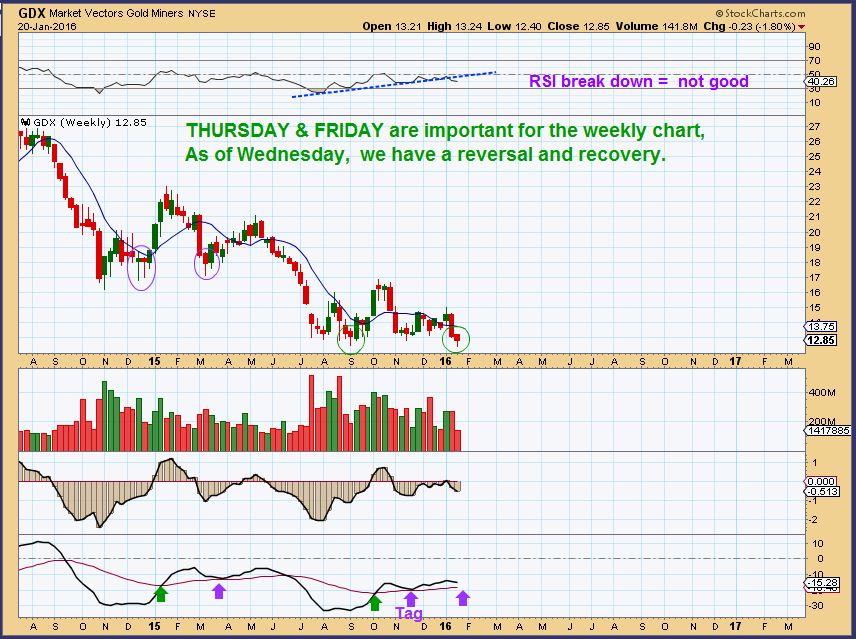
If the GDX & GDXJ reversed, some individual Miners must have too, so lets look at some individual Miners.
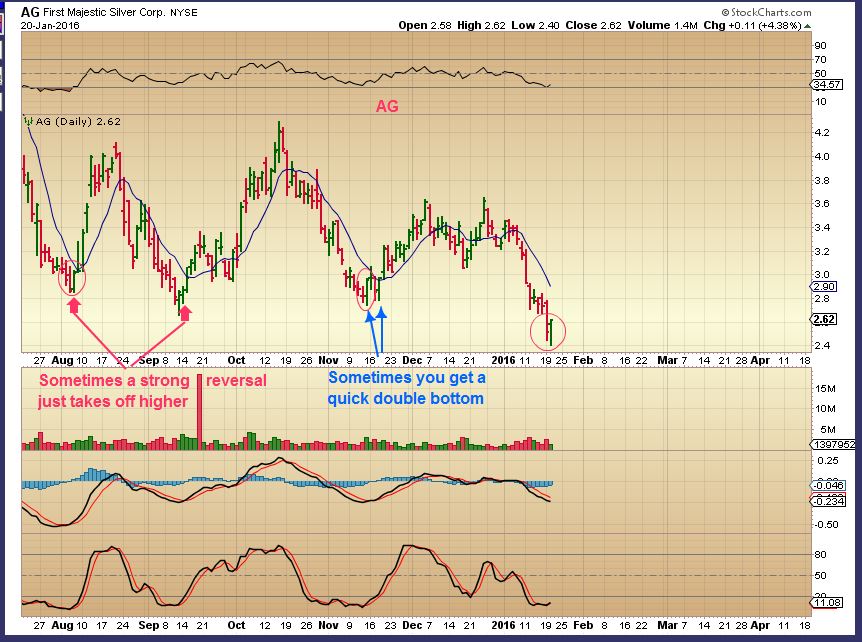
AG – A Silver stock with a nice reversal. Read the chart though.
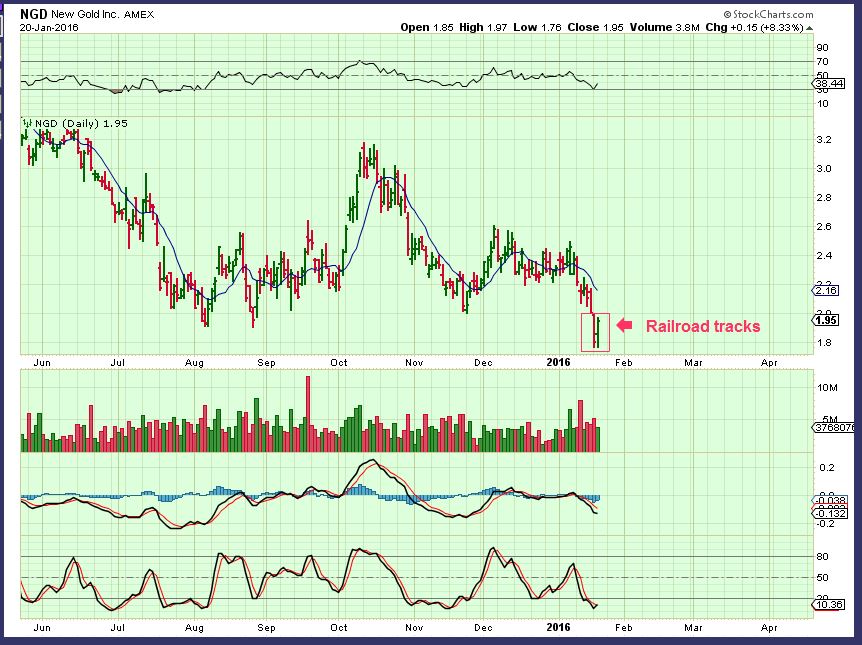
NGD – These are called ‘railroad tracks’. I often see this slam down / recovery of equal length as a rejection of lows. I usually buy these if I am interested in the stock, because under certain conditions I have seen this as a completed rejection of the lows. Selling is complete in most cases. We’ll see .
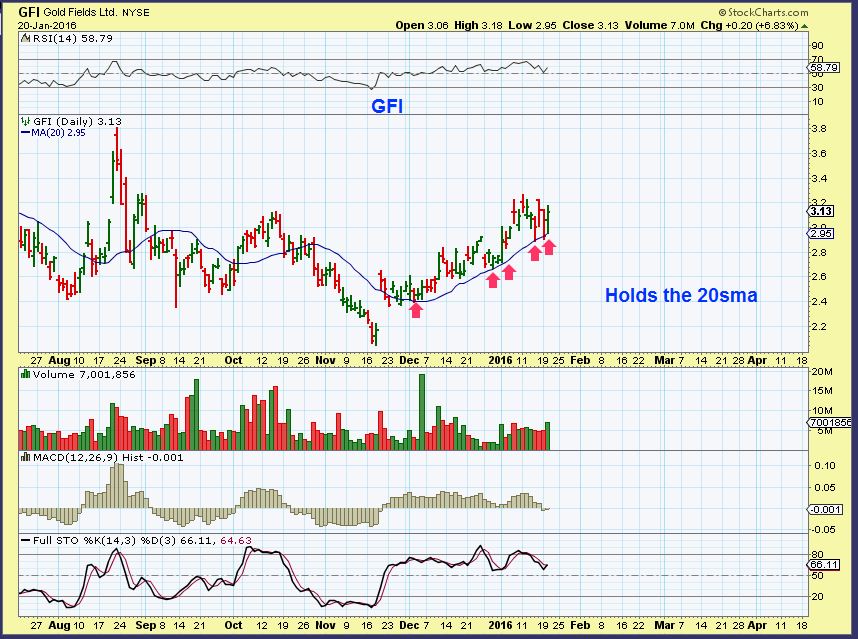
South African Miners look very Bullish. Some are DRD, HMY, GFI, AU, SBGL. Look those charts up, they are doing very well, and even GFI is holding its 20sma very well while trending higher. I bought and sold this right on the 20sma like a fickle child – Lol.
SO all I can say is that the set up in Precious Metals remains Bullish, but the follow through with Miners needs follow through this week in my opinion. We want to see a break above the overhead down trend line & 10sma to be more comfortable. I do think Miners will run higher as Gold continues higher. Be patient if choppy bottoms frustrate you.
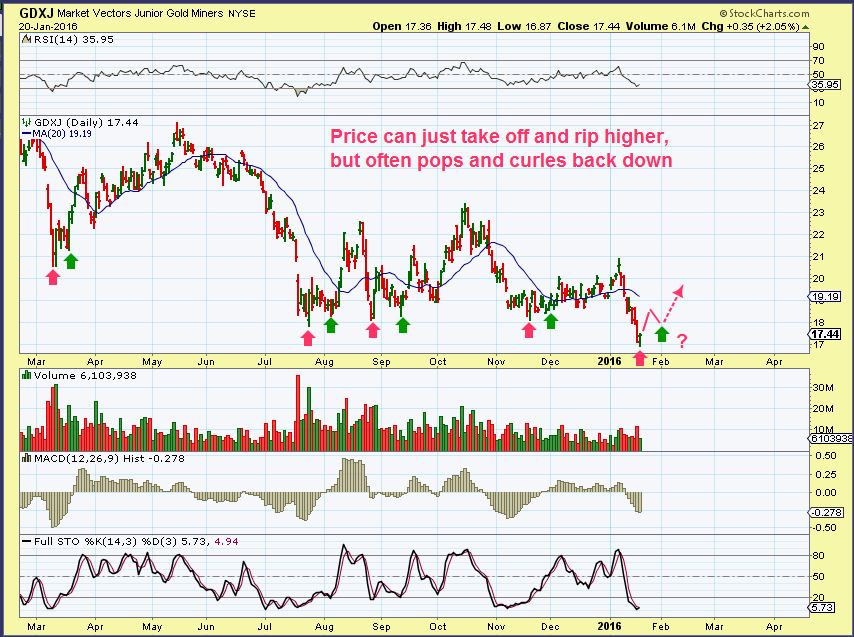
If you have been here for a while, you know that we’ve also discussed in the past how GDX will run up for 3 days and then curl back down in a 1-2-3-4-5 type move. That 1-2 move is when you can buy the dip if you are patient.
GDXJ is a good example of the pop and drop back toward lows.
I always say that my weekend report covers Monday and I have Tuesday, Wednesday, and Thursday reports. If nothing changes by Friday, I’ll just see you in the weekend report. Then we have a Draghi decision today, Oil inventories, Natgas report, Jobs report Friday, etc etc and everything goes crazy : ) . For the past several weeks, I have had a Friday report anyway. So let me just say that I think what I have written in this Thursday report should cover Friday too. Even if it does, maybe I will post a few trade set ups if things line up correctly. Either way, thanks for being here and being a chart freak too. Happy trading!
~ALEX
.
Follow me here at Twitter for alerts when I post a premium report. My other Twitter account posts public content.
https://twitter.com/ChartFreakAlert
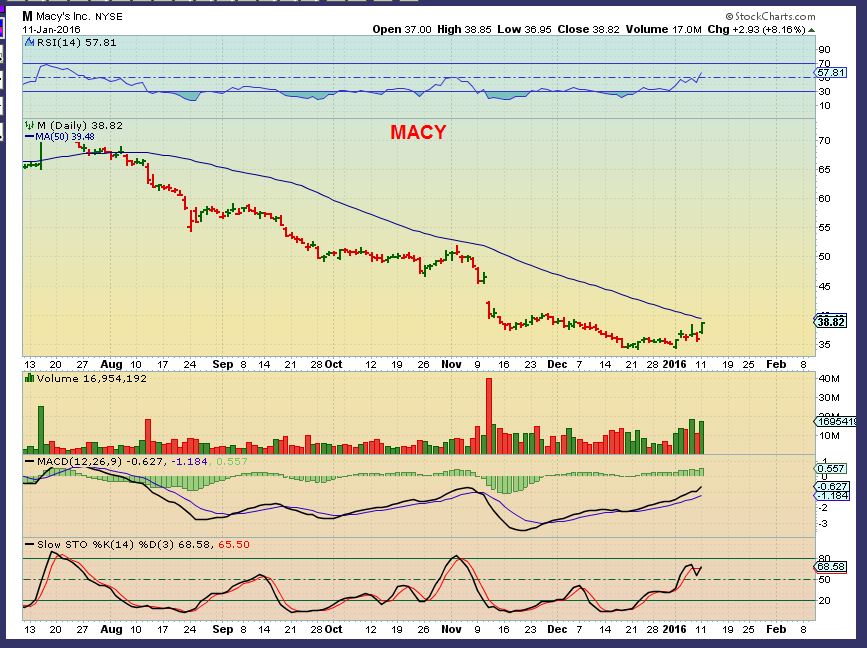
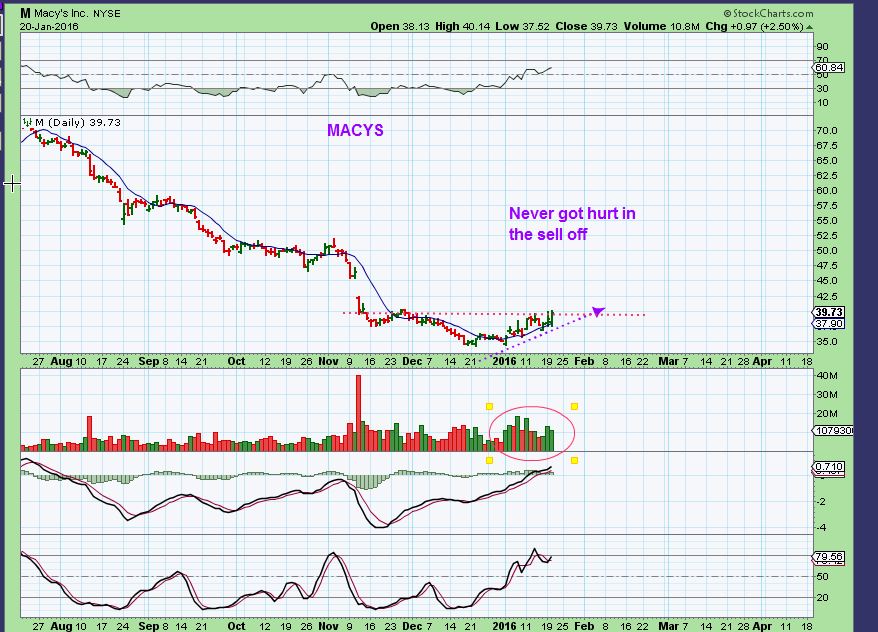
Sidenote: Before & During the market crash, I posted several nice set ups that had already sold off and bottomed. Did you know that they have remained relatively unaffected by the recent crash? Some picks did sell off like my GDDY, DANG, etc, but take a look at these. IF WE GET A MARKET BOUNCE, these may perform well since the sell off didnt hurt them.
I pointed out MACYS, JC Penny , and WMT (Wal mart) as basing out.
M – JAN 11
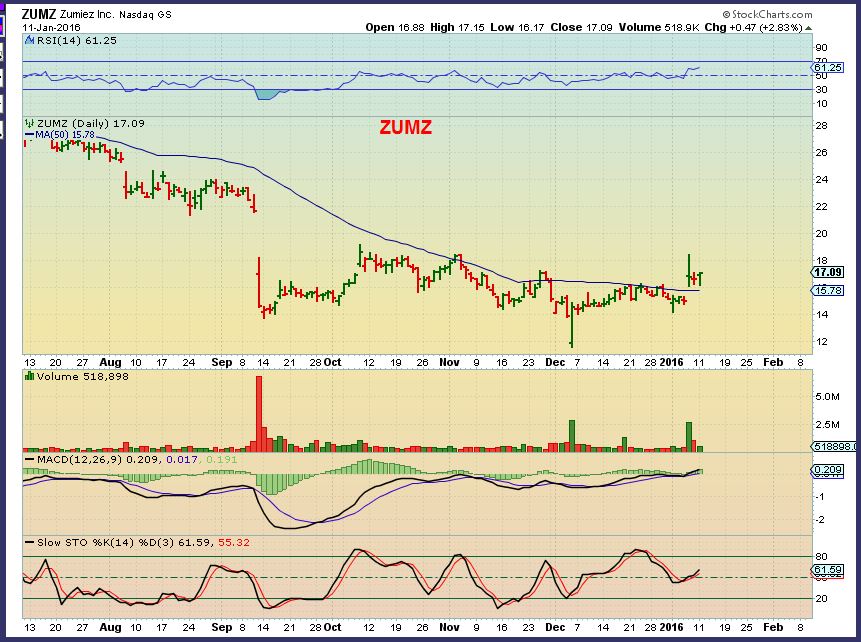
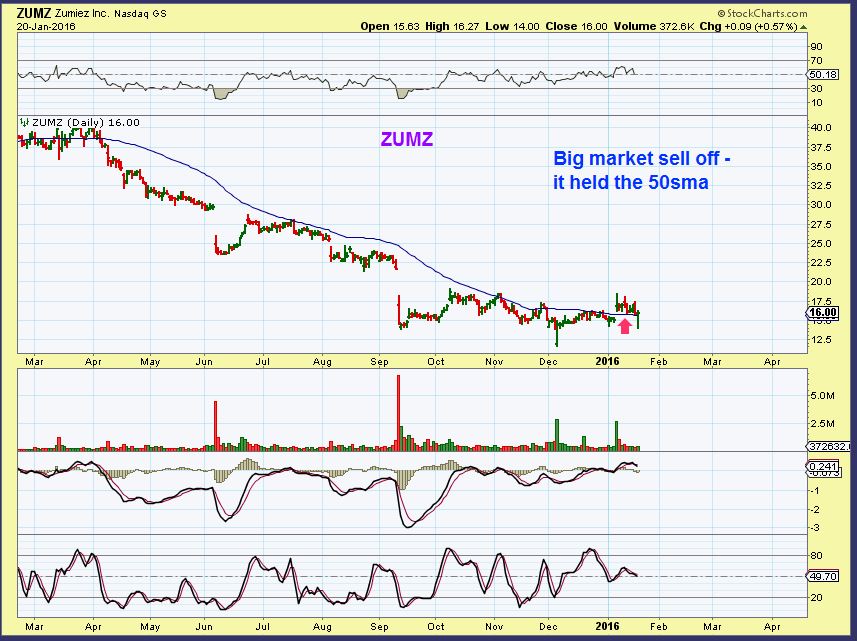
ZUMZ – then and now


Great charts, as always. What is the indicator on the $SILVER chart? Silver is down today but the weekly candle may still be intact. Can’t tell for sure til end of week.
dear fickle child
IluvIt 🙂
hey.. muxie’s standing proud on that 50day….will she or wont she hold… hmmmmmmmm
https://www.tradingview.com/x/lzz3ZWBA/
Maria…. what does this mean? “dear fickle child”
May I ask you (not to brutal) how old are you?
Just saying……
With kind Greetings.
hi Geurt
that was for CF in reference to a sentence in today’s report
** i’m told it’s impolite to a lady her age … ;o)
*** my apologies if my humor (well, make that ‘attempt’ at humor” offends in any way…. 😉
SPX count if interested……..
Thanks Ken. That general idea tallies with some other non-EW analysis I’ve done. Based on that I’m looking for that first major 5 to complete early Feb after which we should get a much more meaningful bear rally to potentially set up another really nice shorting opportunity. Currently fancy sometime in March for that, which has seen turning points of varying degrees almost every year since 2000.
Hi Chris
Hi Maria 😉 How’s things? Did you enjoy your holiday despite the lack of spa and swimming pool!!?
Interesting Chris.
Non EW = Cycles ?
It’s a bit of a combo of things Ken. Some cycle stuff definitely in the mix as well as having looked at the development of the last two major bear markets in quite a lot of detail and noted what various indicators, ma’s etc were doing at various stages. It will be intruiging if we do rally through Feb and into March and see a set up for another top. As I mentioned, March has marked some kind of turn in the vast majority of years since 2000, not least Mar ’03 and Mar ’09. You might recall those!! Lol Mar ’01 and Mar ’08 also saw important interim lows in the early stages of the last two major bears and in some major global indices at least Mar ’15 timed all time highs give or take a week! And the ways things are currently shaping up, if Mar ’16 proves to be another important turning point I would currently favour another top. But we shall see!!
I would love to see your work Chris. To be honest I have really not studied historical correlation….Alex has opened that door up for me for sure. History does repeat ay?
Hi Ken. More than happy to share information. The tricky bit is how to get it to you. I’m not the most proficient when it comes to IT!! I could try scanning and emailing some of the long term charts and so on that I have accumulated over the years. As a suggestion, if you wanted to drop me your email I could then try and send you at least some of the information I have that may prove to be of interest.. My email is fauconnaires@gmail.com One thing I would just add is that although I’ll respond as soon as I can I do have rather a lot going on right now so you may just have to bear with me a little.
… im always interested…
thank u
Then Wave 5! Keep it coming, this is good stuff. Thanks for sharing.
repeat pattern of the July low on this GDXJ histo chart.
interessssssting SOG… hmmmm
Daily Swing Buy on USO (Oil)………….Have not seen one of those since 2015. 🙂
God… i JUSSST said your name to myself…..
(cue twilight zone music) doo doo doo doo … dooo dooo dooo dooo
**as I was looking at the Oil chart …. lmao – i guess i should have included that tidbit ;o)
lol
ohMaria…. i know….
Does anyone know why the OIL etn is down 12% while USO is up 5%??
http://www.marketwatch.com/story/barclays-issues-investor-guidance-on-oil-etns-2016-01-20?siteid=bigcharts&dist=bigcharts
A little chilly right now. Will be back a little later. 🙂
This was what I meant by “chilly” in ski country. 🙂
Wow…i lost a little breath there for a minute… nice…. nice.
Powder day too a lot of fun ……. the mountain kicked my tiny rear end today! Tired need a nap lol.
do u work out there…? or is it just play play play all day every day for kenny…
Well …… I “try” to work in the mornings unless the mountain calls for me. 😉
The misses does though, she is on ski patrol I just ski. Much better gig imo. 😉
O wow.. i guess so.
U bum..☺
Lol……that’s what the misses calls me.
MmmmHmmmmm … 😀
hi ken..is that a dog kennel,, or your house (by some very tall trees) ?
looks great… what part of the world are you at?
That is a tabogon hut in case a skier gets injured where then a patroller would ski the tabogon down the mountain to the injured skier. 🙂
My place might look like that come Saturday…. Let’s go NatGas!
EXXI……….one day later, wow!
GURE will be next!
oh yeah?
hmmm .. well, what’s your magic stick say about CRK? I hopped in some for a ride…
anything like this??
https://www.tradingview.com/x/0dilRgKj/
Are we on the verge of a really big move?
like I said earlier… even if this is a ‘1’ wave… “2” will follow and my gut says it will be very deep and powerful move ….we will feel the heat so be careful…. just IMHO as a novice novice novice ;o)
omg ECR really?
Did OIL bottom? Anyone want to make the call? I did read your comments CF above. $27 pretty close to your $26 call.
I heard that the oil pop today is because of a fire somewhere.
If that’s true, then the downtrend will resume until morale improves:)
That’s what I call a “hot head”.
hmmmm … somethin somthin like this perhaps??
https://www.tradingview.com/x/wCv996i2/
Too early.
2 more weeks.
Also stocks hasn’t finished the decline yet.
Good advice, I should learn more patience. Thanks BT
Could easily bounce for 2 weeks to 20 day and then back down. B.T. you think it will follow right along with markets? Or are markets following oil? I am convinced the market will continue lower after a bounce.
BAS held nicely during the capitulation sell off in oil this week. I liked how it held lows versus the REXX and EXXI – down 20-40% then up 20-40% – might as well just play a slot machine.
BAS chart attached – measured move complete, MACD cross, stoch curling up. bottomed two days before crude (for now). Still highly dangerous sector so am not promoting buy but chart is worth checking out.
Maybe this is the reversal in markets that will hold (for now). Tried dipping yesterday, closed off highs but we’re well off intra-day Wed lows. Asia rolled over hard Thurs but Nikkie up 900+ overnight, oil +5% right now. Looks tradeable until resistance then shortable. But if you put together a beautiful plan that we’re all looking for, doesn’t that guarantee it can’t happen?