
Jan 16 2016 – Weekend Report
As expected, we have seen quite the sell off in the general markets. Oil & Commodities have been selling off too. Gold , Silver , And Precious metals are holding up, but are they ready to run now, or will they sell off? I actually spent a part of this weekend digging in to older charts and making some new ones, so lets take a look.
.
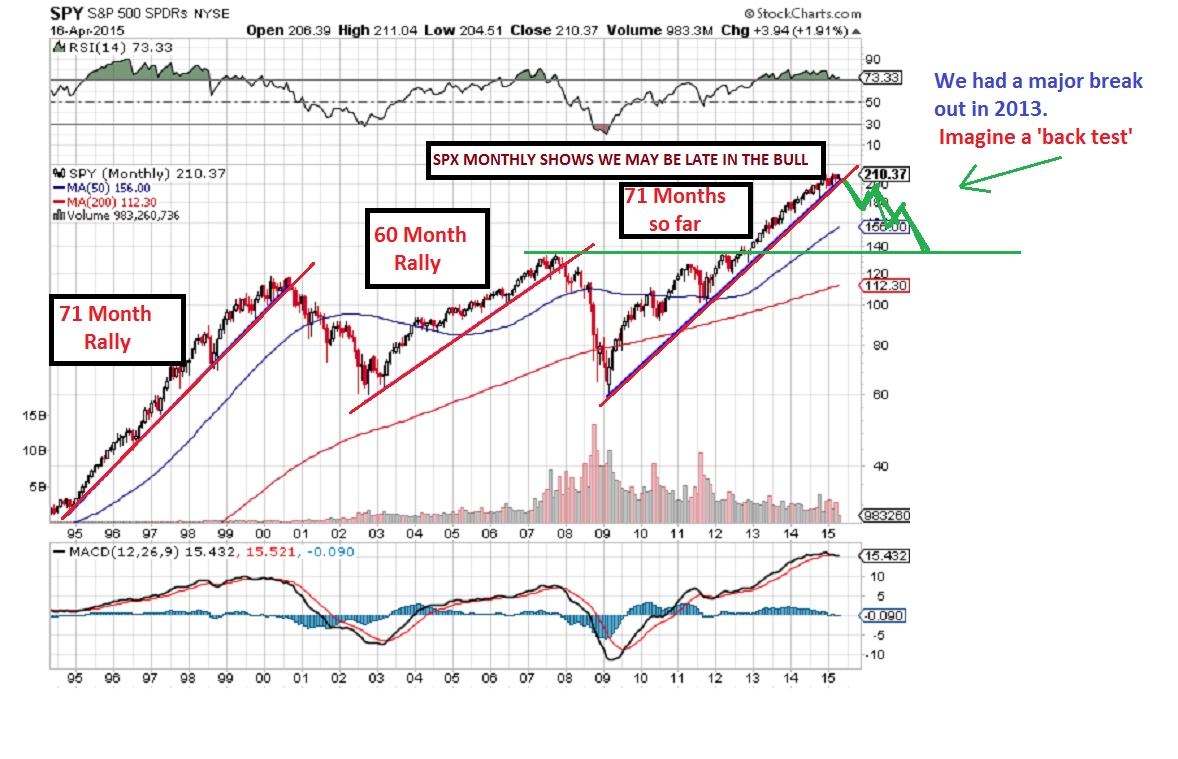
While digging into older charts, I actually found this warning chart that I posted in April of 2015, when I said I thought we were seeing that rising wedge forming. Also by counting the months of the Bull market, we looked to be late in the bull. I am re-posting it because it had a logical target to me at that time.
SPY – We topped in May 1 month later. Now drop to Test the break out?
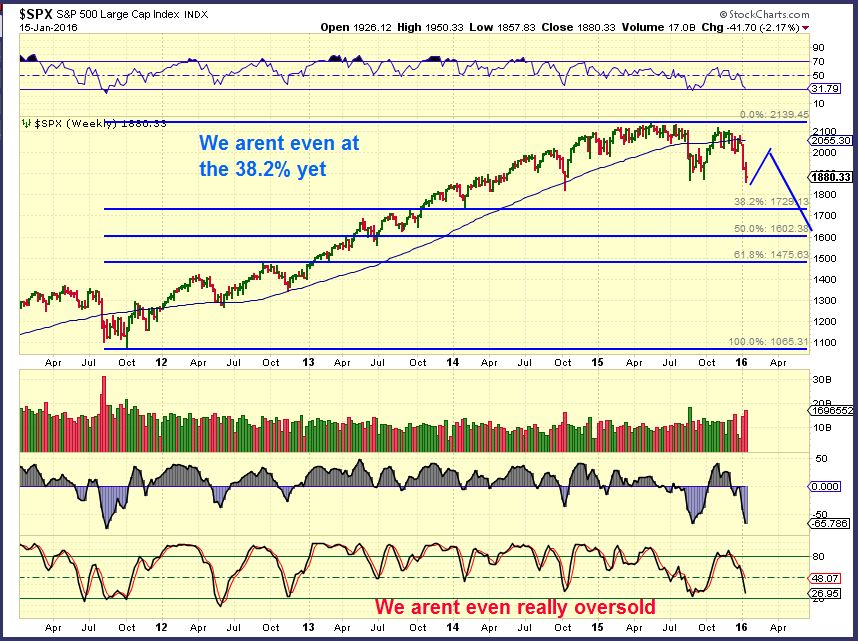
 SPX – We broke the Aug lows Friday and recovered. This is a failure, but we can get a solid bounce soon. Lets discuss a couple of possible scenarios . One is a flash crash right now, the other is a believable rally that rolls over eventually.
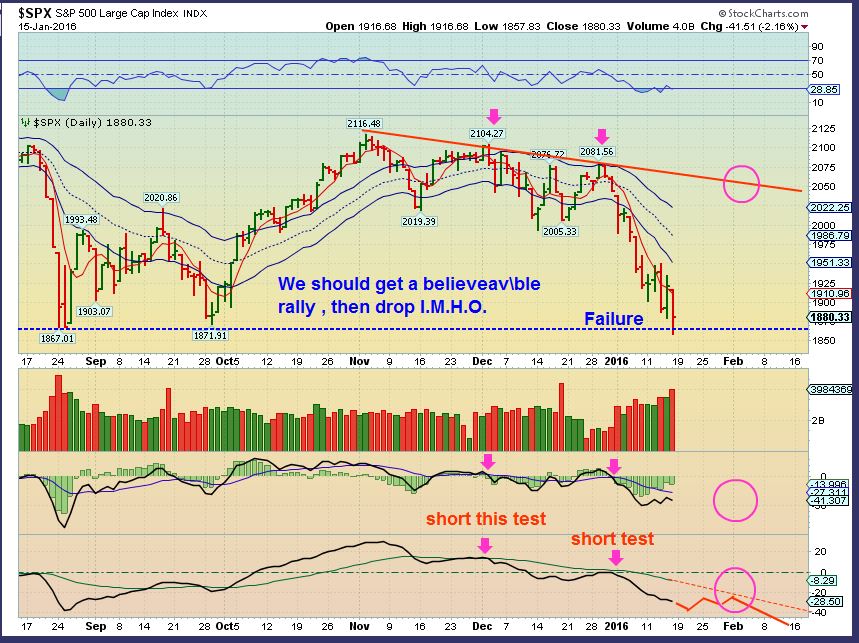
2 Scenarios We could get a sharp sell off / crash here, straight down to a normal fib area, or an ICL soon that leads to a multi week rally. You can see below an idea of a rally first. We broke Aug lows, shorts pile in, and we get a ‘shake out’ for now. OR we have a H&S breaking down and we just plunge quickly for a few days. It is not easy to call short term, but you can see that we easily could have more downside, lets look closer.
SPX –
Cycle wise, we are in the timing for a low. Yes, we could get a flash crash type low where we drop Tuesday and Wednesday BIG, and then bounce back. We’ll have to wait and see. If you are planning to go long, it is best to wait for a reversal (Swing low) and a break above the downtrend line.
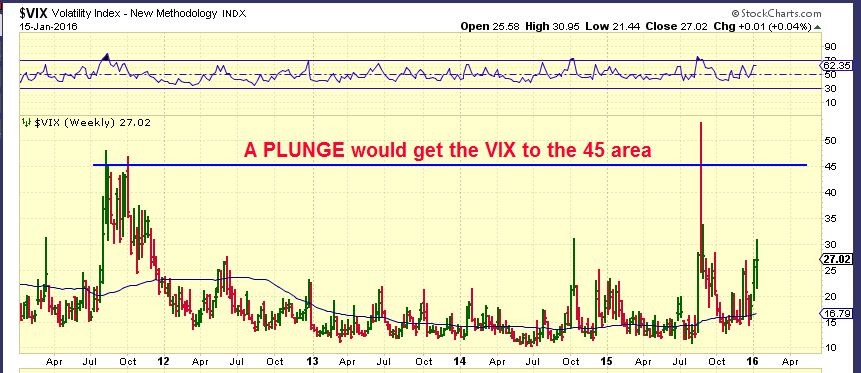
The VIX says that we could drop further. The VIX at 45 could be where the lows come in. I pointed out on the 6th that the vix was breaking out ( Markets drop)
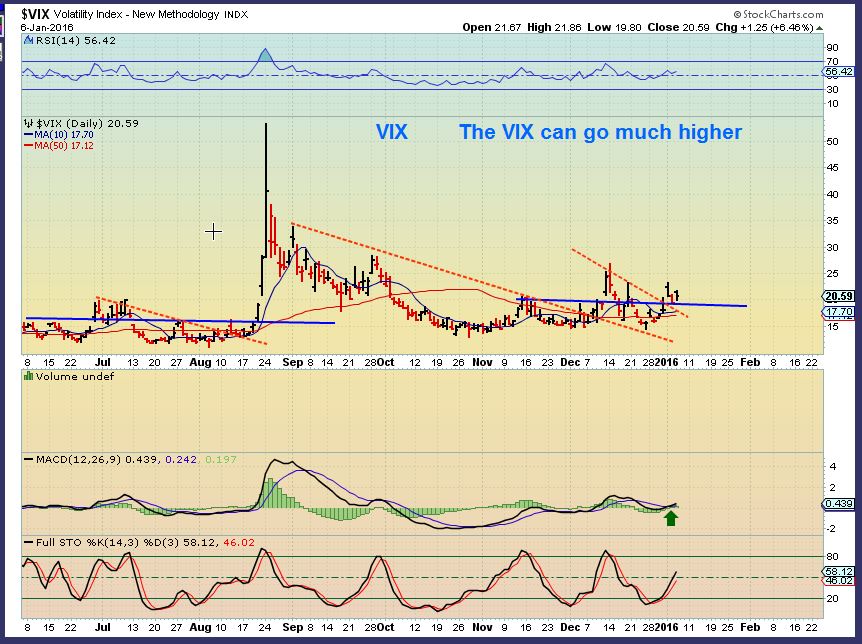
The VIX 5 year chart – The VIX really isn’t “Topped” yet at 45, it even went there in our Summer crash. Lows can occur in the 30 area, so according to the vix, the Markets may or may not have ‘Bottomed’ yet.
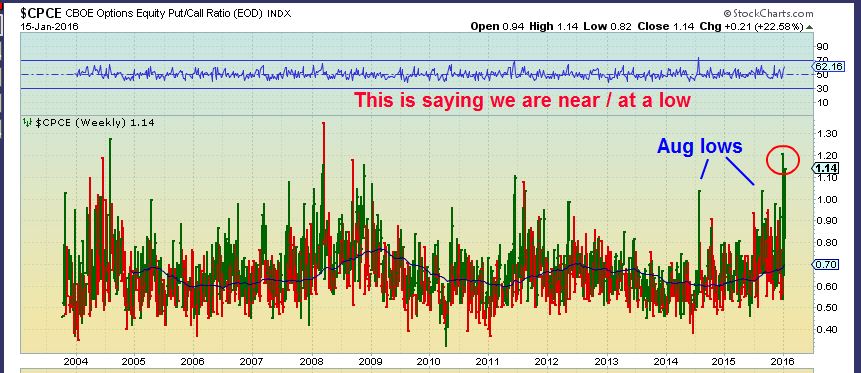
This Put Call ratio seems to be saying that the market is at lows. So was that a shake out and an ICL?
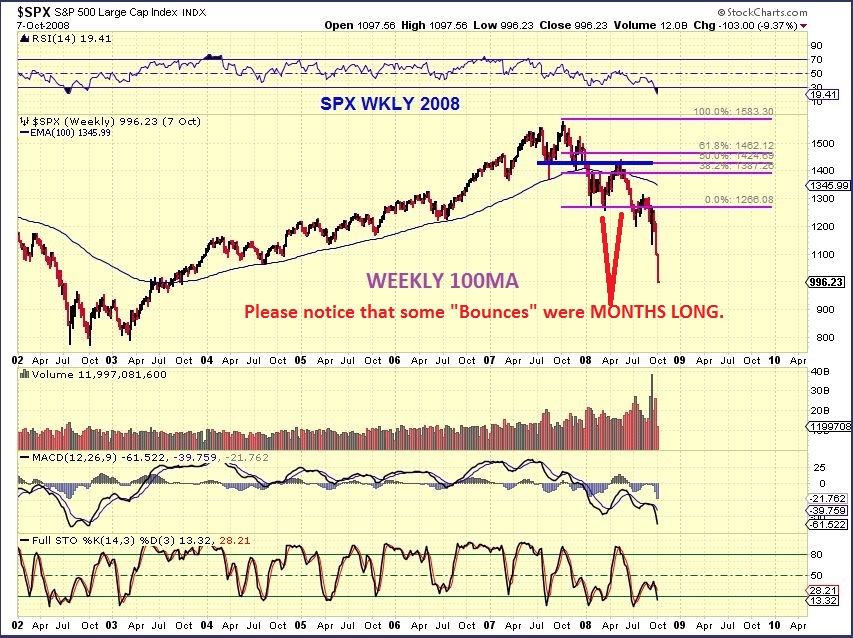
I hear some saying how during this bounce they are ready to flip short quickly after a 1 week bounce or so. I want to tell everyone to be careful about jumping the gun on shorting without a good trigger point. I think we could get a multi week rally that is believable and gets people to become Bullish again. Let me show you how that looks.
SPX 2008 – The crash was a solid drop and a break down, and then a couple of multi week rallies that sucked people back into the Bullish side before that final drop.
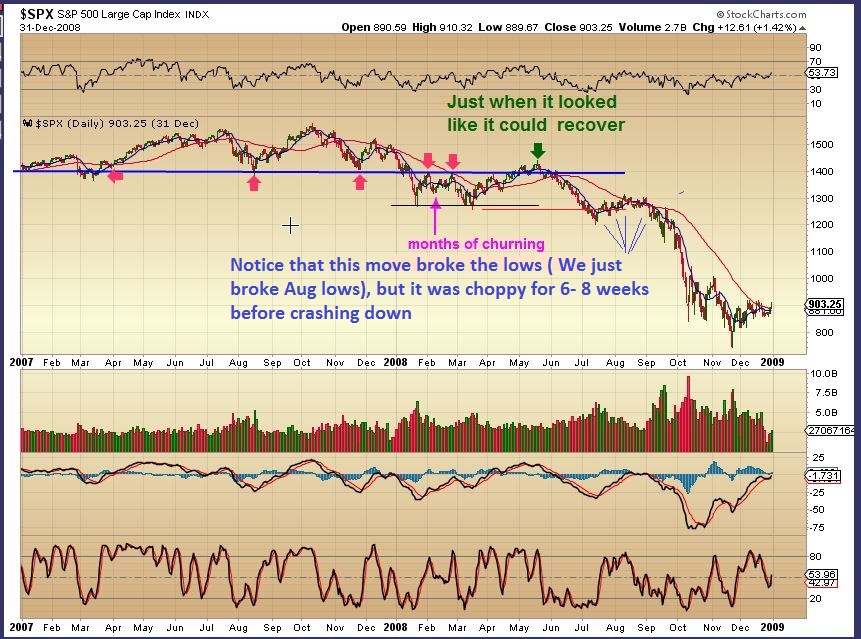
SPX 2008 daily – the top & drop was prolonged and choppy. WEEKS of choppy action. Sideways for months. I am just pointing this out for those that say , ” I’m shorting the bounce next week“. It may not be that simple.
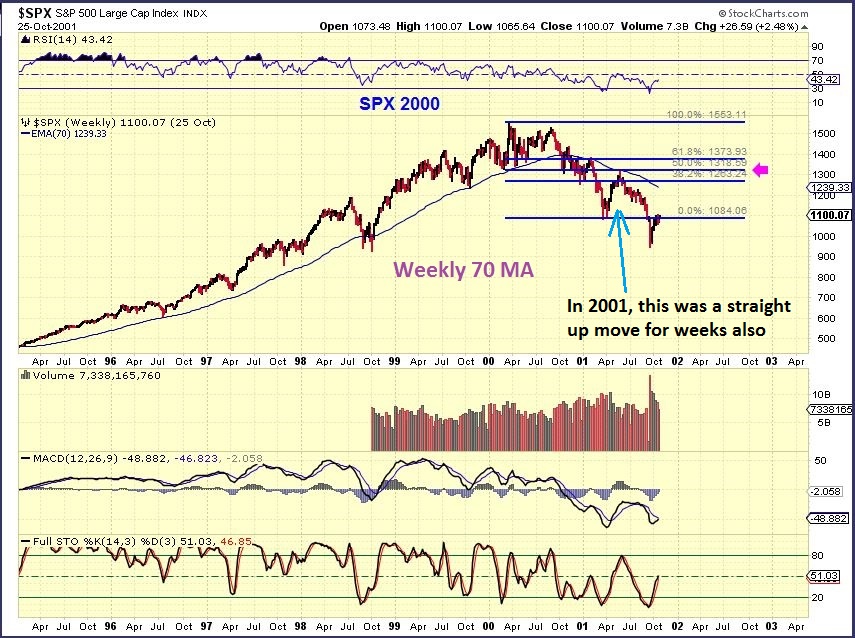
2000 top – We see more serious selling right away. A serious drop into the 2000 year end, then a bounce in January for a few weeks to test the WKLY MA above , then a serious drop into April. A believable Rally followed to test that weekly MA into June. Then a drop.
So all I am saying here is that a 1 week bounce may not be all we get if this is an ICL here. I want to wait and see what kind of bounce comes of this and look for overhead targets to go short if one is planning on going short. IT may get frustrating to go short and watch the market rally & drop and rally and drop for a few weeks.
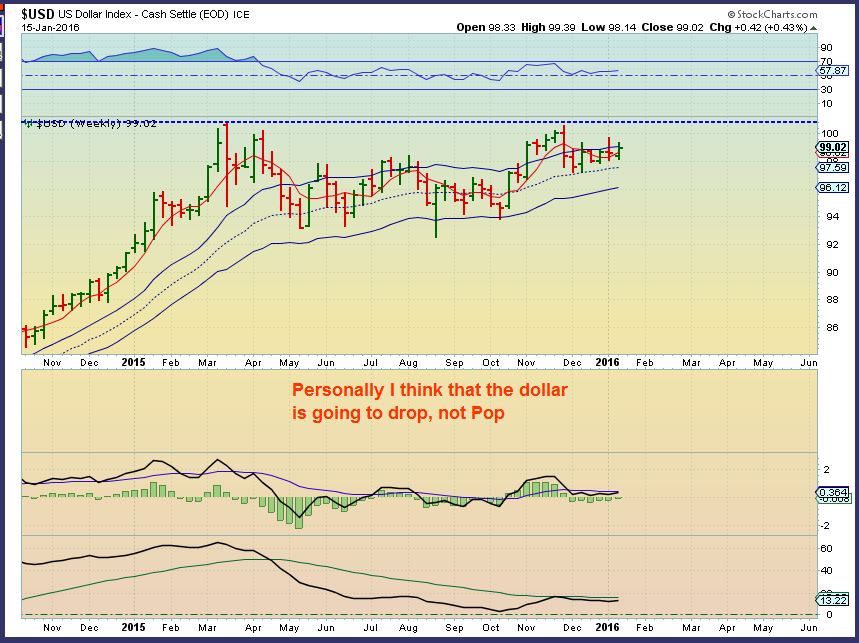
USD WKLY – I have made my thought on the USD clear for months now. No change (yet). Possible double top forming, time will tell.
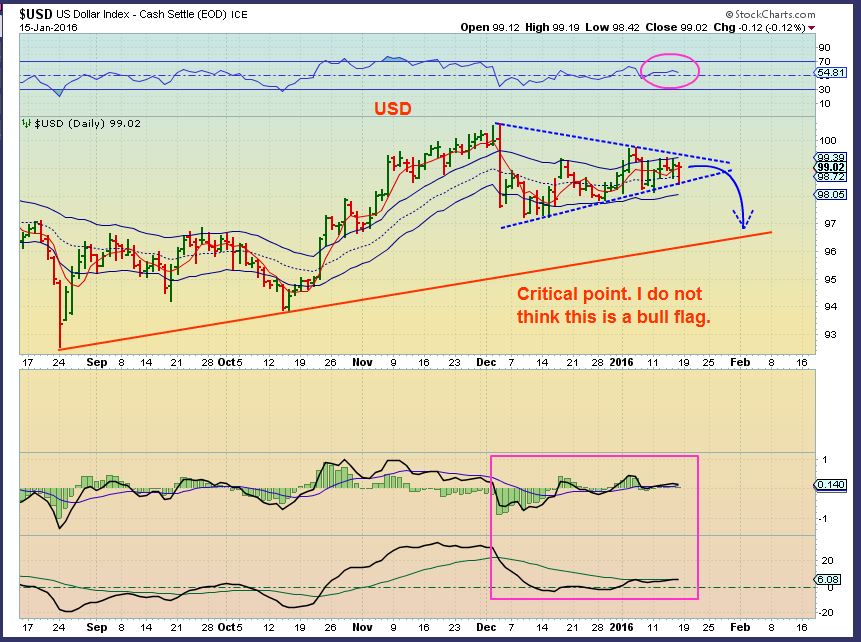
USD DAILY – It could pop to former highs or even break higher and roll over, but I think it just rolls from here. There is a lower trend line.
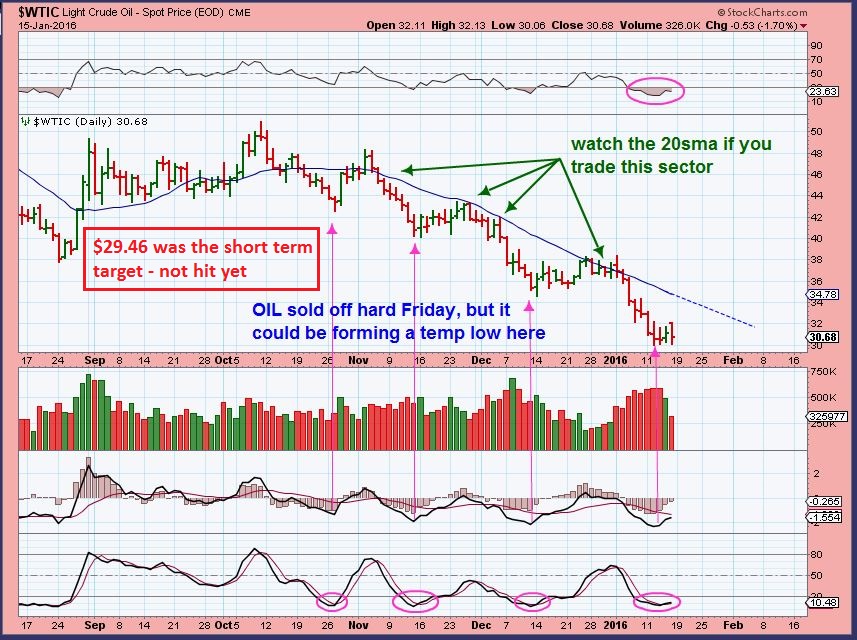
WTIC – I am writing my report Monday, but captured some of the charts Sunday night. I had a short term target for OIL that had not been hit yet, we broke $29 Monday according to CNBC. My live Oil chart does NOT show that we broke $29. Odd. I think OIL may be close to putting in short term lows, but I have had a $26 price target since Oct, and I believe it still may get hit.
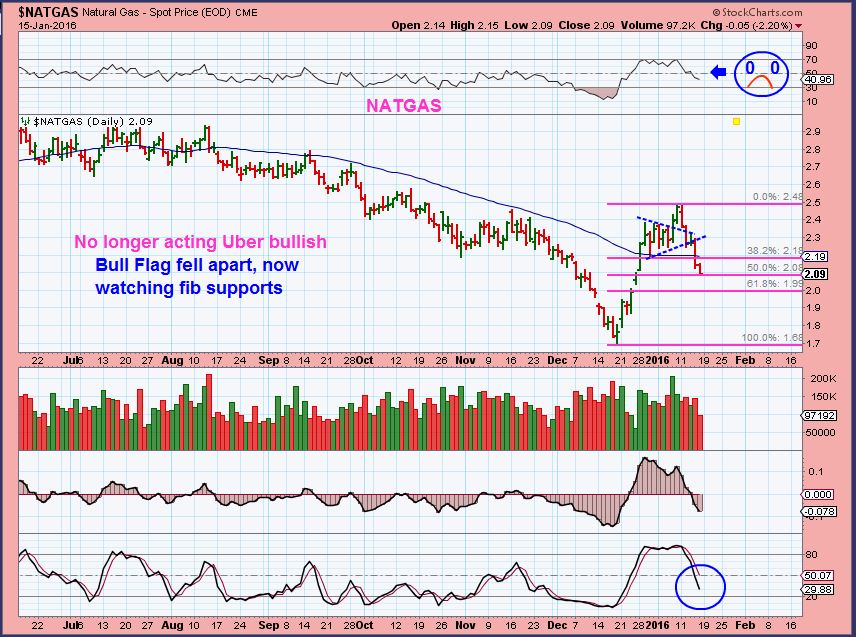
NATGAS – This was acting very well right out of the lows. I even called that I thought it could from a bull flag and hold above the 50sma. It did, but now that flag is broken and the 50sma has also been taken out. Fib #’s are shown as possible support, but this needs to act correctly before it gets interesting again I.M.O.
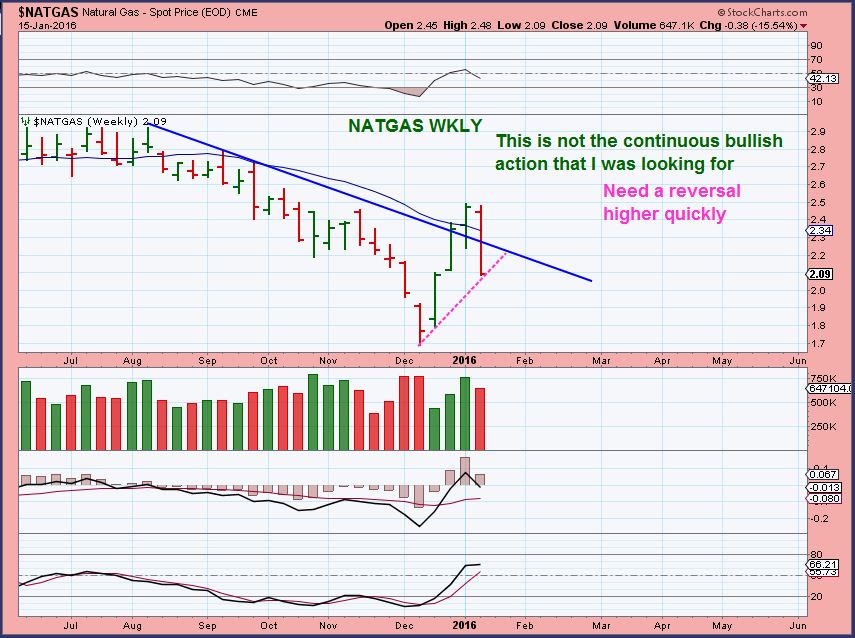
NATGAS WKLY – And that isn’t what I call acting all that beautifully. It needs to reverse quickly.
GOLD, SILVER, MINERS
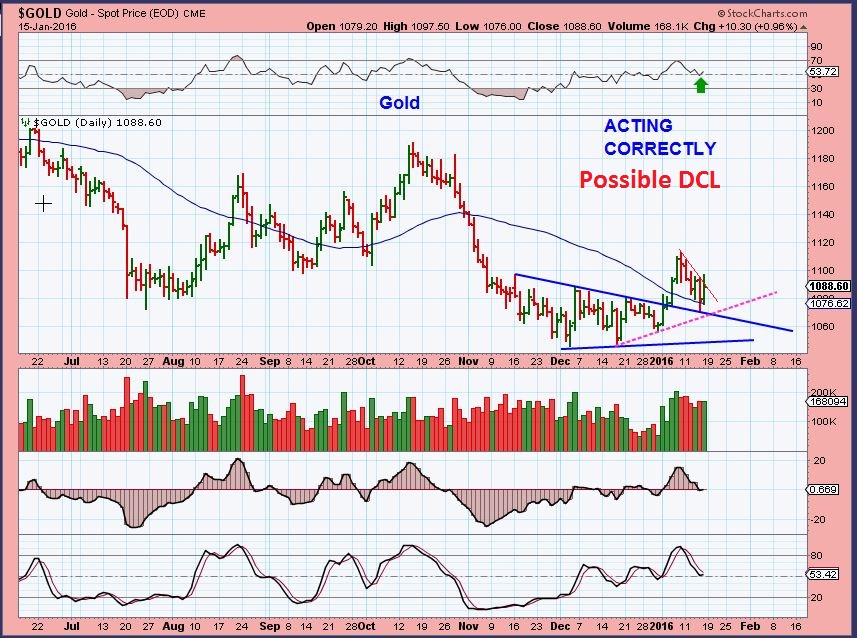
GOLD DAILY– Continues to look Bullish to me . We may have a DCL in place here, so we would expect a rally higher now.
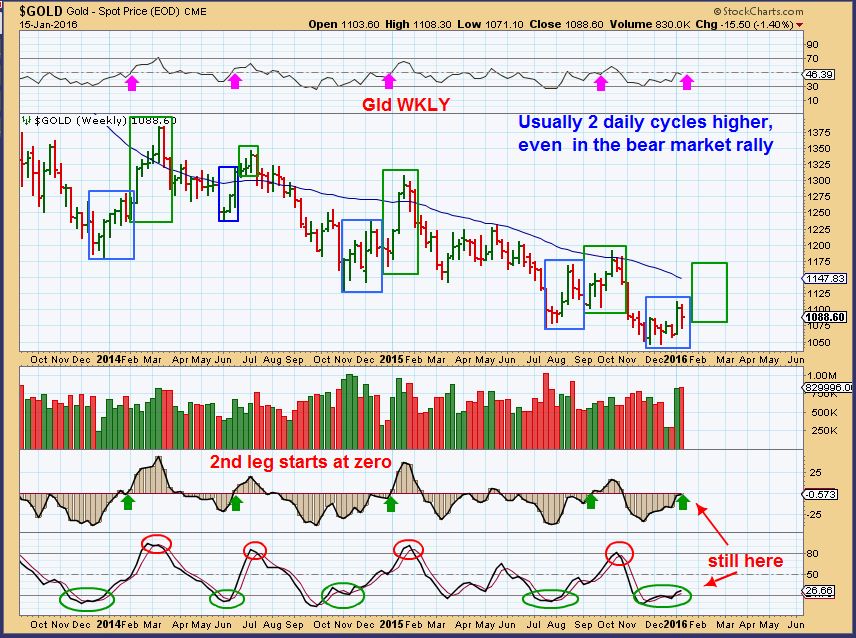
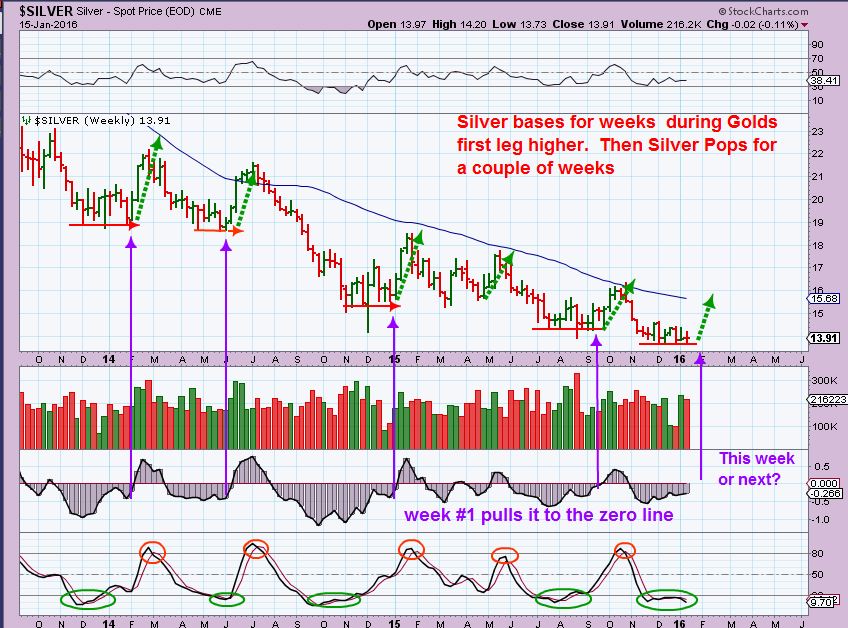
GOLD WKLY – We usually see the 2 legs higher out of an ICL, even in the bear market rallies, so again, I expect a run higher now. We are still in the oversold area (Stochastics) on a weekly basis, the 2nd leg pulls us out of there. The 2nd leg higher usually starts at the zero line (We are there) , and the RSI moves above 50% during the 2nd leg. I still expect higher Gold price.
SILVER WKLY – I expect Silver to join the move once it starts.
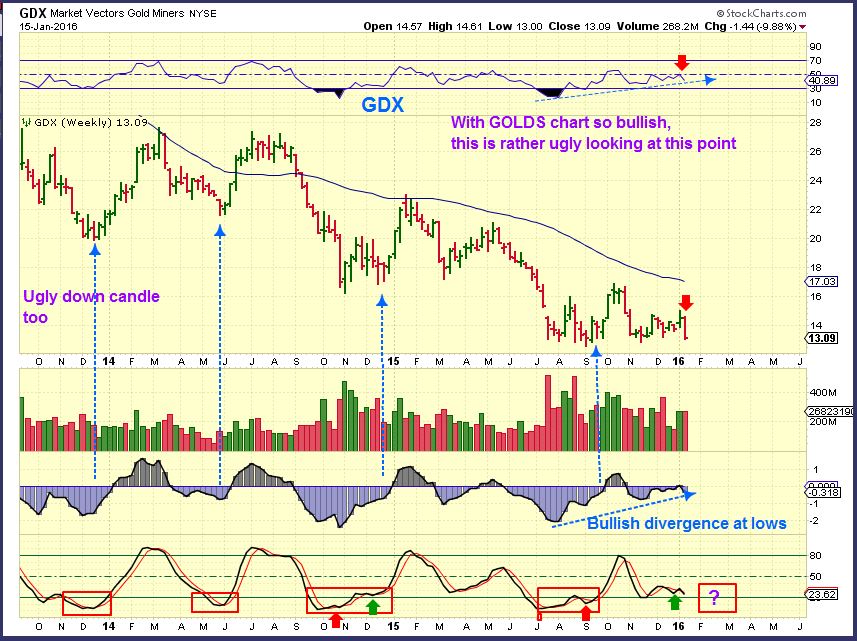
GDX WEEKLY – I thought that was a pretty ugly candle for such a bullish looking Gold chart. This chart actually looks bearish with the sell off closing at lows. SO I searched for other weekly ugly candles that changed the following week. There are some on the left of the chart, and they actually were right before a rally. Wouldn’t we expect Miners to move higher if Gold & Silver rally? Yes.
GDX DAILY – So we see that GDX is still inside of its giant triangle. It still has a series of higher lows, it would be nice if we went higher Tuesday and kept that pattern in play. We finally reached an oversold area, so this week may move us higher.
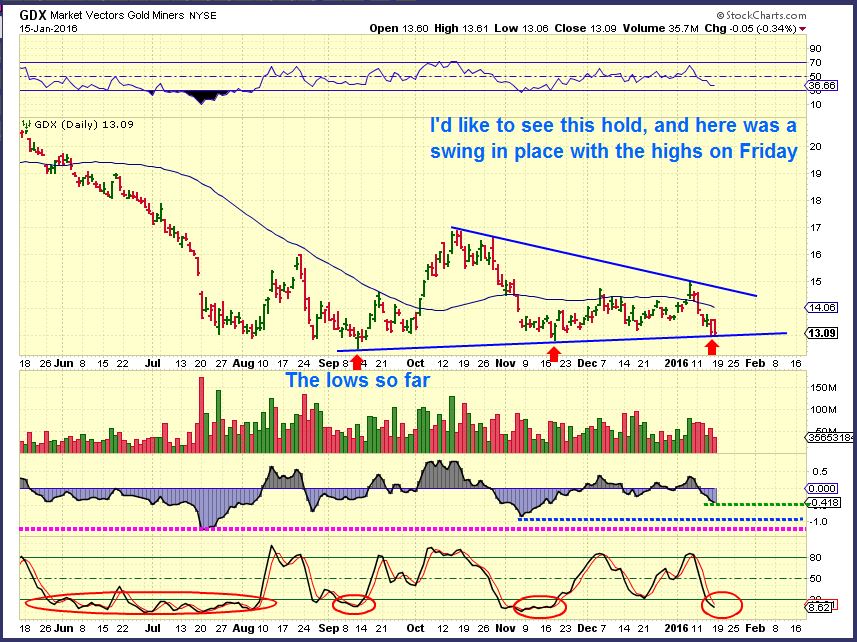
A False break down is possible the way GDX is acting, but I still have to expect that GOLD, SILVER, and Miners will all move higher together. This week should clarify things.
~ALEX
F.Y.I. – I will be posting premium report ‘alerts’ here on this twitter setting in the near future. https://twitter.com/ChartFreakAlert Please follow there for alerts when premium only reports are released.
This will allow me to post other public content on the other twitter page without confusing the non subscribing followers there.
.
As a side-point, you may recall the 2004 HUI chart that was in my last report. I was pointing out that a second daily cycle actually broke to new lows (Normally a failure) , but then rallied higher. I pointed that out because GDX had just done the same break down. That chart is below…

WELL- I went back to that time to see if we closed at the lows with an ugly down candle like we did this past Friday. What do you know…we did close at the lows, and the dip the next day was the start of a rally. Sometimes it’s the little things that keep us hopeful 🙂


Good Work CF, thanks. One thing that bothers me. I have noticed in the past that when the general markets sell off they can take the miners down with them. Even with gold going up. Any thoughts on that?
u must be a mind reader… as soon as you asked.. POOF .. it (the report) appeared. ;o)
Crystal ball! 😉
giggle.. yeah i was gonnnnnnna say… u have cf crystal ball in your clutch.. BUTT … i didn’t.
oops.. did i just say that outloud?
You sure did! and I caught it……..you are subtle
meow
Need to hire a moderator – Just cant leave you two alone : )
I’ve seen both. Look at Oct 2008 through March 2009. Stocks were falling, SPX went from 1100 to 700
MIners were rallying.
HUI went from $150 to $350 / GDX went from $15 to $35
I just added a note to the end of the report for those that look for a Twitter Alert. I am going to have a separate Twitter acct to auto alert when I post a premium reports. It will be at the link below, please follow here if you have a twitter account and want to get the alert on twitter when reports are posted.
https://twitter.com/ChartFreakAlert
Alex, this is just great analysis. This is the kind of stuff that keeps me excited to be here. Great work. Thanks!
Thanks Cason
I touched on this a bit ago. Climate (the weather) affects $Gas. (as these are Spot demands), especially with two snaps before feb 15. (the end of the heart of winter) Look for that threat which is unlikely this el nino year (chicago and east) and you’ll catch another pop, larger than this climb from a recent, rather feeble front. (remember el nino’s spell snow to the west, warm dry north east. however post nino, Next year could be an mf in new england. 🙂
Thanks once again Alex for these last two reports. Especially liked your 05 analogies.on pog friday. Great research!
Thanks Beek
It looks like (Futures) we may get the turn in the general markets today, as long as we dont get a pop & drop as the day goes on.
The big problem is for Miners. If Gold drops from here, it still has some wiggle room, Miners really do not have any wiggle room.
.
GDX has a little room, but GDXJ is pretty much at July lows. (Refresh for a chart).
.
SBGL amaxing run with other gold stocks going the other way, anyone know what’s up?
Sorry, I thought I answered you last week, I must not have been clear.
S. African Mining stocks are running. When they did this before and I looked into it, it was due to the currency exchange. They paid workers and expenses, etc in the S,African Rand, receive profits in the $USD. ( See HMY, DRD, SBGL, GFI)
thanks
A week ago I said, what if you could get Mux=$0.95, SA=$6.60 and GDX=$12.72. BINGO
Not so sure I’d be buying though, I have SA going under $6 shortly.
Sliced right through the 200sma at $6.60
MUX 200sma at .93, and MUX is holding up (So far) . Tiny head & shoulders would drop it to the 200sma
ditto for SA .. lower actually
*providing my count is correct of course
Yeah, Just hit $5.94, pretty amazing how strong it has been, yet how easily it just sliced right through that 200sma.
MUX still holding up well
GFI bounced off of the 20sma again
I can’t believe I sold SA for almost $9 less than 2 weeks ago and it’s now below 6.
Thanks a lot Bill.
Is this still right you think??
Thanks a lot Bill.
Geurt, it was an estimate from a week ago. Now, I’d say we have a little more to go. But close, maybe another $0.70.
That means more or less 12.00 for GDX ????
Thank-you Bill
Lower, I’d guess $11.83 right now will be the low.
yeah…. ur so awesome (fingers crossed behind my back) **well, make that your harmonica
**i bet u hear that all the time from the ladies
seriously though, learning those patterns are on my bucket list this year
…. among a few other choice things 😉
condescending
Whew… that’s a lot of red out there.
The heat is on…..as my bff sang..
RIP glenfrey
Some really good music there
yes….
He surely will be missed by this man. So glad we saw the Eagles live a few years ago. Very sad……..so long Eagles it has been a good ride.
amen brother…. amen.
i literally grew up on eagles… my first true love love of music (well, if you subtract Elvis & Donny Osmond) — first time i literally was captivated by lyrics and literally carried away…
omg.. I think i just quoted a Rush song… lmao
You cant hide your lying eyes, dont forget Leif Garrett with that Donny Osmond , Elvis first love 🙂
You remind me of my sister… A 1970’s 80’s Tiger Beat junkie – LOL
and actually.. i should correct that..lyrics were awesome, but it was my 1st intro to the guitar riff .. that rocked my world — i swore their guitars were singing DIRECTLY to me… lol
#noLie
#still2thisDay
ahhh .. good times
*PFFF .. noway TigerBeat .. #sissygirls
it was (still is) more like:
Led Zeplan, Lynyrd Skynrd, Steve Miller, Deep Purple, Uriah Heep, Rush, VanHalen, Bad Company, Areosmith, Boston, … need i go on?
rock on ….
#DonnyOsmond?
lol.. yes…i may have sung ‘puppy love’ into my hairbrush a few hundred times–but i was like 5 –
and as soon as I learned/memorized every single lyric on that album i moved on to the grownup guys with wicked cool GEEEETARRS.. whewwww ..getsum!
lmao right now ….
https://youtu.be/zI2hgm65WhE?t=6
LOL – Where did he get Elvis’s outfit, I dont remember that? I gotta go call my sister, see how she is today 🙂
You and me both Sister !!!!
Man those were good years !!!!!
🙂 kindred spirits kenny 🙂
Who is Led Zeplan?
Lol..oooohhh..billllly.. ur soooooooo…….
Idk who typed that..musta been catwoman
CRk seems to be holding
hmm.. DQ is green… higher lows…hmm
a lot of miners im watching (read was bumped out of) look to be in the 5th wave like IAG here … where 1=5
https://www.tradingview.com/x/DlOp4pJp/
Glenn Frey has no more heartaches tonight!
I checked 3 different charting services and got 3 different numbers for GDX on Sept 11 lows.
THAT is weird.
12.62 at Worden
Thanks – You can see stockcharts has $12.51 ( refresh)
.
I had $12.62 at Scottrade too
.
The default setting at StockCharts adjusts data for splits, dividends, and distributions.
To view raw data without the adjustment, insert underscore in front of the symbol (_GDX)
GDX paid one dividend of $0.116 so the adjusted price is lower by that amount, making the Sep 11 low $12.51 instead of $12.62
(refresh for chart)
AAAAH, Good to now, Thanks.
12.62 on ThinkOrSwim (TDAmeritrade)
Markets higher, GOLD down $2, Silver up , $0. 18 , GDX down 3.5%?
Disconnect
Alex, do you have an opinion on the timing for an ICL (DCL?) in GDX?
It is unclear now, because Gold is holding up and Miners are breaking down to new lows.
I thought with Gold holding up, MIners would follow when Gold starts to run higher in a 2nd leg up. The delay is causing selling in Miners rather than accumulation.
Timing-wise, cycle count is unclear at this point in Miers. SO will this be a shake out and recover – with Gold moving higher?
Or will this be a panic -type sell off in Miners , similar to August dropping into the lows?
It is best not to guess , but to wait for a swing low that recaptures the 10sma and an overhead trend line break than to guess and try to go long at a possible low.
IF you are asking because you want to ride DUST until GDX finds that final low? Cycle timing is unclear, one could ride it with a trailing stop
No, I’m not going short. I’ve been accumulating primarily GDX/GDXJ and, less so, some individual miners since late July with the goal of holding them for 2 to 3 years. I think the longer term thesis of miners bottoming and starting a bull run is still intact, so I don’t mind a drawdown – I’m just wondering when this particular bottom might occur.
Has such damage been done to the charts that this will take a few weeks to repair? …or is this a false break? I tend to think it’s the first choice, and if we’re in the timing for a low, I’d wait for a bounce to possibly reduce my position.
On a side note, I do think it’s possible that miners are trading in sympathy with the general stock market and it may require a sizable pop in gold to change that.
One glimmer of hope for GDX is that the RSI is sitting on rising support: Daily Chart – click on link and then click on chart (durn ThinkOrSwim) http://tos.mx/URpPqf
Mid day bounce coming, but may just go sideways for a bit? Divergence in the short term charts ( 5, 15, minute charts) and pretty oversold .
GFI bounced off of the 20sma again.
Pretty surprising to me with silver up and gold down only slightly. Was there a sell recommendation put on the sector or something? The mid majors and majors are getting slammed but most of the juniors aren’t being hit much.
I see quite a bit being hit, and not sure why. I saw AUY, IAG, NGD, AG, etc down 11%.
Markets are higher, GOLD & SILVER not bad. Really unexpected except that Miners were right at lows and looking like they’d break down. Still have to see if it is a shake out or waterfall sell off, but I’m not buying until I see a real turn around. .
I actually still own GFI from a trade I put on a week ago, it dropped to my entry today. Below $2.90 and I’m stopped out.
I am seeing some talk about a head and shoulders breakdown with a measured move target of around $9 for GDX. I’m no TA expert so no idea if this is valid at all.
Yes, I see what they see, but at bottoms , they usually aren’t reliable.
A true H&S as pointed out by William ONeil is after a run higher and exhausts itself.
I wont say it isn’t going to fulfill though.
Just stopped out on NG which I sold at my buy in price.
: (
Better than a loss, but it still feels like a loss. I’ve had a few too. I’m starting to think I need to just sell the rips as a trader and not play cycles through until the Bottom is a confirmed low .
RIC + .06 LSG +.03 Shake out and recovery? (I hope)
I just posted a wedge chart above and it seemed like every single stock bounced at the same time.
HMMM, Shake out?
RIC looks pretty good as a reversal candle (So far)
WEDGE SHOULD BREAK UPSIDE ( Refresh),
Not a long term chart, just a 5 minute chart, so at least a short birst higher.
.
So now the Dollar is breaking down, Gold is starting to turn Green, Silver up $0.20
And possible/ MAYBE a shake out in Miners. Interesting.
Do you expect a mid day change of direction during 1-every day or 2-big moves?
I’m not sure that I understand the question, but today –
I was just watching the 5 minute and 10, 15, 30 minute charts and saw divergence and then the wedge formed with a couple of small bounces off of the lows.
I’ve heard you say before that you expected a sell off mid day. I didn’t know if it was TA or historical?
Oh, just from memory. If we get a run up higher from the open till mid day, we usually dip down , sometimes until the final hour, and then rally back up.
It can be visa versa too. A strong sell off into mid day can bounce from extremely oversold on a 10 minute chart , then sell off continues into the close.
CF, All. We are getting close to Alex’s $26 prediction on OIL. When we reach a good buy spot what should we buy for energy stocks? Is there a way to make sure we don’t buy one that will fold?
Low debt with good Net Margins……imho Bill.
I’m not good with fundamentals. Maybe some here can put together a top 10?
i am going to leave the list to Alex.
Although you can find financials on a company at Morningstar if you so desire. 🙂
CF, Does this pattern (red line wedge) usually mean a drop to the downside? Ignore the blue boxes, refresh
Yes, If it could be considered a triangle pattern , they often are continuation patterns. The move down into the pattern would continue.
If it breaks down it could definitely lead to a big sell off, because that sideways move builds energy for the next move.
We do have a break down today, but if it rallied back inside ( Like Sept 11 ) , it would be a shake out.
Well I guess I’ll grab a bottle of Scotch and pray it doesn’t drop.
That’s the best trade idea I’ve heard in weeks!
Since GDX broke the Sept. low does that change the cycle in any way ?
The problem with cycles right now id that Gold doesnt match Miners at all. Gold had lows in July, GDX Sept 11. Gold recently bottomed again in Dec, Miners dropping to new lows now.
It is very rare that they get this far off in timing.
When things get that out of sync, I just ignore cycles since they are less predictable until maybe looking back later in hindsight.
Like when you think you have a 1-2-3-4-5 sell off finished, and then 2 days later it sells off lower again, you see in hindsight that it’s extending.
Sigh….gotcha thanks.
I hear ya, these markets are pretty much a mess right now – all of them pretty indecisive .
Really need some clarity.
I mentioned the other day that I thought one of the most bullish loking charts was DUST breaking out, but with Gold looking so bullish, I couldnt take the trade.
Dust looks very bullish today.
Yes, I go back and look at the counter trade at times like this. I looked at DUST this morning. It does look bullish. Yikes.
Yes, and JDST. The problem is, how could I have taken that trade with such a bullish set up on Gold.
This set up definitely acted differently.
Right, but can you chase here? Off the top of my head, it has to be up over 40% in last week!! Darn, I really wanted to…
NO! You can’t trade this, just have to chalk it up as one that you missed.
Anyone going long SP500 here?
I’m staying in cash right now, and sold my GFI that I bought last week near break even.
If it is just a shake out, they did a good job. I dont want to hold anything right now.
If GDX could close above $ 12.62 , or better yet, $12.92 , I’d be kind of happy / Amazed .
Not looking likely at this point.
Man, wtf happened today? I was away all day and got home to find carnage. I guess officially Dow and SPY finished higher but not really compared to AM futures. How many days in a row has literally every asset class been down. I just don’t see anywhere one can feel good about going long. Glad I’m not in miners. I had 3 quick wins in Dec, early Jan and salvaged my last NUGT for a small loss first week Jan. I’m done playing hero in PMs, just too dangerous, glad I avoided the most recent collapse (about time I miss one!). I guess oil stops at $0? GL all.
Man, really surprised that equity markets can’t catch a break, where every small points is sold back off. I haven’t seen anything like this, personally (wasn’t very active in 2008). Futures are WAY down overnight. Treasuries and gold really haven’t caught a bid either. Last summer it was down quick, bounced and retested. This time it’s straight down. I’m completemy stupidified.