
1-13-2016 Observations
SPX – Yesterday I was pointing out the reversal candle and we were expecting a move higher, but would it be just a bounce?
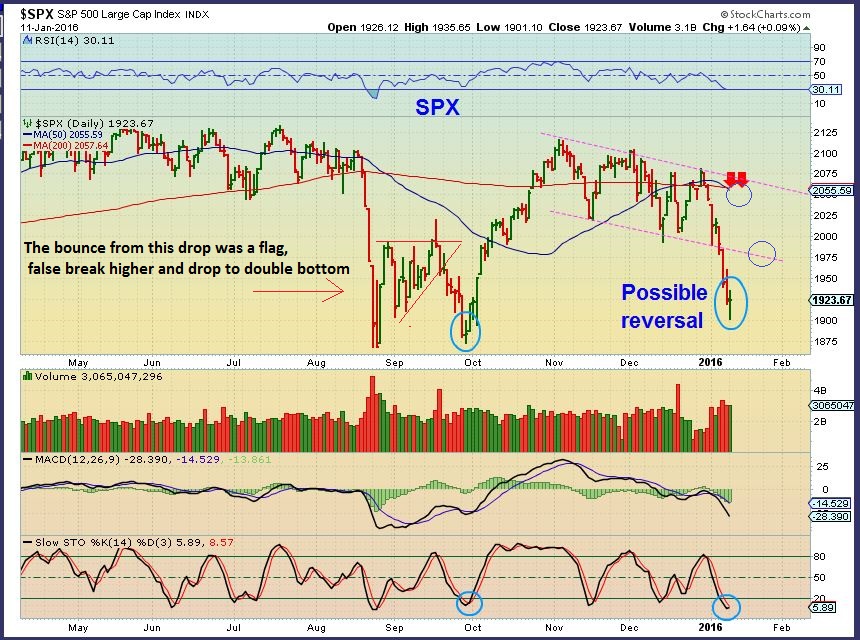
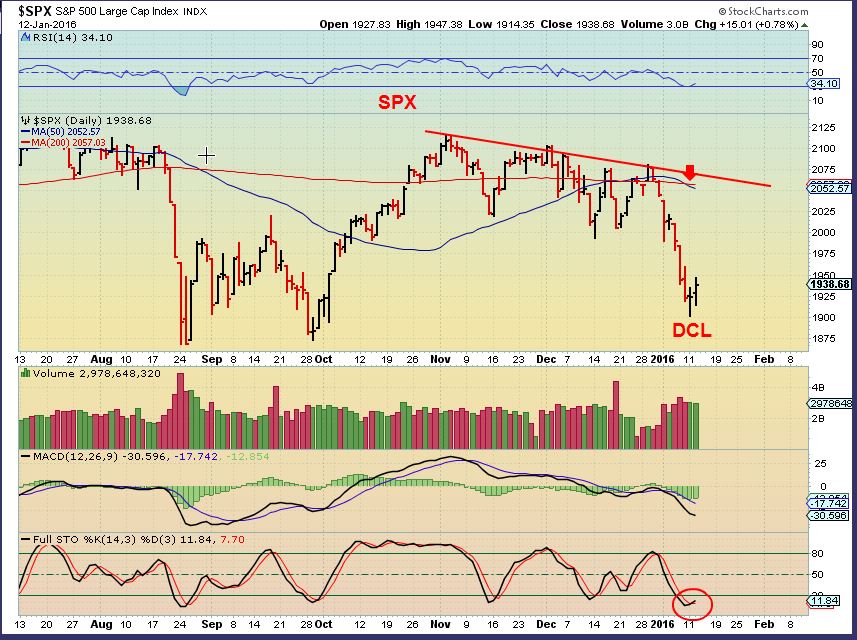
SPX – We will get follow through, so traders can trade it, but at this point I do not expect a return to the Bull run. (See the weekend report for the big picture). Strong overhead resistance is pointed out, if the markets can make it to that area.
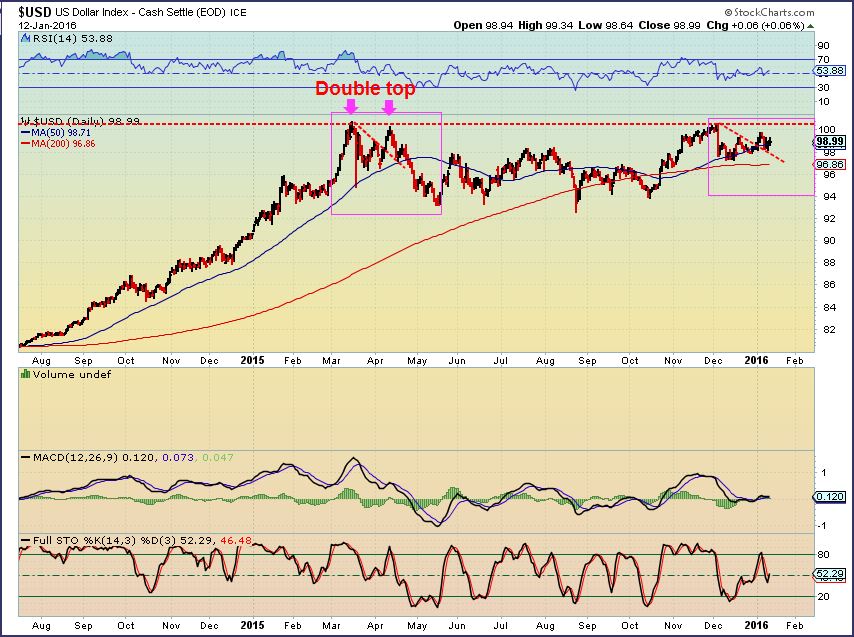
USD – I’ve been looking for a double top for months now. This was the Dec 18 wkly idea.
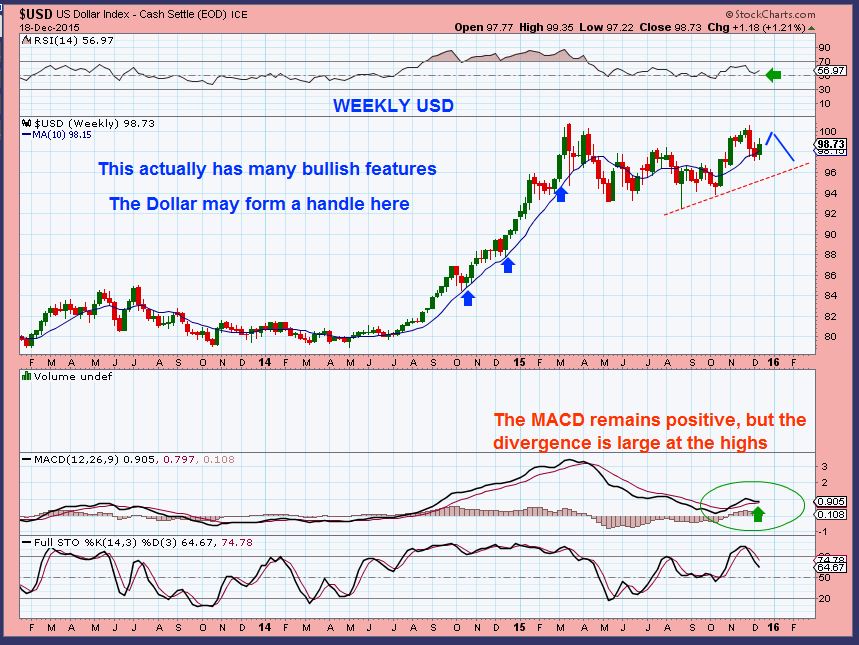
Here I showed how the left side peak ( Magenta box) looked similar to the formation now, so we would expect a break higher and double top.
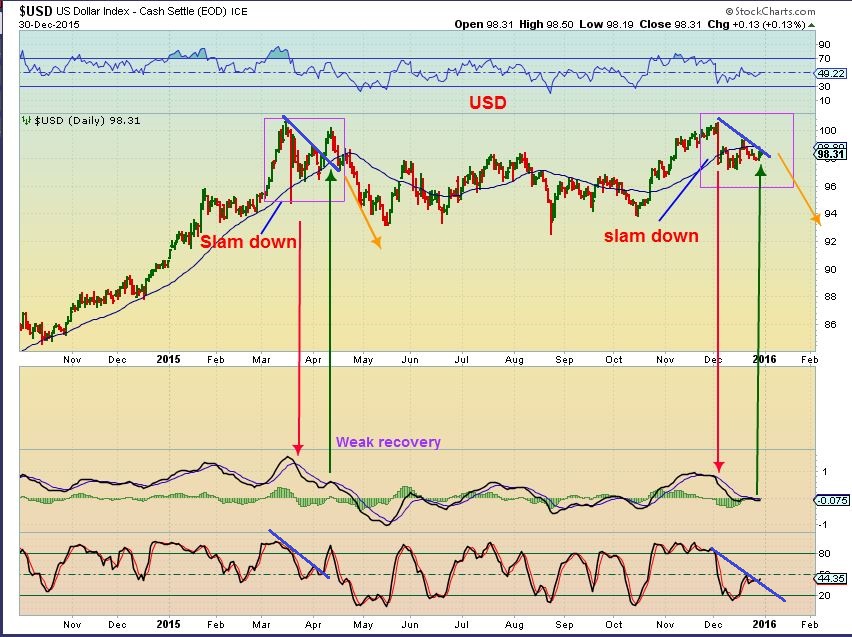
USD CURRENTLY – we could break out, but it may be a false break out to draw in ‘longs’. I still do not see this going to 120 as many predict. At this point I see weakness internally.
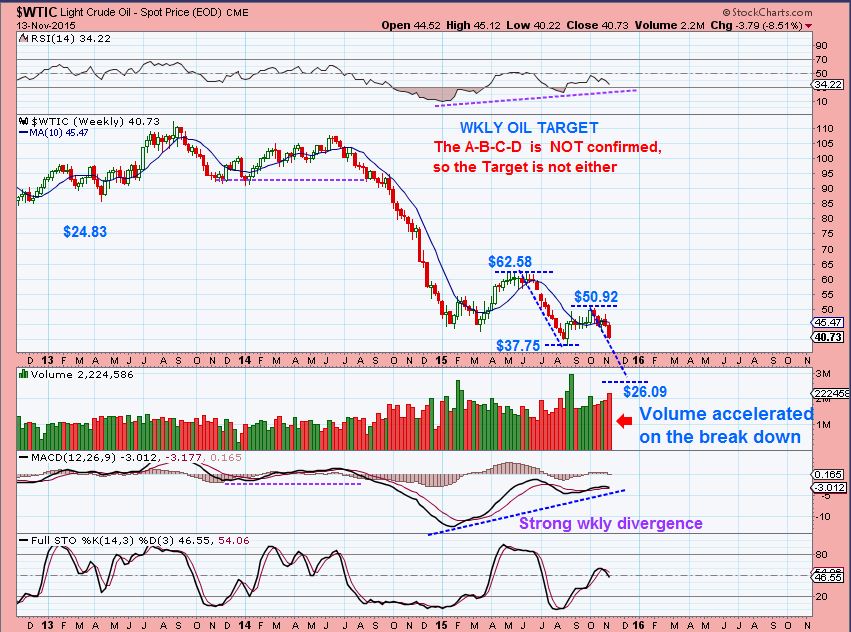
WTIC – Novemeber 13 – I had a weekly target of $26, when OIL was above $40. It seemed crazy, but now it seems possible.
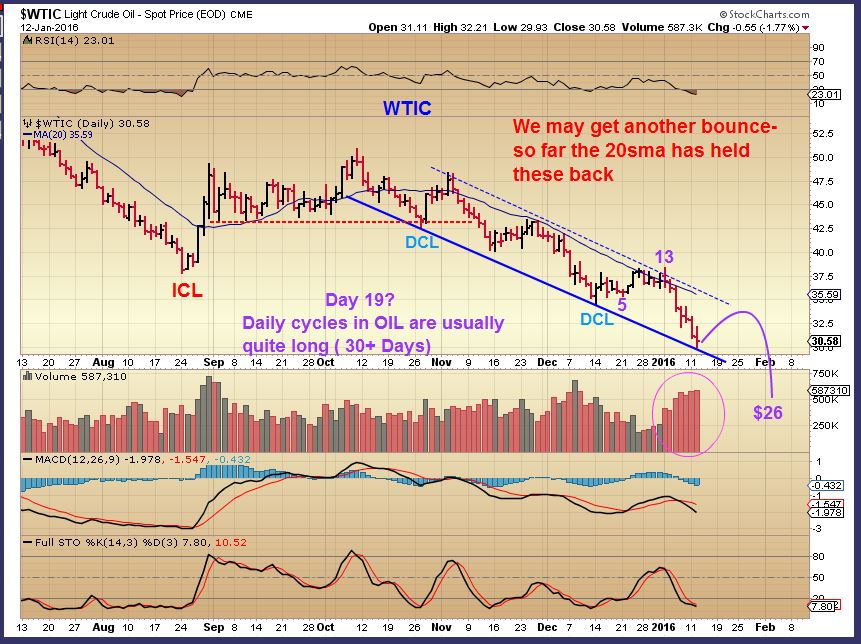
WTIC NOW – so we may get an oversold bounce here, but it seems early for a dcl ( they often run over 30days). If we do get a bounce, watch the 20 sma, and the next drop may be THE FINAL LOWS. ( See Big Picture chart in the weekend report).
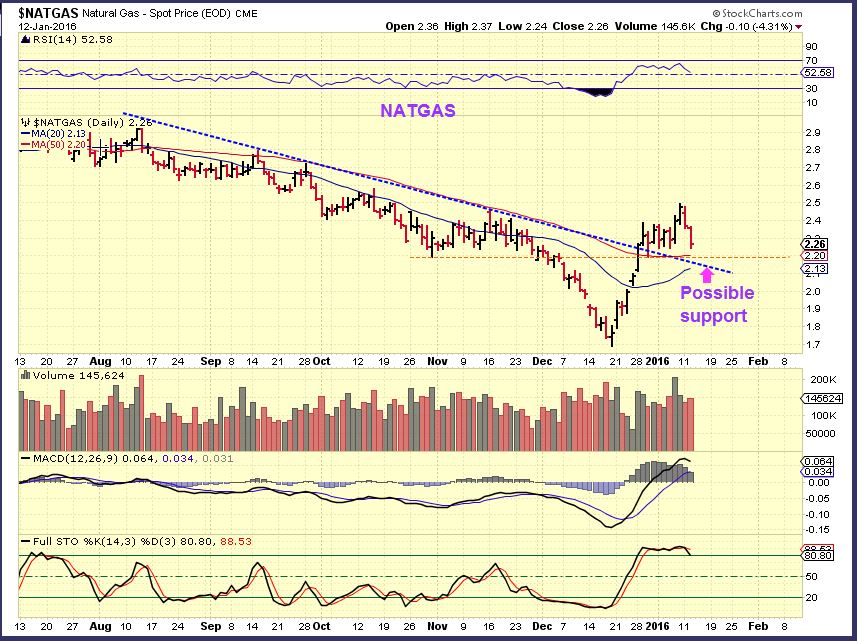
NATGAS- Is consolidating its strong move higher. I called for a normal bullflag, but that broke down. I have pointed out possible support areas ( Possible Inverse H&S too).
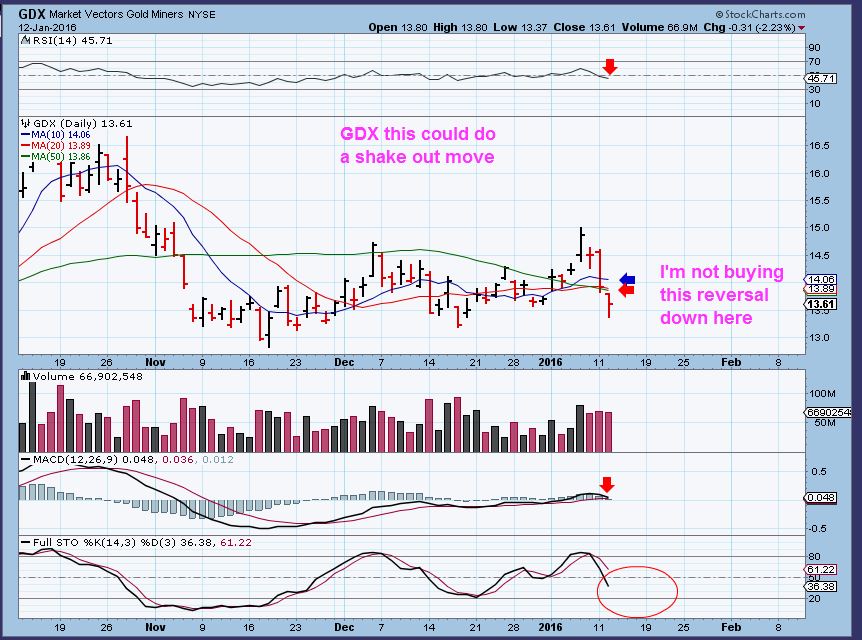
GOLD, SILVER, MINERS
Yesterday threw a lot of people off, and I am no exception. I expected Miners to hold up better, but what we saw was a steep drop in the GDX (that tried to recover into the close), and many silver stocks got hit hard. Obviously I needed to look into it and see if it makes sense , or is it way out of whack ( I got stopped out of my late entry positions and sold the rest for now. Sometimes when a trade that you take doesnt do what you expected, you can take profit and just clear your head to see things clearly).
These are my current observations:
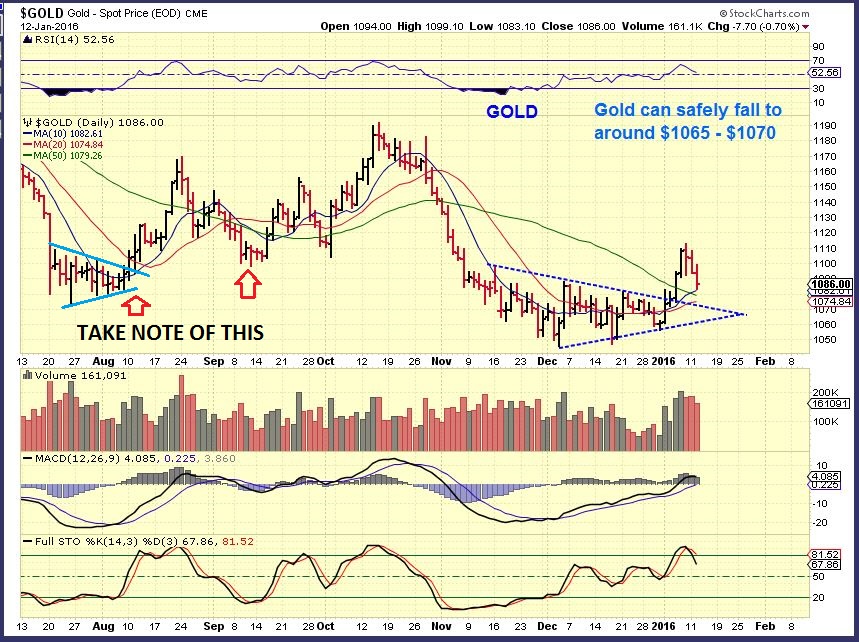
GOLD – This is acting correctly and as expected. Lets review what we’ve seen. Back in December I was expecting a break out higher from the triangle and reported the Bullish COT, Likely ICL, etc
GOLD CURRENTLY – We got that break out above the 50sma and triangle, and now a back test is possible. This could be a normal drop into a DCL. NOTE THE LEFT SIDE OF THE CHART.
1. Gold bottomed JULY 27.
2. Gold formed a small triangle.
3. broke out and made higher lows, rather orderly like it is acting right now.
Now look at SILVER & compare it to the above Gold chart at last summers lows. When GOLD bottomed on JULY 27, Silver formed a shaky triangle, was capped at the 50sma, and broke down to new lows. We are seeing that again right now. THEN Silver broke to new highs very rapidly in its own time.
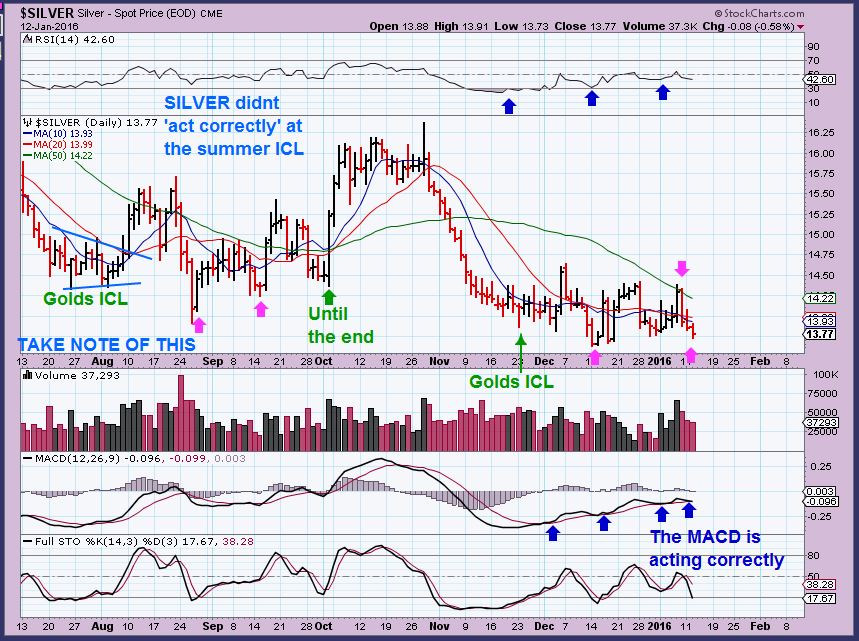
So we see from the above 2 charts that Silver didnt respect Golds ICL from JULY 27. It marched to the beat of its own drum. Now on to Miners.
.
GDX – GDX is acting better currently than it did with Golds Summer July 27 lows. GDX broke to its own new lows on Sept 11 at that time (After a steep plunge). The steep drop from the past 2 days was unexpected, hopefully not a repeat of the drop in August. It does call for caution however.
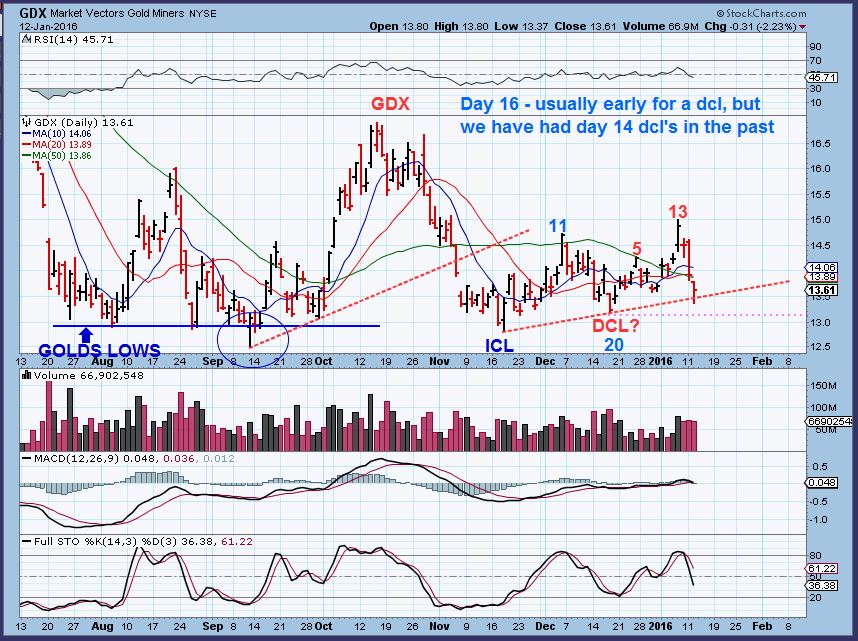
I dont think everything is predicting a huge break down in Gold, since we still have that bullish GOLD COT , ugly sentiment, etc. At this point it looks more like one of those difficult basing bottoms, similar to last Summer July, August, Sept. Yesterday Miners tried to recover, but the cycle count is at day 16, and that tends to be a tad early for a dcl. GDX MAY just bounce around or drop a bit more and find a DCL (Daily cycle low) as a higher low. That would be great. I would love to see the lows hold from November if the drop continues, or the SEPT lows, but it will take time to see how this plays out. Some of my favorite Miners showed a slight change yesterday.
-
We had a few Silver Miners drop to fresh lows.
-
We saw SA, NG, LSG, RIC, etc drop a bit more than expected
-
I think that GDX could bounce and drop to a dcl, or just continue to drop here.
.
So for today I am in cash and I need to see how things move going forward. The big picture from the past weekend reports for the Markets , OIL, The CRB, GOLD , SILVER, and MINERS hasn’t changed . Things are lining up and the pieces of the puzzle still look to be falling into place. Short term appears to be for traders that can be in front of the screen , use stops, protect investments from unexpected whip saw.
For now, Know your own trading ability and remember that CASH is a valid position in uncertain times. I dont mind waiting for a trade to come to me. I look for divergence at lows, positive indicators, etc. The drop from the past 2 days was unexpected , but not very damaging ( yet), except for some Silver stocks. they MIGHT be doing a shake out. We still have a chance for a series of higher lows in GDX, but again it will take time. I pointed out a few trades in yesterdays report for a market bounce.
Final observation – Strictly using technical analysis, this is no longer very bullish looking. It looks set up to break down, so I remain very cautious. There is room for downside follow through on the stochastics. Maybe its a shake out below the 50sma? It will take time and patience to see.


It looks like the entire metals sector is waiting on silver to find its ICL. Currently on week 20 and oversold on the weekly charts. One more lower low like it did in the summer would confirm the 20 week count and set up a nice multi week rally once the bottom is in.
Why do you say the entire metals sector is ‘waiting for silver’? The point in my report is that GOLD didn’t wait for Silver last summer, it lead the way while silver languished. Currently Gold formed a triangle and popped from $1045 to $1113 while Silver languishes again. Gold doesnt seem to be waiting for silver.
Silver played catch up last summer, Gold bottomed first.
It doesnt look like “Gold is waiting for silver”, unless you are saying that you think Gold is heading down to make new lows right now.
I’m actually agreeing with you. It looks to me like gold made an ICL in Dec.and will probably hold those lows. Then once silver finds its bottom the whole sector should rally nicely.
I guess it’s possible that gold could make a lower low and maybe test the $1000-1030 zone but that wouldn’t be the highest odds considering it formed a right translated cycle.
I’m going to make a guess and say that big money will try to run stops in silver and miners to get everyone on the wrong side of the market and scoop up their shares cheap before the next rally starts.
Ok, That was a little clearer. I was thinking that you were saying Silver had to bottom and lead the way, but I have not seen that to be true historically.
Nice move by silver today. It’s been very volatile lately which is an indication of trying to hammer out a bottom.
Alex,
How comfortable are with Crude Oil’s DCL in Dec. ?
I have the ICL in August. The 1st. DCL in October at 46 days as you do but I now have the 2nd. DCL “possibly” yesterday on day 52 ?
I have Oil cycles between 40 – 50 days ?
Hey Ken,
I actually have Oils cycles between 30 and 50 plus ( I hate a wide range like that, but Oil bottoms when its good and ready : ).
I am looking at Dec as a DCL for a couple of reasons ( But I wont dismiss your findings). For one thing, in Dec , that bounce showed a little ‘strength’ which I dont often find in the middle or end of a dcycle. Notice it popped, dipped, and then made new highs and even tried to close above the 20sma. The big factor was that MACD crossed positive, and I wouldnt think that the MACD would cross higher at the mid or end of a weak 2nd daily cycle. I would expect that to happen at a DCL. All other bounces saw the MACD tag and drop.
So adding that and a few other tech analysis indicators to the cycle count, I felt that that was a dcl in Dec with a bit of strength initially – I actually thought that it might break the 20sma and run at that time.
So dont dismiss your count, we’ll just watch what happens at the 20sma. You may have that count and be thinking ICL? So we’ll watch it for now (And you can trade it with your count if you wish, honor stops).
Does that help?
It does thank you, although it does somewhat throw a monkey wrench in my count. 🙂
Assuming also a Weekly cycle count at around 20 weeks…..we are around 20 now btw.
Hi
i like your count… i have oil STILLL in “5” just finishing ‘4th’ of 5 …so the 5th of 5th beginning what appears to be today…?
Hi Maria,
Maybe wave 5 was completed yesterday ?……..
I am beginning to wonder if Oil AND SPX will hit their lows together ?……..
There still is a huge amount of oversupply in Oil so until that area softens more or there is some negative geopolitical event Oil is going to struggle. But I still really like the sector long term……..
maybe…. ? but im thinking not.. lol
oddly, this reminds me of a quote I like ….
” A fool-proof method for sculpting an elephant: first, get a huge block of marble; then you chip away everything that doesn’t look like an elephant …”
I like it Maria. 🙂
;o)
**but as I’m certain you know, 4&5 actually become 1&2 of the ‘new’ wave .. sooo … it’s possible a new wave has begun…
Refresh for a chart where SonOfGuds question was on USO was. That kind of looks like lows.
I have the same count E.W. -wise.
Alex,
I held onto some of my PAAS position…is the action this morning constructive or a good opportunity to close out my position. Would appreciate your insight.
thx
Hey Curtis,
I have added a chart for you to follow what I am saying. ( refresh)
The
tough part about that is that I do believe we are near lows. I do
believe a good rally is coming in Miners soon. I believe that PAAS will
rally too. When you are at lows however, you do get a lot of whip saw
action.
For PAAS, take a look at Dec 14,15,16,17 area. You may
be seeing that now. Today is a nice recovery pop, but look at Dec 16.
It was a nice 1 day pop, then a big scary drop, then it ran higher.
Trading near the lows is tricky for that reason. There are many shake
outs along the way.
So the answer goes back to a trading plan.
Now go back to AUG SEPT OCT for PAAS, and you may be seeing that type of
bottoming now, with higher prices to come in a shot higher after Gold
finds its dcl ( Or GDX does). SO can you ride it out knowing it should
go higher? Can you buy it lower if you sell here and it falls. Can
you re-enter if you sell and it finally takes off like it did in OCT?
thanks Alex for your extensive answer!
Alex/anyone , do you have the equivalent $ target in USO etf, for your WTIC $26 figure? ..thx
Looking at USO, that is some interesting volume here, almost like capitualtion lows.
let me add a chart
REFRESH
Sorry – Forgot to add the chart…refresh again
…and you played the Missy Elliot Queen role as an added bonus… excellent
LOL – Yeah, I’m not an Elliot Wave pro, Only when the count looks that obvious.
In fact – I’m on my laptop at startbucks and a 3 year old walked by and pointed out the 1-2-3-4-5 pattern to me . (J/K)
haha.. was she called little Maria?
wait… was that u slamming me … i mean EWs ?
oh yeah….?
My USO chart is much clearer ! ;). JK !
yes, I didnt see yours until I refreshed. I didnt know you added it, or I wouldnt have directed you here – lol : )
Lol no worries.
That’s the Main point I am trying to present:
If we can get the DCL’s And ICL’s to mirror a projected EW Count that is money IMHO.
Oh .. I wholeheartedly concur …..
( Shhh, this shameless love affair is blinding you – his didnt have a lower price target ) lol
This was to Maria
#guiltyAsCharged 😉
Soo …… Maria maybe we should all pony up and get The Chart Freak accredited in Elliott Wave………only half kidding. 🙂
well, I’m still waiting on him hosting the Christmas Party that wasnt … so, I’ll believe that when pigs fly…
Quite the market bounce , huh?
Where is that face ripping countertrend bounce ?
Just thinking out loud but possibly the character of the market is changing from bull market to bear market mentality where people/traders or whoever are far less inclined now to just blindly pile in and ‘buy the dips’. I’ll be very surprised if this current bounce is over but it may be a lot more choppy and overlapping that the types of bounces we saw last year. But only a thought…and maybe not a very good one!! Lol
We are clearly in a bear market already, if you ask me!
Based on prettty much all the technical indicators I look at Cason across multiple markets I would wholeheartedly agree with you on that one Cason. And quite some way to drop yet before this one is over……. if it’s allowed to run it’s natural course!!
Now approaching yesterday’s lows. Make or break time. This “rally” could turn into a bear flag. I really did expect a bounce today.
Thats what I was just thinking looking at the charts Dallas,
I pulled up QQQ & SPY with a 9SMA and an 8 EMA , definitely could be a bear flag.
Looking that way. These drops are breathtaking. Primary trend is down until proven otherwise.
Yes, I expected more of bounce, and wanted to consider SDS, SQQQ, TZA, etc on the bounce.
That was a bit of a quick turn. Even a bear flag could have lasted a bit longer.
wow HMY….
Look at its 3 month and 6 month charts.
And DRD & GFI – These are the African miners
sshwwwinnng …
*too bad CF didn’t recommend it back then…
**too busy sitting in starbucks … obvioussssssly …
I have mentioned it, but you were searching for “Gifs” , must have missed it.
ooo hoo hoo hoooo hooo… lol
Did anyone else feel like this in the market today? 😛
https://www.youtube.com/watch?v=OOWXIrMtPh4&feature=iv&src_vid=w4OnYYY9tfU&annotation_id=annotation_2006675597
LOL .. .my eyes are watering right now … im laughing so hard…
… hmmm … actually, now that I think of it, feels pretty much what it’s been like communicating w/ CF these past couple years … LOL . .
You HAVE to watch the first 30 sec of the 2nd one. Just think CF trading miners while watching!
That was hilarious; best comment yet.
CASONNNN … :-O Et tu, Brute?
… do not encourage him….
Sorry, he doesn’t get too many good ones in so wanted to give credit where it is due!
true .. true…. he is a little slow outta the gate…
….soooo, what you’re saying then is ….. I do? wink 😉
Nice run, currently overbought, IMHO. Expect a pullback
Hi Bill…. you wrote me yesterday (see below) I saw it now.
THANKS BILL… I’m still in Gold, when you have an update -or your chart- please let me know. Kind greetings.
“Geurt, I really don’t have any charts of Miners and Gold right now. I’m afraid we will get a short bounce and then another leg down. I expect GDX could reach $13.80 and Gold could reach 1095 (1093 already beat my original post). At that point everyone will pile in and the carpet will be ripped out. At this point its too early to tell, could just move higher. If you’re nervous and want to get out, look for those numbers.
yeah, GDX ran up to the $13.80 area and roughly tagged the 50sma today , but couldnt get through it
GDX seems to be basing now, I’d look for a gap up soon maybe tomorrow at the open. That would be a really good sign.
Man, check out DRD now. It was only up 6% when mentioned before. ( And HMY too)
Well DRD and HMY just launched after lunch time, I’m going to have to keep an eye on GFI now. 🙂
I get so frustrated when GOLD and GDX moves are disconnected! Gold keeps climbing, GDX basing. Better get a nice gap up in the morning.
momentum still looking a bit crappy on GDX/J.
daily & 4hour now below 0 line.
need to reverse direction rapido
I look at GLD with a 50sma, and that looks rather perfect.
SLV has a nice strong bounce with good volume ( to the 50 sma), looks good,
Then GDX & GDXJ no reaction, trapped under the 50sma.
I agree- That IS frustrating
I’m out of miners and in UGLD instead and can tell you while I’m down a couple of percents, it’s a heck of a lot better than if I had been in NUGT, etc. With all equities this weak, the better position may be physical metal until we are a better sign in mining than we have right now.
Alex,
Just a quick Head and Shoulder target on the Russell.
Any concerns or comments?
I think the Russell is leading IMHO.
The question isn’t if we get there but how – how straight is the line. Let us know when you do! Or I will. 😛
Yes, I agree, in fact I had that chart in my weekend report
Who can explain Us Steel and Alcoa being at all time lows or close to it? Everything I read is positive for 2016.
Peeled off a little more of my HDGE today at 11.80
Not profiting from the position, but it’s nice to see SOMETHING green when everything else is red.
ProShares Short S&P 500 (SH) has a very close correlation to HDGE; either one works fine for a 1x S&P short.
(refresh)
I know that feeling. I’ve talked about some of the short positions I’ve had, but they are hedges where I’m just trying to curtail other damage.
I find HDGE to be good for “panic prevention”.
It’s all about keeping emotions neutral as much as possible.
Was hoping to add back to HDGE if/when SPX bounces to 50 day average.
I’ll have to keep this one in mind – I haven’t done a particularly good job with hedging in the past. Yeah, really want to see markets bounce back up, if so I’ll put on some short positions and likely reshuffle the portfolio.
GPRO. IBB. OH MY!!!