
Homework
Over the past 2 months I have received one specific question about Gold , Silver, and Miners often enough to know that it’s important to the readers here. Even though I answered that question in separate emails, I have already done the homework, so why not share it here in the weekend report to benefit everyone? First, a market review…
.
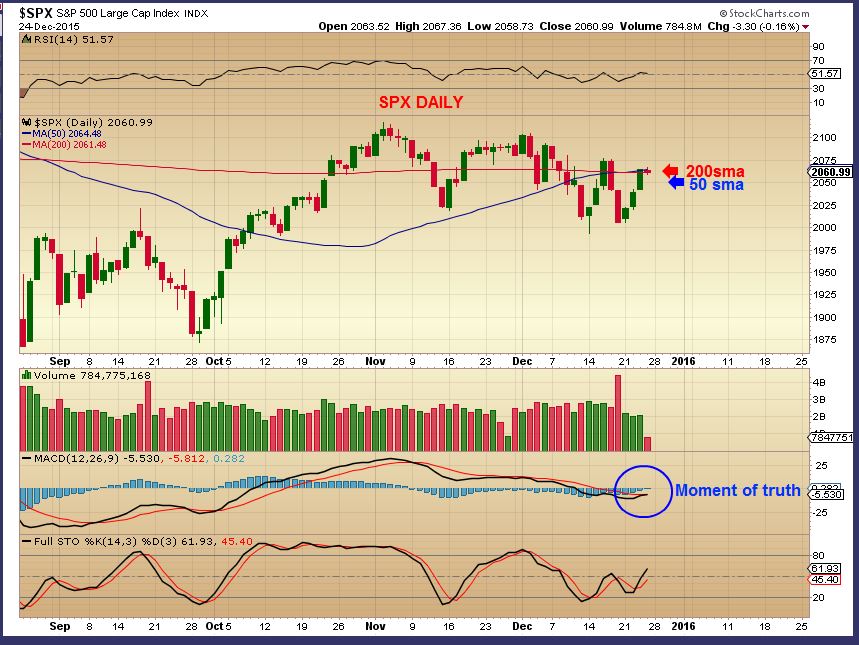
SPX – This is the area that I have been pointing out for the markets to prove themselves.
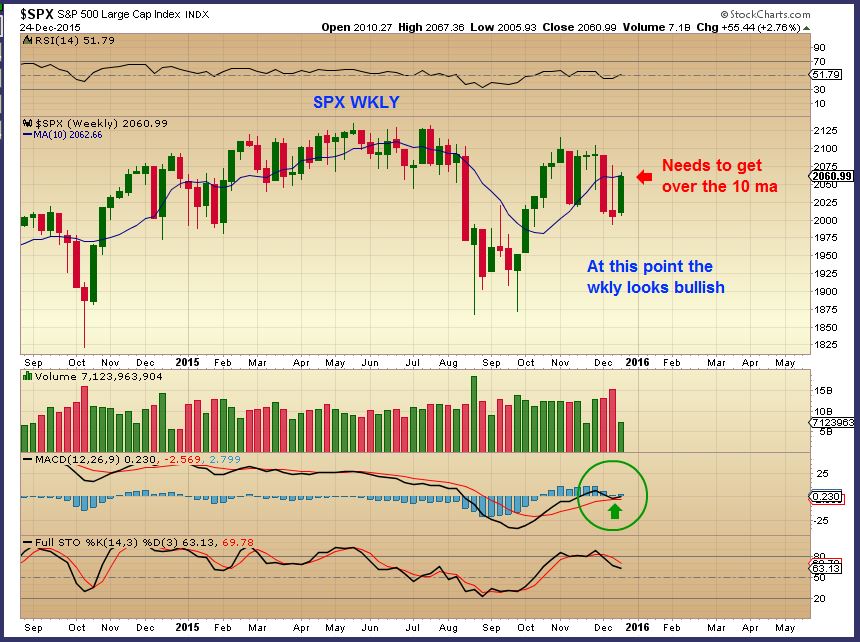
Now a look at the SPX WKLY chart…
SPX WKLY – This actually looks bullish so far, and the MACD curled upward, but it needs to recover the 10ma wkly next. A year end rally will improve the chart, a drop into the year end will look like rejection.
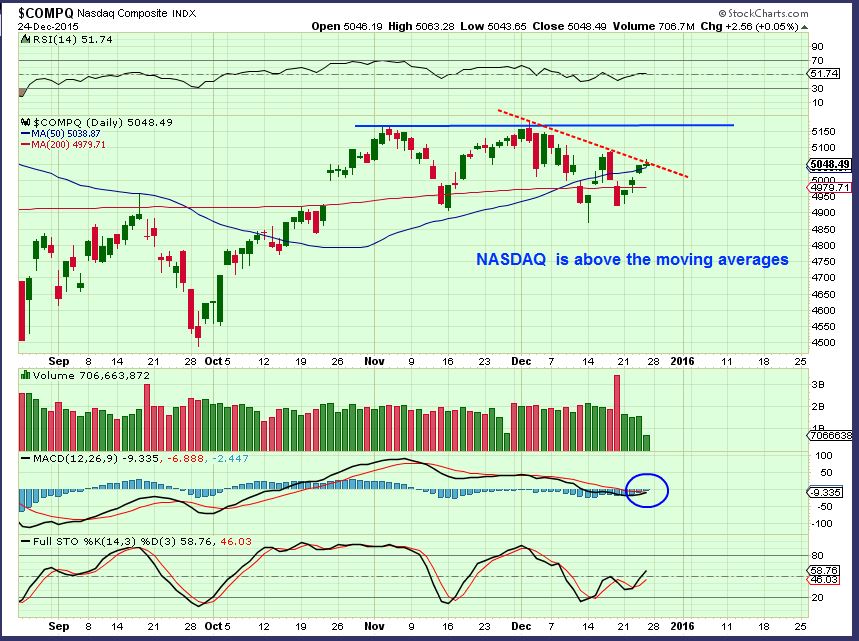
NASDAQ – The daily chart did recover the 50 & 200 sma, but the end of the year may reveal if it has real strength or weakness.
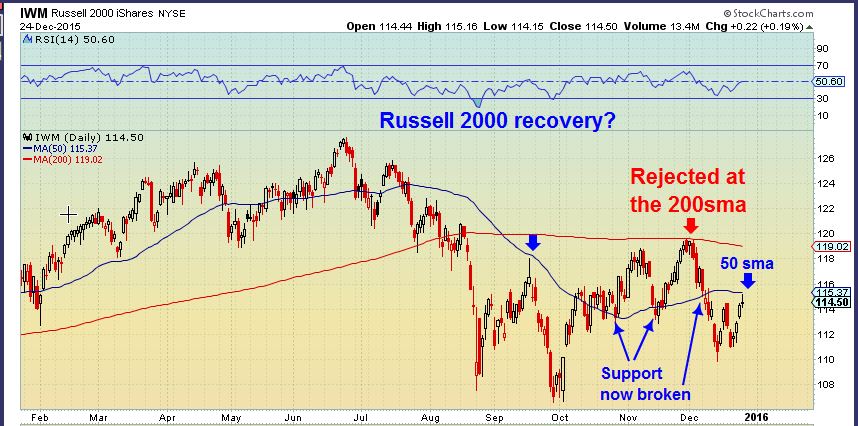
IWM – This has lost support, regained support, tagged the 200sma and was rejected, and now broke down through the 50sma and is approaching it again. Looks rather weak, huh? So the markets are questionable going into 2016.
,
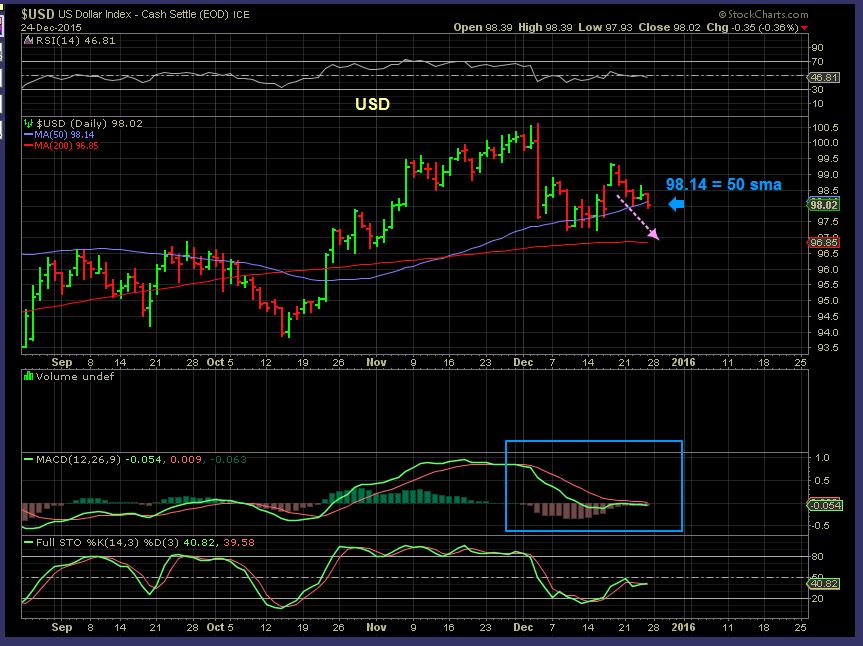
USD – I have mentioned weakness in the dollar lately, and that was a BIG one day drop in early December. Thursday it closed below the 50sma and may drop further to the 200sma. This still looks weak so far.
.
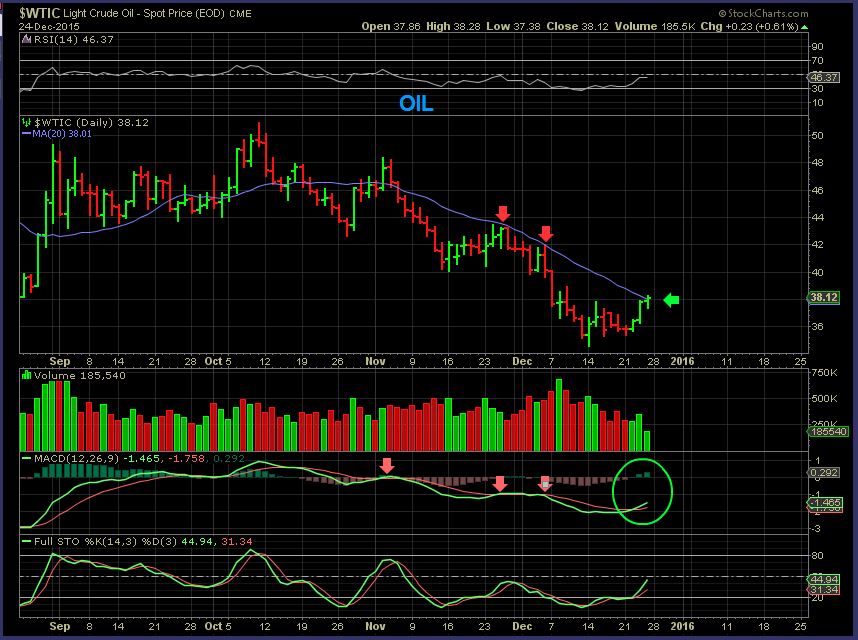
WTIC– Oil got interesting this week. It is bullish short term ( And maybe longer term). I said weeks ago that OIL was struggling at the 20sma and the macd couldn’t cross higher, so I was watching those areas on a daily chart. Oil closed above the 20sma Thursday with a macd cross on day 8 of a new daily cycle. Note: The RSI DID NOT turn higher, it went sideways on the bounce, so I am watching that short term.
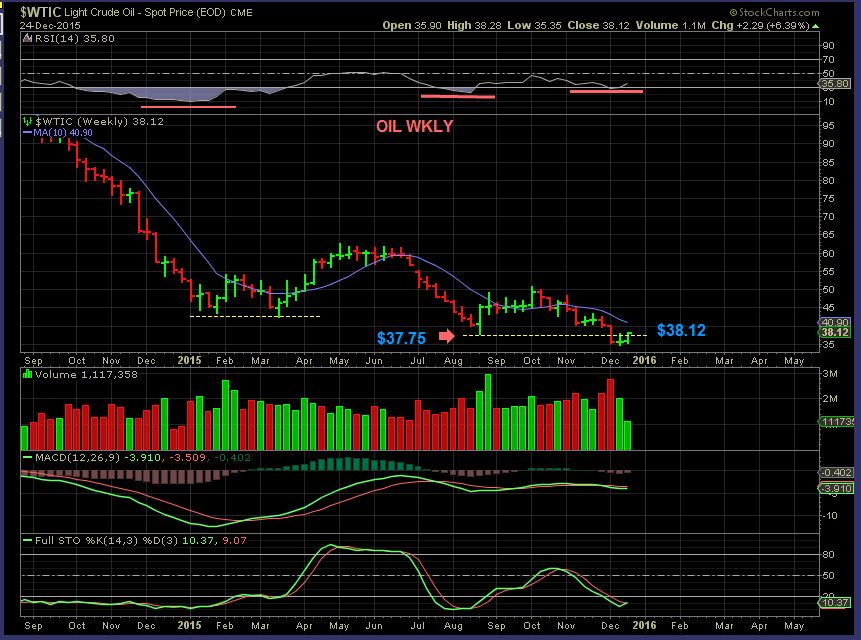
WTIC WKLY – On a weekly chart, Oil looks like it could have put in an ICL. We see a high volume capitulation type candle 2 weeks ago and a possible shake out/ recovery move that usually results in short covering rally. Was that a shake out?
.
.
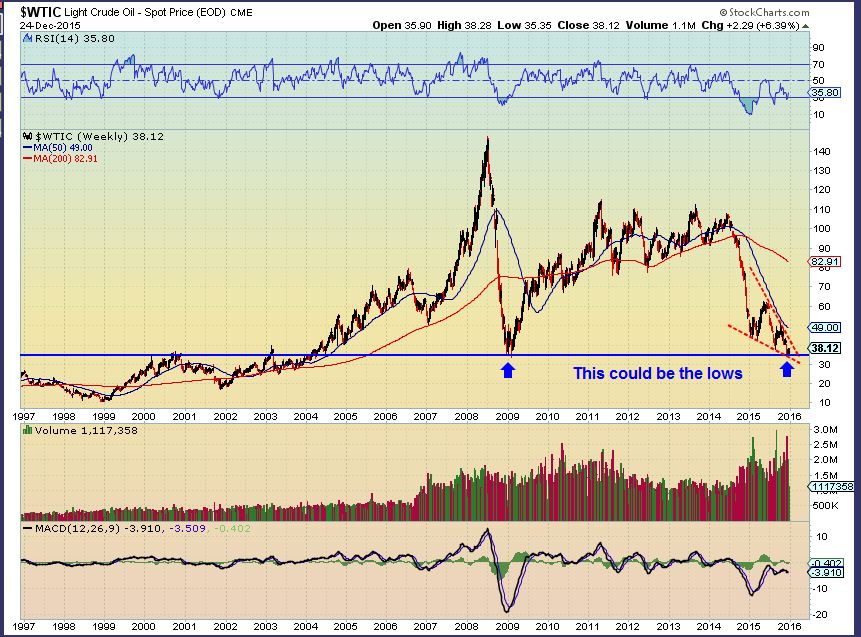
Also the OIL BIG PICTURE indicates that this may be THE LOWS. That Relative Strength says a lot about minimal downside left .
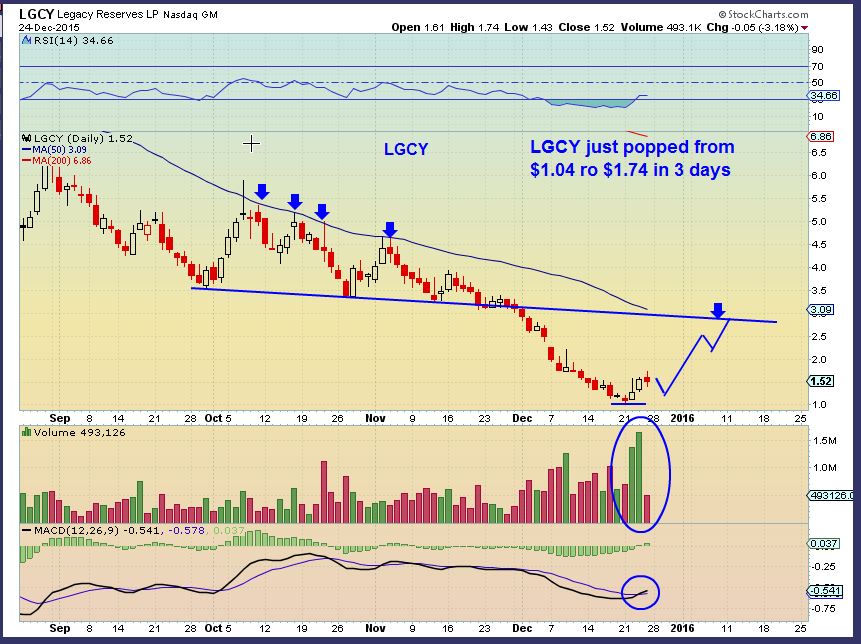
Some of the Energy stocks have been slaughtered and traders are catching bounces of what could turn out to be 100-200+% if Oil has bottomed. I will be looking for higher lows as possible low risk set ups. Look at LGCY as an example:
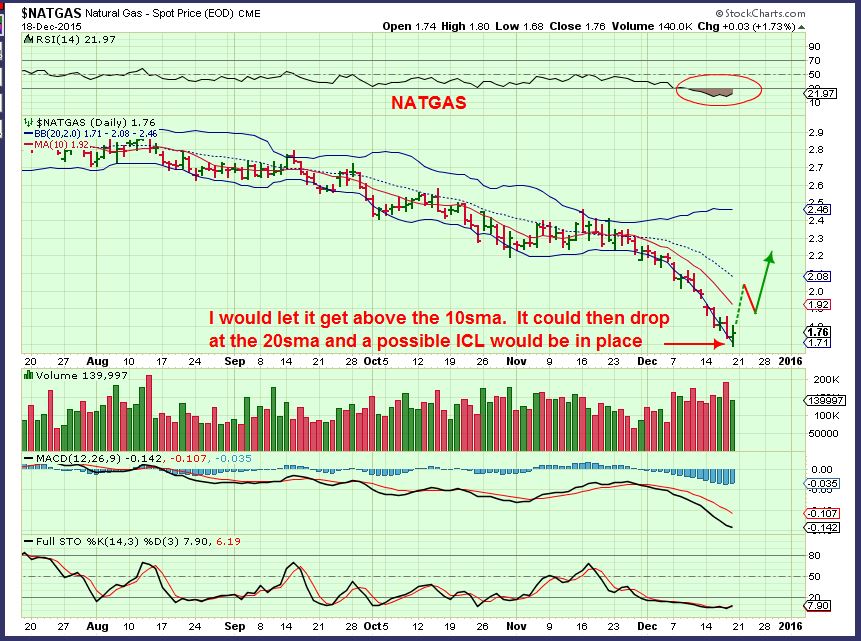
NATGAS – On Dec 18 – Natgas had run very low and deep and I had mentioned that it is due to put in an ICL timing wise. I pointed out a possible run up to $2.08 ( 20sma) , a dip, and then another leg higher. The dip is a buy.
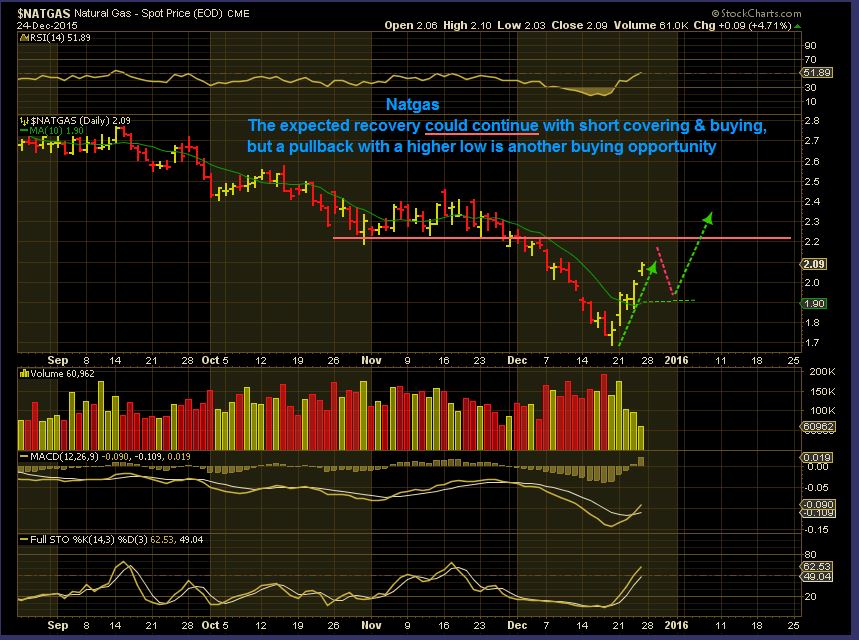
NATGAS – NATGAS has run quickly to $2.10. Now it looks like it could run to resistance near $2.20 before pulling back, but I think that the pullback will be a higher low and a buy. The green line is the 10sma which will be curling up soon.
.
GOLD SILVER & MINERS ( And some homework)
.
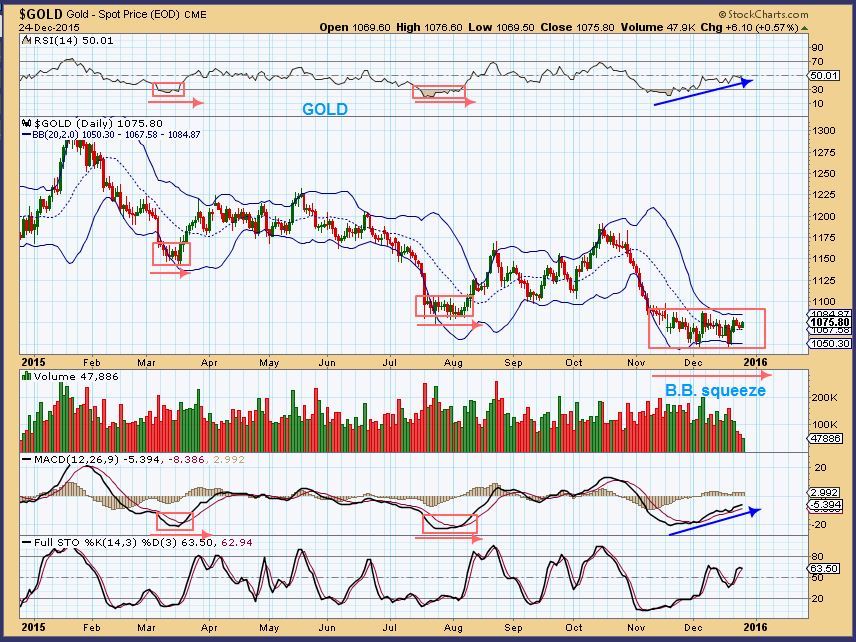
GOLD – We have a sideways consolidation at the lows. The RSI is rising quickly though price isnt, that can be bullish. The COT is strongly Bullish, and…
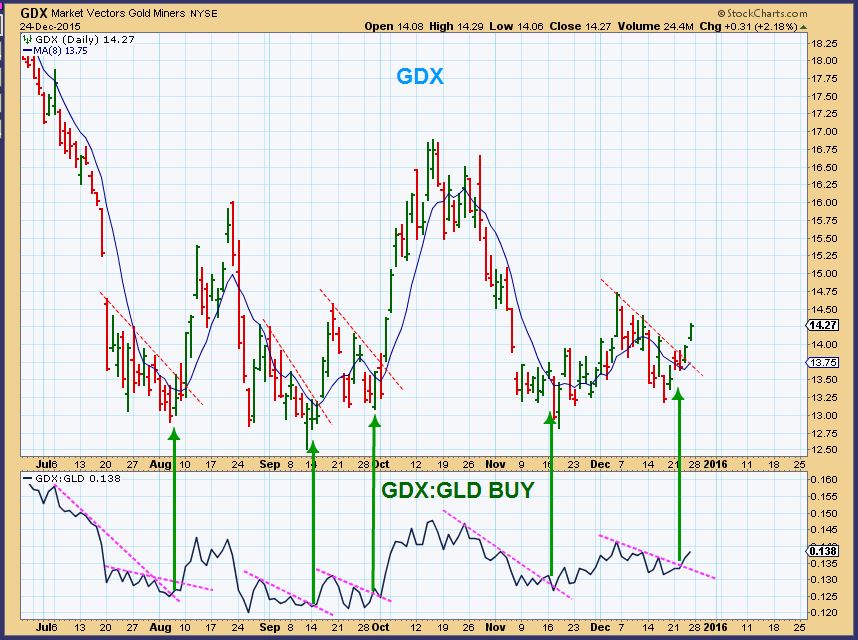
Miners have taken the lead again. Often that is viewed as bullish.
.
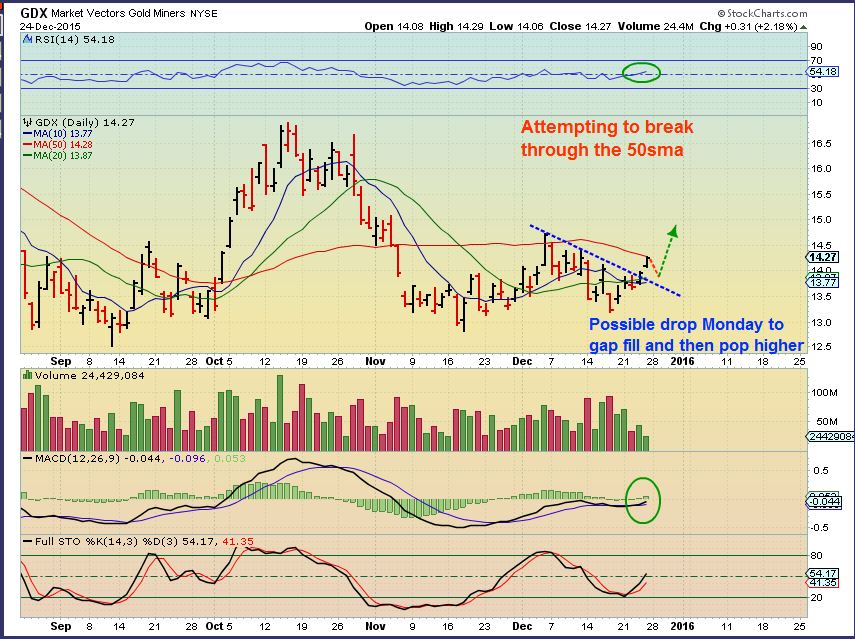
GDX DAILY – GDX broke above that blue trend line that I have been pointing out. It may break through the 50sma or we could see a brief gap fill and then a move higher. Miners are a buy at this point, using a semi-close stop under that trend line. Obviously individual Miners have stops based on their buy points, like SA loosely below the 50sma, etc.
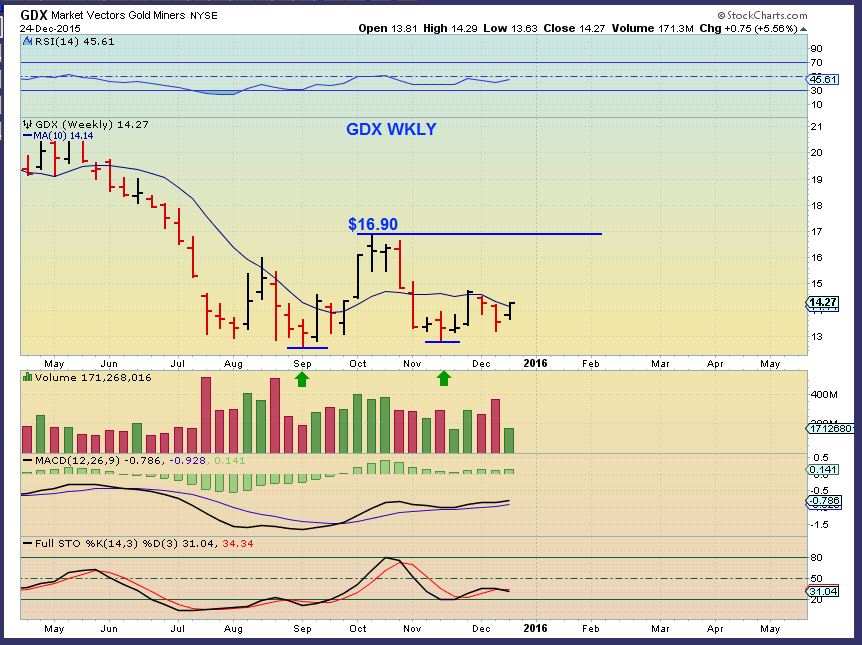
GDX WKLY – Nice weekly reversal and I am pointing out that we have higher lows since the September lows. Higher highs in time would become quite bullish too ( above $16.90). If we get a series of weekly higher highs and higher lows, I think it will draw in a lot of buyers who view this as the start of an uptrend.
.
THE HOMEWORK
.
As mentioned, I have been repeatedly asked the question , “What will Gold do in a rising interest rate environment.“
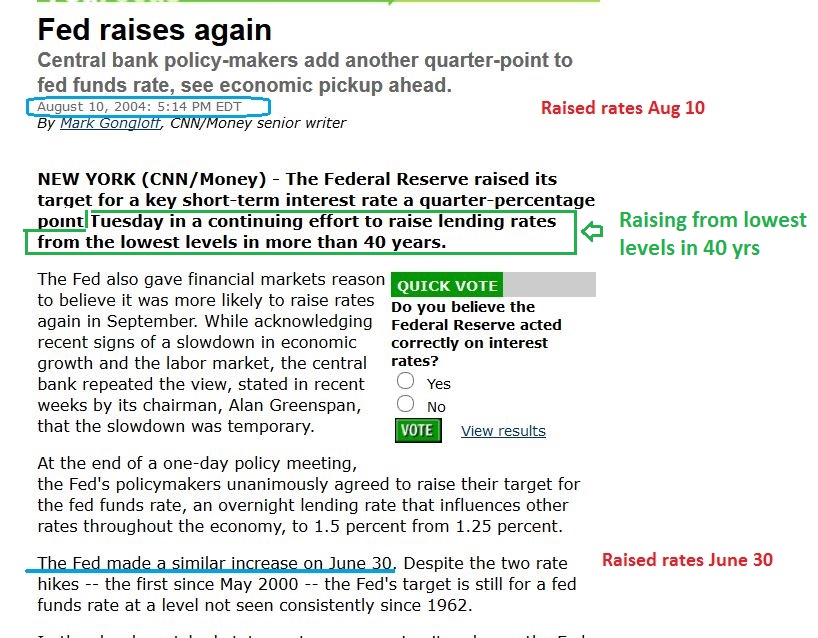
I would say there are various factors to consider, but I did do some homework to add weight to the answer that I have been giving. I have been saying that I remember in 2004 when the FED would surprise the markets with a rate hike, it was bullish for Gold once the dust settled. Here is my homework in behalf of that answer.
.
I want to first note 1 difference and 1 similarity, which will also be proven here.
1. Gold was already in an uptrend after putting in the lows in 2001 (different than now).
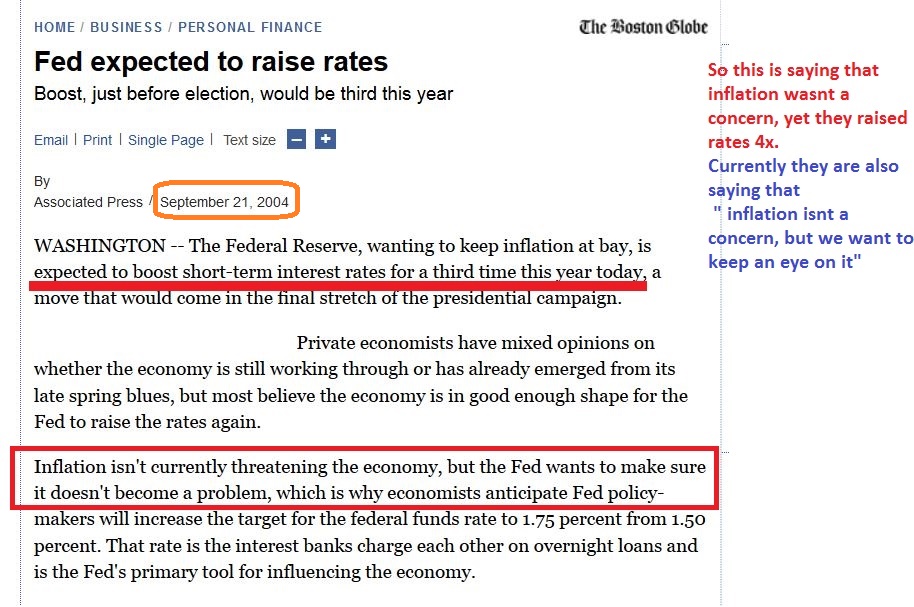
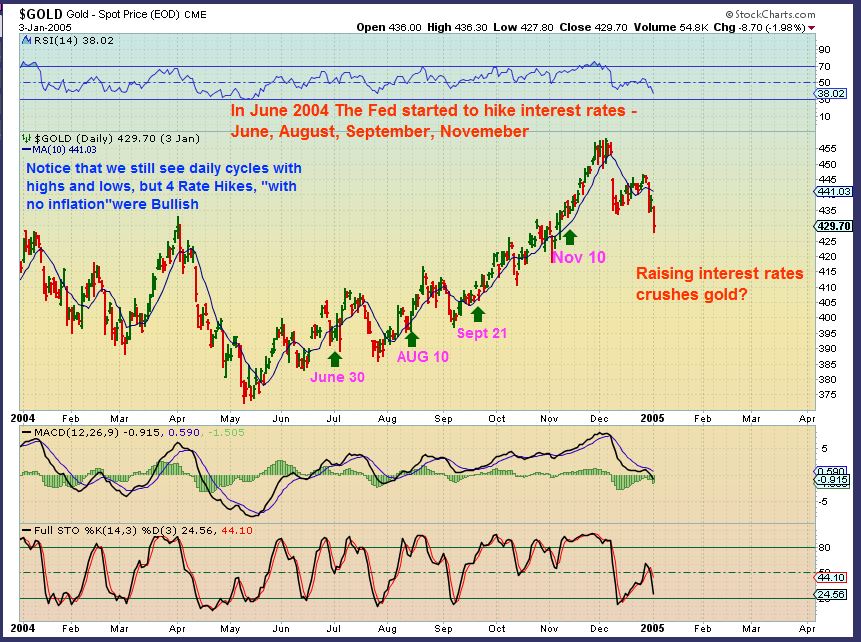
2. The FED said in 2004 that inflation was NOT a concern ( But they raised rates 4x). Same as now.
—–
Please note that this article discusses a rate hike June 30, 2004, and then AUG 10, 2004, from the lowest rates in 40 yrs.
.
 .
.
Please note another rate hike SEPT 21 , 2004
.
.
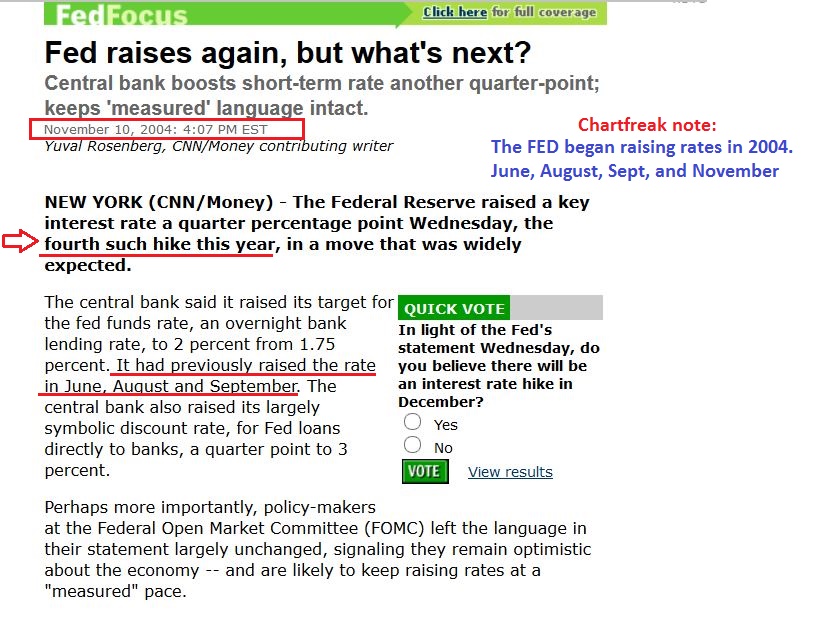
Please note November 10,2004 … a 4th rate hike in 2004.
.
.
So now we know that the Fed raised rates in JUNE, AUG, SEPT, NOV 2004 – what did that do to the markets?
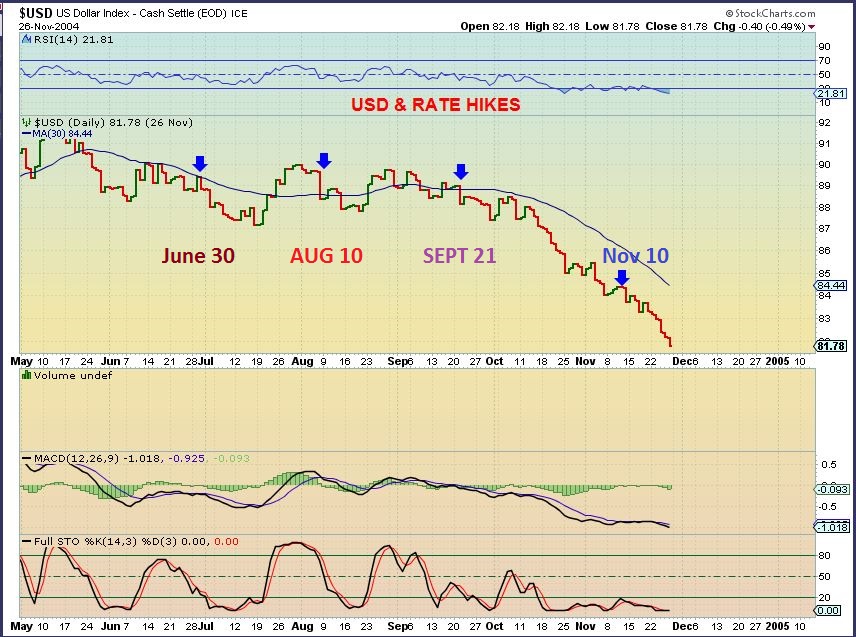
I swear that almost Every article that I read is saying that rate hikes are USD Bullish, right? It wasn’t in 2004.
.
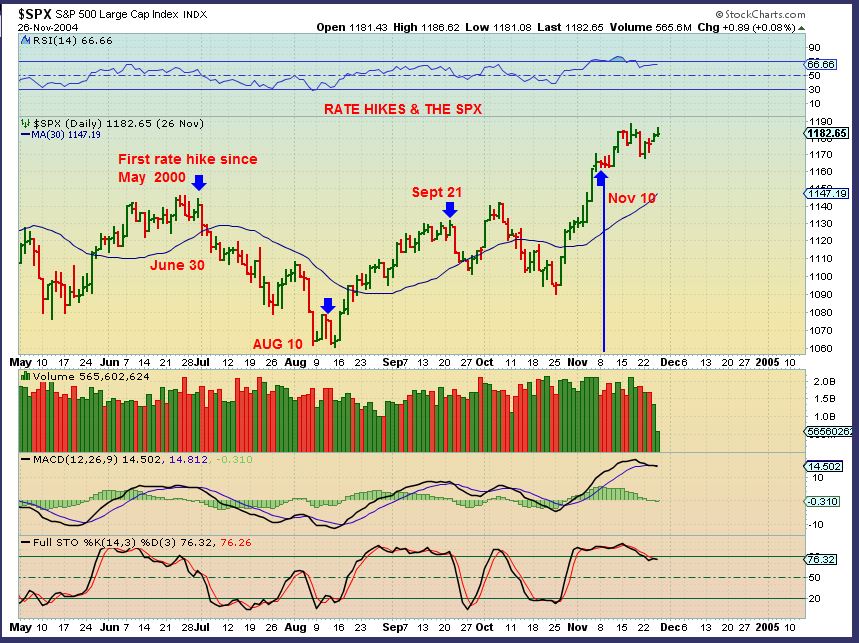
SPX – The markets had a mixed reaction when the Fed raised rates. Markets dropped and got jumpy at first, but overall they were higher after the 4th rate hike.
The one we’ve all been waiting for…
,
What happened to GOLD when interest rates were hiked after being held down for 4 years? Gold actually popped with each rate hike. Basically Gold went higher from May to Dec, with normal pullbacks. Interest rate hikes did not kill Gold, even when the Fed said , “We are currently not concerned about inflation.” They say that today too.
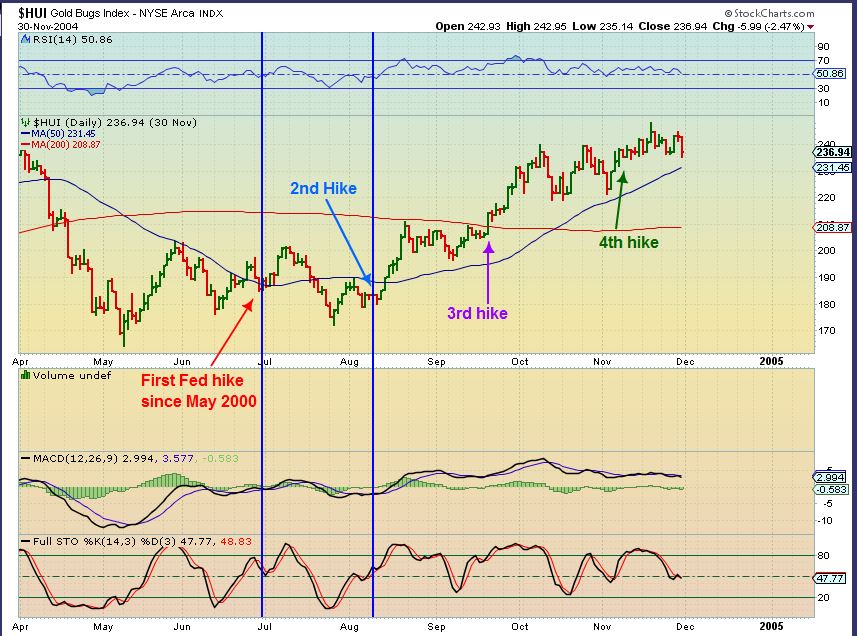
MINERS – GDX was not around back then, but we used the HUI & XAU to track Miners. I see normal cycles, maybe you’d see a 1-2-3-4-5 if this was a weekly chart, but any way you look at it, rate hikes did not “kill Miners”. The HUI went from $170 to almost $250 from July to Nov 2004. That’s a rise of about 50% with 4 rate hikes.
In conclusion: That really only answers the question “What might Gold & Miners do with interest rate hikes?”. They can and have risen in the past. However, current conditions are bit different. Gold had already bottomed and been trending higher in 2004, so what WILL happen this time remains to be seen. SO FAR, we had a rate hike in December and Gold didn’t really flinch, it looks poised to move higher. And with this above information , at the very least, you can laugh out loud if you read 1 more article that says that Gold will surely get crushed in a rising interest rate environment, and it is always Uber bullish for the $USD. I say if they’re going to write an article about it, tell them to please…
‘Do your homework’. 🙂
Big Picture: Another area that we will have to do our homework is in the Commodities sector. I think that several areas could possibly be currently lining up for some big % moves in 2016. Look at 3 year charts of X, CENX, AKS, etc for example. If Commodities run higher, these will do very well, but it will take a little more time to see if things continue to line up this way. Double bottoms or higher lows will begin to form in Commodities, Precious Metals, etc. when their final lows are in ( they may be in already in some areas). The trades / investments could be very good. The $USD may be double topping, that should push Commodities, Precious Metals, and OIL higher as the USD drops. The changes that are developing could become major turning points, so we’ll keep monitoring the big picture as well as the short term trades. Thanks for being here and enjoy the rest of your weekend.


A ton of work went into this “weekend” holiday presentation. Thank you once again. And happy holiday seasoning 🙂
Thanks for this Alex. Happy holidays!
Thanks for the report Alex. Great analysis as usual. One thing that continues to give me pause is the balance sheets of many (the majority) of oil and gas companies. Given the massive debt burden that these companies are carrying, the idea of rising rates does not jibe well with improved profitability because servicing their debt becomes more difficult. So while the technicals look good, I continue to struggle with the idea of this bounce being anything more than just that. Some of the stronger Canadian names (like PXT) certainly aren’t buying the move in oil yet, but we’ll see what happens. Higher oil prices would certainly ease the burden on the revenue side, so it’s kind of a mixed bag I guess.
This is a concern of mine, also. In addition, there’s the issue of oil company hedges, which are the only reason some of the oil producers are still able to make their debt payments. Any company that still has hedges in place is going to see those expire next year, and unless oil recovers significantly (above $70 in some cases), the other shoe is going to drop on these outfits.
This has also been cited as a reason for a cap on oil – that if it does get back to $55-$60 area, firms will rush to hedge and lock that area in profitability this pushing price right back down. Very unlikely that oil could make a quick recovery, certainly not without a significant change in supply fundamentals.
Liking GDX compared to september on your chart. The gap fill looks reasonable for last few days of the year.
Everything is just all stretched out with all this Fed pride…
I like to track the NYA as there is no futures market in that index to push it around. The NYA quit going up just as soon as the dollar started to rally last year. And the NYA is much weaker than the other indexes. I tend to think the NYA is indicative of what is really going on underneath the hood of the market.
Granted I’m not brave enough to short the stock market, but I think the S&P, Dow and NDX are signalling more strength than actually exists.
Notice also that the yearly cycle low in Aug. dropped below the YCL in February of last year.
A failed yearly cycle. Hmmm….
Of course as I buy the breakout in miners, they fall hard the next day, couldn’t script it any better. But we talk about a gap fill and resting the breakout line above, so as long as we are following that, still feel plenty safe, may look to add as I (by design) took extremely small starter position. I expected some pullback but wanted to be in the game in case we shot off.
I don’t like the spot VIX up 14% on a fairly orderly S&P pullback, but not enough to move VIX futures into backwardation.
This is why I only day-traded UCO last week. Interesting the Nat gas /oil divergence so strong today as they had traded somewhat in tandem. UGAZ up 20%! A few energy names remaining relatively strong in comparison. GDP up 13% (like still in reaction to recent stock offer close, full article avail on Yahoo finance).
They sure shook out silver last night but silver stocks aren’t reacting much. I think this is the final shakeout before a big move up in January.
Agree Carl
Take a look at GPL on a 1 year chart. Silver crashes to new lows in August, November, and December – and GPL bottomed this summer (Among others) and doubled actually up 100%. I point out GPL simply because it trades under $1 and usually they get killed when metals hit new lows, so some areas in Miners do appear to be bottoming ahead of the metals.
Carl, thanks for comments. SIL looks pretty rough today, but in context, certainly wasn’t a big surprise for pullback today. Are you adding here or looking for next sign of strength? Silver certainly dipped more than I expected. Remaining hopeful.
I’m pretty well all in on miners for now not counting some adjustments. I went to see the The Big Short over the weekend and now I am more brazen. The big banks are on our side now based on the COT (at least for awhile). You know if there is going to be a real turn in the PM’s they will be on the right side of it.
I probably wouldn’t have gone long here without the COT where it is. I’m done fighting against the big guys, man. I saved some powder for this pullback. Was also in ‘show me’ mode after rate rise. Was OK with missing beginning of move just to be sure.
Sold half my UGAZ position when NG got above $2.20. Will add on a pullback.
Possibly day 6 on GDX if that DCL is in place.
.
As a trader: If buying the dips ( and I did mentioned in the report that we could see a gap fill on GDX Monday) , I would look at the 15 minute chart like this.
.
It makes it low risk, if you enter near support and stop out a bit below. (Click to enlarge)
.
I should add to this statement that it may be best to start small positioned, because we could always see this daily cycle drop further and be a 29 day first daily cycle, instead of a new dcycle. ( I tend to think it is a new daily cycle on day 6 at this point).
Hi Alex,
If this was day 6…..what is the expected time frame for a high this daily cycle (i.e rally for another 5-7 days)? Does that also correlate with the USD ?
thx
Hi Curtis
I would expect it to hold up and possibly run right into the first couple of weeks of January, but the idea of rallying for a week or 2 in some peoples minds would be straight up. That may not be what we see unfold.
The unfortunate part about putting in choppy lows / bottoms ( if that is what we may be seeing) , is that it could mean a nice run higher for 5 days in a row, or it may only mean 2 days up, 1 down, 3 up, 2 down, etc etc with only a marginal new high.
There is no way of telling what kind of run higher we will have. Looking at GDX, I would expect at least a break higher again of the 50sma, but we may only see what is on this chart. (refresh)
Let me add that the last daily cycle was L.T. , so we should expect new highs.
Maybe this is the last bout of tax selling. A few stocks have gotten ugly.
I thought maybe we’d be past that by now, but maybe not. Ok, taking one last shot here, added just before close, but if we can’t close week above where it is now, I’ll be out for sure.
Excellent report Alex !
Very nice correlation on 2004 Gold with rising interest rates vs now.
Although I am long GDX since the November ICL I am cautiously optimistic…….the financial world changed with the 2008/2009 financial debacle where now a few very large Banks now have control since that bail out and still do imho, most likely directed by the Fed via currency and Gold futures manipulation until……………….they DON’T !!! Patiently waiting. 🙂
Thanks Ken,
I pretty much agree with cautiously optimistic.
I honestly feel like we are slowly seeing the BIG changes slipping into place, but I am just ‘trading’ anything for now. I will trade the bottoms ( since they may only be temporary bottoms), but once we have a good set of higher lows and higher highs – it could be an investors market in Miners or Commodities too.
Right now I like the Miners higher lows from SEPT 11 ( GDX) and some individual miners placing lows a while back, as pointed out in NG, RIC, etc . We just need some higher highs and time to go by before we can gain that type of conviction. And UNTIL THEN, I still like what I think We see with SA, NG, and now a few others – possibly could be putting their long term bottoms in place, also until…………………They Don’ t 🙂
I could Not agree with you more Alex.
Ya gotta have some skin in the Game for sure…….with risk control, needless to say……if we both are seeing a possible “shift” in the Miners I am looking forward to adding to those positions in the future ! 🙂
SA, NG, and MUX are my long term plays fwiw.
Personally I like all of them especially MUX.
nice,,,,, my favs ;o)
Then there is Crude Oil………which is the most important commodity in the world with High supply right at the moment but improving.
I am also on board with you that the Dec. 21 low might be an ICL ???? If so…..I would like to see a five wave up move first (first DC ?) then a 3 wave move down touching atleast the 50% retracement level (1/2 DCL ?), at that point I think I will release my hedge and add to my core oil jr. holdings………fwiw.
The old 1-2-3-4-5 , a-b-c . Maria will appreciate that 🙂
she does.
pretty sure he knows that as well …
The point I was trying to convey was that the WTIC ICL needs to prove itself.
Would that be an early ICL Alex if Dec. 21 low holds ?
I thought we had 1 more daily cycle left, but it wouldnt be ‘too’ early i.m.o.
wow… ugaz…
Sold it way to early!!!
I told Bill, I think it will go to 2.20 and….. it did.
Sold all of mine today. Hopefully will get a pullback here.
Nice job Geurt..profit is good. ☺