
Whats Ahead?
We finally got an interest rate hike out of one of the 2015 Fed Meetings. It appears that various market sectors seemed to like what they saw. Lets review…
.
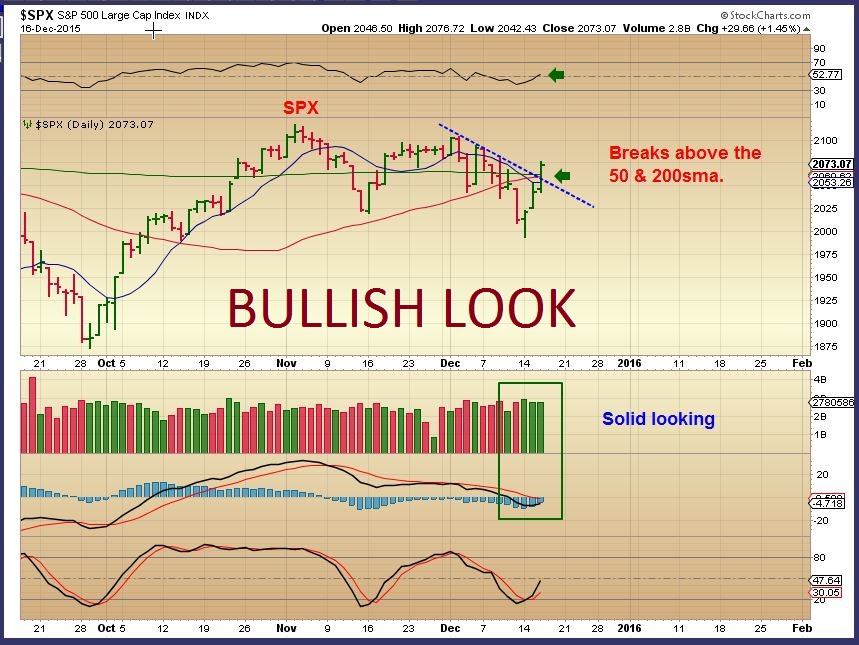
SPX – The SPX looks Bullish, but I do want to share both a bullish and also a bearish version.
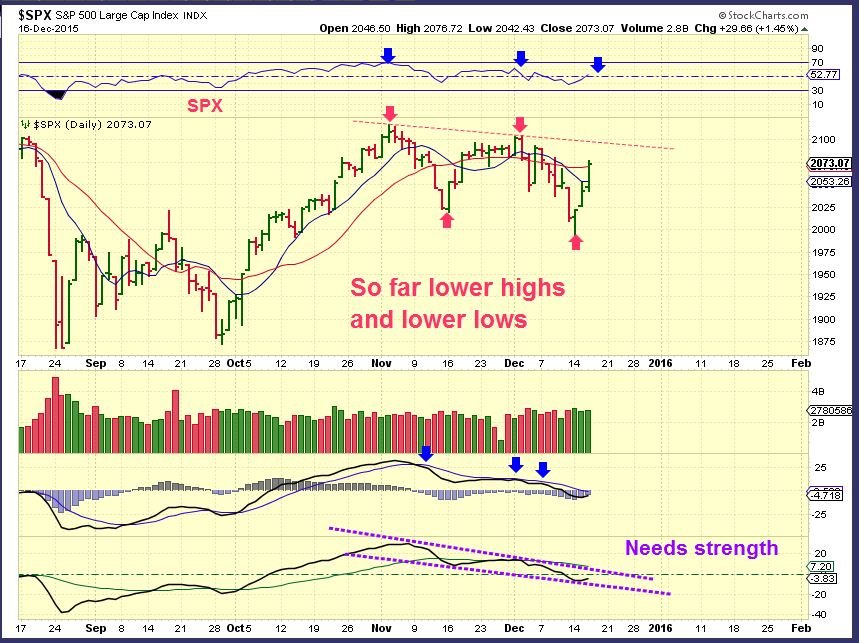
This is the bearish version…
SPX – In this chart you can see that the SPX needs to make higher highs soon or else it remains in a downward sloping trend. I do see many bullish stock charts, so it seems more bullish than bearish. It does have a little work to do longer term.
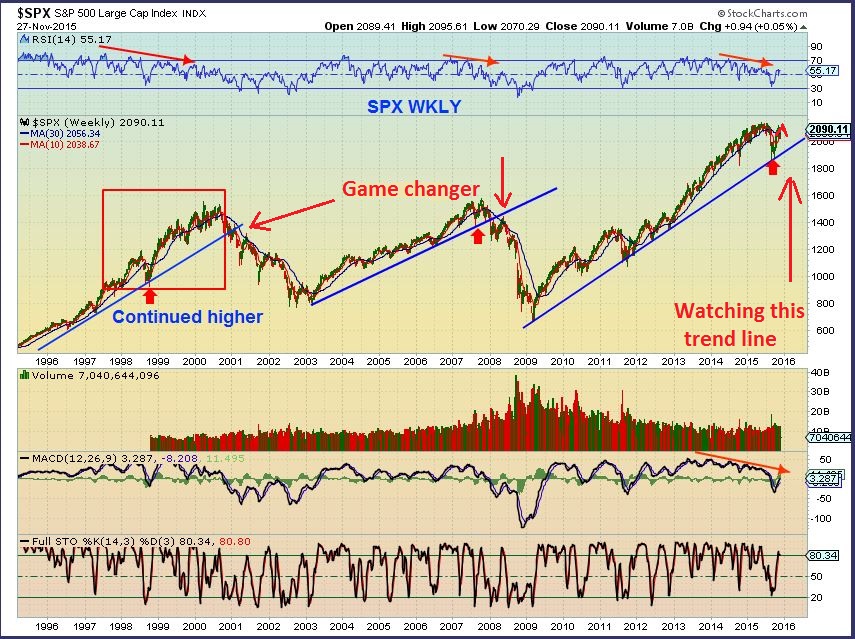
SPX LONG TERM – I am still watching the long term chart that I shared from November in an earlier report, and you can see that 2000 was a support area. Looking at the ABOVE chart, you see that that is where we just bounced from.
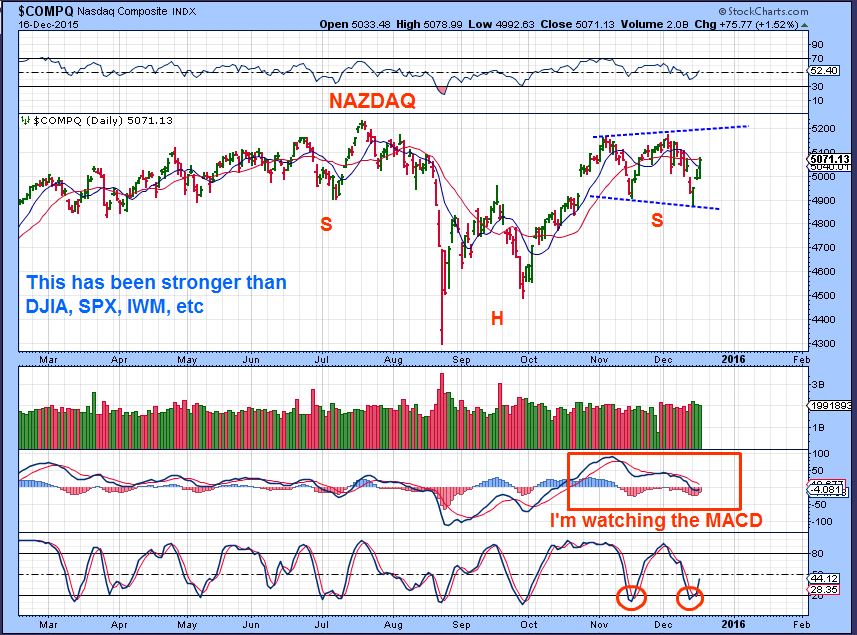
The NASDAQ has been stronger and did make a new high, but it still fell to new lows. That can become a bullish megaphone, but there needs to be real improvement with the internals. For now we will return to highs, but after that we will see.
This could be a giant inverse H&S too.
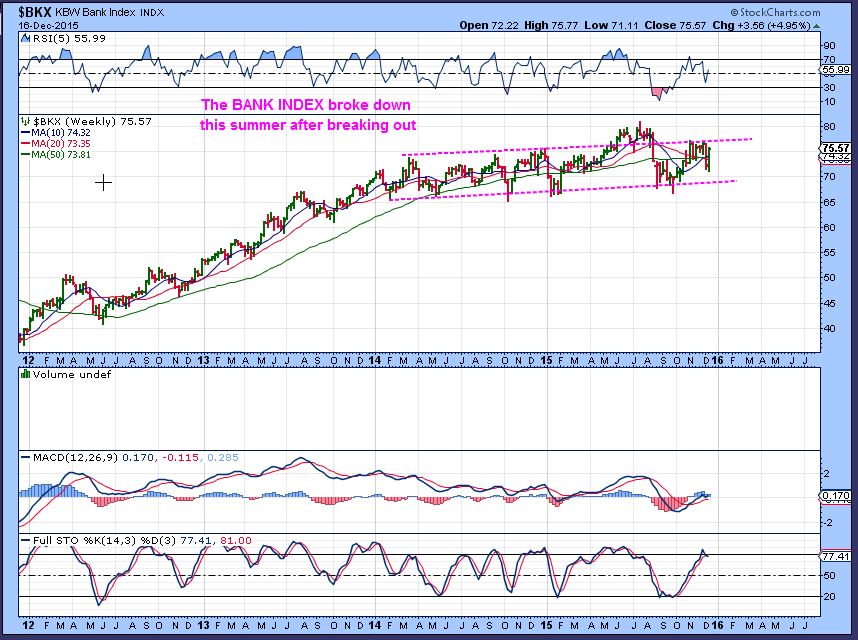
Recently I pointed out that many sectors were breaking down, and one of concern was the Banking Index. A Rate hike should help the banks, so lets see what the charts are telling us. With an interest rate hike, some BANKS could be a longer term investment for those that like to BUY & HOLD.
BKX- This index was breaking down this summer after a false break out. This weeks candle is a nice reversal and the banks may set up to break out higher with the Fed Hike.
BAC – This consolidation has lasted for 2 years. I drew a sideways move to allow the MACD to improve. The daily chart of BAC looked horrible lately, so I would watch the daily chart for progress or deterioration.

JPM – This daily chart actually looks like a shake out and possible break out coming.
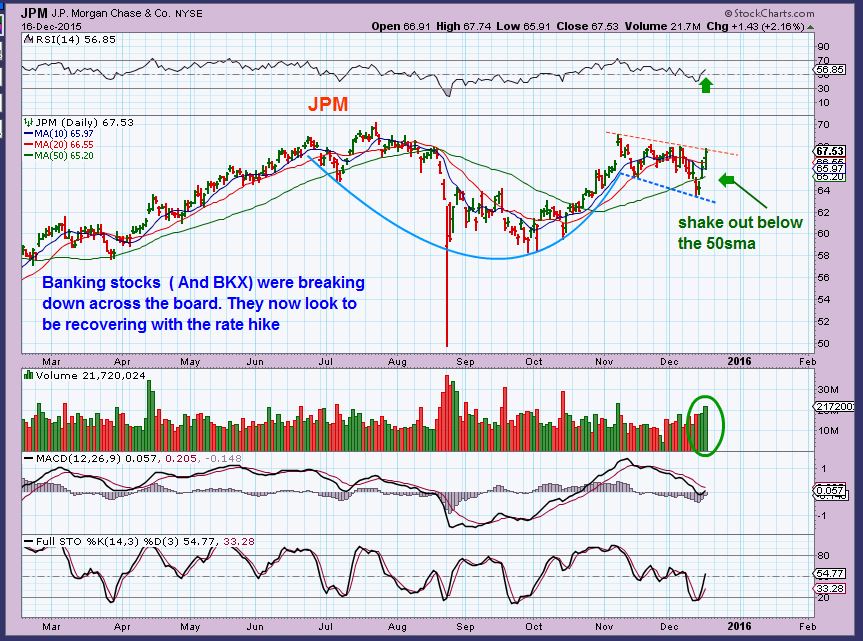
So the Banking sector may now become an interesting area to watch. I haven’t looked into the fundamentals of banks.
.
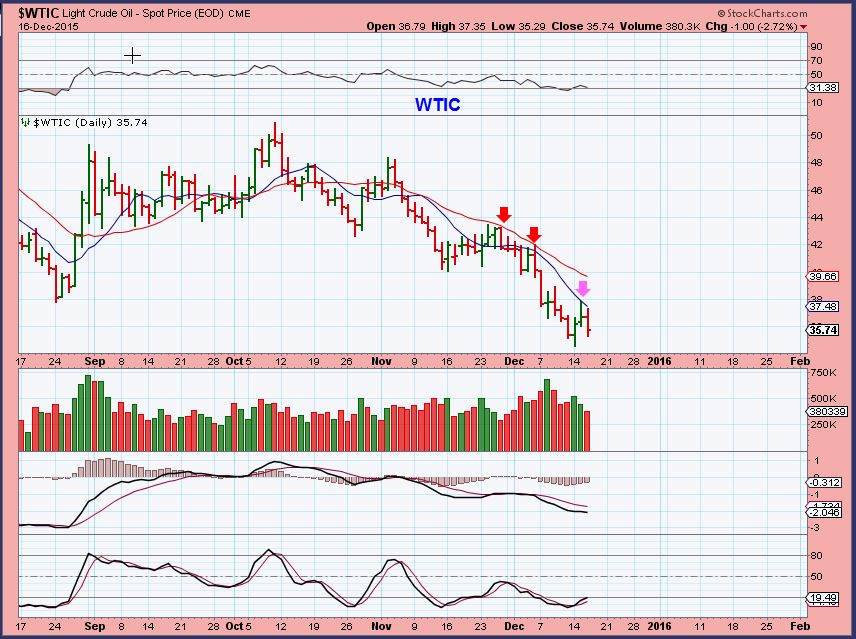
WTIC- I mentioned caution with Oil in yesterdays report. Oil struggled at the 10sma and reversed lower. It still just doesn’t look right, but it may be setting up a nice low very soon. My weekly A-B-C target was $26. I would wait for confirmation of a low.
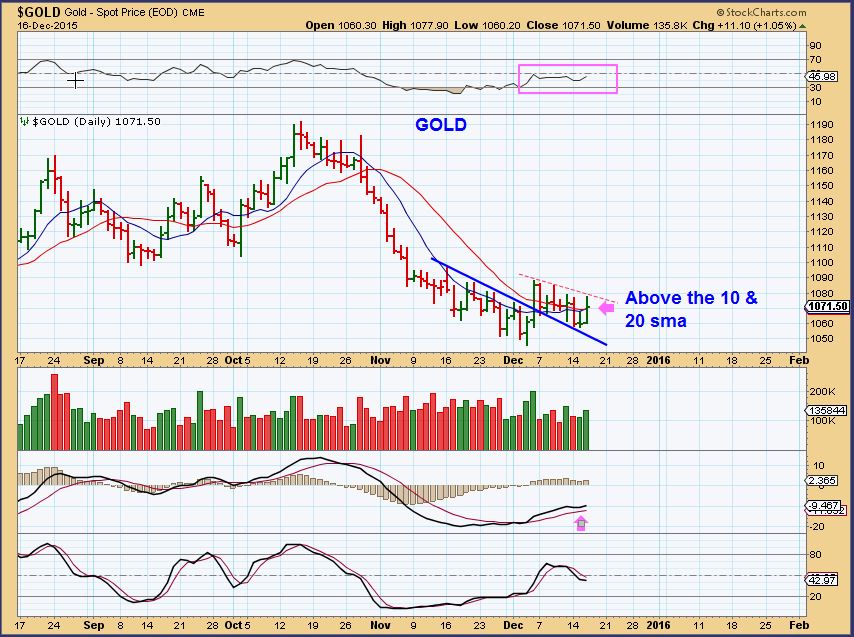
GOLD -GOLD is down pre-market. Is this a Post Fed crash coming? Do you think Gold & Miners are Bearish. This review should help us .
.
Gold looked bullish to me after the Fed Mtg. Ignoring everything else, what have we seen technically in this chart? We saw Gold finally burst off of the lows, drop back and back test that mini consolidation, and now with a Fed interest rate hike, Gold closed up $11. In this sideways move at the bottom, the MACD is rising. In pre-market we are giving it all back. Bearish?
GOLD – On day 9 , a higher high now would likely make for a right translated daily cycle. We dont want to break the Dec lows.
SILVER – Silver has a swing low in place and a nice 3% move with the fed Hike too. We saw a strong move in early Dec , but it fell to new lows, can we trust this move? We now have a strong MACD at these lows with no cross lower and the RSI is almost at 50%, these have bullish implications. Todays pullback loses those moving averages again.

GDX – GDX was up 30 cents and looking strong in pre-market . So strong that I wrote in the comments that based on my past experience, we could see 80+ million in volume by the end of the day.
 GDX did have over 80 million in volume and closed green. On Dec 15th I was noting that a small day with a lower low was good for lowering the parameters for a DCL on day 18 ( or a 1/2 cycle low).
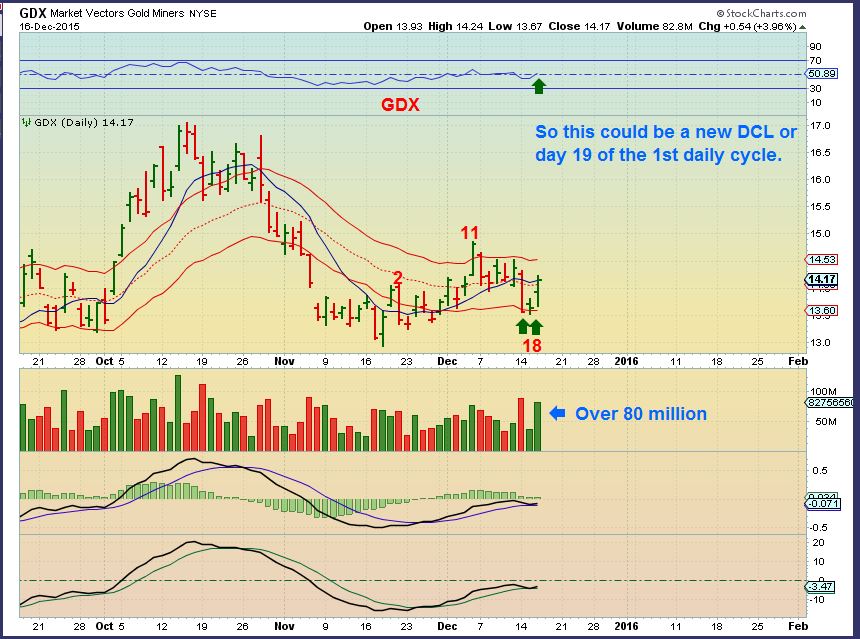
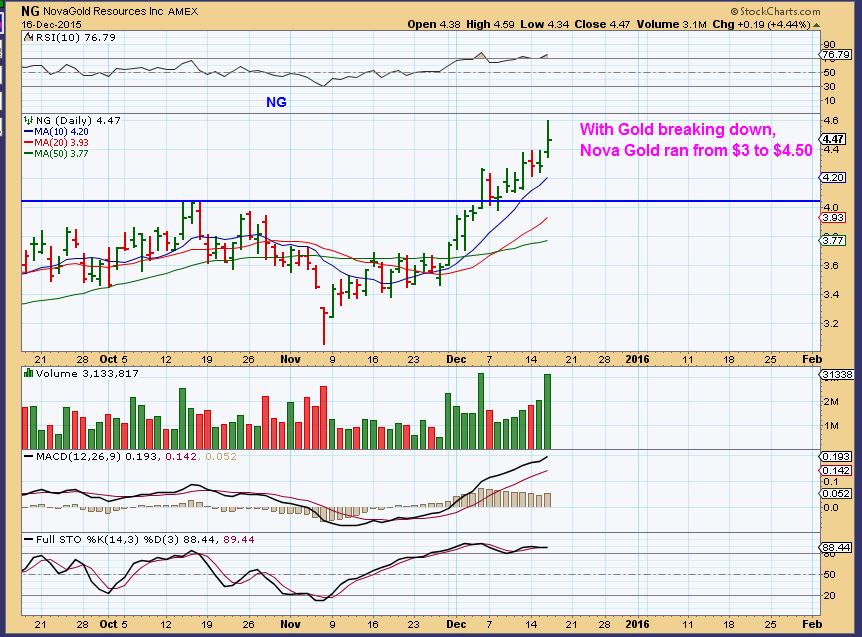
When we consider that GOLD & SILVER have plunged to new 6 year lows, and GDX put in higher lows, that speaks volumes when you think of what they used to do. Gold would drop $10 and some Miners would drop 7-10%. I think that today may offer a low risk buy with a stop under Tuesdays lows. Many miners also set up bullishly. Lets look at a few.
.
When looking at GDX, I always look at GG, ABX, and NEM for clues. Watch these during todays pull back.
ABX – Gold at 6 yr lows, ABX had higher lows and a nice base. One could buy a break out higher, or this consolidation with a stop below the red line. Inverse H&S ( Good for GDX).

GG – That looked like a false break down ( Drawing in shorts) and Yesterday may have been short covering with that large volume. GG looks like a shake out.

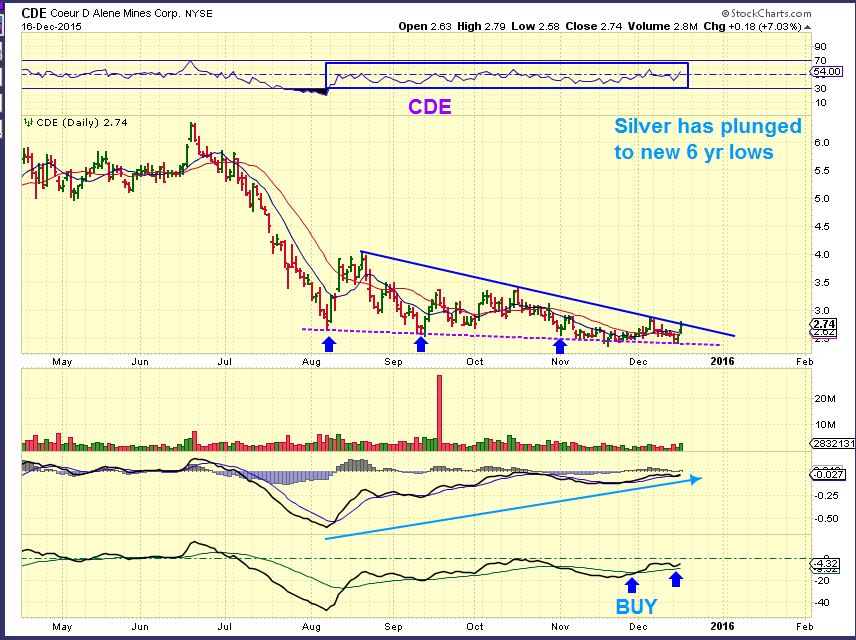
CDE – A break out would be bullish and the indicators are looking good. I would not wait for the break out, I would consider this a buy inside the wedge, with a stop below recent lows. Todays pullback may bring this to the lows.
.
IMPORTANT: Do you see a possible character change in the making? I want to keep mentioning that while GOLD & SILVER broke down these past weeks, some Miners were very bullish. This is a change of character and bodes very well for future investing in this area. HUGE %-Gains can be made in short periods of time. A couple of low risk trades in this area in the future can cover for any small losses that you may have experienced being stopped out . That’s why it is important to keep losses small and let some winners run.
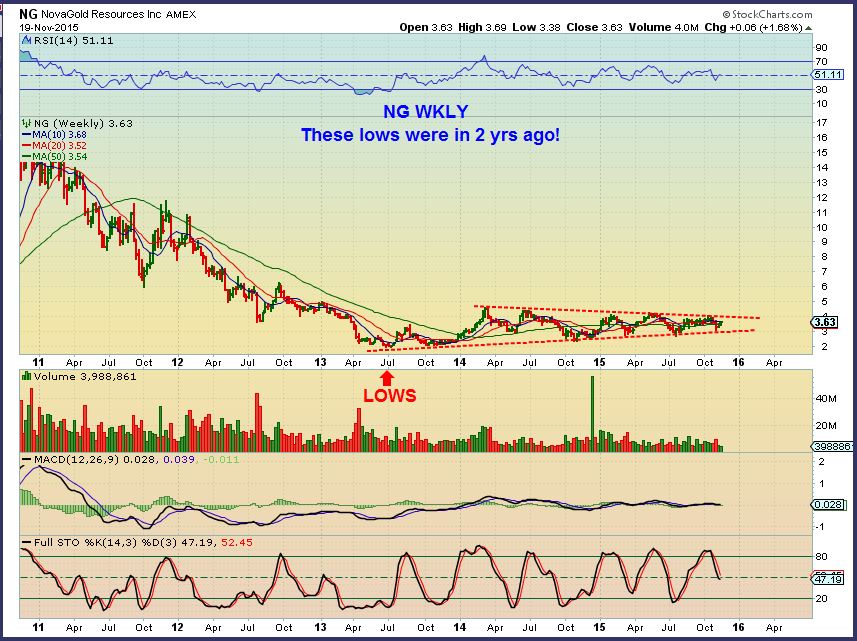
NG has been running very strongly ever since I posted these following charts
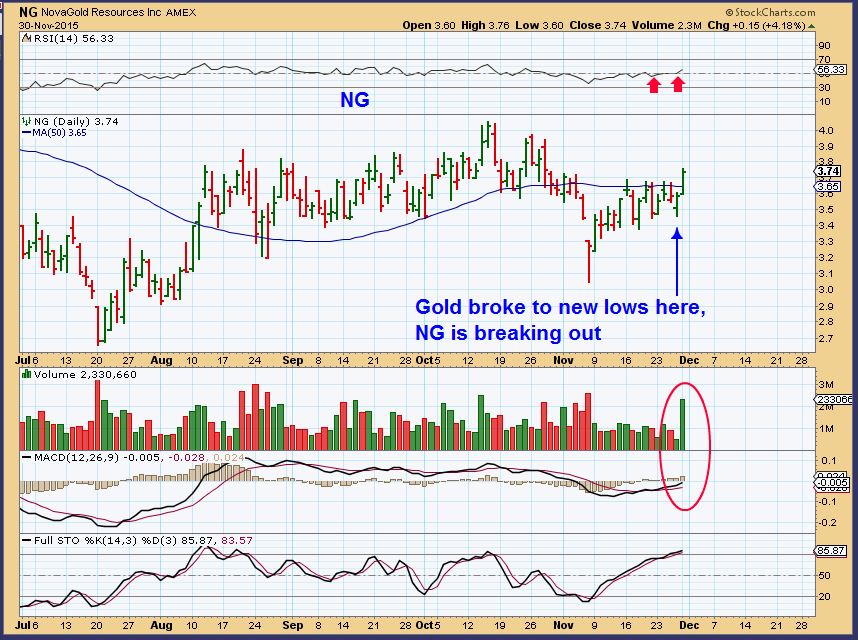
NG – Dec 16
WKLY – from Dec 4
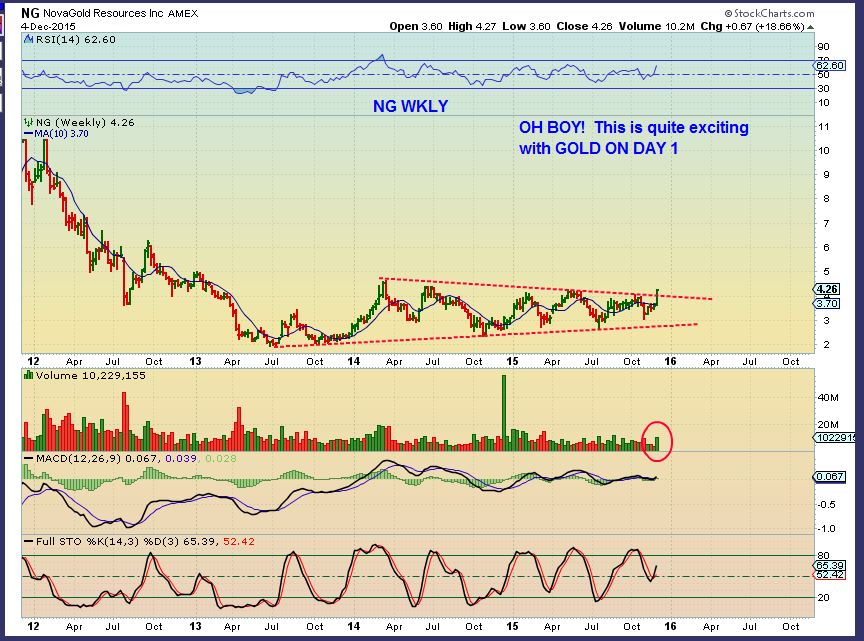
This is a Canadian stock that has broken out since I drew this for a reader that asked me about it. As a silver miner, I did not think that it would break out with Silver crashing last week. I would have bought a dip to the lower magenta trend line.
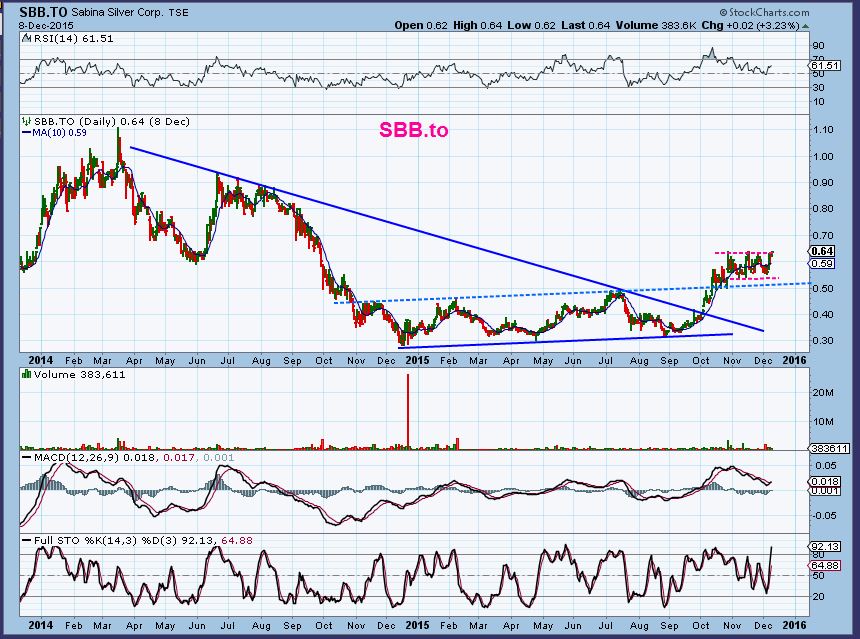
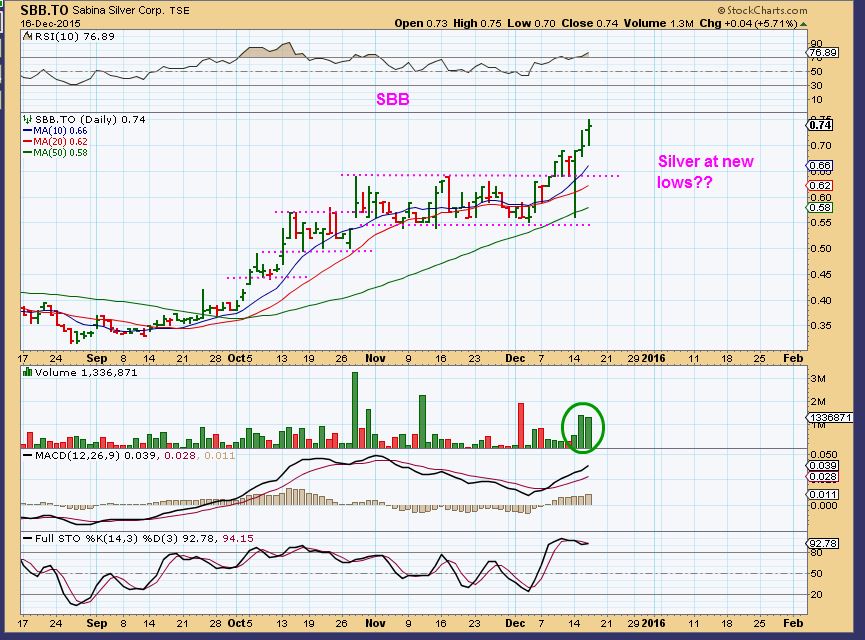
SBB – This silver stock, under $1 , did not care that Silver was at new lows. Step by step, SBB is up 100% from the Summer lows with the metals breaking down.
As I write, GOLD & MINERS are in the red pre-market. I have heard so many people saying that they think that the rate hike is going to be very bullish for the $USD and crush Gold. I am not seeing that and I am going to cover this in depth in the weekend report. For now I would consider buying this dip today, as long as lows are not taken out. This is NOT an “All in NUGT” type of trade. I’m talking about taking a low risk trade or two to have some skin in the game if this move higher transpires.
For example, couldn’t this be another low risk buy today? I wouldn’t get too cute, it may not tag that 50sma again.

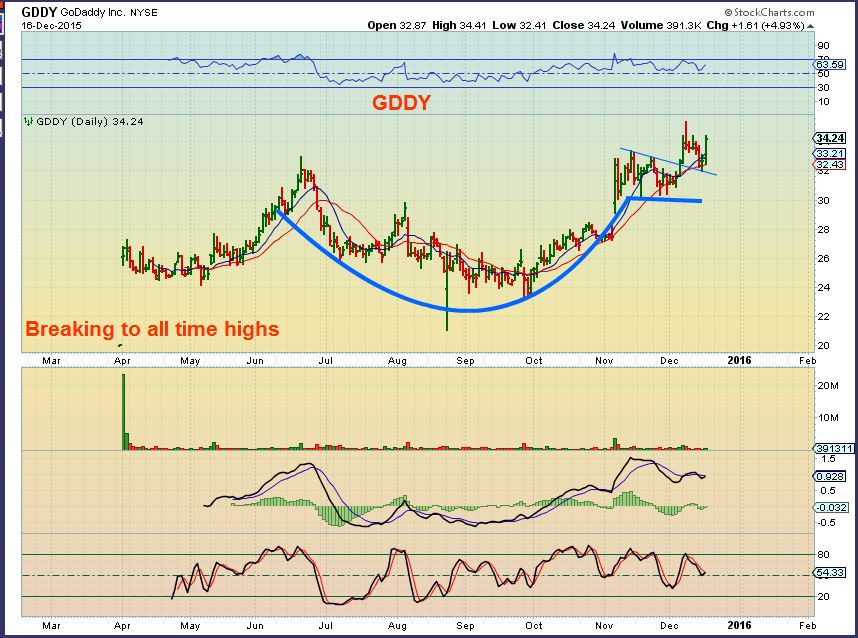
Now that the markets look at least short term bullish, Other areas that may offer trades could be some of the past stock trades that I mentioned. DANG, GOGO, GDDY, etc
EYES – Looks to be Bottoming and just moved from $4.35 to $6.59. This is a tricky sector to trade ( Biotech/medical) and can move quickly in either direction. This trade would be for those able to monitor trades closely, buying a pullback or a break out.

BABA – A reader asked me about BABA too. One could buy a break out above the red line or a pullback to the 50sma.

So we’ll see what today ( Our Post Fed Thursday) brings. As I write Metals and Miners are down, but you know that can change as the day goes on too. I personally liked the set up and the action post fed yesterday. Tomorrow I may just post some chart trade set ups that look bullish. If we get a pullback in the miners , it may be a buying opportunity and some nice set ups may form. Solars sold off fast a while ago and now they are bullish looking, so a sell today in Miners is not the end of a good thing necessarily. see SCTY, FSLR, TSL, JKS, JASO, SOL, YGE, etc
Thanks for being here and have a great day!
~ALEX
This report is running late, so I will have to just post it and go back and fix typos, thanks for ignoring them for now 🙂


Well, everything is right at or near the lows again ( GDX , GLD, SLV).
This is either a buying opp or breaking down and yesterday was a false move post Fed.
Now I want to see if the lows hold.
GDX broke lows from a couple of days ago.
I would not buy this pullback in metals / miners yet – without prove of any strength going forward
“Fed would not be 1st to hike rates since 2008-09. Stocks welcomed those hikes, then fell when rates were cut again.”
Alex, GDXJ looks to be holding up better than GDX.. anything significant in that?
I looked at GG, ABX, NEM.
I just think that NEM is the culprit. GG & ABX didnt even break lows from 2 days ago and GG was the weak one.
EXK and a few other juniors are putting in reversals so far ( SO FAR) 🙂
Alex….. the gap is filled from ABX (TSX) 5 day, 1 minutes charts, is that right?
Yes, but it can still go down further too.
I love it when that happens
Today’s decline in SPX looks impulsive instead of corrective. If today ends up erasing yesterday’s pop, is unusual that a FOMC pop didn’t last longer? Maybe a change in character and supporting your bearish chart, Alex?
If this is the start of Santa rally it’s possible we get coal in our stockings. I’m staying all cash till things calm down with oil. It seems like it is the driving factor to the volital stock market as a whole. Better safe than sorry at this point IMO.
So I show a GDX low of 12.92 in November and 12.62 in September. Are we headed to test those out? All my good looking stocks AG, NG, etc getting slammed. Maybe it’s just a one day move but very surprised with the COT the way it is. Final shakeout?
I agree with your thinking above,
Unfortunately there is no way of knowing how low this will go. The current COT readings would indicate that if Gold sold off ( That $1033 area is still on the table) it would probably be a quick drop and recovery, maybe a V-Bottom, but I wouldnt want to ride a V-Bottom to -$1000 if it was that kind of panic capitulation.
Alex,
Should we be stopped out now in PM miners…..if not, should we sell into any afternoon short covering to close positions out. Any intra day divergences you might be seeing? thx…..
It might be best to be safe.
Yesterdays post Fed rally looked encouraging, but today we see GDX dropping down into it;s DCL, because the swing low from day 18 didnt hold.
Miners can bottom anywhere from here to day 30+ lately. There isnt any way of knowing if the recent lows or Sept lows will hold.
Curtis, Why do you think there will be an afternoon short covering rally?
hi
maybe some less depressing info about GDX
november / december 2013 as well as november / december 2014 had a double low – same again in 2015?
it s taks selling time and so maybe they are smoking people out
just a thought
ray
TAX and not taks of course
Kind of double bottom
We’re thinking the same thing!:)
yep Irwin, could feel you vibes/thoughts all the way to my place
pretty far : )
Five more trading days to take advantage of tax-loss selling.
This could set up to be another fantastic January in PMs.
https://www.tradingview.com/chart/NUGT/DJmzu6Ch-NUGT/
That would be a nice move!! 🙂 And certainly concurs with Irwins earlier chart suggestion.
Thanks for that Bill
Dear Bill.
How do you know we probably go that direction Bill, it’s almost too beautiful.
Many times you were right.
Anyway you understand it much better then this doc.
Thanks for your help and response.
Geurt, I cannot be sure. I am just looking at what it did last time.
My favorite harmonica yet. But just no able to press the “I believe” button. Not yet, anyway.
The pattern is on the 3-hour chart of NUGT. It comes from late August to October. There was an FOMC meeting in there also. Things are changing with the rate hike, I’m not ready to throw in right now. I’ll continue to get out daily, for now.
Anyone considered potential expanding bottoms?
check out gold & silver
I’ve got plenty of experience with expanding bottoms. Just not with PMs. 😛
Hopefully not your own.
maybe time to put Mrs Cason on the 5-2 diet
LoL, i knew either you or Maria would wise-crack that one
Wise crack? I see what u did there…. lol lol
I just saw this…2funny
Wow… what a cray cray day out there ….
Hope everyone survived
its like Beavis & Butthead round here 🙂
Casonnn…lol ha ha
WOW!!!! I expected some give back but that was LOT WORSE than I thought. I mean, it was horrible across every asset class possible, except USD. Quad witching tomorrow then two holiday weeks. We may not get real direction in stocks until 4 Jan. Alex, def agree, if S&P Can’t make a higher high in holiday ttading, all bets are off in Jan.