
The Runners
Yesterday we saw some of the Energy and Mining stocks running swiftly. There are some small bases that have formed in the past few weeks, and now they may be starting a small leg up. Some had Gains of 20 % in one day, which could just be a mix of short covering and a little buying, but they may still continue higher. We’ll take a look at some individual stock set ups like the one below.
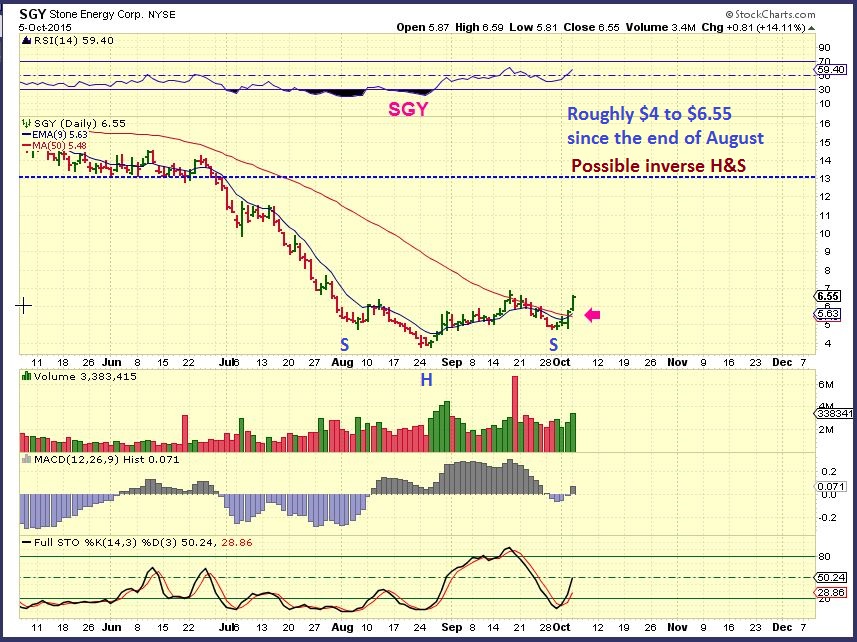
SGY – A break above the 50sma, we see a possible Inverse H&S forming.
First Lets review the markets …
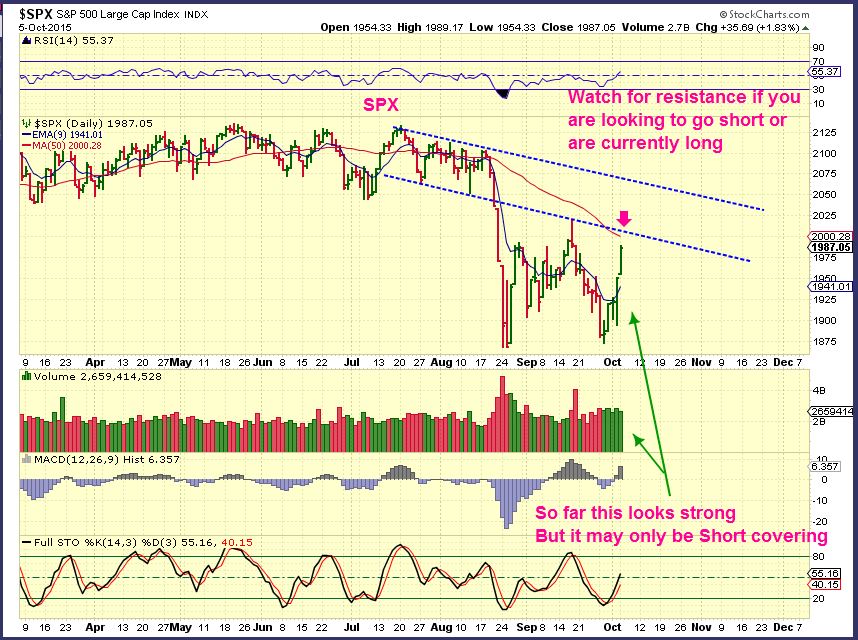
SPX – This is an area where I’d be watching if I were long or wanting to short the markets. This move was actually stronger than just a pop. The 50sma is close and the 200 sma (Not shown) is just above it, and these may act as resistance. Expect a pause and then it may try to break through upside. If it fails, it could be a short candidate.
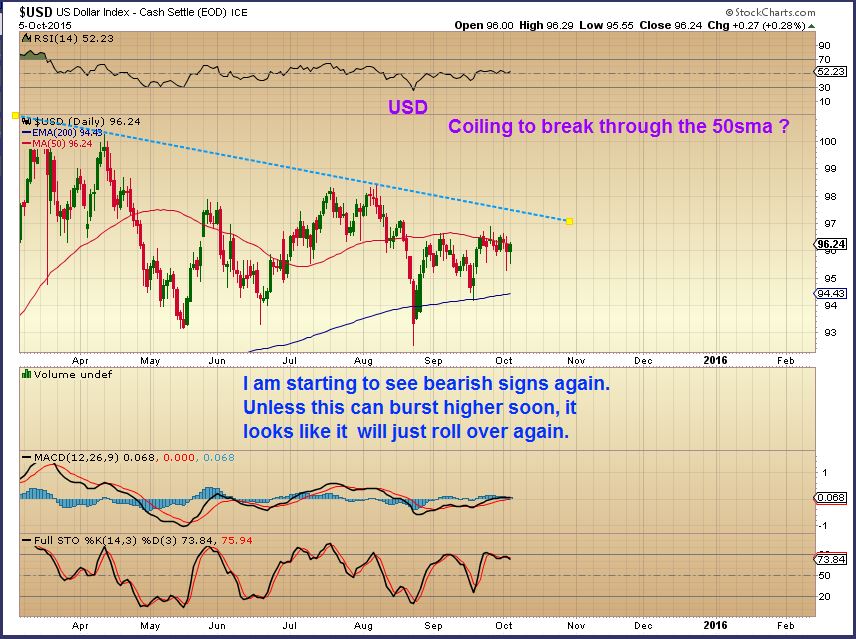
Much of the commodity action seems to be closely related to the Dollar, and I thought that the dollar could pop above the 50sma soon. It may still do that, but it seems like it will tag that trend line and roll over at this point. That would be bullish for Gold and Oil .
USD – Supported by the 200sma, stopped at the 50sma.
I have a lot to cover in individual stocks later, so lets quickly just look at Oil & Precious metals ( NATGAS = no favorable change so far. )
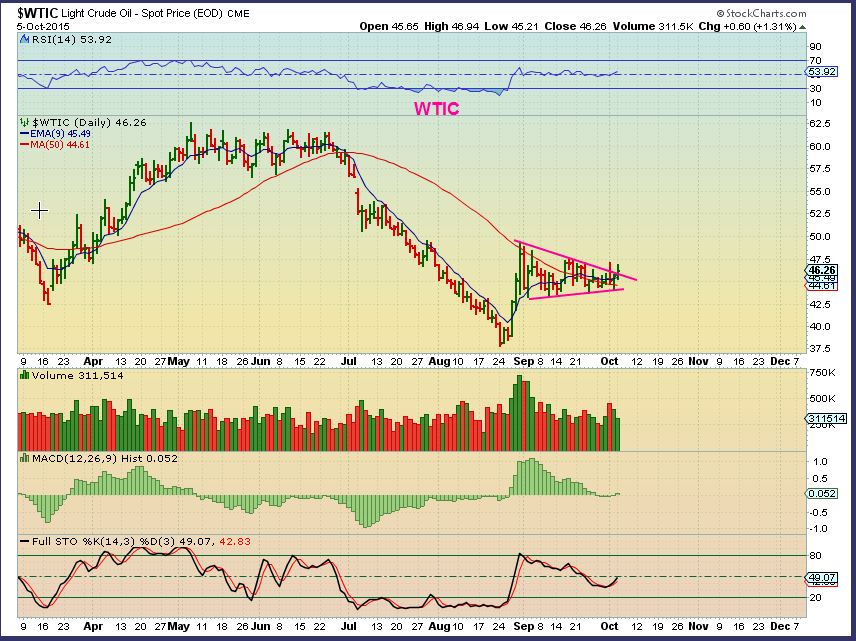
$WTIC– This hasn’t changed much either. A Bullish looking flag that is continuing sideways, but the move in energy stocks may be indicating that a break out higher is in the cards. Oil is riding above the 50sma currently.
Oil didnt break out in an obvious manner, but take a look at what we were looking for in the weekend report.
2 charts from the wkend report: We wanted XLE WKLY above the $64.81 & on the daily a break out was looming.
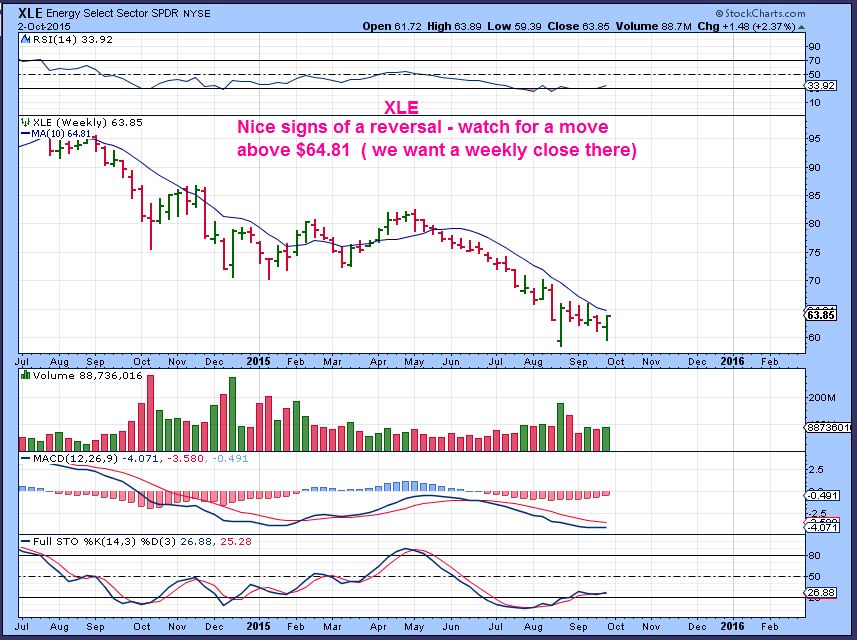
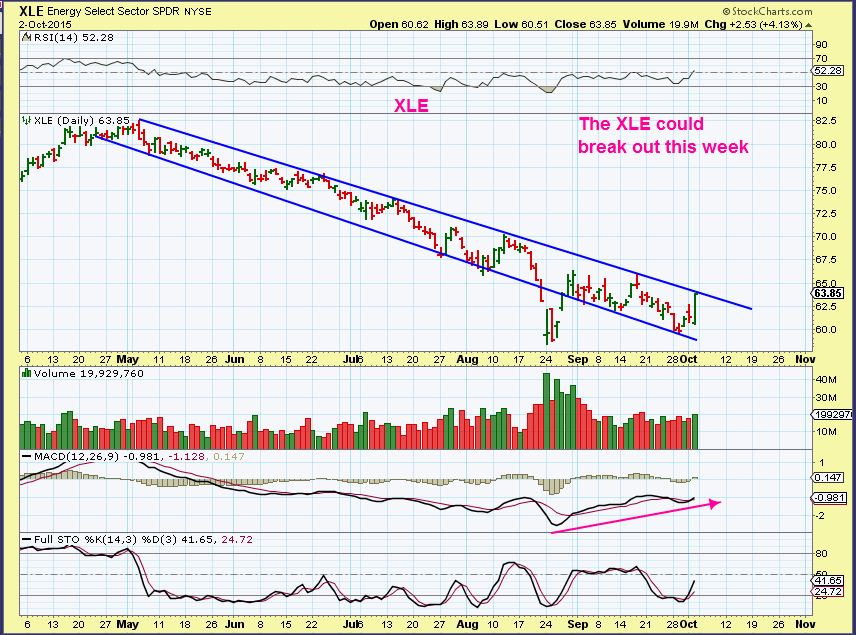
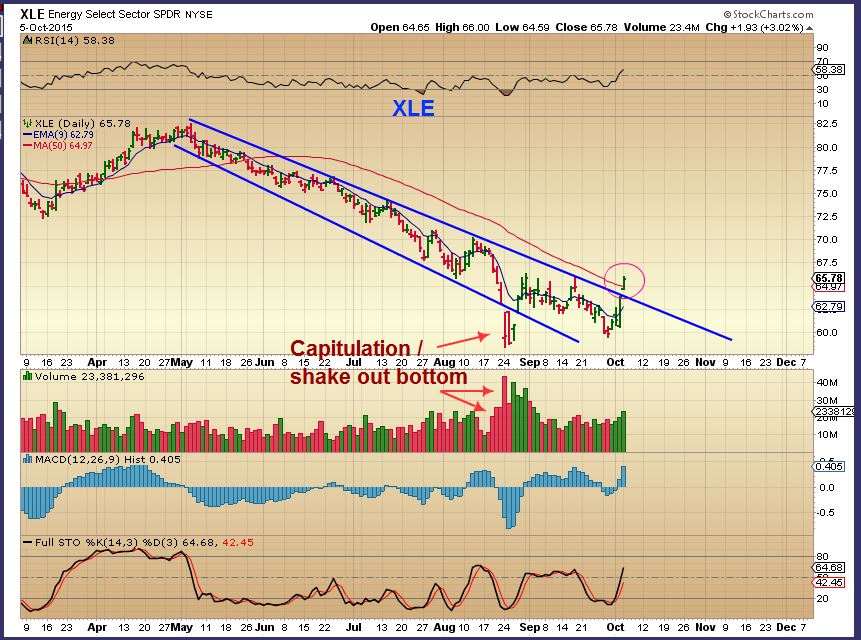
XLE – We got the break out from a LONG downtrend. This had capitulation lows in Aug and may just move higher from here. Again I have been saying that it is possible that we seeing commodities bottoming and markets topping. Things seem to be pointing that way with what we see here. As time goes on, the picture will continue to get clearer.
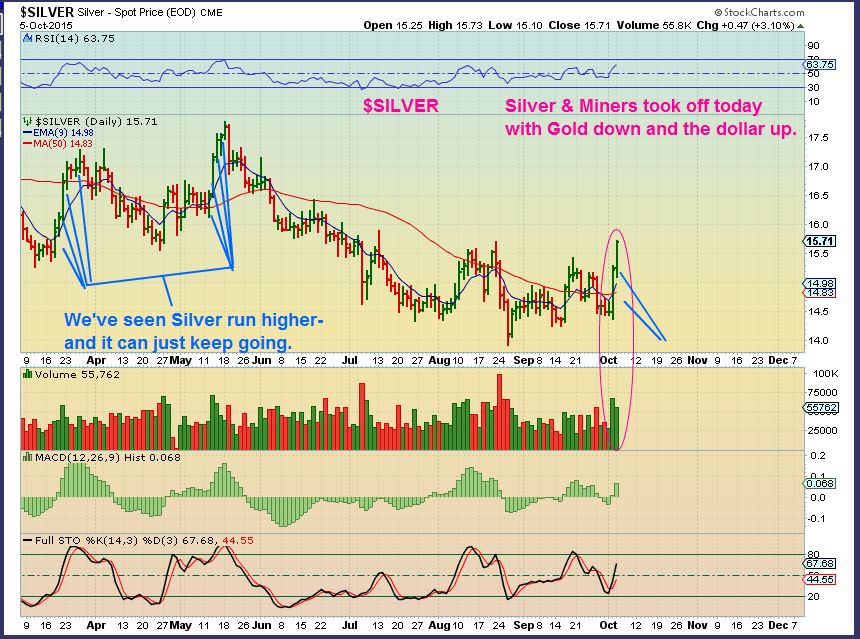
Gold did not go higher yesterday, but Silver and Miners did. That is what I like to see, Silver & Miners leading the way.
Silver – As mentioned before, Silver can run swiftly once it gets going in the 2nd daily cycle.
NOTE: Similar to what I showed you in the weekend report regarding 2012’s confusing bottoming action in Gold Silver & the miners, Gold bottomed in July this summer, but Silver bottomed in late August. That confuses expectations a bit when it comes to timing, so I am just allowing things to play out, expecting Silver to do its usual run up, stall, and then roll over into a daily cycle low. Trailing stops may work best in that case.
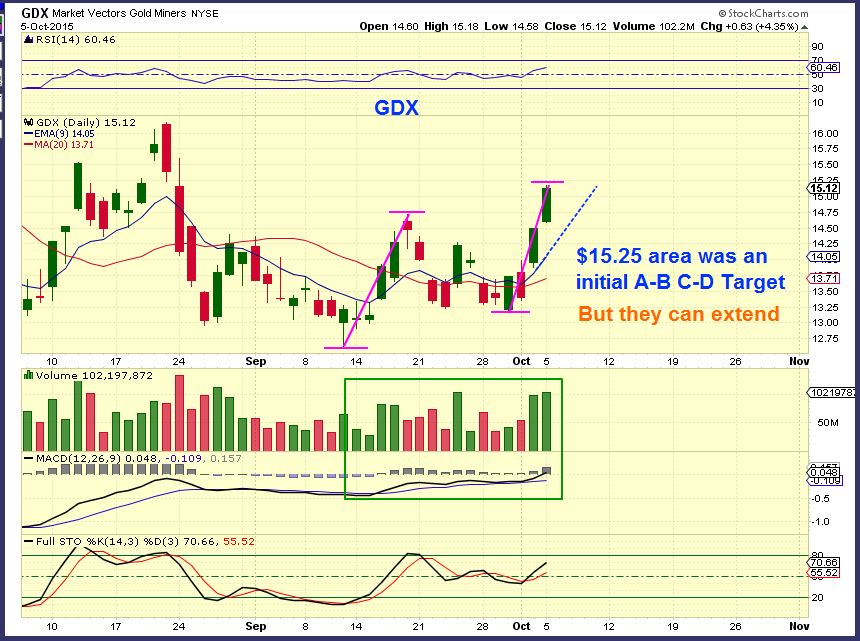
GDX– We have a break out . Please note that in Dec/ January when GDX broke out , it paused and went sideways to the 9EMA. This is a buying opportunity if it occurs ( NOT a sign of weakness).
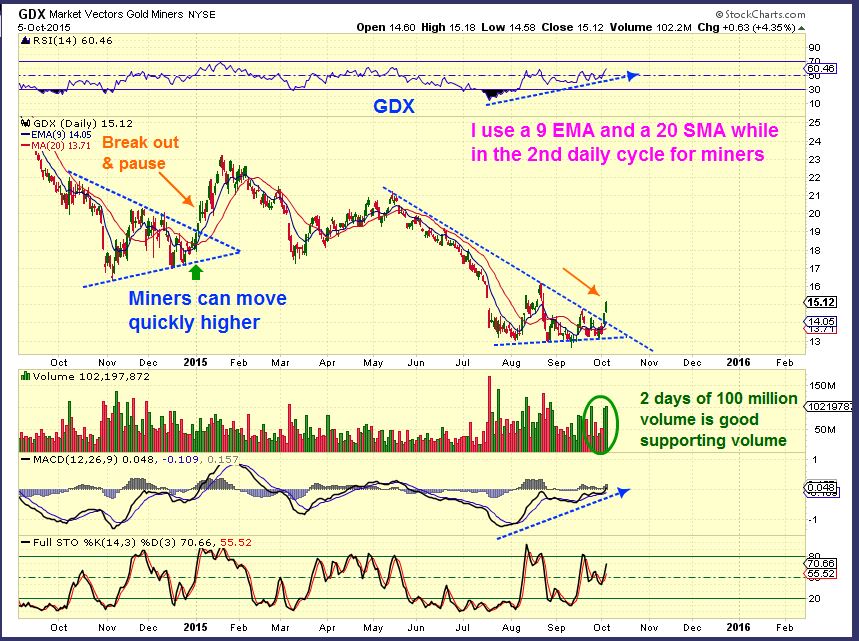
GDX could pause because its first target was reached yesterday in an A-B-C move, BUT individual Miners do not all pause when this happens. You may see some just run higher like SA did in August when GDX pulled back.
GDX can also just keep going and extend to a 1 :1.382 or other Fib extension, so I dont sell on this A-B-C-D assumption.
I wanted to draw up some charts of a few Energy and Miners charts to show what I’m looking at and what I look for in this area. That takes a lot of time and I would be releasing this report after the market open if I gather those now, draw them up, and then post, so allow me to collect and draw up a few more and please check back later. I wont post a new report, so you wont get an email alert, just refresh this report ( Check back after 9 a.m. Eastern) and they will be added here.
Again an example is SGY– This is a base that has formed a possible inverse H&S and is breaking out above the 50sma.
~ALEX
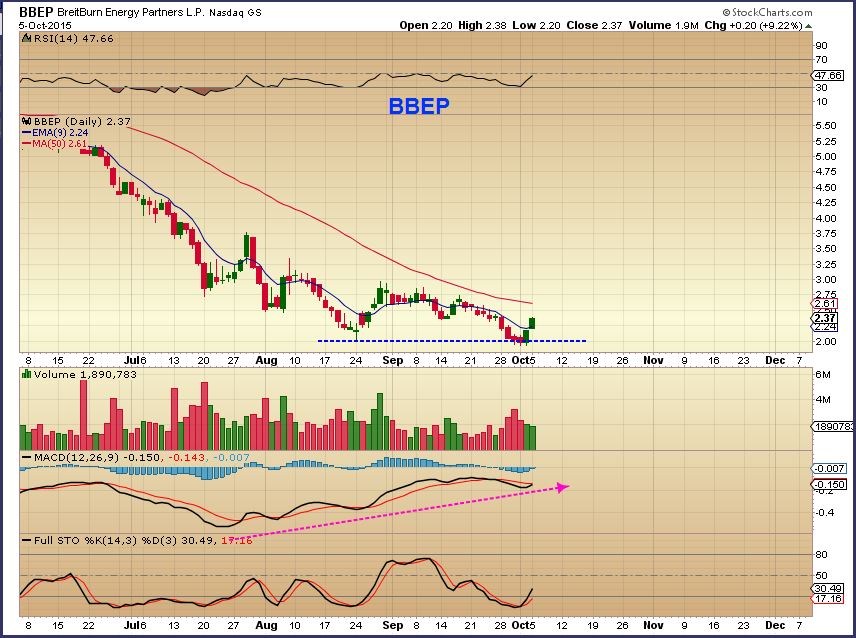
ENERGY STOCKS – You’ll notice that most of these are still near their bottom, and they have formed a few false starts, which gives us a base. Bases are important for a nice run higher, because it allows weak hands to get frustrated with false starts, and encourages bears to go short thinking it is weak (think of the miners from the last 2 weeks).
BBEP – Many of these have formed double bottoms. They are everywhere. BBEP is quickly up 20% in 2 days, but is still at the lows. A stop below $2 should be safe.
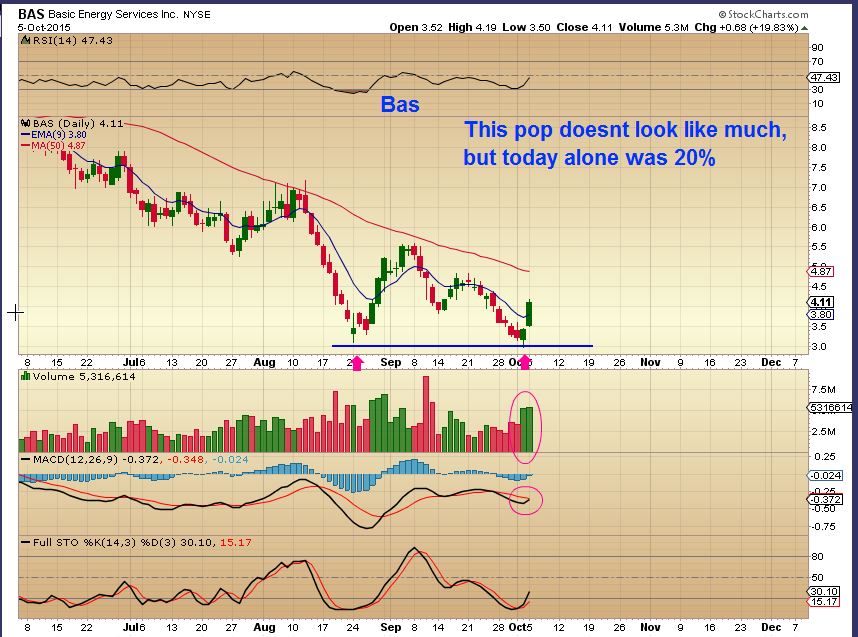
BAS – Another double bottom. This may run to the 50sma, pause , and then break through. Look at the run in August – it ran higher for over a week.
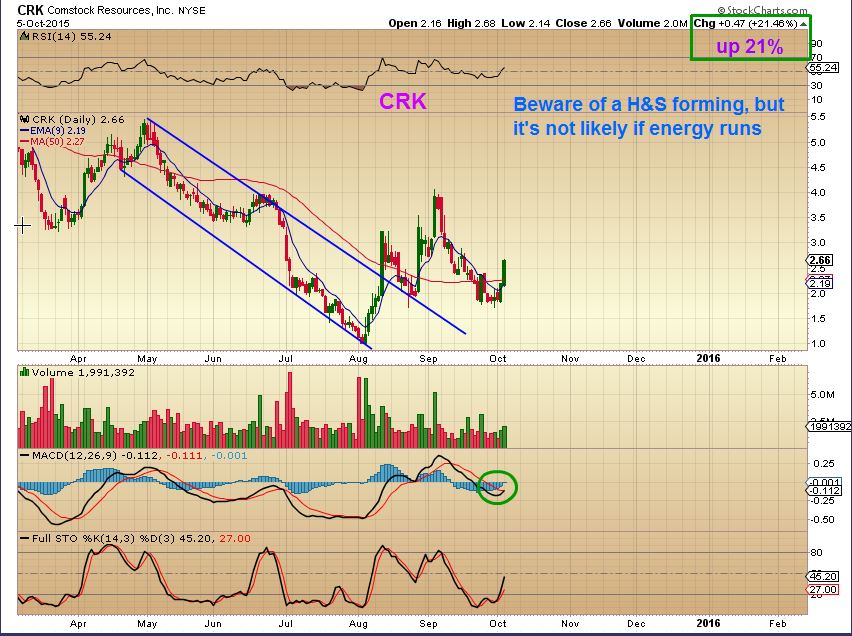
CRK – Comstock ran from $1 to $4! Boom! It is back above the 50sma and a stop could be placed under that . The entry was yesterday, but since this could easily double, I dont consider it too late. This is not a double bottom, because it did not sell off back to it’s lows. This may look to some to be forming a H&S. I dont think it is, but remain cautious.
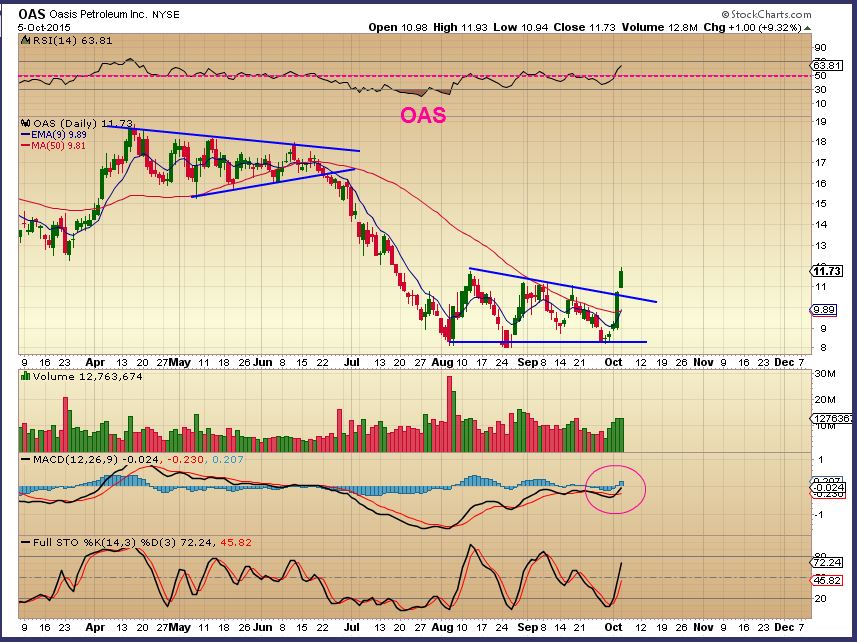
OAS – Imagine the frustration of a base running from $8 to $12 and giving it all up again? Imagine the potential once it breaks free. Look at how it ran from March 24- it was almost up daily for 3 weeks. THAT makes this tough to enter. It just ran from $8 to $12 and finally broke above the 50sma, but it could pull back before running higher or it may just keep moving higher. I would wait for a pullback and if it doesnt come, we missed it.
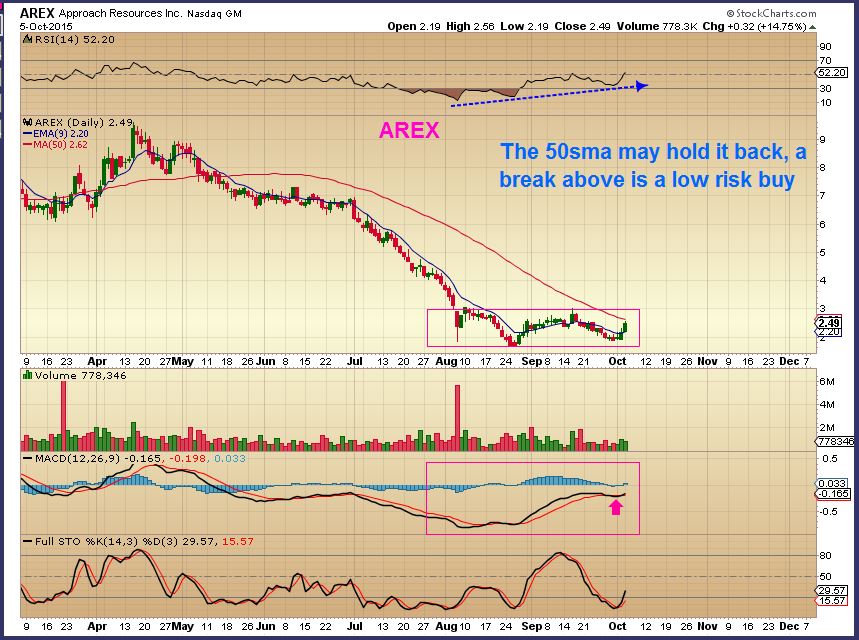
AREX – this is a solid looking base, but it has reached resistance. I think that it can break right through and that is a buy ( or start a position here with a stop below the lows, add on a break of the 50sma).
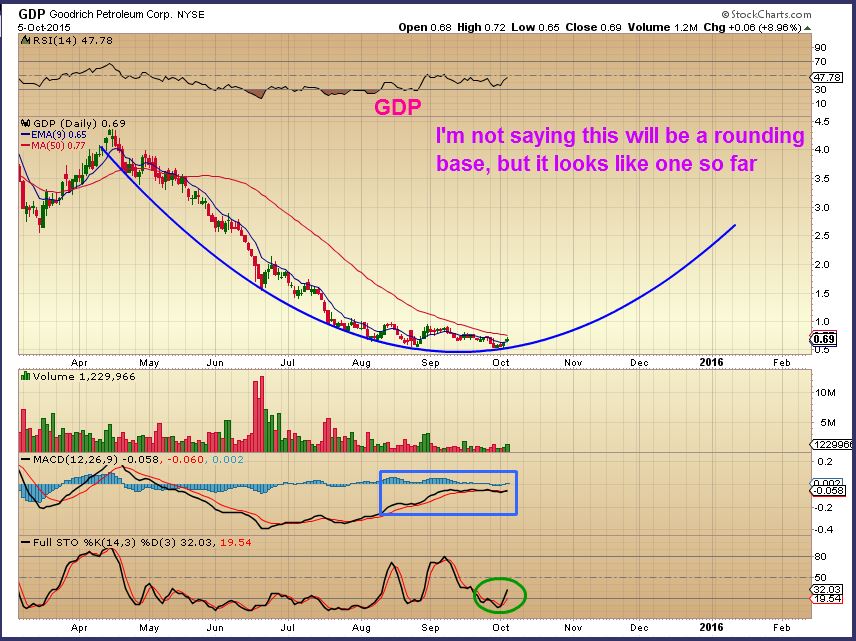
So you get the idea, there are many Energy stocks to look at and choose from based on various set ups. Look at a stock like GDP. I bought this on the last run. I sold some for profit and got stopped out on the rest for a loss, so it was not a good trade, but I cant let that tarnish or bias me if commodities are bottoming. There could be some real potential if things get long term bullish .
This is what proper perspective can do for you.
GDP – looks like a mess.
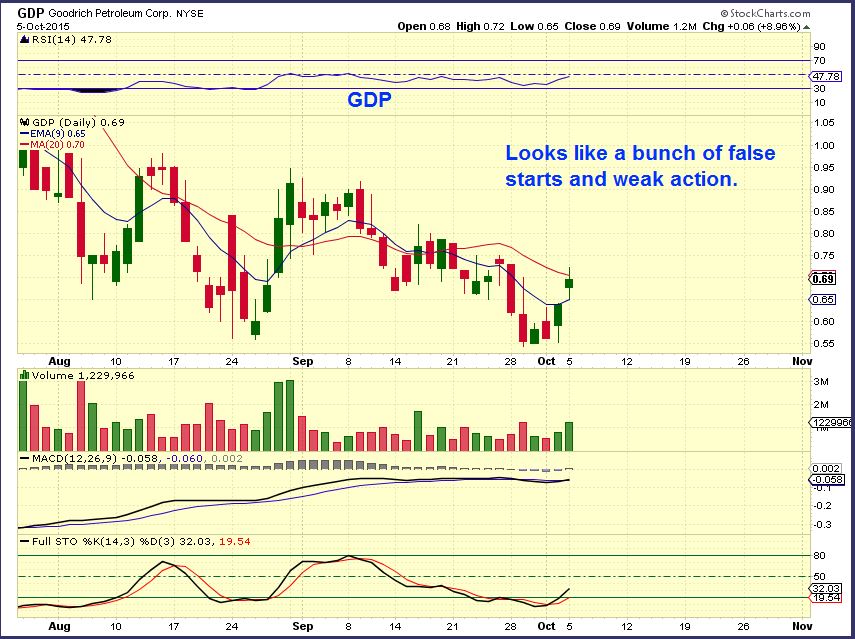
GDP — Now step back and see the potential if commodities are bottoming and this company survives the recent downturn. This was a $30 stock just last summer. So traders and investors will make great returns if we are looking at a major change in the markets.
See also
WPX, CHK, XCO, LGCY, RES, CPG, KEG, HK, EXXI, REXX,AXAS, PACD, WG, and other familiar names that we looked at last spring.
MINERS
When it comes to Miners , we see the same base action. A few false starts out of lows cause many to get stopped out and others to go short. Unfortunately, many of us ( me included) got stopped out. We need to be resolved to get back in when the charts remain bullish. The problem is that some have been reluctant to re-enter Miners based on fears that it is another false start. The weekend report was designed to show that this is real ( GDX:GLD – Other indicators that never went to a sell and I’ve used for 3 yrs , etc).
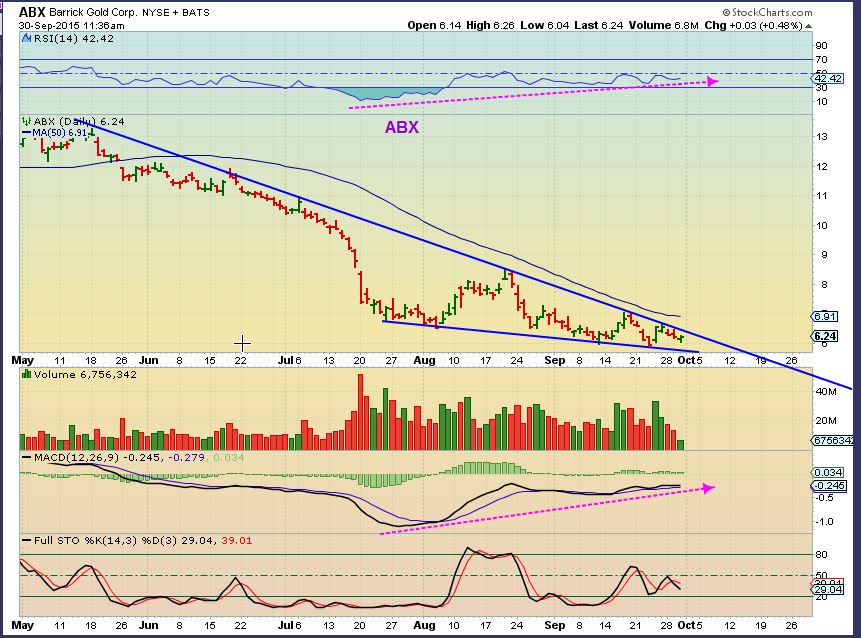
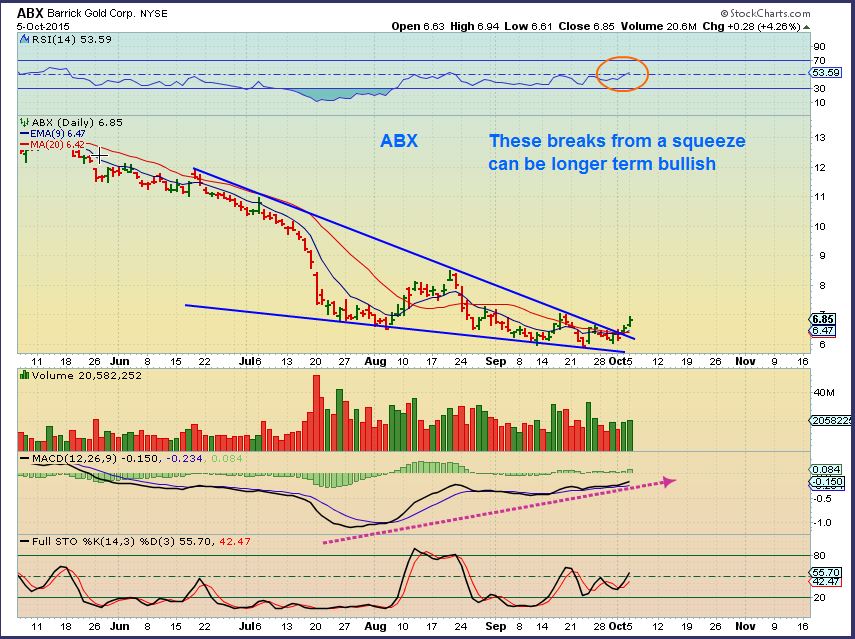
GDX – The largest components of GDX are ABX, NEM, and GG . I have been saying that they are bullish.
ABX – Before and currently
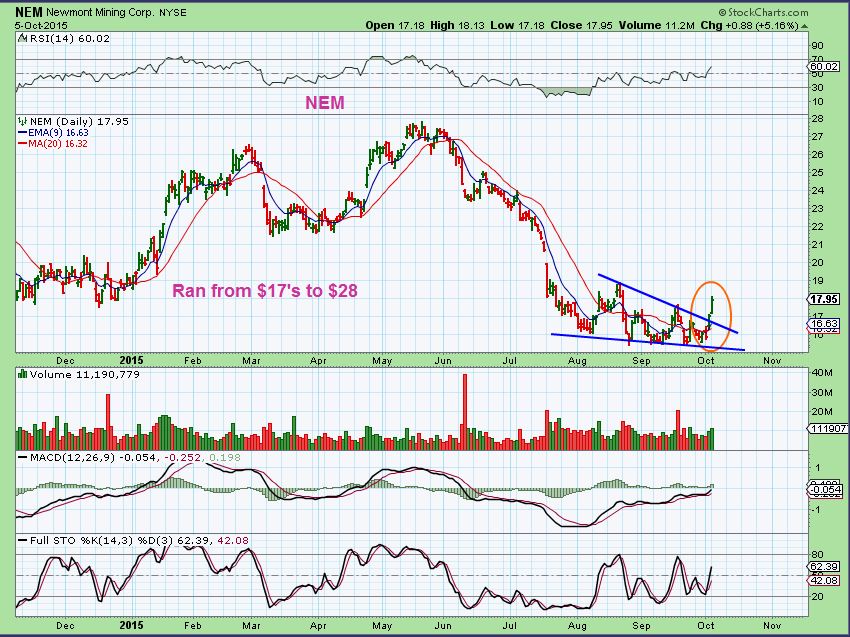
NEM– Before ( bullish wedge) and currently
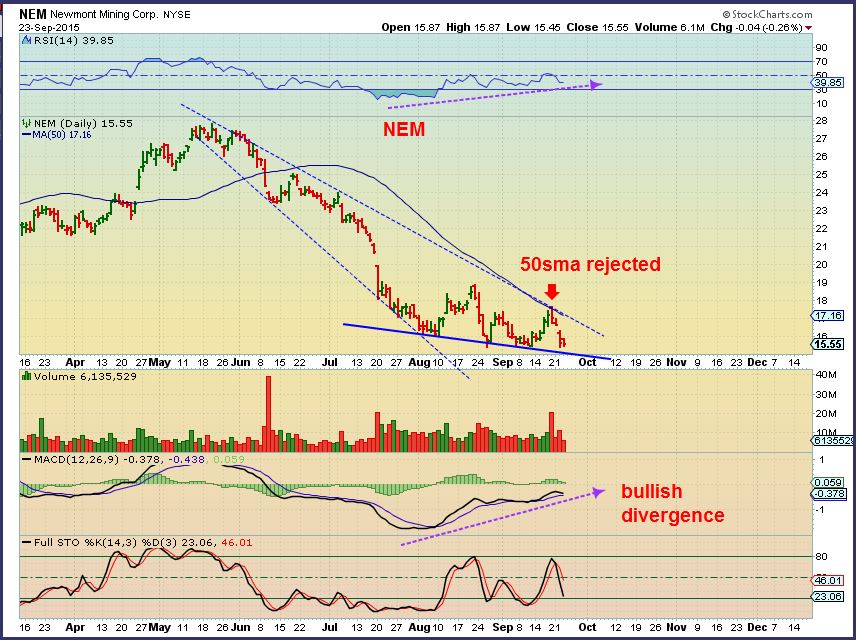
NEM – Suddenly a strong break higher.
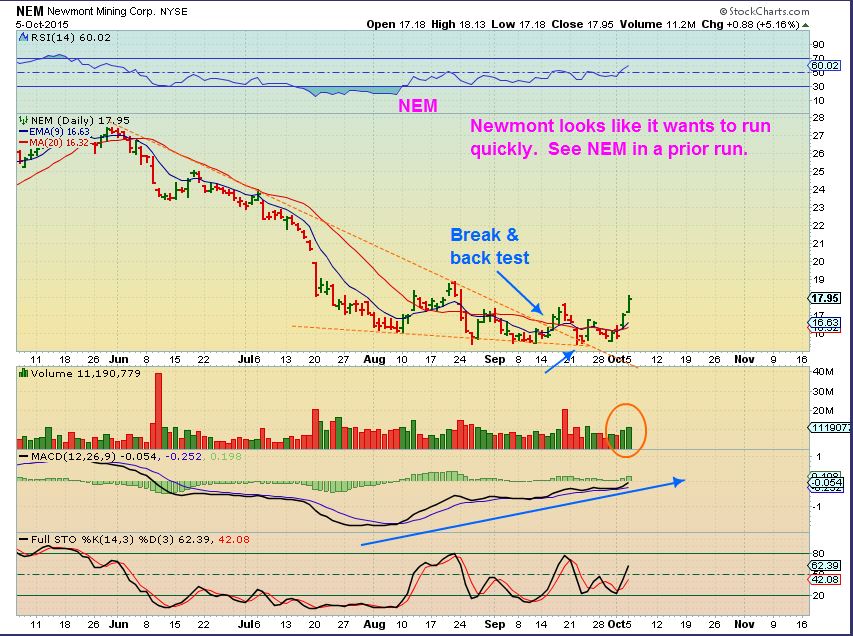
NEM – Ran like a cheetah last spring.
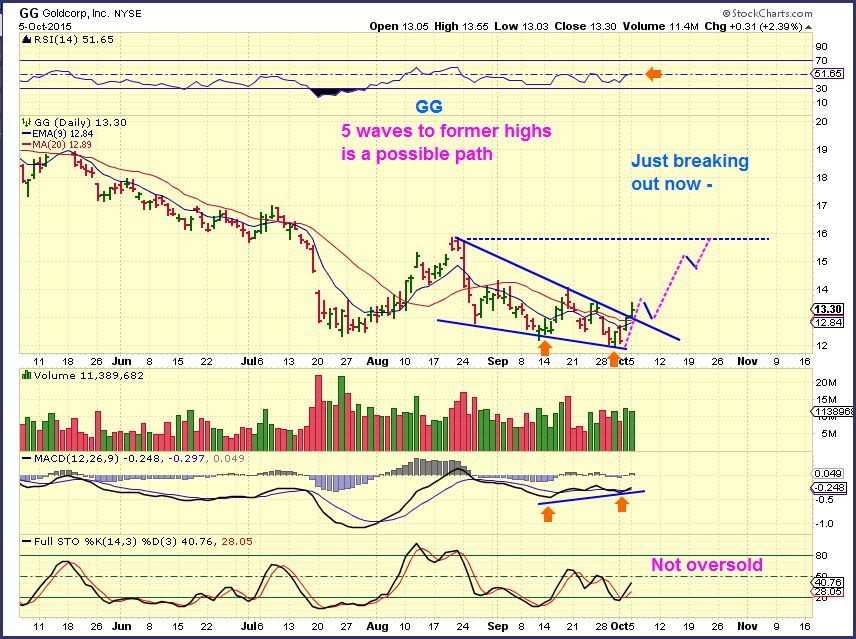
GG – This is just getting going. I am NOT predicting this, it is to show that a break from a wedge often leads back to former highs.
SO in my opinion, GDX looks set up to move higher based on those stocks. Yes, there will be pauses and pullbacks.
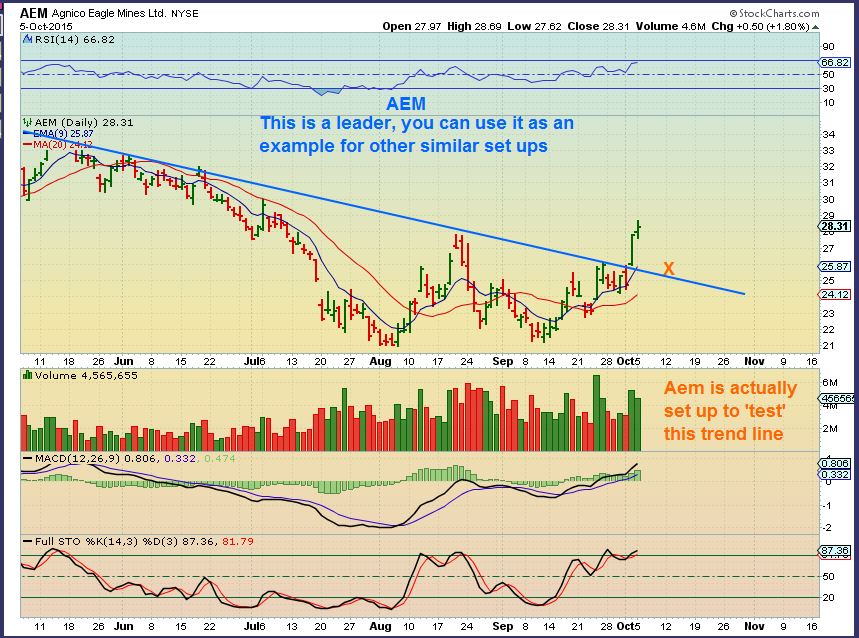
AEM – This is a leader , I often watch leaders for clues of future miner movement. It may or may not be helpful.
Lets look at some Juniors.
IAG– A wedge break out. Possibly back to former highs.
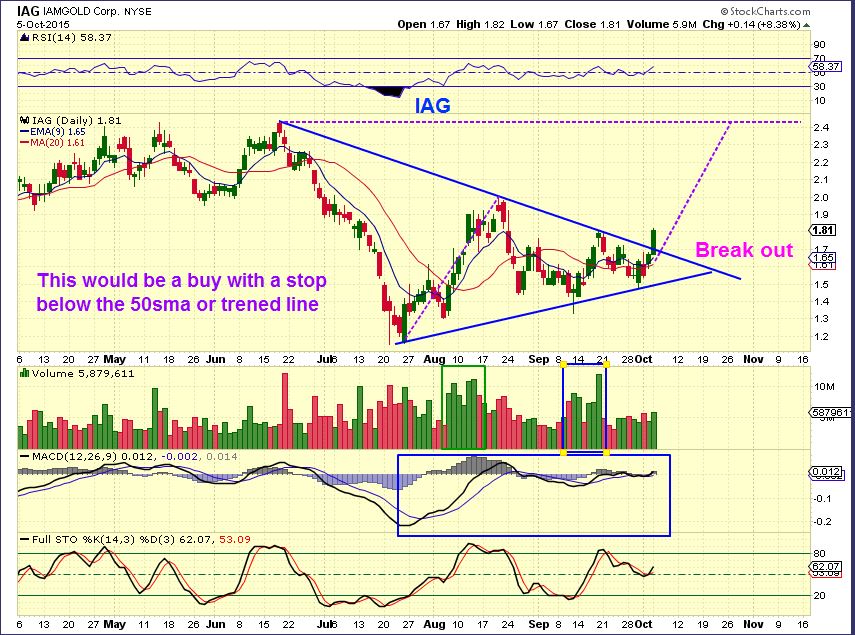
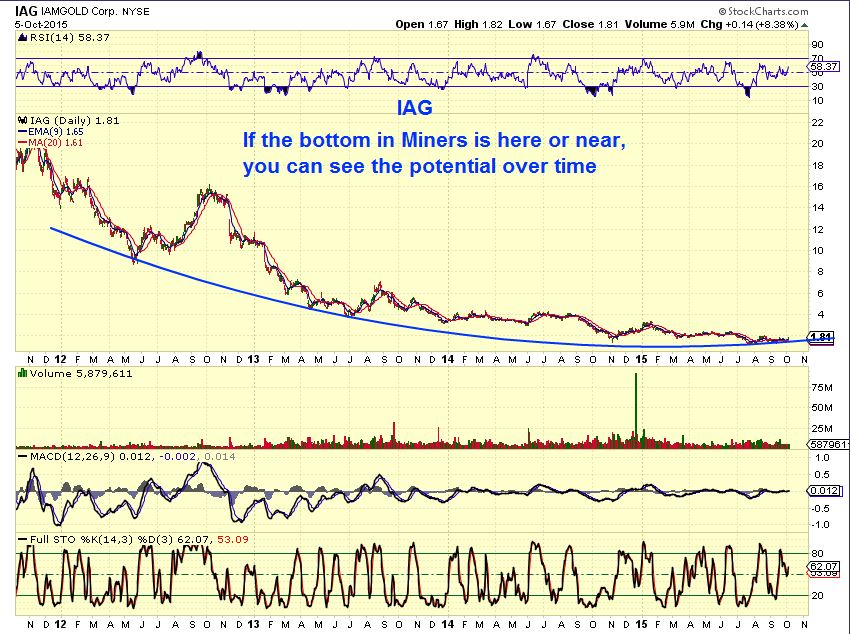
Again, showing potential if the Bear market is actually turning to a 3rd phase of the Bull market. We will be amazed that we didnt want IAG at $1+. I actually bought IAG & EGO in 2008 in the $3+ area and just rode them. They went toward $20 over time.
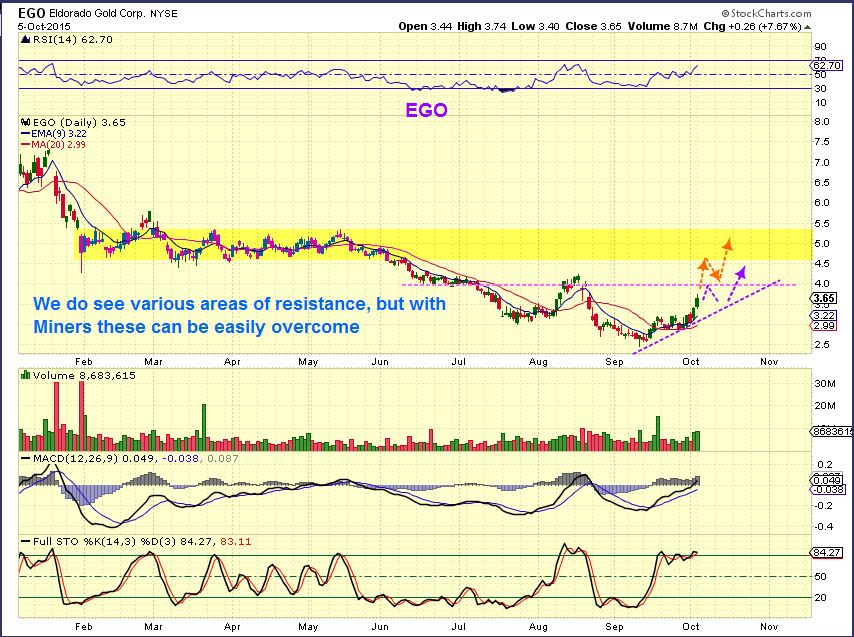
EGO– Break out from a consolidation, but I wanted to show resistance. It may cause an inverse H&S or just follow the orange path. I like this stock longer term (When the bull resumes).
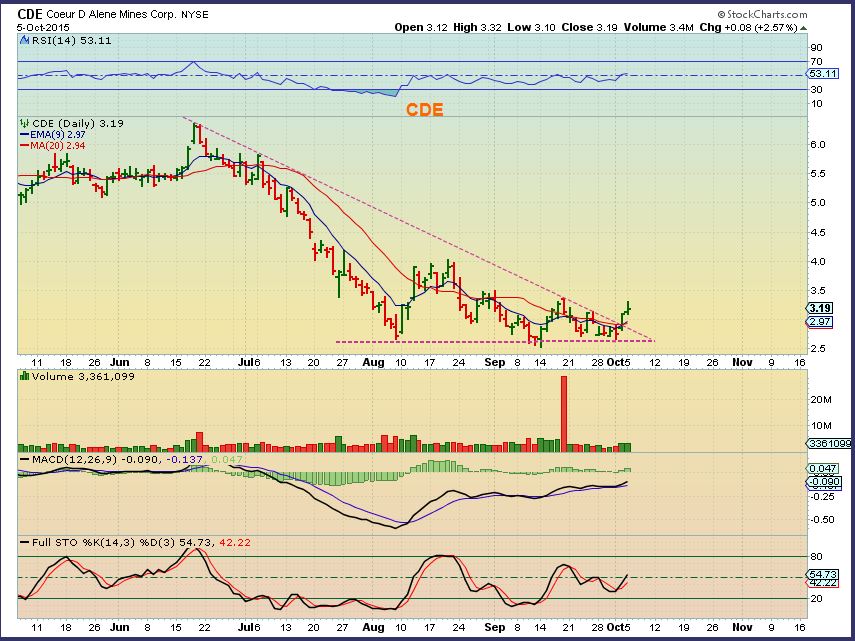
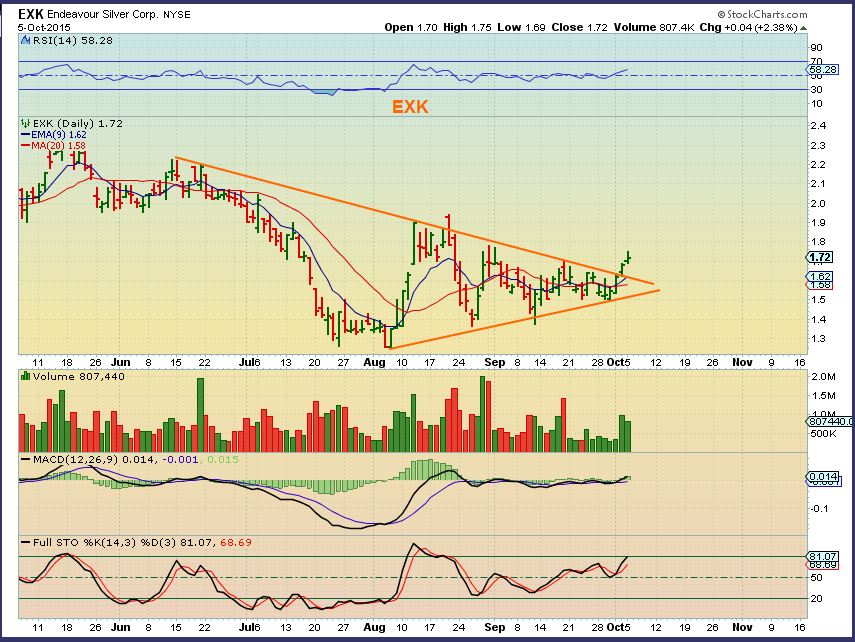
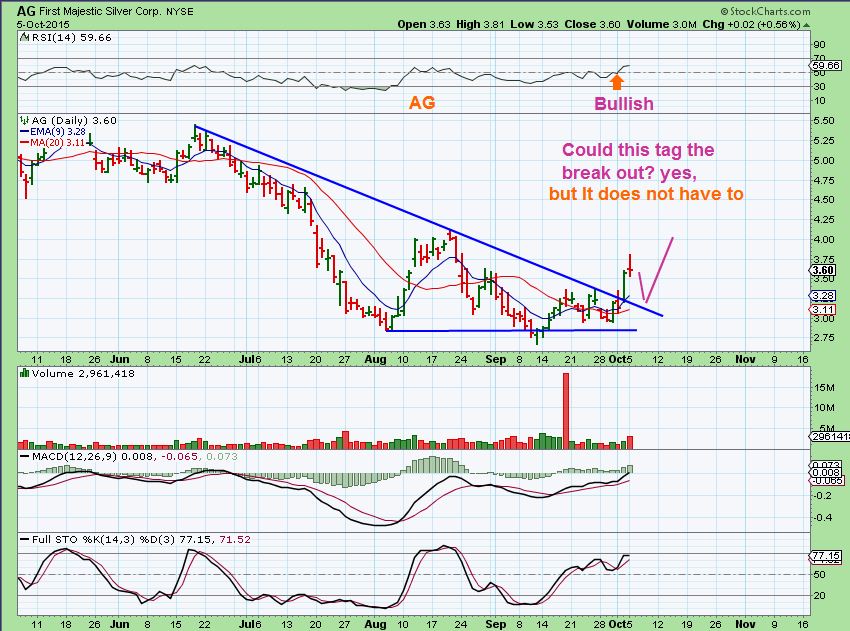
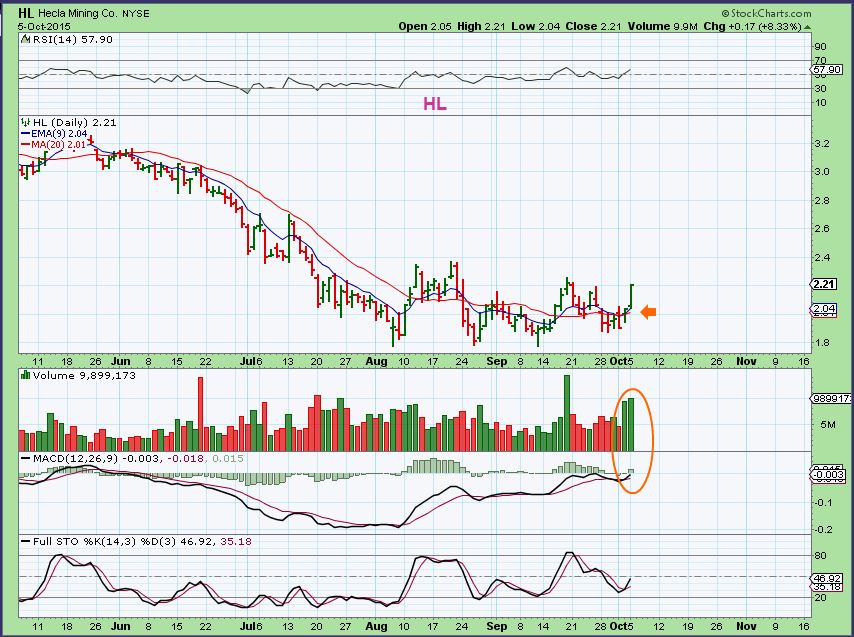
I love the set up on many Silver Stocks- they are breaking out from bullish Descending Wedges
CDE
EXK –
AG –
HL– I mentioned in the comments section yesterday that I liked HL & PAAS as laggers with potential. I bought them in the morning and they look ready to break from their bases too.
SO these are examples of a few Miners set up as Bullish. They are almost all set up this way. RBY took a fall yesterday with the release of some bad news, so I recommend baskets of stocks. They are trades for now, but as mentioned in prior reports, we will be watching to see if these lows become meaningful long term lows. If we are beginning to see the start of the next phase of the bull Market in Precious metals and Miners lead the way, we will have PLENTY of opportunity to enter trades on pullbacks and the upside potential is huge. One step at a time for now.
~ALEX


H&S pattern on DUST? Could retest lows of $11 or deeper. Shouldn’t use patterns on leverrage, but they have been reliable so far for me. ////////refresh
@alex. Any chance of adding a numbering for the comment system with replies going under it. Would make it a lot easier to read. thanks
At the top of the comments section on the right you have a choice of “Sort by”. Sort by “NEWEST” is available and it helps a bit, but when others reply in the middle of a thread it dos cause confusion as the day goes on. If you stay logged in, a small alert also shows up on the right side of the comments telling you when a new reply is available.
I will look into it, but I am not the support guy. You should send that request or any future ideas IT-Wise to support for future reference. See the SUPPORT TAB at the top of the page.
I am the content provider, Support is my partner. Thanks – I’ll forward your rquest
ALL CHARTS ARE IN THE REPORT AT THIS POINT. THANKS FOR YOUR PATIENCE 🙂
Alex- Thoughts about TWTR ? is the bird ready for a long term hold yet?
Thanks & as always perfect reports.
I do like that bottom that formed, and it did cross above the 50sma. It might depend on how the markets react going forward, but TWTR has been fairly stable through all of the recent turmoil after the big drop. It looks to be bottoming (temporary or permanent remains to be seen). USE STOPS.
IF you wanted to enter here, it is just above the 50sma and keep a stop below that area, I would call that ” a low risk entry on a semi risky stock”. The set up is not bad, it actually looks like an inverse H&S too. Please use stops.
Have a look at the volume on UNG yesterday…
I saw that, but it wasnt high in NATGAS, so I didnt know what to make of it.
o man.. oil… ;o)
you recommending USO then?
well.. i bought uwti this am…
too scary for me M…
i’ll stick with 1x
thx for the heads-up!
That will be a nice trade/scalp.
Alex.. likely target for oil with an AB=CD?
btw, that would give about $18.40 for USO
Roughly $54 – there are a few different ways to measure the move in Oil , but its in that area.
thx.. i think USO is roughly 1/3 crude price, so its near there
fwiw… im treating it as a Flat for now… (if the ABC morphs into a 123 – 45 that is fine by me ;o)
I see MANY that count as ABC … fyi – but here is uwti..since i have that charted and available…
https://www.tradingview.com/x/4MiM3F6T/
here’s another example…. https://www.tradingview.com/x/qOaU86uZ/
I like the CRK moves lately – I can see both charts above playing out.
thank u my dear…
I didn’t get to it in time. Grr… Will wait until after inventory report tomorrow AM.
bought it before work… sold near close.. just a scalp. ;o)
Nice work. But I think we could get a decent swing in here!
agree…. its not worth the risk for me — holding 3xers while working = STRESS for me personally.
but.. i will take that quick scalp every time.. shaZammmmm he he
I sure know that feeling! I use a much smaller position for a swing; I might go heavier if I know I am going to watch it and exit same day.
USO is looking like a good trade too SOG, this may be the break out for Oil.
NADL is a laggard in the energy space. Maybe good to buy if someone doesn’t want to chase the names that have already popped?
I was thinking the same about SFY
…and there goes SFY! Was looking at that one too but didn’t act. Bought some NADL though
NICE move there. I looked at it earlier and it was not doing anything.
I Bought TGD as a lagger a few days ago, and the volume is looking dood the past few days . Today it is popping.
Me too. I am thinking this move will last towards the end of the month and get the HUI to close to the 200 DMA. Then we’ll get a retracement. We’ll see how it goes.
In my report AREX looked like it was just getting going. I like the follow through today.
Up 50% in 3 days
Yeah, these moves off of the bottom are great %-Gainers if you can catch them right.
Alex, whats up with the cycle counts? Where are we now? I thought it was too late in the cycle to expect this kind of upside. Yes, I did read your report on cycles.
No, not too late, as stated in my report 🙂
I thought that I even mentioned that at day 15 it could hypothetically run to day 23 and then find a dcl? I’ll have to go back later and read what I wrote.
y the way, nice trade on SFY. Really popped today
I did also, but clearly was Wrong!! But here is the next important item – how do we deal with the overbought conditions in GDX/J and many miners AND silver as we are getting late into the cycle? Some pullback and push higher again? Or does it run a bit more but instead of an entry, we get a top? Then the most important thing, imho, is how this sector handles the 3rd cycle. Does it roll over and play dead like normal or…or…
I completely missed the whole move. I missed the entry we had near lunch when I thought it might retrace just a bit more then blasted right off again! I was hoping for an entry before now; def can’t buy at this level, will look for ‘laggards’ but as stated, afraid a ‘top’ could be around the corner. 16 was my original target from before.
CAson, this was hard to get in. I had a position and got stopped out yesterday only to see it go higher. Trying to get back in.
man that 200 day is tryn to put a beat down on silver…. wow…
WG omg frenchie… looks like u will be buying the airfare for our international party…. LOL (kidding of course)
congrats… A W E S O M E trade..
Sold yesterday 🙁
still good trade $$$$
same with NGD… sold too early.
ohhh… nice.
ngd.. im still riding that badboy.. yeehaww..
This the pullback in GDX? Gap close or possible 38.2% down to 14.82?
On a 5 minute chart it was a blow out exhaustion to the penny.
Amazing, It should bounce out of $15.35 and then we’ll see how it goes.
Could form a bear flag and continue down, and GDX is outside of the B.B. , so a pullback may occur.
Daily chart I’d be watching the 9 EMA if anyone lightens up & might re-enter.
Looked like a bear flag on a 5 minute chart
How did you come up with 15.35?
Its an A-B-C-D down from the top (5 minute chart)
When the C – D length is x 2 , it turns into a temporary blow off.
You looking at it like this? refresh, target $15.05
That is how I would be watching it for the next target / measured move.
I also flip to a daily though, and the gap fill turns today into a reversal, so we may drop to the 10sma (9 ema) on a daily .
Some might look at your chart and see a 1-2-3-4-5 wave down & ur target completes it. Then move higher, or do an a-b-c corrective bounce and one more leg down to the 10 sma on a daily. Or a sideways move.
That is what is so tricky about charting too, is the various time frames. I am flipping back to daily and looking for a drop to the 9ema now – or sideways move there.
I don’t see it anywhere close to the 9EMA on the daily? Thats a ways to go.
The 9 EMA will not be there tomorrow and wasnt there yesterday. Look where the 9 ema was Friday , then Monday, then Today
It will probably hit $14.75 tomorrow (refresh)
Looking at GDX, it bounced back . It does not want to die 🙂
Are you saying you expect GDX to pullback to the 9EMA tomorrow, or you expect the level of the EMA to be 14.75 tomorrow?
Neither really. To clarify:
In todays report I said that when I watch GDX in a 2nd daily cycle…I watch the 9 ema to catch the dips. I posted a yellow chart of GDX and showed that. SO IF WE DIP, thats what I will watch , no matter where it is.
Then You said its that the 9EMA isnt even close to GDX now, so I am showing you that it moves, it isnt stagnant. Where it is today, is not where it will be tomorrow.
So if GDX dips, I will be watching that as a target , wherever it may be at that time.
I hope that helps clarify that. : )
Back to trading for me.
Hmm, I was off a day on each of those 🙂
GPL on that 50sma held up nicely. Good move today.
CF.. what do u think of CDE? I have it coming out of an ending diagonal & it’s SUPPOSED to be a thrust… but.. it looks weak..not feeling a thrust anyway..??? https://www.tradingview.com/x/p9KUk2Kk/
I have it as a break out and back test completed, and it should be moving higher. I dont know why it has a lack of buying today. ( no chart)
You sure you don’t feel the thrust? Its half way there, why do you think its weak?
no comment… i should have used a different word.. lol
looks like its ok… appears to be in wave 4 flagging out nicely now.. could be a 3 or 5 wave correction then up.. or heck can extend forever… but 5 is next… woop. (if my count is right)
https://www.tradingview.com/x/Yss3RTHR/
SGY – the first chart in the report was up 30 % this morning. BBEP another 15% , AREX 15% , etc , and all in the report, moving strongly. The Energy stocks have caught fire (no pun intended?).
HPQ calls options alert. A lots of money in Oct calls.
Picking up JDST.
GDX is printing reversal. (also /GC hit is dreaded 111EMA)
(refresh for chart)
got stopped out already.
careful frenchie… miners look like they are in 4 of 5 …”should” be shallow retrace…
i should add “on the hourly” chart.. sorry for thinking you could read my mind… ha
There goes the powder ‘KEG’
dang…
Even the CLF, ACI, BTU, CENX, AA, Commodities are looking great
oh mannnn … cannot wait to chart 2nite…………………………. u think 2moro will be a ‘rest’ day/sideways…? i want to take off … lol.. maybe Thursday better?
In Miners it may be a rest – GDX is outside the B.B. – could pullback, but this is a strong move right across the board in Energy/Miners/ commodity. Tough to say
u mean.. kinda like this old EW chart i drew up last month… 😉
lol.. its pretty damn close — actually looks just like i nailed the top of wave 3 too…
https://www.tradingview.com/x/EfFuS5Ti/
.. actually does anyone here (lurkers too lol) have any data (or know where I could find it) on which days of the week are ‘better” for trading? M-F ? I ask because I am thinking of reworking my work schedule to 4-10 hr days so that I can have one day at home in peace to trade/chart.
Hi Maria!
I’ve always heard the “Big Boys” make their trades in the last trading hour of the day and primarily on Fridays – and I think that might apply even more to precious metals & miners. Indeed, I’ve noticed volume spikes immediately before and immediately after the close of regular trading hours in GDX.
I hope that helps a little – but beware of advice from a country bumpkin like me!
:o) thanks Cal… I appreciate any info…
Friday always seems like the most boring to me. And it’s definitely a half day. Only rare occasions (this past Fri being one of the exceptions) do you see big price movement in the afternoon. All summer the miners could stay within a couple cent range all afternoon.
Also, take ETF end of day volume with a small grain of salt, some of it is ETF rebalancing versus ‘real’ buys/sells coming in.
Tx cason… appreciate it..
I have heard Monday through Friday. Saturday and Sunday tend to be REALLY REALLY slow.
i wondered why the ticker wasn’t moving
@c@chartfreak1:disqus ohhh… you 2 are just hilarious….
That was a pretty powerful move in SPY, so not looking to short here yet just b/c it got up to the 50-day. May be time to just chop around for a few. I did end selling out my last 1/3 long calls this afternoon (tightened stop, it was triggered but significantly ITM).
And here is why I stopped trading bio-tech!! Full disclosure, have owned both of these in the (recent) past. No position in either nor do I intend to currently. I heard this earlier today and have to agree – the time of all biotechs just levitating is probably past – going to have to be more of a stock pickers market in that sector for a while. Refresh.
Oil as discussed by Dennis Gartman. Talks some of the fundamentals which I think is what we are seeing in the charts. Especially listen to the futures contango piece, that will surely show up in our charting. http://video.cnbc.com/gallery/?video=3000429642