It’s time to discuss decay in the Oil and Metals markets, but first lets do a review of the equity markets.
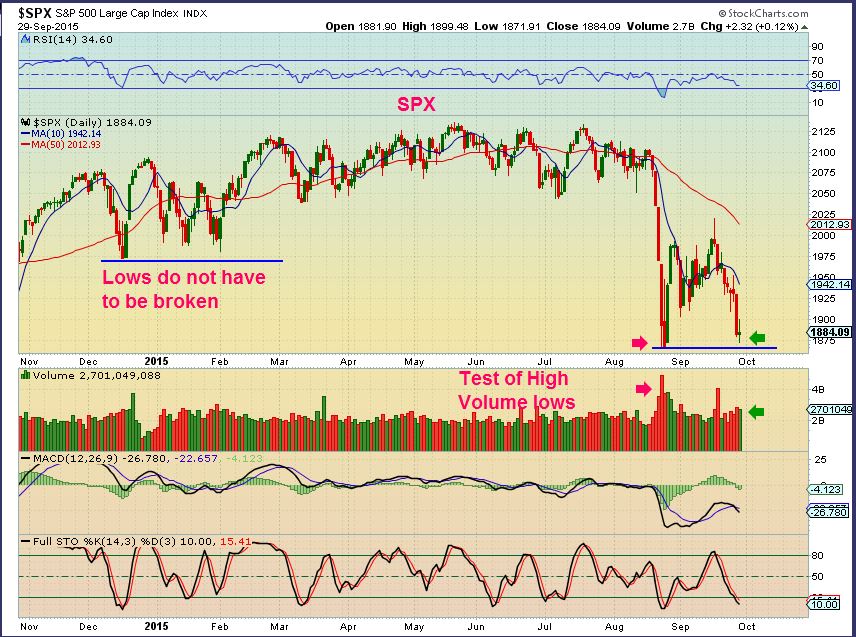
SPX- This was Sept 15. I have been saying since August that I expect the lows to be tested sooner or later.
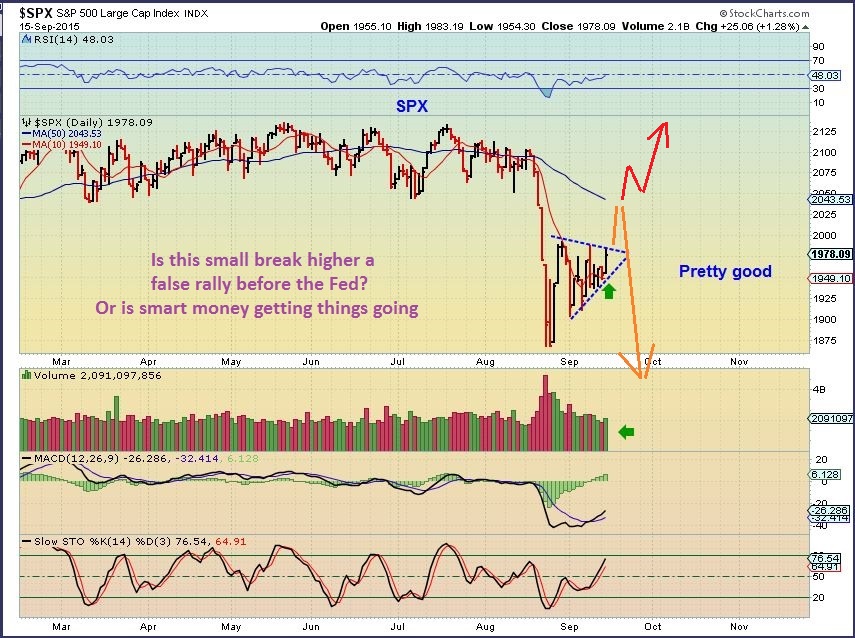
We see that happening now, so what next? …
SPX – I actually think we are going to see upside very shortly. That doji at the lows is only 1 signal indicating that. Notice how the last few bounces have been 2 big days up, 1 huge day down, 2 large days higher, etc . It could still be a choppy ride, difficult to trade.
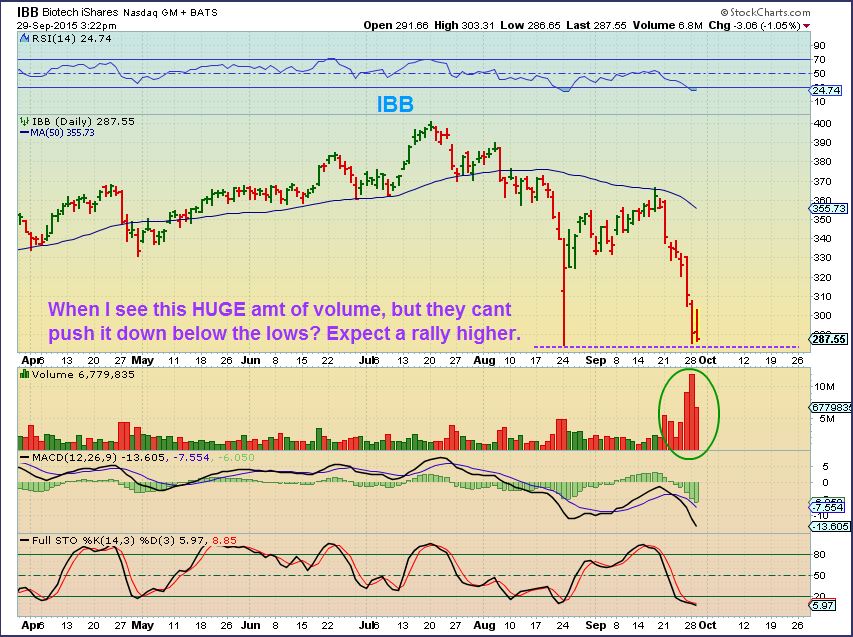
IBB – I snapped this before the close, final volume was over 8 million. The IBB was pushing on HUGE volume and cannot break the lows. Often it will reverse immediately. When I say Rally, I mean short term for now.
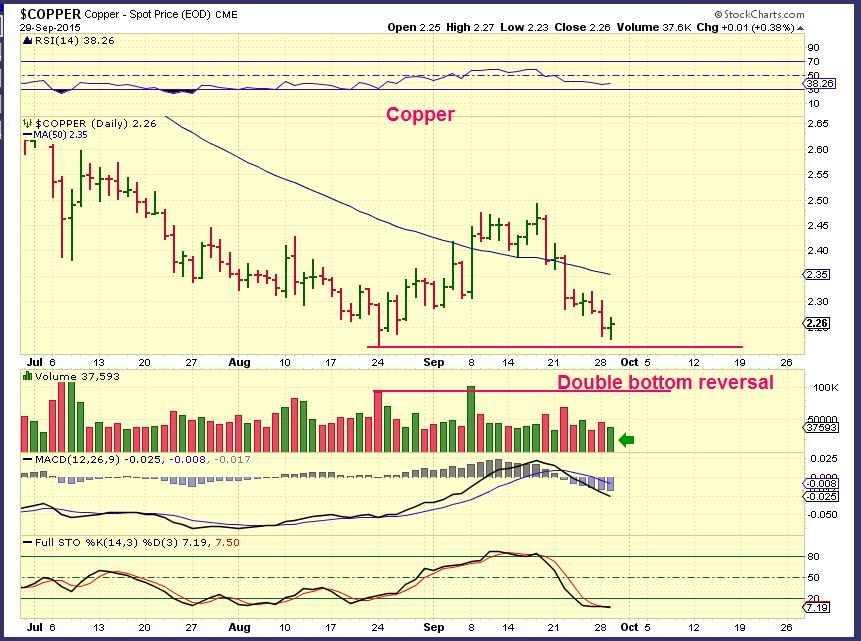
Copper– Even copper is putting in a double bottom low. This is a bullish reversal for at least a good bounce ( watch FCX).
The dollar hasnt changed its look that much. No chart.
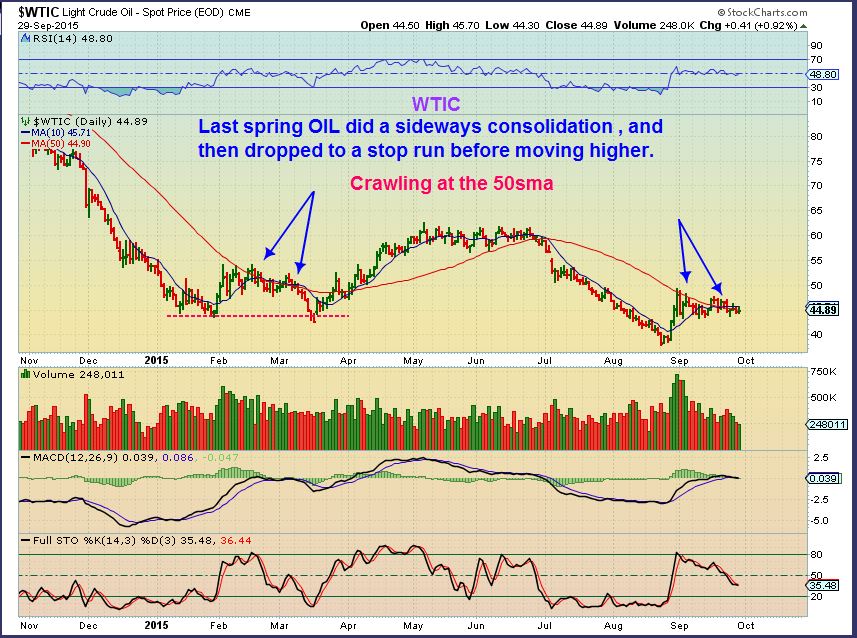
WTIC– Here is where ‘Time Decay’ may come into play a bit. Oil will not stop consolidating sideways along the 50sma and it is running out of time cycle-wise. Oil cycles actually can stretch quite a bit, but lets just play it safe and say that its getting late and this could drop to a daily cycle low soon (like last spring). As I mentioned in a prior report, this is starting to look familiar. We didn’t rally in the spring until we did a quick stop run.
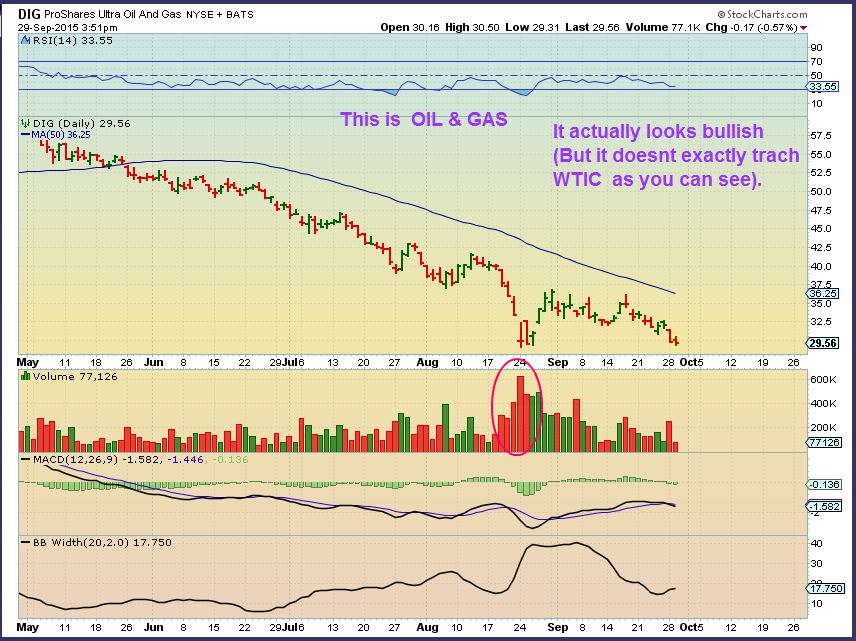
I do want to mention that I looked at DIG & DUG, and DIG actually looks like a bullish back test. Thats a bit odd, but it doesn’t track oil exactly anyways. (Excuse chart typo).
GOLD SILVER & MINERS
I want to say that some of the best trades that I have made since the bear mkt in Gold/Miners has been Bear market rallies from an ICL to the top of the 2nd daily cycle. Now I have to add that the last 2 ICL’s (March and this one) have been very different, and it is a bit frustrating so far. 🙁
Time decay comes into play here. Cycles are all about timing, and the move higher should come sooner than later in my opinion. Lets look at Gold.
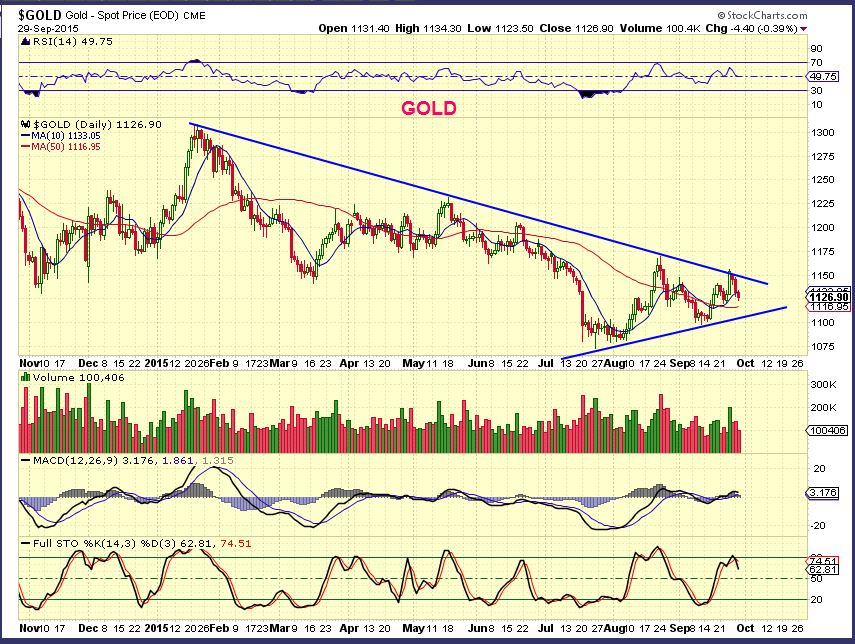
GOLD– When Gold breaks out higher, it’ll be bullish, but it has stalled and is getting later in the 2nd daily cycle. We should have seen the first daily cycles highs taken out, since the 1st daily cycle was right translated. Time will tell, but if it’s going to , it must be soon.
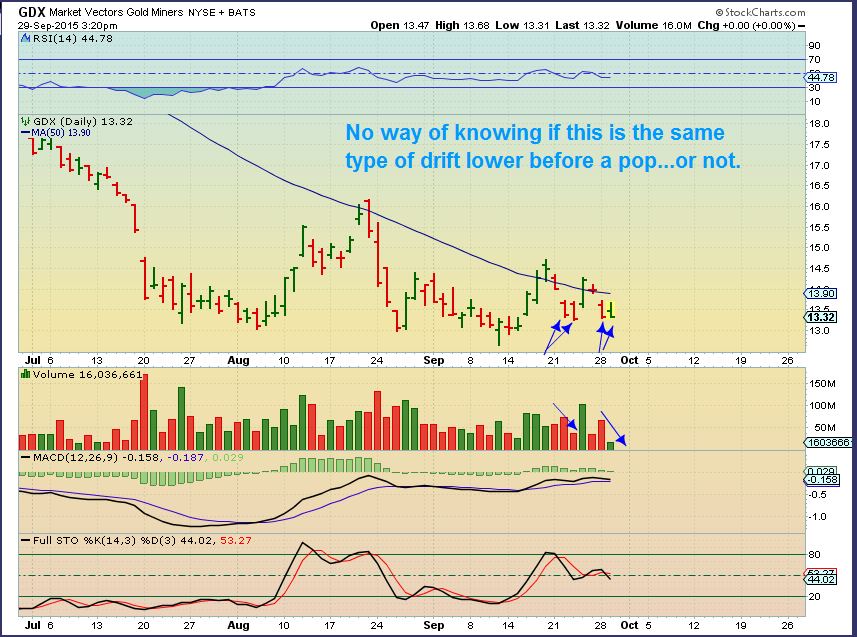
GDX – Is it toast? No, but time is getting later there too. I dont see strength in Miners, so I want to caution readers that this is not acting ideally. I am not heavily invested right now. I now need GDX to prove itself.
GDX – The only bullish idea is that this looks similar to the drop last week before the pop and the MACD hasnt crossed down. I feel that this wants to drop rather than pop at this point.
Before I show my last chart, I just want to say that using ‘cycles’, time is getting to the point where a dip to a daily cycle low is fast approaching. A blast higher is still possible, but it gets less likely with each passing day. So playing the probabilities…it is less likely that we I have seen a blast higher late in a daily cycle. I am not heavily invested, I now need to see Miners prove them selves to me.
That said, I watch this on the side…
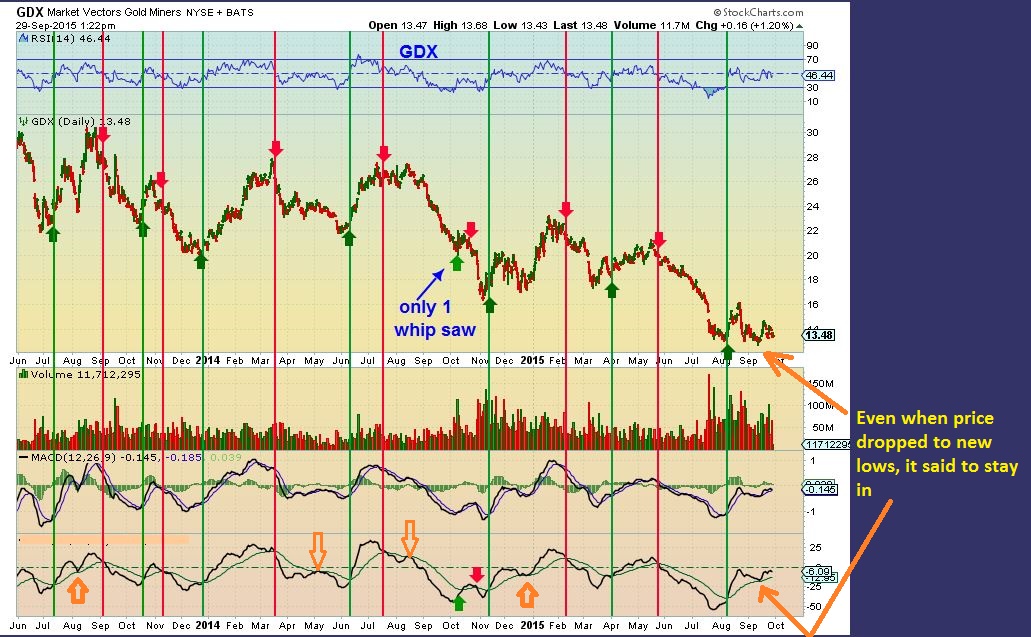
GDX BUY & SELL system that I developed. I feel like this shows how odd things are currently acting. ( See the lower box) This has been a ‘BUY’ with the cross up, ‘Sell’ the cross down visual. You would have made money every time for the past 3 yrs, but there was one odd whip saw where there were no gains. The odd part is that we just made new lows in the first daily cycle and I didnt get a sell cross down (sell). I still dont have one yet.
Is this chart reading incorrectly right now for only the 2nd time in 3 yrs? Or will we move higher soon? THIS has me puzzled.
SO I have pretty much stepped aside in this action. I got stopped out of some miners as they dipped below the 50sma and I will wait and see how this plays out. AEM is my only good looking chart and I may just sell it. Right now, Miners and OIL are neutral to me. Some are still OK, others are not looking good. There isn’t much more that I can say right here. It is frustrating, but it’ll resolve itself in time and now we have to wait and see how things unfold going forward.
I was looking for Silver & Miners to take the lead higher, they have been weak so far. Some may want to go to cash and watch, but if not, have stops in place.
~ALEX
Does It Fit? 
 Got Pain?
Scroll to top

I will be away this morning. Should be back later today.
HI any thought on this one ? it’s gdm
this would be the longer term. any thoughts on the E Wave labelling ? Maria ?
and this would be GDM longer term with 2 possibilites they yellow ABC label and / or instead 1-5 yellow labelling
the whole story from the beginning ?
Hey Ray
Here is my chart.. i jussst worked this up tonight – and it usually takes me weeks if not months to track and chart – so i could look at this tomoro & throw it all out.. annnd start again…
Anyhoo.. here’s my best effort for now…
https://www.tradingview.com/x/GyQq0nWI/
hi Maria,
thanx for your answer -I really appreciate it.
Since your picture of the wave counts is totally different than mine, I suppose only time will tell what is right – however it looks like yours might be right
again thanx
ciao
Ray.. I have this for GLD … how about you? It was MUCH easier to count than actual gold …check it out.. the waves reveal themselves MUCH easier
https://www.tradingview.com/x/Xvhebcss/
here is GLD on the weekly as well … https://www.tradingview.com/x/zUwPZzSy/
Alex, Thx for great report! Looking at futures you seem to have nailed the $SPX and IBB! Question now is will it stick??
Hey Deshy, the set up on IBB is similar to a capitulation low that cannot be forced to break down, those usually stick for a small rally at least. Its hard to recommend a long position, because the markets have been ( Lets say Dow for example) down 300 Monday , up 200 Tuesday, Down 100 Wed, up 200 Thursday , etc etc
It makes people sick, but I do think we may run up for a few days.
Does anyone recommend shorting miners here? We are on day 12 or so of a daily cycle that lasts 28-30 days. Seems to me the only way they move from here is lower.
Bill, that is exactly what I am thinking time wise, but I also look at last March and that chart shows whip saw frustration even as time went on. I had it in a report, I’ll add here to show why short “might’ not work. Once it truly topped in May though? That was an excellent short opportunity, during the 3rd daily cycle…
Remember watching Dust run from $11 to $40 from May to July , and that could be the focus in a 3rd daily cycle & 4th if we get one.
“Seems to me the only way they move from here is lower”. That seems to be the consensus for sure. I sold most of my miner positions yesterday so I wouldn’t be the odd man out. I know nothing of cycles but I see long term RSI divergence and no lower low yet for GDX and GDXJ. In my very limited understanding of TA it actually still looks Ok to me. That’s how out of sync I am with reality 🙂 But of course the crowd is right and we are heading on down.
The crowd is rarely right Alan,
That was a pretty good summary Alan. You arent out of sync with reality….the markets are though.
I have something else to consider in tonights report ( Still a bullish scenario, but rare) , but like I’ve mentioned in other reports….it is frustrating when there is no follow through in either direction. Things do not appear clear. The sideways chop in March was dreadful to me…. up & down and up & down is not a profitable ride.
When I hear stuff like that it makes me think we are about ready for a strong rally!
I am doing research that indicates that that may be the case. Its a rae development, so it is hard to predict. I’m focusing tonights report on it.
Bill, I had the same thought. But I have decided not to for now. I think the cycle high was on Day 5/6 and that we won’t see that again; however, that doesn’t make this a slam dunk short right now. I wanted to know, though. I call it a ‘revenge trade’. ‘That jerk took all my money in a long trade, so now I’ll short the crap out of it to make it back since this thing is a big piece of garbage and only goes down!’ I caught myself in that emotional trap and had to take a step back.
ETFs are pretty much waffling today, but GDXJ is currently, what $1.25 off of ALL-TIME lows; GDX less than $1 off 6 1/2 year lows!!! So, a DUST or JDST purchase today (exempting day trades closed out same day) is a bet that are imminently going to new lows. Can I say that today? No.
If we get a big bounce? Especially as we get towards the 20’s in cycle count? I’d short the crap out of it. Backtest the current chart in this report – big gap up and run? Short the top – big winner, even in DCL1 and 2. Transpose that to DCL3 & 4? That’s right. Sub-1000. Feels absolutely guaranteed at this point (which is the only thing that makes me wonder if I’m wrong!! 😛
Well put Cason.
Skip daddymac.. If I put up a NG REPORT it may Bring Frank, and mama bear here to aggravate me. So I will not put it up thanks Chartfreak.. LOL..
What does this mean Frank? I cant figure it out. …You wanted the NATGAS chart? It has been quite neutral day after day for weeks, but I can post my view here in the comments if you wish?
I am in & out today, I am helping family away from home, but I have my laptop, I can post shortly if thats what you are asking…no problem.
Natty is actually looking like a small break down, DGAZ looks like a break higher, but not with strong conviction.
Here ya go Frank. I think NATTY will drop and test the lows again. It has been rejected at overhead resistance repeatedly.
.
Thanks
Gas looked good on the pop last week but was busted down HARD. With contract roll, UNG and related ETF products are now on a 52-week low and set to continue lower. Until there is a robust fundamental production/usage change, the trendline will continue to reject any pops. I’d expect a retest, but a lower low in non-direct futures products.
Next report… Or I’ll have to call mama bear.. AND YOU DONT WANT THAT,!!
huh?
Just keeping him on his toes
Just back from lunch and I see oil and silver higher and gold lower!! That looks a little odd!?
Yes, Miners higher, gold much lower.
Even odder!! I thought it might just be the effect of my lunch time drinks!! 😉
hey i might claim credit for this one C..
check my comment from this morning 🙂
>>SonOfGud
>>chartfreak1
>>5 hours ago
>>Goid down, but Silver is looking good this morning… ready for a spike??
not keen on that sudden reversal tho’!
Definitely not looking great right now!
if it drops lower now.. thats got nothing to do with me.
miners are reversing off a descending wedge, so maybe that’ll stick
FEEL FREE TO CORRECT ME IF I AM WRONG, but just going from memory I wanted to remind traders that JNUG, NUGT, etc do a reverse split soon ( I was thinking tomorrow)
Yes, I seem to remember 10-1
NUGT, GASL, JNUG, JDST, FAZ, TZA.
http://www.direxioninvestments.com/press-release/reminder-direxion-to-execute-reverse-share-splits-of-six-leveraged-etfs
yes, warning. they will sell off a bit.
once reversed-split.
Energy Stocks might be ready!
I posted this a couple of nights ago, but it was really late. Almost a 100% retrace in BAS. It was pretty much murdered in the face so far this week. Double-bottom soon, idk? I’m not buying anything this week. Nothing.
Thanks for the chart
It was telling us all the bottom was in!
Maria & other E.W. experts…scroll down and see some charts Ray posted. Thoughts on E.W.?
sure.. will do as soon as i can… tho im nooooooooooo expert ;o)
You have become one of 3 or 4 resident experts here.
Lord help us all!
….
Excuse me catwoman, Ray asked for your input on his post hours ago.
lol… i had a meeting…i said as soon as i can… which prob will be tonite..:-/
i have to pull it up and study all the cracks&crevices… get to know it intimately b4 i can comment…
Oh My!
thanks but no thanks.. ;o)
im just learning….s – e – r – i -o -s – l – y
DQ, up 8% good call Maria. Alex, what do you think? Above the 50dma, rising MACD and RSI! Volume? Not much……
thank u dear.. been trading or should i say riding that wild bronco – for some time now…
that chart was calling my name… ;o)
Looks like a bull flag currently on the 4hr chart
You see exactly what I see…break over the 50sma, but volume is weak. I’d like to see the volume come in a bit stronger . IF I was in it I’d raise my stop to below that 50sma , just in case this light buying is not enough to give it follow through.
Using cycles , we feel that time is passing for a burst higher.
As a technical analyst? This is a bullish set up & I see plenty of them out there. (Refresh)
.
Silver Stocks look more bullish than bearish. See SSRI (Above the 50sma) PAAS, EXK, AG, SVLC are bullish looking.
Well, that figures after getting stopped out of everything.
I’m in the same boat.
Maybe being selective toward better performers is a future thought. I often try the ones closer to their lows for the more bang for your buck %-wise, but the better ones above the 50sma would not have stopped us out.
That’s why I tried RIC but it didn’t work for me. To be fair, I didn’t stop out yet, but at -5% I moved on when I felt the whole sector was going to crap and I was out of JNUG.
Oil 200MA on the 4 hr now turning up. Refresh.
So far thats a good guide. Buy that area and stop out below it…
BUT I MUST REMIND YOU NEVER – EVER – EVER – BUY ANYTHING BELOW A DOWN SLOPING 200 SMA…AND OIL IS ON THE DAILY.
LOOK AWAY JD, LOOK AWAY! (lol)
CF, what a BRILLIANT idea! I will seriously consider it.
Thank you for reminding me.
As RF said in Singin’ in the Rain: remind me to give you a raise.
You: …
Well, You did ask us to remind you.
I thought you were getting a little too close to Oils siren song with that 200sma on an hrly 🙂
Been buying stuff below a falling 200DMA. Won’t be doing that again. EVER!
I’ll remind you not to…
oh, and JD….Give me a raise too!
You’re looking great these days CF. There’s your raise.
Ignore the name for the first 5 seconds. Just glance at this chart and say to yourself BULLISH OR BEARISH?
.
No! Stop playing games with me! 😛
Neither it’s going sideways!! Lol And most importantly is it below a downward sloping 200 sma!!? 😉
Falling STO I don’t like, volume is low. but above 50dma is good. Looks like a bull flag forming. I’m neutral
Agree, but volume in Sept was higher in the buying then the selling, and stoch can turn up around the 50area. Usually that happens on the real bullish stocks tho ( for ex: see UA Jan – April of this yr. Stoch tagged the 50 & turned up often. That was a bullish stock though).
Nothing doing. Falling 200DMA. Personally, wouldn’t touch until 200DMA nudging up and most other things positive
Remind me never to buy under a falling 200DMA…
You again, Mr. JD
For you I have what I have advertised on here as my long term buy & hold list. Even in the last slam down, they are still….Wait for it…. Over their rising 200sma.
I had mentioned last yr & earlier this yr….UA, NKE, ULTA, MCD and a few more for long term solid buys.
If this is a healthy correction of 10%..those are strong, if this is the start of a bog down turn, they will give it up later ( See LULU, they will start to look like that).
Alex, any hope for Gold – GLD – versus miners? Does it at least have a chance to get back to the top rail or is this headed straight down (like it has since Thurs?)? Done with craptastic miners, but still had a bit of GLD as it had (until today) looked stronger than the bunch. Hoping for another pop before it goes worthless. But hope isn’t a method….
You’re going to hate tonight report. Its about M-I-N-E-R-S , but there is hope for both.
Not a super Uber bullish hope, but I have an idea, been researching a bit today.
Yeah, but I’m still going to read it!
wow.. szym
hmmmmmm ????? https://www.tradingview.com/x/KY0H208T/
AU, AEM, ABX, SSRI, – they all look bullish (ABX at the bottom, but MACD & VOLUME say buyers beat sellers.).
.
I hate Miners now too, but that may be what they need to leave without most of us?
Alex,
Ag seems to be leading….cde lagging……Any thoughts, opinions..
thx
Not really any important opinions. I see AG, SSRI, SVLC looking good, some others lagging.
I also wonder if GDX is going to put a bullish engulfing in by the close.
I love the way SA and AU acted today
Please forgive me in advance… I just got multiple buy signals on miners.
Even the GDX: GLD triggered
Well…if everything hols into the close.
This will get interesting if those buy signals stick and we get follow through because silver and gold are still stuck in the mud. So maybe the miners will lead the next (and VERY long awaited!!) charge. And miners leading is the more bullish set-up isn’t it!?
giggle
AKG.. just completed it’s ending diagonal… ‘should’ head up
https://www.tradingview.com/x/keK4ULZn/
I thought you never lost the buy signals?
Multiple systems.
Above I referenced GDX:GLD for ex….that was lost a while ago when Gold out performed.
The one in this mornings report is current & wasn’t close to a sell
GDX needs to end day 13.69+ to create bullish engulfing candle…
lacking vol at moment perhaps?
They will add 25 million at the end of the day.
EGO is trying to break out too (among other set ups). I cannot believe the fickle moves in this sector.
a fair point
NGD, long again. Remember, strong company.
anyone buying back in to miners here.. or awaiting more confirmation??
I’ve possibly lost my mind at this point but I’m buying…
well here’s my updated twerk analysis GDXJ.
looks like they may have done it again (whoever ‘they’ are)
nice piece of twerkn
thx missy
Alan’s cojones … respect
HA!!! omg…. 2funny
thankyou.. what a great audience..
https://www.youtube.com/watch?v=TcIoHNzzbLk
I may be a fool here but there is an advantage to having a rather small trading account…you have less to lose.
well im still in with you.. i shed half my load on monday, but been caught out in shakeouts in GDXJ so many times im getting some immunity
:o)
I’m personally waiting until tomorrow so that I can take a proper considered look at my charts first. But have been looking at the chart of AEM for about the last 15 minutes and the longer I look the more things I spot that I like. It’s one Alex mentions as well. It looks so, so similar to the double botom set-up last Nov/Dec but with indicators in an even more bullish configuration. Back then it launched a very nice 40%+ gain in just a few weeks. I wouldn’t mind seeing that again. 🙂
Starting to look good, but no saying it will last.
Absolutely unbelievable. .. Many of the good proper looking set ups are back in Miners and Energy turned too.
Both of these were with Oil barley up and Gold down quite a bit.
As they say…’If at first you don’t succeed, then try, try again’!! 🙂
And then Gold drops & closes below the 50sma while a bullish reversal occurs on GDX ? UGH
SA, IAG, EGO, SSRI, AU, AEM, etc etc etc all perform well with THAT going on?
Crazy stuff
Am I right in thinking though it’s more bullish if miners lead!? As long as they are leading…and it’s not another ‘false dawn’!!
It is better when Miners lead, I just hate to see Gold close below the 50sma right as they are turning higher. It just adds to the murkiness
Trying to see something positive in the gold price itself right now…not easy!!…it is approaching the minor trend line connecting the July and September lows! Hopefully 3rd time lucky and the third low produces ‘take-off’!! I’m sure we’ll know soon enough…. one way or the other!!
Today I realized there are very few bulls left. Maybe for good reason but the pessimism is quite remarkable.
as TM says “… I like it, I love it, I want some more of it..”
Hmmm .. No I’m not going there..lol
just actually reading your report now CF.. diggin that IBB chart ;o)
annd you mentioned FCX…that’s nice as I picked that up the other day & it’s been making me wipe the sweat from my brown a few times… tee hee.
great report… crazy times…
here’s my crude chart…honestly no clue if it’s correct (insert disclaimer here ) but it sure feels like it .. ;o)
https://www.tradingview.com/x/SaWeUTgM/
Where you have 1-2-3-4-5 down and then 1-2-3-4-5 up, I was thinking 1-2-3-4-5 down and a-b-c up, but I dont have a degree in E/W – I’m a rookie
lol.. yes.. that can also work… as “C” is very much like a “3” … both 5 strong waves that can extend.
that would just make the current flag… a ‘complex’ correction .. a double zigzag? maybe… like this?
https://www.tradingview.com/x/USOb4bTH/
That is exactly how I was seeing it professor (possibly, maybe).
P.S. – what makes you anti-Ray? 🙂
lol.. no anti ray ray
im working on those charts now.. it takes me (as sweets says) FORRR EVVVV ERRR .. to count & label the waves…
Dear RR
Hello – thanks for posting – apologies for the lateness of my response..
Nice job on both charts… I have not charted either of those before so it’s taking me MUCH longer than expected to chart for review– the count is sooo murky….. uggh. I cannot for the life of me figure out the ‘ending’ count myself so sorry i can’t comment on the ending/current wave… CHRIS… SON … KEN .. where’s KEN??? Any input? They are much more experienced at this than “mwaw” (as miss piggy says) ;o)
Ps. Who’s we anyway… u & the mouse in your pocket?
ps. if we were friends… I’d tell you to kissMyA$$ ;o) HA!
for the degree thinng…