
Clear As Mud
Whenever we get mixed signals in the markets, it may take time to allow things to clear up. We are seeing that with the divergence between Metals and Miners right now, but until time resolves the differences, we can also look for clues. We’ll do that here, but first lets review a few other sectors.
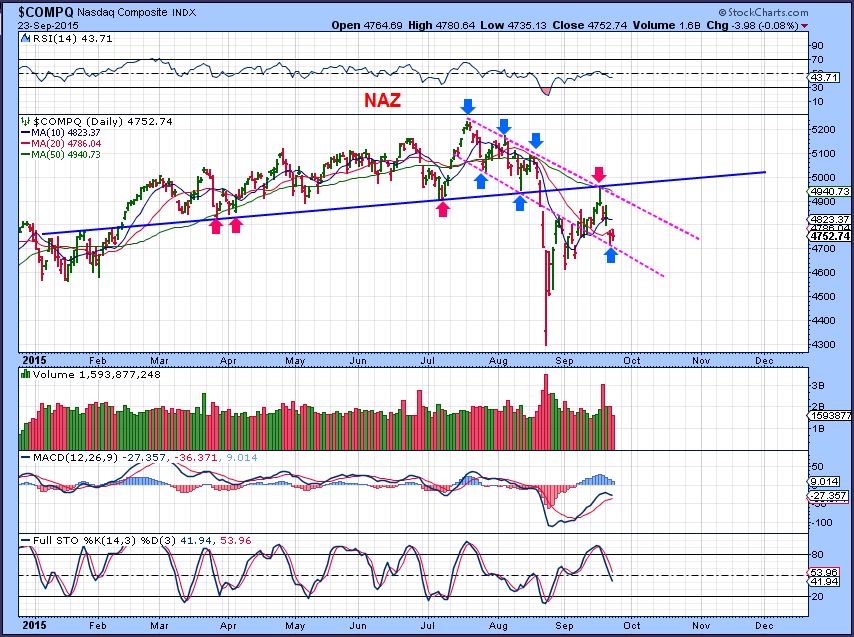
NASDAQ – We got the back test that we expected and then the drop back down. I expect the Aug lows to be tested or broken, but you can see that volatility has kept things from being a smooth move. We may bounce around inside this down channel too.
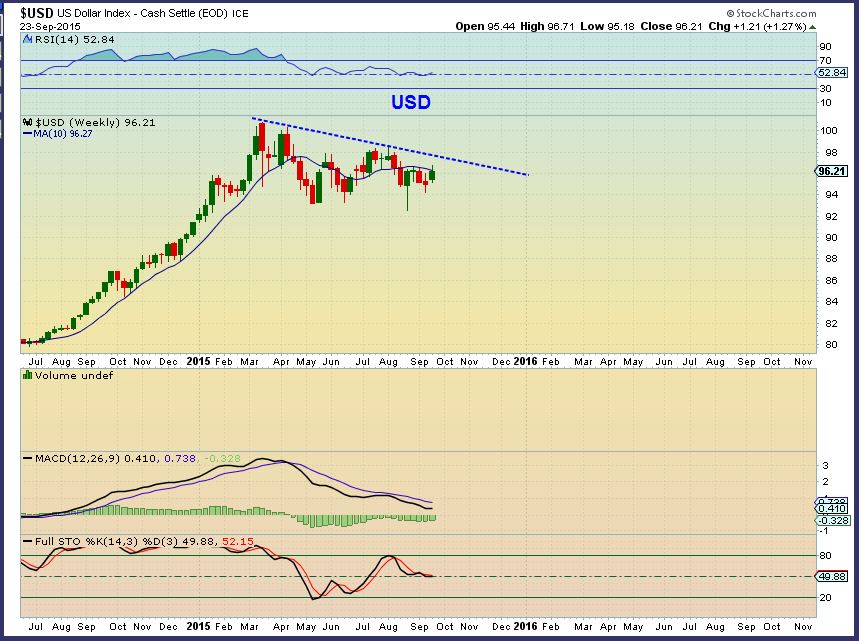
USD WEEKLY – it crossed above the 10 ma, but lost it Wednesday. The MACD is bearish, but the RSI has held up. Mixed signals, but Friday will complete this picture.
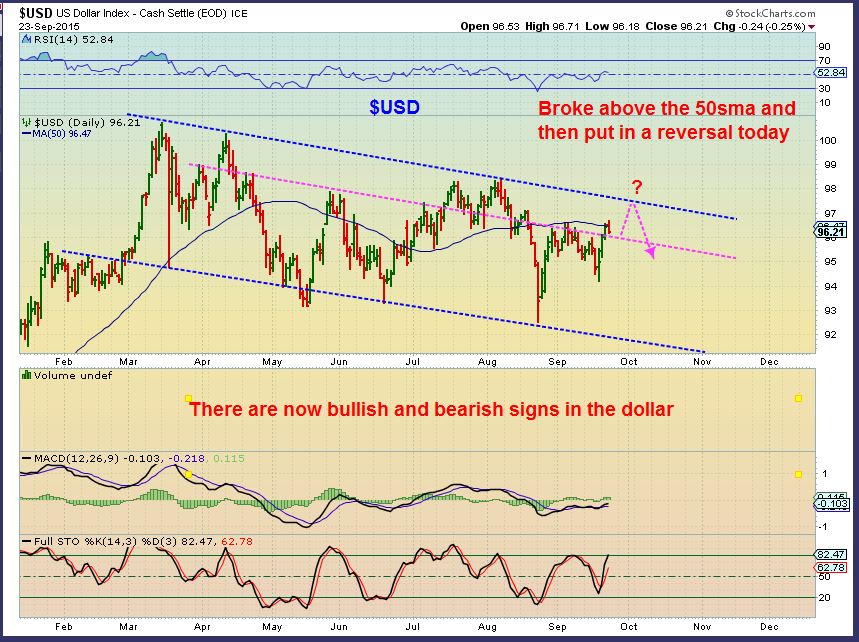
USD DAILY – Mixed also. We had a reversal today after rising above the 50sma. We could still go higher, I believe we are still early in a new daily cycle.
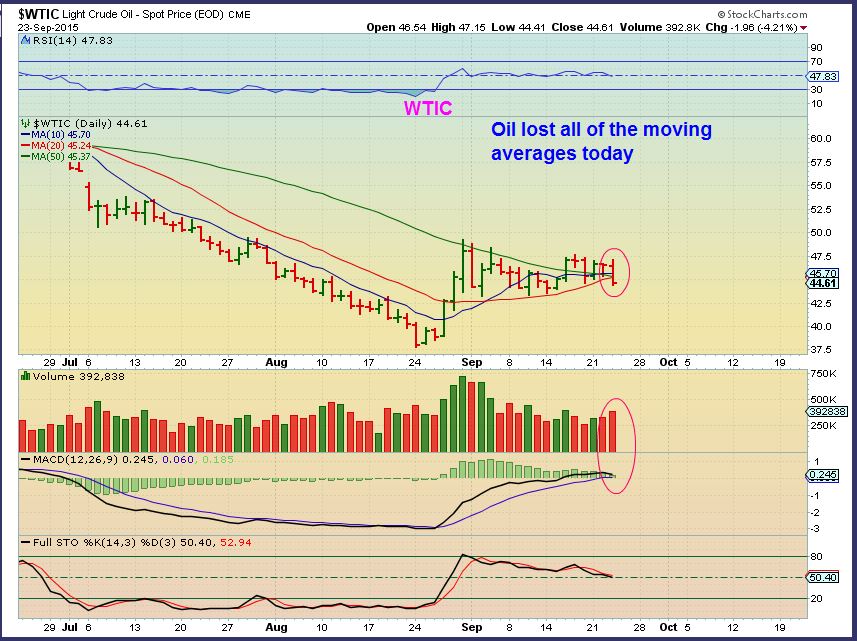
Lets talk about OIL.
A very bullish looking set up now looks to be failing. Energy stocks seemed to be pointing this out all along. They have been weak for days.
.
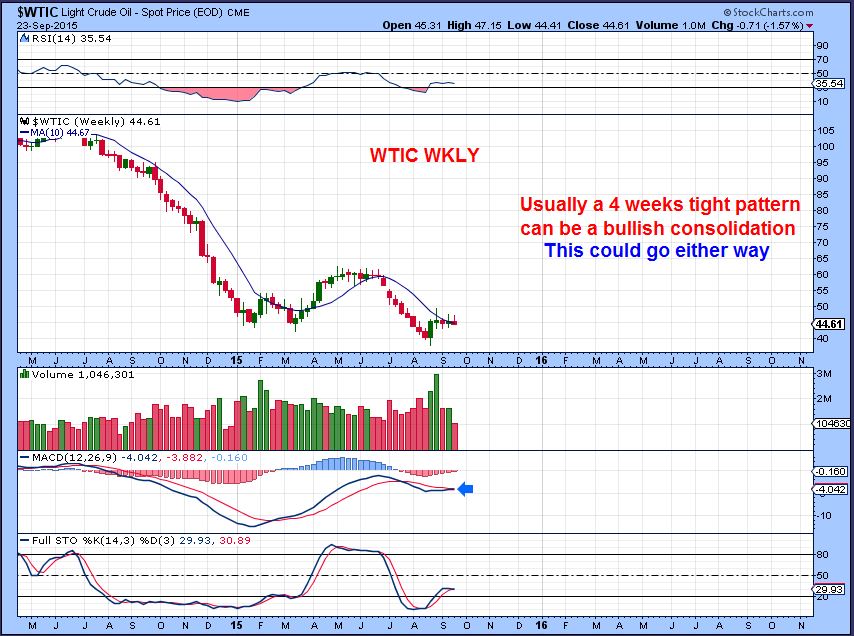
WTIC WKLY – Usually this is bullish, but it can go either way. I am currently out of everything energy for 2 reasons.
1. I dont like the way that the energy / oil stocks are acting. They were breaking down below their 50sma while oil was up strongly Tuesday .
2. Wednesdays oil reversal reminded me of something.
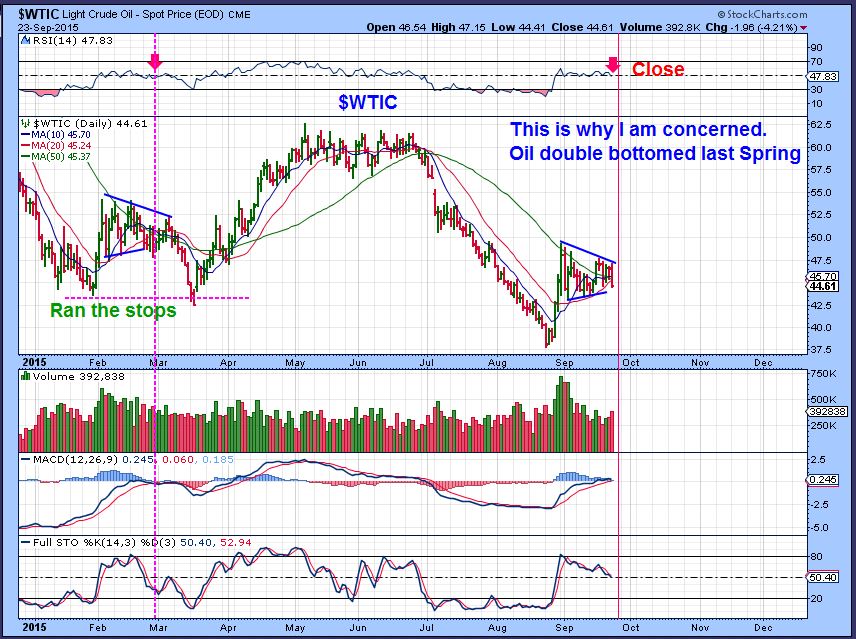
WTIC – This was an ugly reversal after inventory reports were bullish. What did it remind me of?
WTIC – I was reminded of the bullish set up this spring that fell to a double bottom ( stop run). Notice the similarities in February and now? I just want to step aside and see how this plays out for now. Energy stocks have not been acting correctly.
With that in mind…
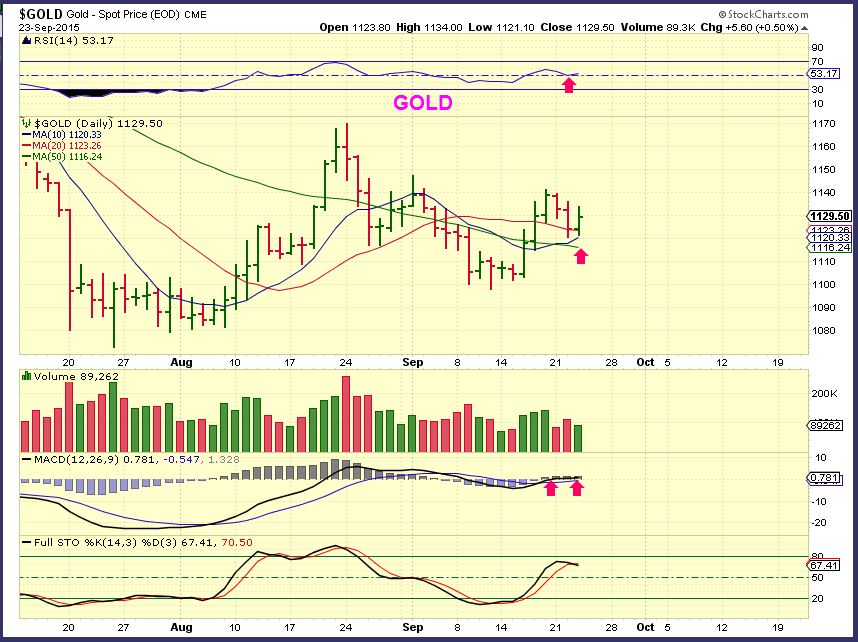
Miners are not acting very well, but GOLD looked nice today. Lets examine Gold and Miners for possible clues.
GOLD – Gold really has a bullish look to it. Support held and price reversed higher. USUALLY we see Miners Lead the way. Are Miners telling us that Golds move is almost done? Or will Miners take off upside soon? Both scenarios will be shown here.
SCENARIO 1. What if Gold is almost topping, and Miners are weak -pointing to that conclusion. ( Right now I feel this less likely, but we’ll need time to prove this out). This top shown is only $1150. Look at the chart above and see where $1150 is. You’ll see that 1 day could do it.
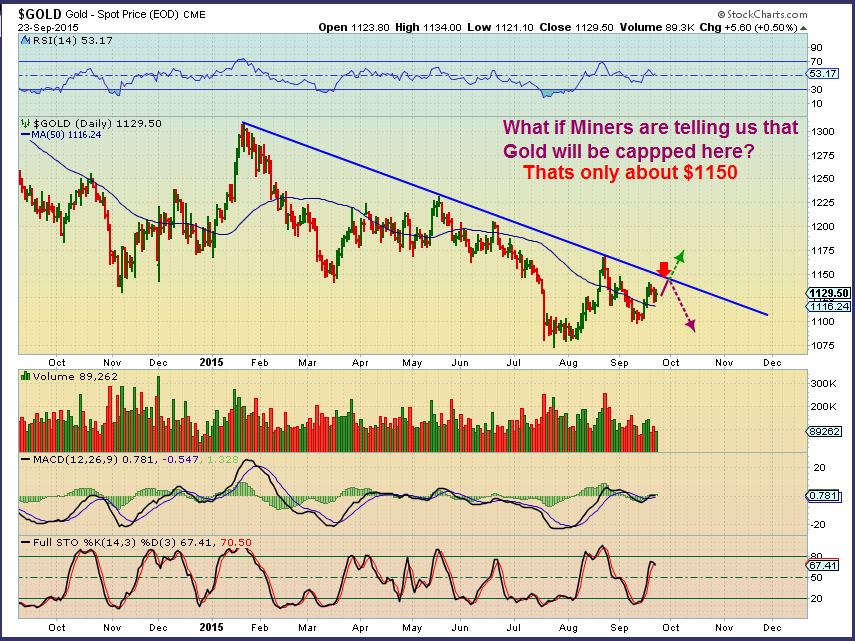
SCENARIO 2 – Golds first daily cycle was Right Translated and should run to new highs. The C.O.T. was bullish again and sentiment is terrible. Miners are likely being shorted here, and that could cause a short covering rally. Lets look at Miners and see why they may be delaying.
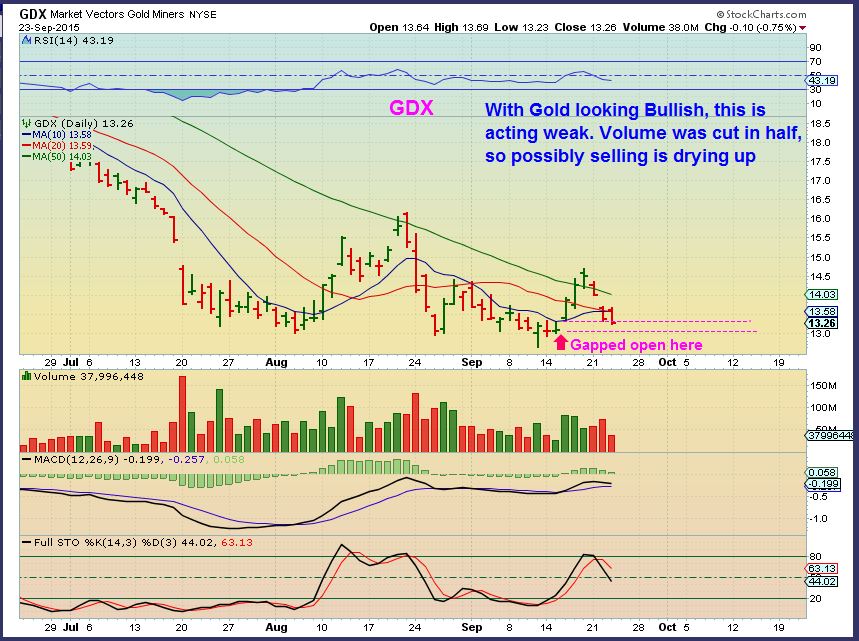
GDX – Sept 23 – Possible drop to a gap fill on both GDX & GDXJ? Selling Volume did lighten up today. Look at SEPT 9,10 on this chart. It looks like Sept 22.23. We got a quick reversal on Sept 11 – maybe we get a gap fill & reversal Thursday?
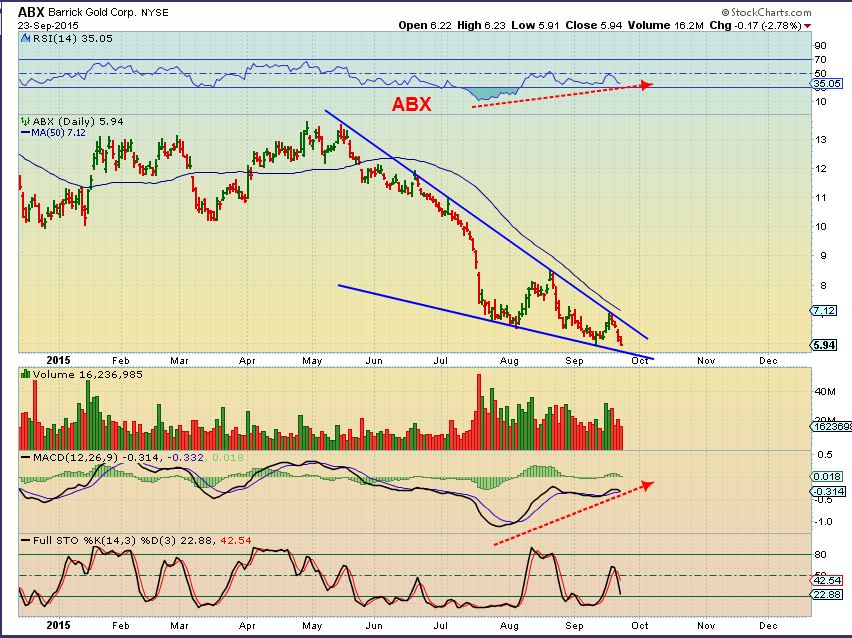
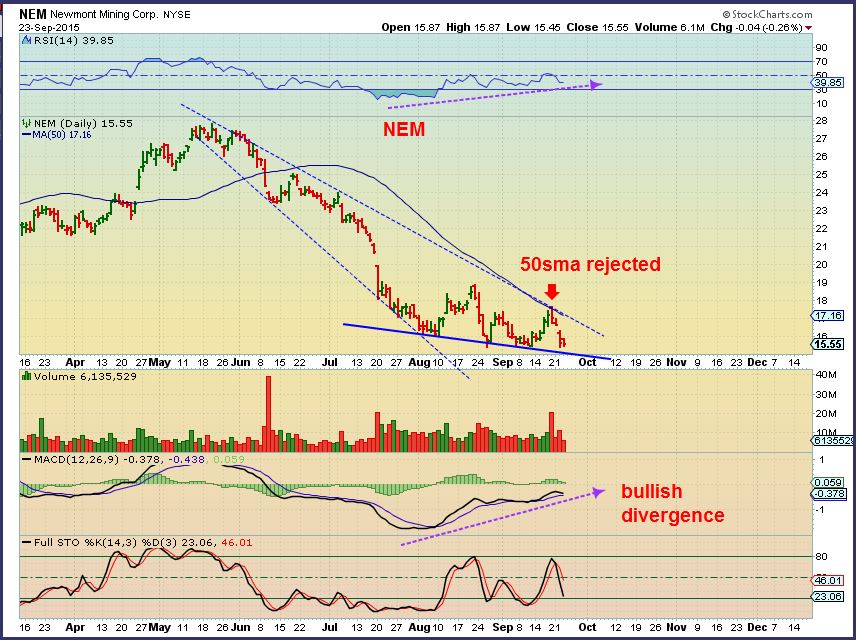
The best thing that you can do under these circumstances is look for more clues . I will look at ABX and NEM. They are heavy components of GDX. Are they Bearish or Bullish?
ABX– Yes, it looks like it can drop more (GDX would fill the gap?), but it also looks like a Bullish descending Wedge and Divergence is strong.
NEM – This stock also looks bullish. It could also drop a bit more, but it also seems to have strong divergence and support that would fill that gap on GDX. Time will tell. Very light volume today.
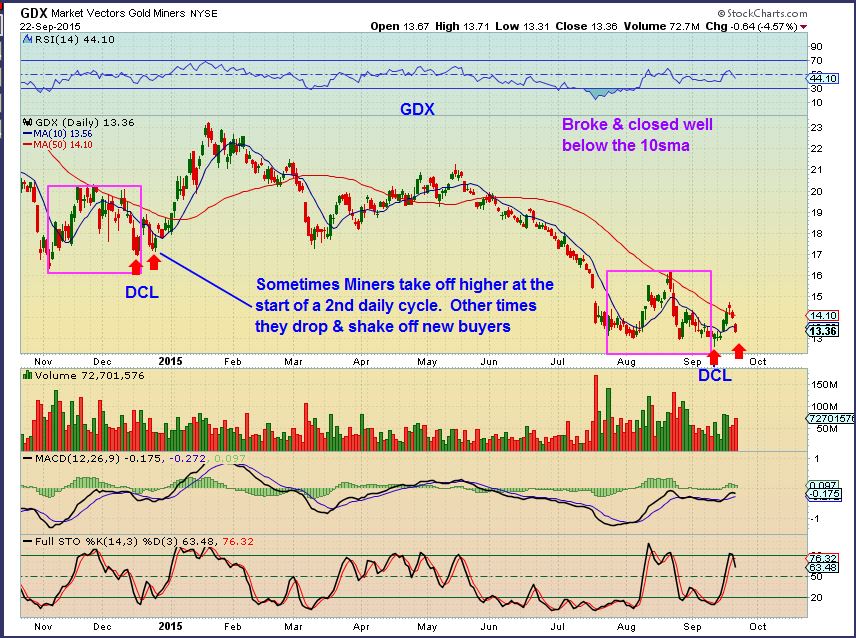
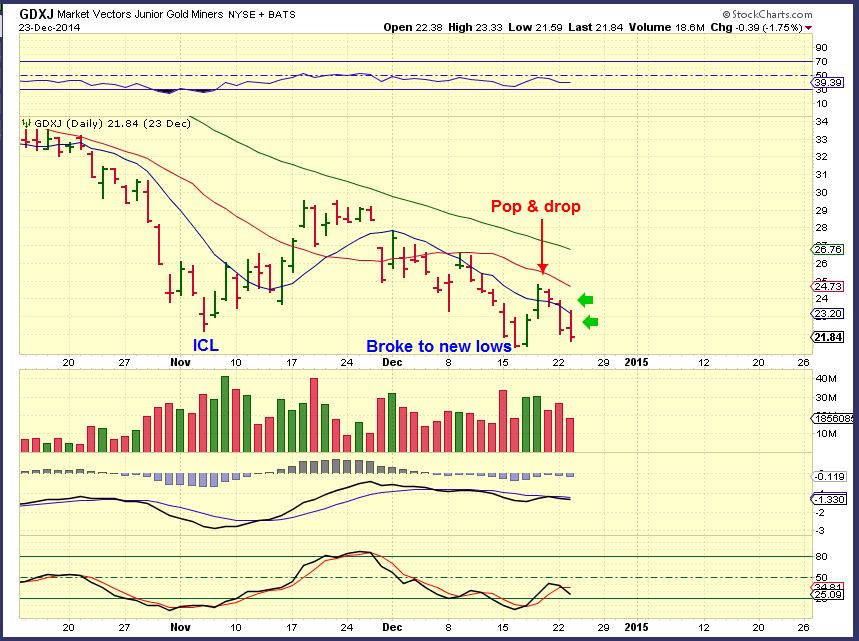
I pointed this out in the Wednesday morning report. This type of drop has happened before. Look at that drop in GDX last Nov to Dec. ( Pink boxes). Then when the lows were in, it Popped and dropped again, similar to now.
Let me go 1 step further…
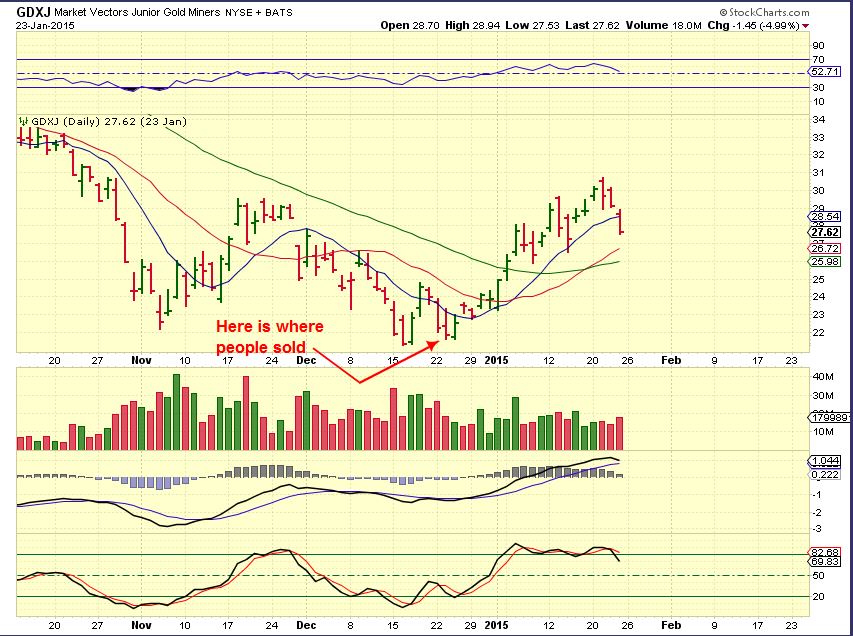
If I quickly told you this was a chart of GDX today , you would probably not give it a second thought. This is GDXJ last December, the day before blast off. The MACD was weak then. It isnt now.
GDX now – compare the 2. The above Dec GDXJ price was closer to the lows.
The next day
Nothing is broken on the charts, but if this type of movement bothers you, what should you do?
You may want to get out / step aside if the weakness bothers you. If you do , or if you get stopped out, do NOT jump back in on the next green morning. Let it prove to you what it needs to do for you to stay in and be comfortable, whatever that may be. A cross of the 50sma? An overhead trend line break?
Am I saying that this cannot fail? No, Scenario 1 plays that out. Gold could top and both could drop. I take all things into consideration, and I see a first daily cycle that did a nice run. COT is Bullish. Sentiment is in the trash. Unfortunately that 1st daily cycle pulled back similar to the one in Dec 2014. That 2nd daily cycle was great, and we have a chance of seeing that here. I just want to have everyone ready in case we get that type of move higher. We could see a couple more days of wiggles, so do what makes you comfortable during that time and we’ll see how this plays out in Time. 🙂
~ALEX
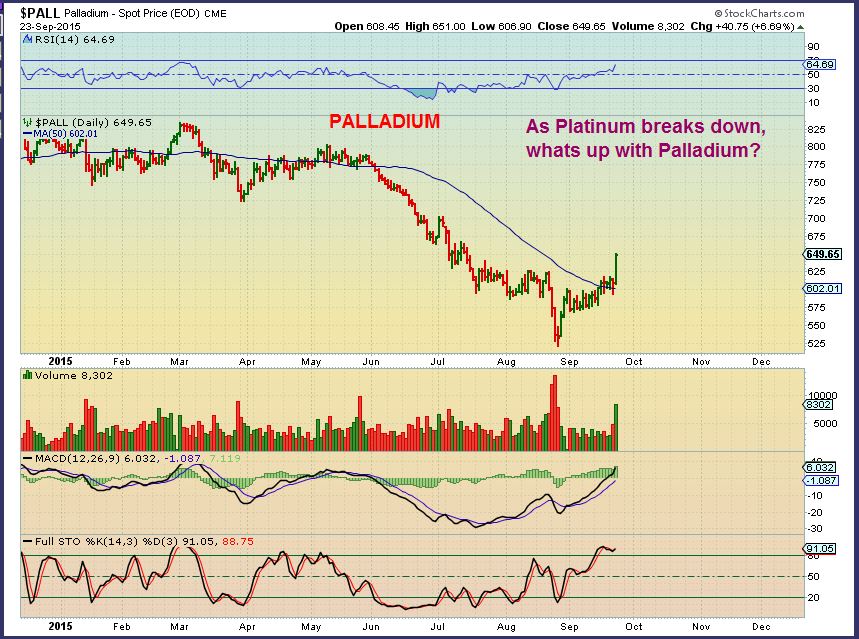
P.S. Whats up with Palladium and Platinum? 2 very different paths being taken.


Oil supported by 200 MA on the 4hr chart? Refresh.
Right. I was trying to figure out if oil will consolidate down here or wiggle around versus continue to sell down back in to the high 30’s. Either way, got rid rest of USO yesterday, won’t add any positions without much more clarity.
nice jd … 🙂
Update to that chart. Refresh. Interesting.
It makes sense…just after I got stopped out of my long position!! 🙁
mmm hmmmm … u KNOW how they do….
I’m learning…the hard way! 🙁 But bottom line is I have to respect my ‘stops’. Just sometimes they ‘suck’…but only with the benefit of hindsight! I’m happy to say the ‘long gold’ position I put on yesterday is going a LOT better!! 😉 🙂
sweetness
man .. i sure hope oil doesnt fail.. that means im WAYYY off on my count :-/
i have it looking H O T .. like it is jussst finishing up wave 2 (5-3-5)right now… where 5 is ‘usually’ a throw over from the triangle,(read: stop run) followed by a quick thrust up for wave 3/C -whatever the case may be. :o)
oops .. u prob need the chart.. lol
https://www.tradingview.com/x/55m558I2/
Interesting. That could still be the case. If this plays out, we’ll see it in the charts and CF will likely post a bullish update. Yeah, I was looking at some of the energy plays yesterday – was putting waves on the BAS chart and had mostly the same inflection points except most of the stocks did more a ‘straight down’ second wave than the consolidation (sorry, correct term escapes me right now) 2nd wave that oil accomplished. If energy stocks have another quick 5-8% and then reverse, that could indicate start of wave 3. We’ll know soon enough.
luv the comments guys… i prob should have said ‘i have no position’ in oil or energy for that matter…just in gold miners …… exited my dq position yest as well- woop –
See my updated 4hr chart M, below
Well it certainly stopped me out this morning!! 🙁
I dumped USO yesterday but wasn’t as quick as I needed to be. 🙁
I opened up a very small long (spread bet) when I got a buy signal (again!) on my 1 hour chart this morning. Fortunately I kept my stop nice and close but starting to feel like ‘death by a thousand cuts’!! I also got a signal to short the Dow around 16260 about the same time. Guess which one I didn’t do!! Lol
Good luck. My short SPY/long GLD working this morning, but pos’n too small.
Thanks Cason. You too. 🙂 Too small is better than none at all!! I was going to add to my Dow shorts at 16260 this morning when I got another sell signal on my 10 min chart but went long oil instead!! That stung a little!! But consoling myself with the x2 leveraged inverse ETF’s I already have on 3 other indices and the fact I put on a long gold position yesterday as well. Just in time! If your confidence has taken a knock any time it is sometimes better to build it back up again with smaller positions initially. Don’t try to ‘hit it out of the park’ and recover losses all in one go. Better to do it bit by bit and rebuild confidence in the process in my opinion. But short SPY/ long GLD looks good right now. 🙂
Oh and meant to add. I thought I spotted a minor H&S on my S&P 500 1 hour chart this morning. The neckline is at 1950 and has been retested as resistance before the drop today. This gives a short term target around 1880. I can’t promise it will get there and if it does it may go lower still but possibly a level to watch. Hope that’s useful. For what it’s worth I think it may go lower still.
I hope you’re right Maria! Since I breached the subject last week, I should pull a Paul Harvey this a.m.: I bought BTU (coal) based on technicals – it closed below my stop loss on Tuesday & I dithered before exiting even lower yesterday…. think I’m out of all energy until the Dec/Jan time frame that a cycle guy I follow is using. I do think there is a lot of potential here
Euro making a move up? Above 200DMA. 50 DMA closing in on breaking above 200. Weakening $? Would expect oil to do well. On verra.
Hey JD – As I think You and I briefly mentioned before , I’ve been watching the Yen and $XJY:$USD. I like the bull flag on $XJY and I think that is the key to a Gold (maybe even commodities) move higher.
The dollar does look like it has more downside and I like Gold here – Silver & The Miners just need to get on the same page.
Hi CF
Yen seems to want to rally, hard. It is a hated asset so…
There is a huge inverse correlation to Nikkei and indeed stocks generally (above 90%).
Not a clear corr against commodities.
However, if – biiig if – US$ weakens v Yen AND Euro then that could well be the rocket fuel needed. Looks as if it has a better than 50% chance of happening.
Yes, watching YEN/USD very closely and testing the boundary of Alex’s bull flag as I write!!
Hi JDWM. I’m seeing a VERY mixed picture in the currencies. As you say EUR strong today against USD but CAD and AUD both much weaker, which ties in with the weaker oil price. But very volatile so things could turn on a dime!
Hi Chris
See my comment 2 below
CF, thanks for showing both sides of miners/gold. One of the issues I have is I get set on what is going to happen then put on my bullish/bearish blinders and don’t objectively consider both sides as well as I should. The one item bothering me the most right now is time – based on previous counts we don’t have too much time left to linger at the lows before it shoots up if that is going to happen (counted currently at 7 today’s chart vs. 5 days in Dec/Jan 2nd daily cycle low and blast off).
General markets – if not short, at least hedging short here to protect against possible big downside. Only one comment for the group, if you play options – SPY options are ENORMOUSLY expensive right now due to all of the recent volatility – so keep that in mind as time premium is, well, at a premium – preventing me from really ‘being short’ and more neutral/hedged. Levered ETFs likely the better play if you have the free cash and the stomach for it.
Curious Gold doing well, silver less so but ok but oil looking heavy
Not sure what it was when you wrote this ( Silver was break even a little while ago) ,
Silver just popped and took back the 50sma.
Alex, do you think the ‘pop’ is just to do with options expiry on gold today? At least so far. It will be interesting to see where we finish the day. I have gold banging it’s head on that medium term trend line right now. It would be nice to see it get above that today!!
I am of the opinion that we are in the second daily cycle and it is due for a run higher. I’m watching for follow through , so We’ll see where we close the day.
Sorry. I wasn’t doubting the view on the 2nd daily cycle which I fully share. Just pondering if that intial ‘pop’ may have been very technically driven by options expiry. But as long as it goes up, who cares!! And as I write, I have gold starting to pusk above the MT downtend now as well. Even better! 🙂
Yep. There’s a lot of day yet to go but so far it’s following thru well.
Too true OFT but great to see a rally at least getting underway with gold while the general equity market has another ‘smack’! Long gold and short the major indices with x2 leveraged inverse ETF’s is working rather well for me right now. 🙂
My experience tells me not to get too positive in PMs till Silver is. Gold rising is more deflationary than anything. However, miners liking it.
I agree, but I think Silver is joining in too. It is over the 50sma and the chart (kind of) looks like Gold did yesterday.
Gold up $24, rather nice move of 1.9%. Silver is actually now up 1.5%
Oh – I wasnt taking offense or anything 🙂 I was just somewhat implying that for whatever reason, and it varies from cycle low to cycle low….the cycles work like clock work . I dont know why the pop today. If we were on day 24 and it was options expiration, they’d be dropping down I imagine.
Cycles work SO MUCH BETTER in a Bull Market too. If we can finally break the grips of the bear-market and get back into a metals/commodities bull ? Those could be traded with great precision in the past.
Well deep down I’m believing that we have at long last seen major bear market lows in gold/silver, so hopefully we’ll be back in a full blown bull market sooner rather than later! 🙂
..exciting..
Gold testing Alex’s medium term down trend at 1145!! Go gold!! 🙂 Possibly to do with options expiry!?
Yesterday I came into the comments section and said that the move did NOT look believable or real.
Today, the move looks real (GDX has 4 million in the first 7 minutes for example. Yesterday GDX had 2 million in 15 minutes.)
i L U V when u post this………………………………….
Me too, because it doesn’t happen often enough! 🙂
And MUX is up 8%, you probably like that too .
Volume on GDX 15 minutes into the morning is now 6 million. If we have 10 million by 10 a.m. Eastern, and this kind of price spread, I’ll be pretty happy. We may see the shorts that jumped in yesterday have to cover.
he he .. yes.. i do.
ps. how about that DQ-JNUG … sheeesh..
used to be KNDI-DQ-JNUG… like clockwork.. crazy
Yes, I do remember that KNDI DQ JNUG now, and the DANG, MOBI, RENN, REDF phenomenon
Yep, and this morning also disproves the notion that miners can’t rally with the broad stock market getting hit hard. Breadth is hard negative at about 6:1 and vol is about 9:1 down. I thinks it’s been mostly coincidence up to now as there is plenty of precedent for gold and miners to rally while the SM gets smacked.
You missed a huge sentiment indicator in today’s report. I sold JNUG yesterday.
I know . ( Bummer that you sold) .
I wish I had drawn up the 2 charts in last nights report comparing GDX DEC 2014 to Now earlier ….but I honestly did the close up because of yesterdays comments. People weren’t seeing the similarity, even though I posted the bigger 1 yr chart showing how the dip in GDX back to lows was very similar to now.
I do believe we are continuing our 2nd daily cycle now.
In my defense (and this is provided to my biggest critic – ME! not to CF) – this took WAY too long. I mean gold hit the ICL a full two months. I originally charted the top of the 2nd DCL to be last week. Honestly, after the recent price action, I don’t know how anyone could have hit today’s move unless 1) they got in early and just waited it out or 2) they jumped pre-market or at open for a slight chase (that would have paid off). We were all getting jumpy and discouraged (read yesterday’s comment section) and then is when it took off. But we also had a couple of false starts. Anyway, lesson learned. Had to write this down to work it all out in my head.
Where are we with Cycles? Did the Dollar just start a new cycle, day 4? And GOLD is on Day 9?
Thats the way I see it, Bill.
Not to try and put a dampener on the rather nice move in gold so far today but I’ve just glanced at my daily chart where I plot a 150 day ema. This is currently around 1158. Just to mention that this ema has halted golds upward progress on numerous occassions in recent years. So it may get sticky around that level if nothing else. However in 3 of the last 4 IC’s the price did break well above the 150 ema and reached a trend line I have plotted from the peak in Aug 2013. Currently that TL is close to 1250. Just trying to keep a cool head and maintain perspective. But IF this is the 2nd daily cycle and we can eventually clear the 150 day ema I’m thinking 1245/1250 looks a very viable target.
Yes, the somewhat good news is that with the 150 EMA – just about every time it was broken in the past it was done by a 2nd daily cycle.
Look at Feb 2013 ( 2nd daily ) June 2013 ( 2nd daily) Last Januarys run (2nd daily cycle) Mini break in May of this yr was the top of the March ICL. We are in a 2nd daily cycle now …so the good news is…this is when we should do better than $1158 . Those past breks were often a lot better than the 150ema.
Thx Chris
My thoughts exactly Alex. 🙂 🙂 Hopefully patience will now be rewarded!! 🙂
Nice chart Chris
Thanks. Always pleased when others find your posts/comments useful. And there is a great melting pot of thoughts and comments on Alex’s site. A great mix of people here. 🙂
Check out ACI & BTU. ACI is currently back over the 50sma and its up a mere 56% (If it can hold).
it looks like the trend-lines are clear (GDXJ)
Whats that…Your Taylor Swift chart SOG? lol
its my new twerk analysis 🙂
Maria, wheres your wave update? 12345 still or ABC
that wont be clear until this leg completes… i will have to show you later.
is it abc… or does that long sexy leg of C turn into a 3?? then continue on with 4&5. … get it?
sorry no time now…
Last time GOLD was this highm NUGT was around $5
Exactly why I keep an eye on the GDX:GLD ratio.
Yes, that highlights the decay of the 3x in a sideways or down trend move
GDX is in the same condition. Just not performing vs gold.
Are you sure? Last time Gold was here was Sept 1 , GDX is where it was on Sept 1 also.
Or are you seeing it differently? I have GOLD $1152 GDX $14.08 – or further over at Aug 24
AUG 24…Miners definitely took a steeper dive
I’m comparing 8-20-15 to now. Both had Gold around 1150. GDX reached 16.05, Today we are at 14. Am I missing something?
nope – I was looking at Sept 1 (As I stated). My mistake. Maybe you missed that.
Well, GDX broke to new lows, Gold did a nice fib pullback. That does account for a lot.
did someone really just say twerk? lol …
yes Maria.. now you get back to twerk.. or have you got the day off?
ha ha ha ha… oooo so clever ;o)
no.. i wish.. annnd i will be stuck in an “academic assessment” strategy session from 1-4. uggg..stick forks in my eyes please….. and i cant even take my laptop and pretend im taking notes like i usually do… LMAO shhh .. becuz i sent it w/ my son to college. crap pies. :-/
crap indeed.
will you be “rolling out initiatives, going forward..” or some other management-speak buffoonery?
need to get yourself a new laptop.. maybe when the miners take-off
No way..not my style.
Lookn good …i like green..:-)
GDX BREAKING BACK ABOVE THE 50 SMA on stellar volume…. I’m liking the looks of EGO, BTG, SVLC, (GPL sweet consolidation that didnt drop much).
hopefully Cal won’t be needing to do any future yard work in his straw hat now 😀
Gold Charts then and now. Still on target. Showing the expected gold targets from 8-31-15 and now. Watch for that upper trend line (purple dashed line). Note the candles blue in the first chart, gold in the 2nd chart. Very similar to the previous icl
here’s an update on that weird GDXJ 4 year symmetry.
looks like its holding up so far.
target around $42 in 8 months??
That’d be sweet
$42 GDXJ? Now, THAT is something I can get behind!!
its hard to imagine thats where we were just over 1 yr ago.
you get so used to a price at the current level….
Heck, GDX was at $21 just this past spring. $13 to $21 – that would be crazy and that just gets you back to May! Shows you the ferocity of this bear market! 😛
Alex,
Does it worry you that miners are lagging in this move from where they were a few weeks ago to where they are now considering Gold is almost above its old highs? Thanks
Was referring to GDX or GDXJ
Not at this point. Gold did outperfrom Miners the past day or so, but
GDX:GLD remains above the SEPT 11 lows. It may not play rally mode and surpass former highs too.
GDX hitting resistance – sold October 14.50 calls against last tranch
NGD workn on that gap frenchie.. 😉
CRK….HHHMMMM?
Yeehawww
Clne ..cant c chart..went green
Alex….. I hope you will do tomorrow -or tonight- a small update how you see the market from here regarding the PM. Thanks for all your great help.
A couple of general comments – how about the reversal in crude and Nat Gas? UNG, at least, hit a new 52-week low shortly after 1030 inventories released before afternoon reversal. Not that 2.59 is awesome, but maybe selling pressure is exhausted for the short-term. BAS and REXX (broken charts) off 4-5% early closed at/near breakeven.
I stopped out of my SPY puts at breakeven. With DOW and friends storming back today, S&P down 5 out of 6 days, and Janet Yellen speech tonight, decided that now was not the correct time to press. Agree with what CF said earlier this week – yes, lots of downward pressure and think that we test the Aug lows, but hasn’t been an easy short and the increased volatility will likely continue to exacerbate that condition.
Should have chased. Next pullback!
hey Alex.. 100million volume in GDX..
I take it thats what you were hoping for