Mondays trading was a little like watching paint dry in the markets and Tuesdays wasn’t a whole lot better. You can bet that things will pick up at all when the Feds decision on interest rates is finally handed down on Thursday,and it’s almost here. Lets look at what we have so far.
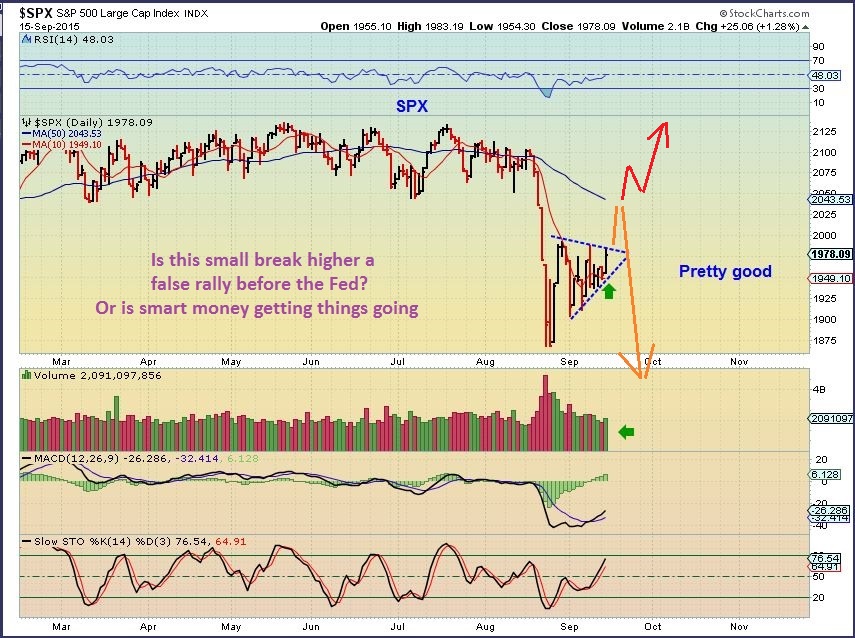
SPX – Tuesdays move gives it the look that it wants to break higher. If it does it may just back test of the break down.
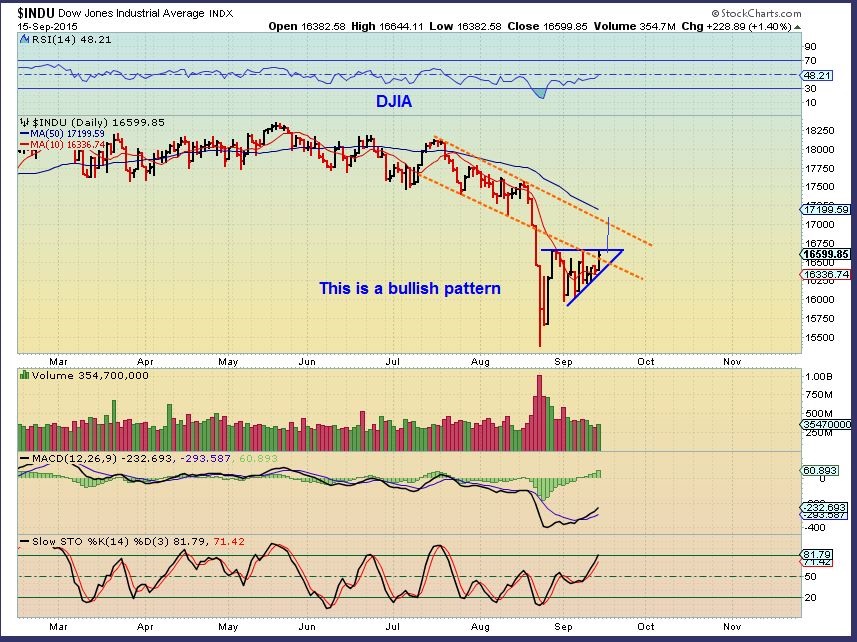
The DJIA has a more bullish looking pattern and re-entered its down channel
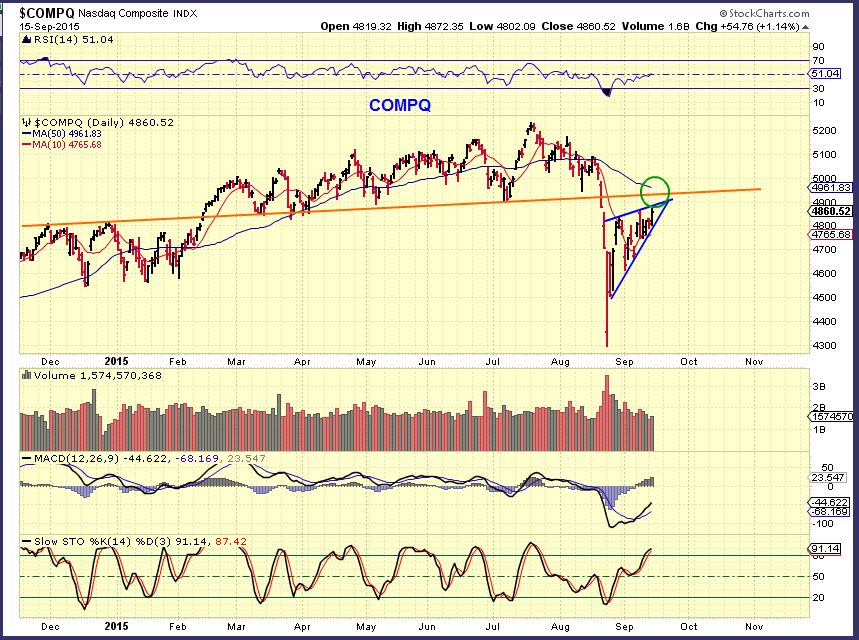
NASDAQ – High volume candles almost always get ‘tested’ , but the NASDAQ has pulled away fairly nicely. The green circle is resistance.
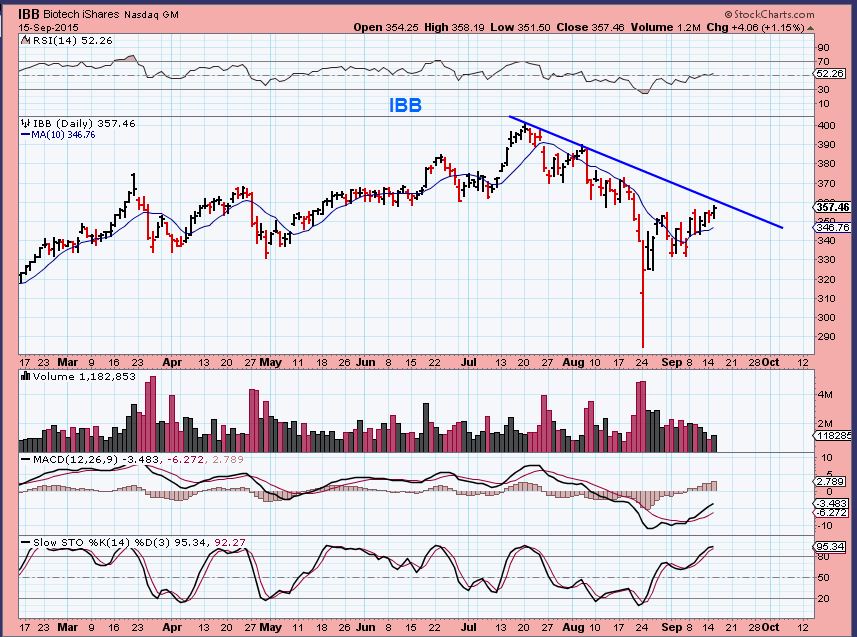
IBB – this not only looks a bit better than other sectors, but check out charts of ITEK, THLD, ONVO, ZIOP, IDRA, HLTH and others that you may follow. They actually look pretty good.
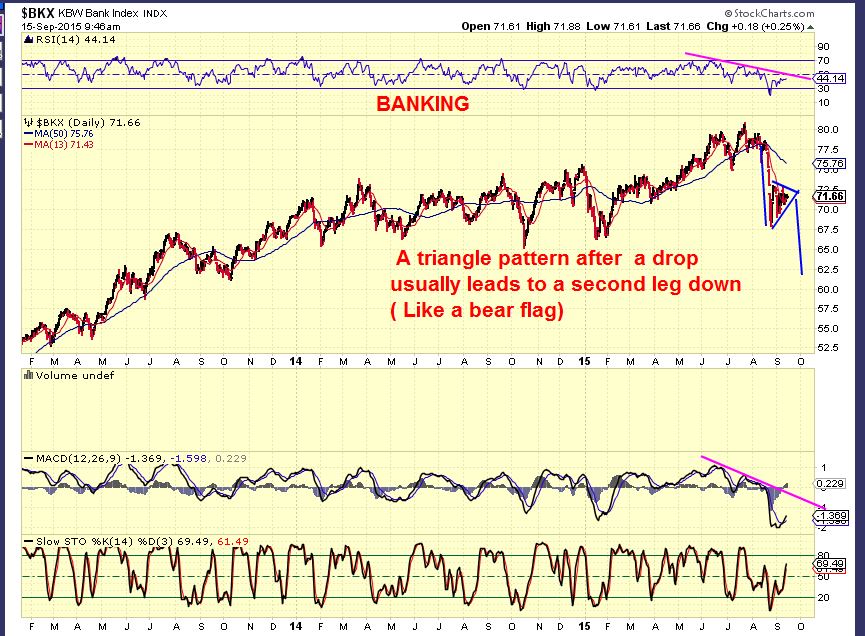
BKX – The Banking index still looks a bit concerning
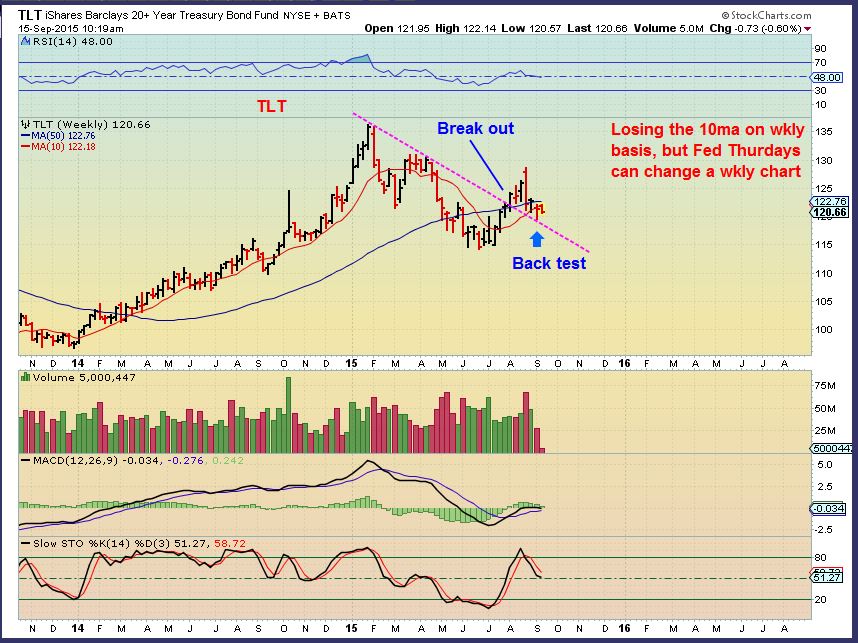
TLT – Looks like a break out and back test. It needs to move higher soon to keep from breaking down.
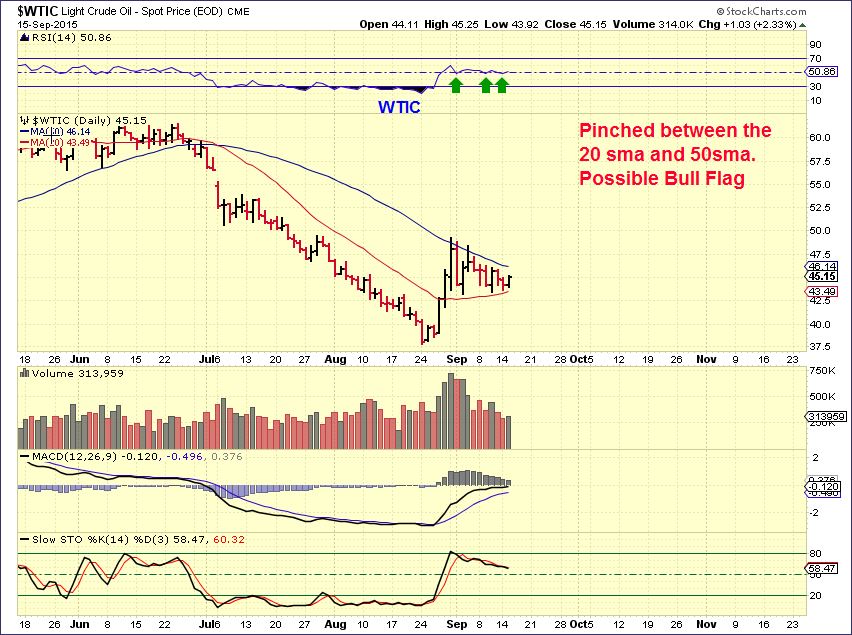
WTIC – No change, still looks bullish.
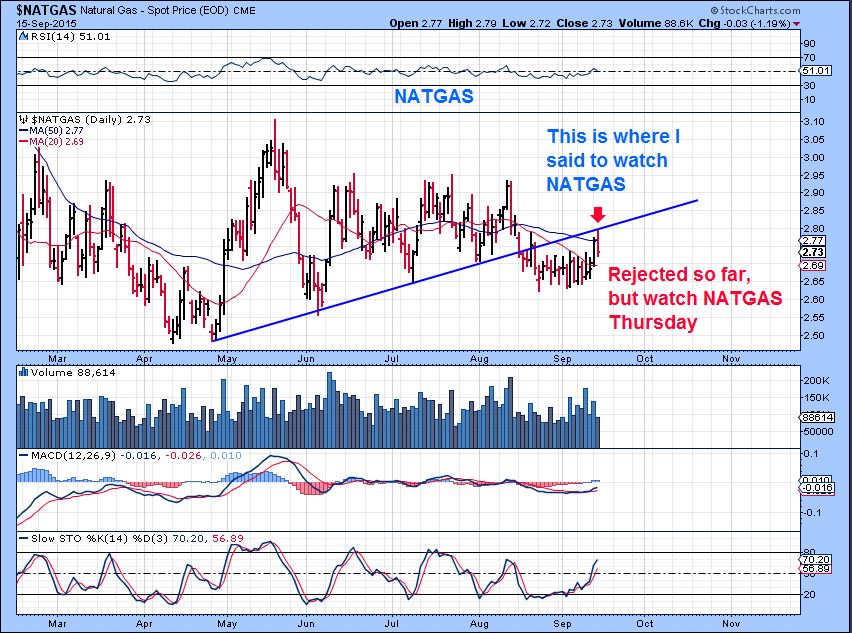
NATGAS
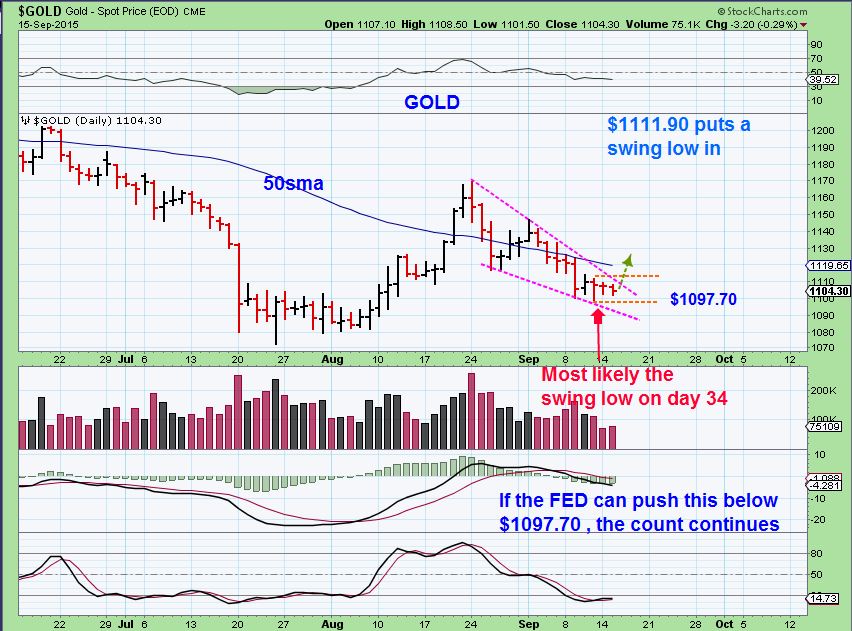
GOLD – Gold still doesn’t have a swing low in place, but it is very close. Friday was day 34 and the lowest point. I’m watching $1111.90 and $1097.70.
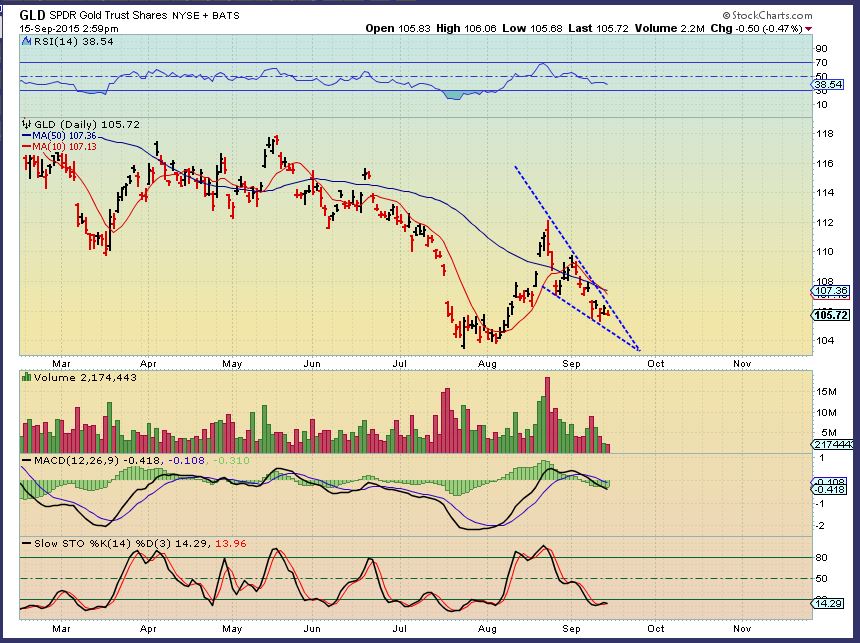
GLD – this looks like a bullish descending wedge.
I still think that unless you are day-trading at this point, it may just be best to be patient and wait for the Fed Decision to shake up the markets and give it direction. As mentioned, some Miners started to look bullish ( RIC, CDE , AG, etc ), but you and I know how the Fed Days trade.
Often on what is known as FED WEDNESDAY ( but it falls on Thursday this week for some reason) you will see a spike straight up, then a drop straight down. After lows are taken out & stops are run, price rises into the close . The next day can close in the red. All of the above can also occur in reverse. 🙁 Its frustrating at times and this Sept meeting is so highly anticipated that I have to wonder if it will be all that much more volatile?
I looked around Tuesday night just to try to find some bullish looking set ups. There are still some nice set ups out there. Two Bullish looking stock set ups that I noticed are Beer stocks. TAP & BUD and both are up pretty big in pre-market. Also many Bioteck stocks ( Some mentioned above) shaped up nicely. In the past I have mentioned LONG TERM POSITIONS in UA, NKE, FL, ULTA . Those are still good looking positions, even after getting rocked a bit . I am expecting a continuation of the drop in markets soon, based on current weekly charts of the indexes, so these may be in the process of double topping? Time will tell.
Tomorrow is the Big Day, there’s not much else for me to say.
~ALEX
FED- EX (pectations) 
 Fed Thursday! On Your Mark…GO?
Scroll to top

This mornings move in Gold puts a swing low in place for Gold.
It also moves GDX above the 10sma ( Not a close above, just a move above currently). Timing is perfect right? The day before the FED, just enough to make one too unsure to enter a position. UGH. 🙂
Exactly. Somehow I just knew this would happen.
SO – DID – I-!!
This weekend I honestly, in the back of my mind said , ” The timing for a low in cycles is here. If we go sideways into the Fed day and Pop just before it….who will want to buy AND HOLD through the fed day?”
And here we are. Ta Da!
And miners are popping after a classic shakeout under 13, again. Aagh
sorry – i had to read this 3x..slow this morning.. do u mean price will pop and take off — leaving ppl behind?
Yes – leave people behind because of 2 reasosn
1. The Fed day is always volatile
2. We are talking about MINERS …no one trusts them anyways 🙂
k..tx
or they will make it LOOK like a BO failure…. w/ big selloff.. right?
B#*&s*rds
could be, but the lows should hold. In other words, the lows should be in, but there could still be some strong shaking in all directions with the Fed activity. There usually is.
Alex,
Above you said, ”
GOLD – Gold still doesn’t have a swing low in place, but it is very close. Friday was day 34 and the lowest point. I’m watching $1111.90 and $1097.70.”
I see it being lower on the 9th at 1101. You don’t count spikes?
Sorry Bill, I dont understand.
I said the low was $1097.70. You are asking if a spike to 1101 is lower?
Mind fart, I didn’t even see the 1097?
We’re all “tired’ of waiting for this stupid Fed day flux 🙂
I’ll 2nd that!! 🙂
Don’t worry Bill. Mine yesterday was much louder!! Lol
no comment
lol
Nor me!!! Lol I hope you realize you kept me up until almost 1.00am this morning my time!! By then I’d been at my screens for around 17 hours!! But haven’t laughed so much in ages! 🙂 😉
lol.. sorry?
Not at all. 🙂 The laughs I got were well worth it!! 🙂 🙂
It’s that the 2nd time we’ve discussed that this week? 😛
Alex,
“Often on what is known as FED WEDNESDAY ( but it falls on Thursday this week for some reason) you will see a spike straight up, then a drop straight down. After lows are taken out & stops are run, price rises into the close . The next day can close in the red.”
We might need some had holding with this?
My hands are always clenched 🙂
whoa look at GDXJ go.. not just launched above the daily 10sMA , but 20eMA too.
could end up above the 50sMA (currently $20.12) by close… but would you buy there, or wait for a pullback?
this is updated GDXJ channel chart from last week (or thereabouts).
looking a whole lot healthier..
To add to Alex’s ‘bullish look on oil’ in his comments , starting to look like we may finally be breaking out of that wave 2 or B consolidation phase and starting another leg up. We held beautifully on the 50% retracement level. If so I would expect it to stay above the 200 period ema at worst now on this 1 hour chart and 80 period ema at best. Both currently just below 45.0 but starting to turn up. Maybe…just maybe the start of some action again!?
Sooo, is this the start of a new DC which would indicate at least a few days of higher highs, or is this a FED FAKE and we get a slam back down? Guess?
The volume today is very real in GDX. Start of the 2nd daily cycle higher. I would think that a FED SLAM ( If there was one) would not break the lows now, it may just be an intraday event.
So the question will be, take a nibble today if it closes strongly (i.e. over the 10 DMA) and hope for a downward reaction tomorrow to take a bigger stake? Or wait for tomorrow’s reaction. I’m conflicted here, personally. And yes, this last couple of months has made me very trigger shy. 🙂
I have a position that I bought to ride into the Fed day. Now I may just hold if we an get some space between the lows and future price.
We USUALLY have a mid day pullback that scares some out. I add at that point too, usually. Right around Noon Eastern a dip occurs if this is like many other bursts higher.
You expect the dip Today or Tomorrow?
We usually get one at noon on a strong upday from the open ( that would be today), but with the Fed tomorrow… I cant picture not getting something crazy tomorrow. Could be a rough ride, but I do think the lows are in place.
I hadn’t noticed the pullbacks at noon, nice catch. I agree with the lows in place……..for now. We need to break the lower highs cycle. 🙂
Exactly….then we can relax and trade these things like clock work!
GDX WITH 6.5 MILLION VOLUME IN THE FIRST 1/2 HR IS A REAL MOVE IN MY EXPERIENCE.
WE USUALLY END THE DAY WITH OVER 70 MILLION ON DAYS LIKE THIS, SOMETIMES 100 MILLION . LOOK AT A GDX CHART AND ADD 70+ MILLION
REFRESH
Alex,
I just looked and the volume after 1 hour is just 6 million according to Yahoo, what other sources do you use?
Well, my chart above shows 4 million at that point (delayed) . I used my broker to see 6.5 million before 10 easten time. Stockcharts volume is delayed. If you have a trading account, look up GDX and the volume should be there.
I have 11.2 million at 10:38 a.m. Eastern time.
If the stock market doesn’t shake you out it will wait you out. I got waited!
http://tos.mx/707tD4
This is 1-hour Silver
1min & 5min indicators suggest silver MIGHT pause or pull back from trend line resistance to give a chance to jump on board
I can’t get the TOS charts? Can you post screen shots?
TOS is a real pain that way – supposed to be able to click on link and then click on chart. Unfortunately, my computer doesn’t do a screen shot on TOS or I just don’t know how – Sorry, Bill!
Is anyone else in FCG? It doesn’t seem to follow natural gas OR the stock market. The charts look great, but if it doesn’t start making sense to me, I’ll need to exit
FCG is an old friend.
It behaves with oil more than Nat Gas.
Main holdings (refresh)
Thanks for that, LeChiffre, I’m new to FCG – decided to use it as a play on NG since UNG is one of the worst tracking ETFs out there! Now I know better what to expect
GOLD CURRENTLY (REFRESH)
Just an interesting point : I dont think I can remember seeing NUGT & JNUG almost exactly up the same % all morning. Usually JNUG is up a bit more % -wise, but this morning they were both up 4%, then 5% then 8% now 12.5% .
Are we on day 1 of the miners cycle?
The low was actually Friday. We would be on day 3 ( Same for GOLD).
Beautiful move today.
NGD (my fav), and EXK are doing well.
See EXK gorgeous chart (refresh)
nice…. SAND is gettin it done as well .. ;o)
MUX , VGZ are very good – check out that shake out on VGZ.
giggle… u no i own mux as well.. and yes dq .. ha!
PVG broke out
(refresh)
@disqus_brXtHPogSz:disqus
because Summer is not over just yet. (in San Diego at least)
and to honor our African gold mines.
https://www.youtube.com/watch?v=RYk670bY2-s
niceeee … i am really enjoying this..speakn 2my soul… thank u… :o)
… even if i dont understand the lyrics..
music is universal………
Beautiful voice, Summertime!
EGO looks it wants to go. (just took a position)
(refresh)
My thoughts on GOLD. using Harmonics patterns and the upper trend line it looks like an upside target of 1166. Using the gold candles (from a previous ICL) which we are following pretty close, we should see a high of 1133 then a pullback to 1113. That would be a good spot to buy. IF, we keep following the previous trajectory. Its not identical, but close. The 1133 is also the 50% retrace of the previous drop BC. Hope that helps.
Thanks for sharing, Bill. Volatility tomorrow might provide an entry, pending the actual message. I appreciate the targets – I had pretty much scrapped all my work when the DCL didn’t pan out as I had originally envisioned.
Very good Bill. Thank-you for your input, so as many times.
I actually have higher price targets, I’ll put in in the reports since there is plenty of time for that.
Hey Alex, I am hoping for higher targets as well. You can see my point “D” above which is around 1200. I am being cautious at this point. 1166 should be resistance being the upper trend line. Fingers crossed. I’m looking back at 3-17-15 and 5-12-15 as being similar big day one moves to compare trajectory. 2nd cycle should move higher than ICL correct?
Hey Bill,
True, March was a weak cycle for sure, but look back at Nov to Dec as a first dsily cycle like now…then look at the 2nd one Dec to Jan. We could see that .
Thanks Alex.
when it’s time (maybe now) SBGL will rock your socks off.
currently flirting with its 50MA.
(refresh)
oh my UWTI…
Oh my GASL 🙂
oh my EOX
Oh my AREX!!
XCO
and our friend WG (grinding up slowly now). still holding it. (sold 1/2 at $1.7 area)
And WRES. I sold PACD last week…right where it is now – LOL
lions and tigers and bears.. oh my!!
i want to own that xco .. darnit… when my alarm ringalingchings.. cant take the trade.. grrrrrrrrrrrrrrr
Moving out of the lows is when trading is fun again. Some great %-Gains – but that FED thing is a bit intrusive
indeed… and this is where u shine CF.. xo
When Gold & OIL are in an uptrend, and the stocks start tracking that way….THAT is my joy. They can be traded like pistons in a fine tuned engine. Some are going up while others are pulling back and they can be traded very predictably.
mmmmhmm… speakn my language CF
I can only dream we get there before too long….one day…
i think… cough cough.. im feeling cough sick.. cough..i may have to take a sick day 2moro.. cough cough…;)
You could at least leave early, but last Fed Mtg they released the news early (noon). I was outside when they did. Leave at 11.
ok.. perfect. i JUST made a dental apt..
ha!
Better call it a root canal! Your dentist is the Fed!
no way jay….. not gonna happen (she says w/ her backpack stuffed w/ CFland and her eyes to the heavens..)
oh my REXX calls…
EGI making a move on the outside
That is a great weekly chart ( 4 yr wkly for example)
BAA (been buying from the .3 to .2 ) may be ready to launch (finally…)
I’ve been watching it. My original purchase was in this area and I bought & sold on the way up & down.
I was looking at it thinking I see a very tight consolidation and a bit of a triangle? Wedge? something.
Bought some,more of it today. Already have a pretty big position. Slightly in the red but not bad. I think it will move nicely in this cycle.
EOX .. what a chart!
want to buy more (but not today?!>!)
(refresh)
I haven’t seen anyone mention coal, but BTU has a low-risk entry if you’re interested in the dirty industry
You could be right. Its on the 50sma. Stop right below ( loose)
Sand above the 50sma now with nice volume .
So many good potentials in the Miners and Energy sector
True. Wish I had a little more exposure now, but having waiting out Fed mtg this long not going to chase 1 day prior. Great update today, thanks!
IT IS 11:43 a.m. eastern – Close enough.
Look at GDX on a 5 minute chart and the MACD is losing momentum/ This is where the drop & sideways move usually comes in
wow. you were right on the money. 🙂
c’mon down … thatttta girl… 😉
Even though it dropped and recovered, I think it’s going to drop again, until the MACD can straighten out & cross back up ( 5 minute chart) .
IF it only drops the same amt as last time ($13.70. I expected $13.60 at least) , it could just become a sideways move until the MACD crosses up and means that this may be a stronger surge than some of the others that I have watched.
a touch and go of its VWAP would work…
(refresh)
. EW i have the same target for this wave..whats up in the air .. will it be a 3 wave or 5 wave correction? or even longer double/triple complex combo…
Alex,
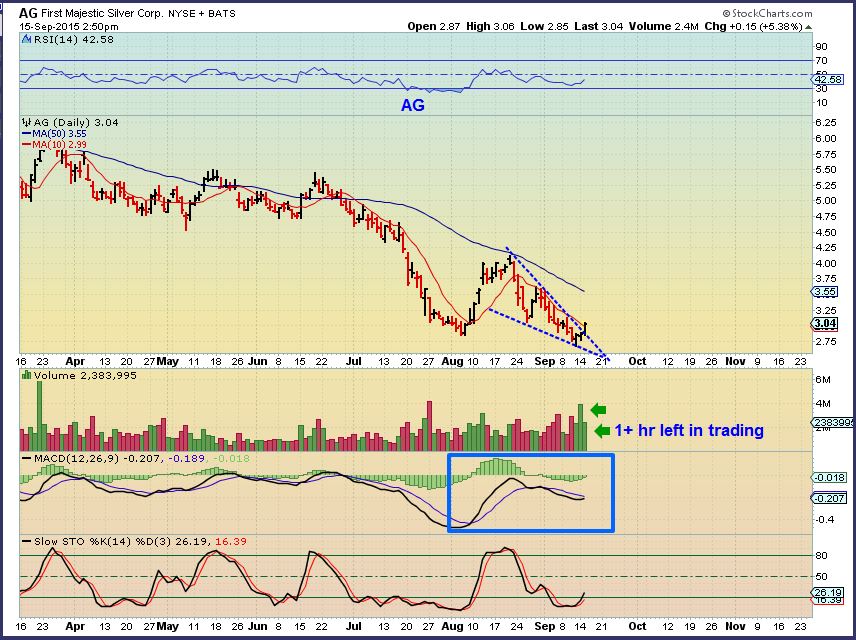
AG is lagging it’s peers…any thoughts?
Thx
That baffles me based on what I had heard about the company. I heard that they weren’t selling all of their mined silver, They were storing it because they want to sell it when price is higher. To me…that may show on their balance sheet as lower profit / revenue now , but it will really pay off in the future.
I heard that this spring and dont know if that’s still the case, but I like the company a lot & thought that that was good news.
Whats the next stop for OIL Alex ( on this way up)-TIA.!
Near 54 -55 looks likely for a pause , but I think that it can go much higher if it gets going in a 1-2-3-4-5 type move.
Alex, is that near-term (as in 2 weeks or less)? That would be a pretty awesome run, actually. I’d be pretty darn happy with 52 for right now.
I have USO calls, some near-dated. Selling out of close in ones (about 1/3 of total position) based on both today’s pop and Fed tomorrow. Holding the rest in case the move you outlined in reports this week takes hold. 🙂
Hey Cason, I think the move could be that quick, as long as we dont get some game changer from the Fed.
Right, yeah I pulled some out today as planned thanks to the big move and Fed. Have time for rest to develop if oil rises next week.
The MID DAY pullback for GDX could form an Inverse H&S (Refresh)
edit: Woops, thats a 3 minute chart
soo… u think it gaps up in am to complete wave 1 .. maybe 15ish?? then they slam it back down to 13.80ish for wave 2 ….
after fed announcement? get everyone out for rocket launch wave 3….
That works for me…or it may just run higher, go sideways to down a little (2) and then run higher from there. That would leave more behind.
how?
Some didnt buy today due to the Fed. Even in a sideways to slightly down day or two , They wont buy tomorrow due to the Fed, or Friday going into the weekend. Then it goes higher and they ‘wont chase it’.
Just 1 of 1000 scenarios I guess 🙂
ahhh… nice….
thx
hava great nite all……….. may visions of sugarplums dance in your head..
wait.. wrong ……oh nevermind.. ;o)
Oddly enough I still have another kind of vision in my head!! 😉 Lol Enjoy the rest of your day…mine’s nearly over. No 17 hour stint for me today!! 😉
if i was a buyer on the daily close chart.. i would buy.
above the 10/20sMAs
the momentum indicators have opened up
my relevant MAs have crossed.
big volume.
you can be too overly cautious, can’t you
GDX – 78 million volume WOOP WOOP
They managed to get most of my order done then!! Lol
They only show 60 mil on STOCKCHARTS, but my broker now shows 81 million. They must still be processing your orders 🙂
(Its probably 60+ million)
That’s good news. Lol If only!!…:-)
81+ millions shares traded. Healthy.
Ratio is also very healthy.
(refresh)
Alas, putting in the DCL took to long for the options I chose to trade a month ago. 🙁
Ok, now I am REALLY sad I lost my JNUG yesterday.:( 🙁 🙁
Stops still tough for me. With market jittery I kept it close to minimize losses. Which I did, but also ensured them! If I had kept below recent lows, would have caught today’s move (and likely exited) but if we had a crash below the lows I am sure I would have been upset that my stop was “unacceptably low”. Ugh.