
On The Right Track?
I wanted to post a picture of something where glue was just melting and everything was becoming unglued, because Wednesday morning I saw quite a bit of Green on my screen and by the close things become a little unglued. So it raises the question, “Are things still on the right track?” Lets look at the charts.
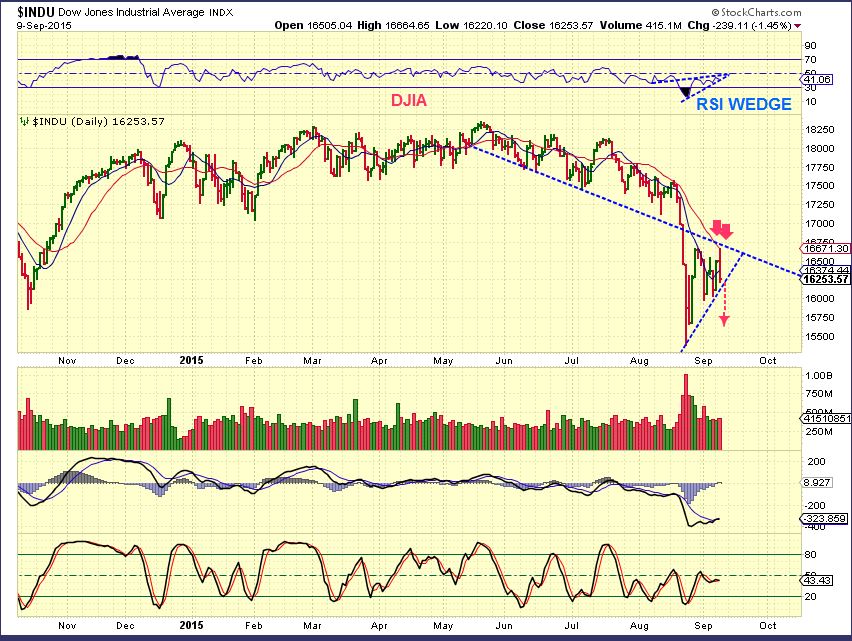
DJIA – Wednesdays rally hit the 20sma and back tested that down trend line, and then promptly gave it up. I actually think this type of action could lead to a nice post Fed rally next week. For now it is difficult to trade.
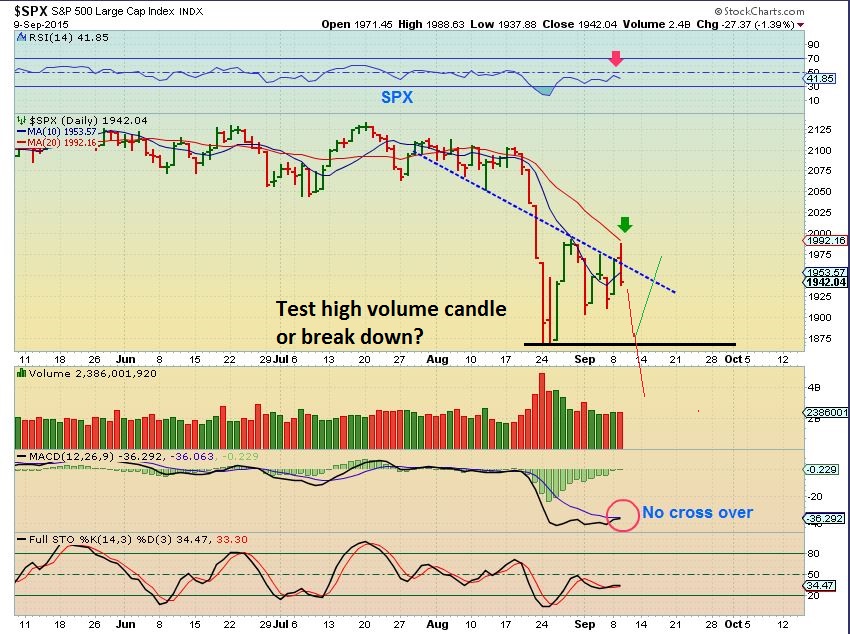
SPX – The SPX also hit that 20sma and after regaining the 10sma and downtrend line, it headed lower closing below both. We could test that high volume candle at the lows with a higher low, or possibly drop down and do a stop run. The markets may be shaking off the longs and preparing for a rally Post Fed Wed next week.
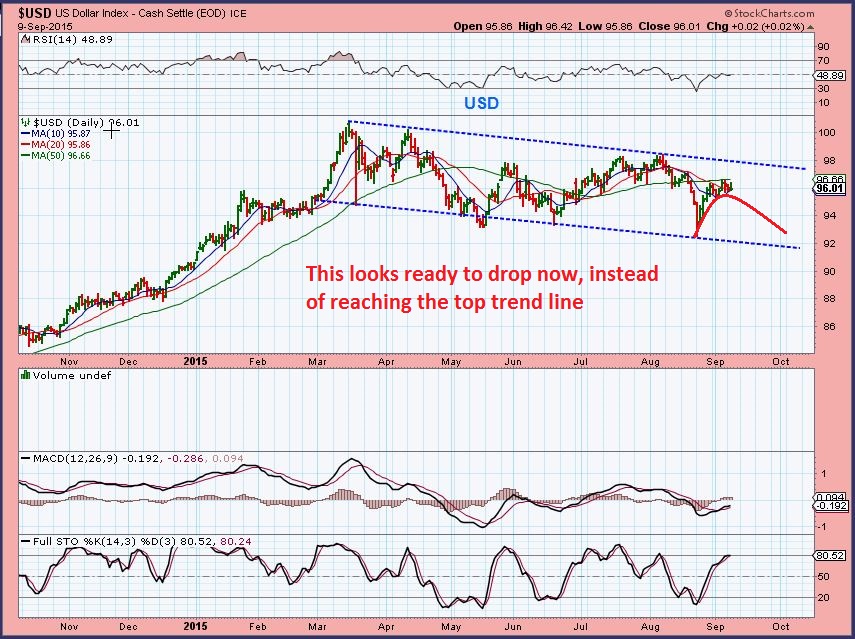
USD – I still see the weakness and I feel that the dollar might just roll over.
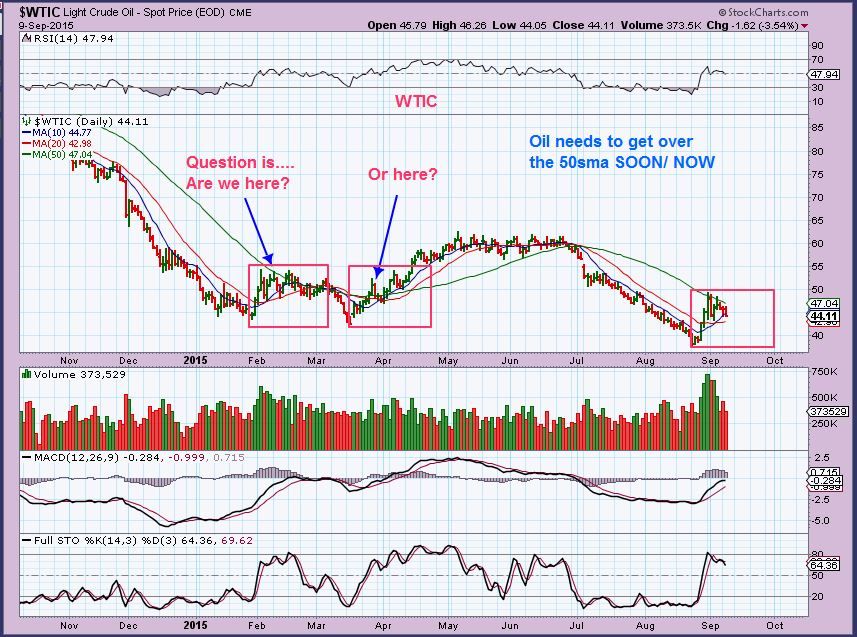
$WTIC – Oil was acting very well, and it still looks ok in the MACD, RSI area. I dont like that it lost the 10sma so early in its daily cycle and is still capped by the 50 sma. It may be nothing, but obviously in these markets we want to monitor closely. Many of the good looking energy stocks also started to fall back. I bought PACD Wednesday and I am in the red.
JAN had oil move 3 strong days up to the 50sma, and then sideways for a month. ( Hmmm).
GOLD,SILVER, & MINERS
Let me start by saying that todays drop in Gold concerned many. I actually had to leave for the day at noon Eastern, so when I returned after the close I was pretty surprised to see that the markets had reversed, Oil had dropped below the 10sma, and Gold was down around $20 and recovered to down about $15. I have mixed feelings about things for several reasons, but at this point I am just going to discuss the facts.
FACT 1 – This chart was from my weekend report. The drop was not entirely unexpected using technical analysis. I didnt show traditional H&S projection from the neck line, I did a simple A-B-C-D from the head to neck, shoulder to $1095. Measured form the neck line the drop would be deeper ($1070 area again).
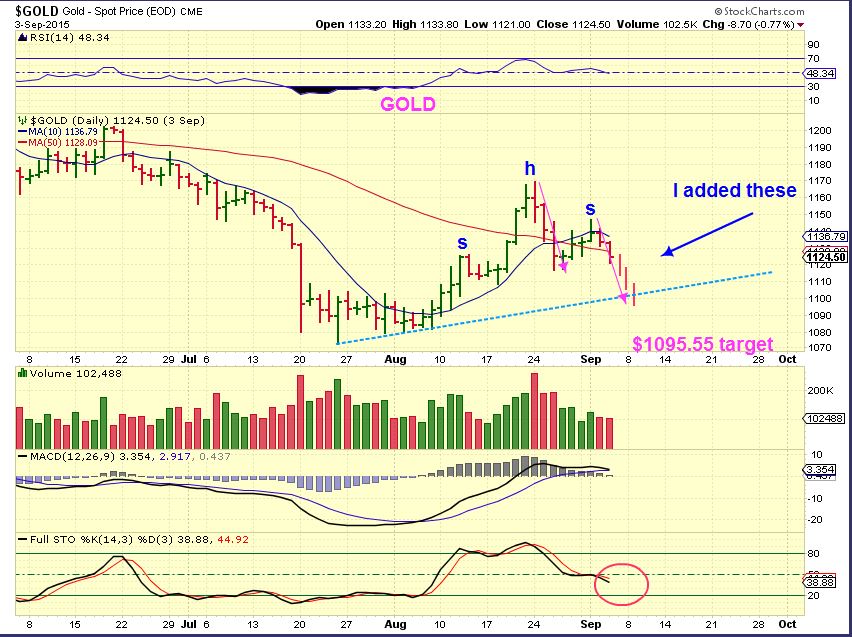
FACT 2 – From the weekend report, cycle timing allowed time to drop & run the stops. Notice my blue writing in the left corner.
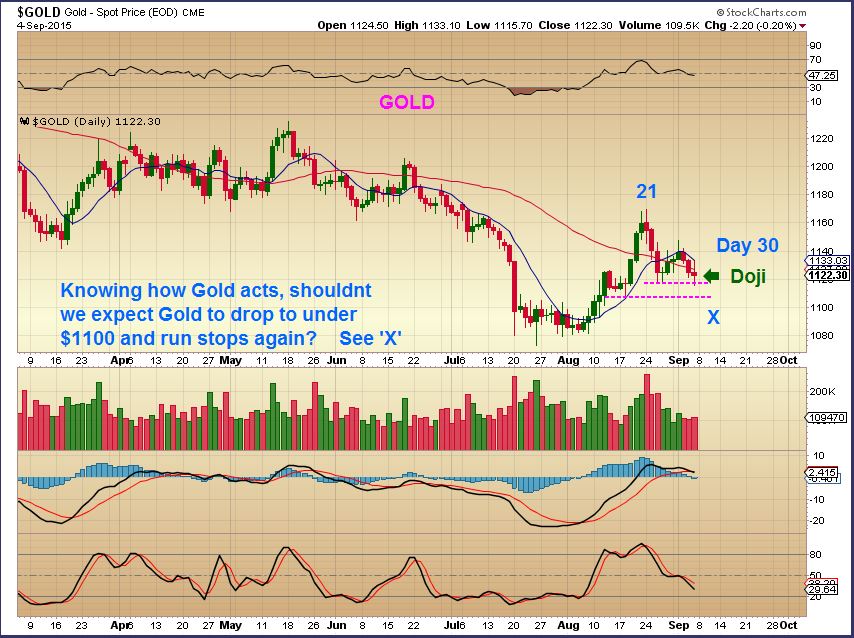
GOLD TODAY – looks exactly like the chart above. SO I cant say that this was a total mind blower that came out of nowhere, but I do have concerns. I looked back at all of the recent ICLs and after the initial surge higher, none had pulled back as deeply as this one already has. Most went to a 61.8% retrace max in the 1st daily cycle. This is deeper already.
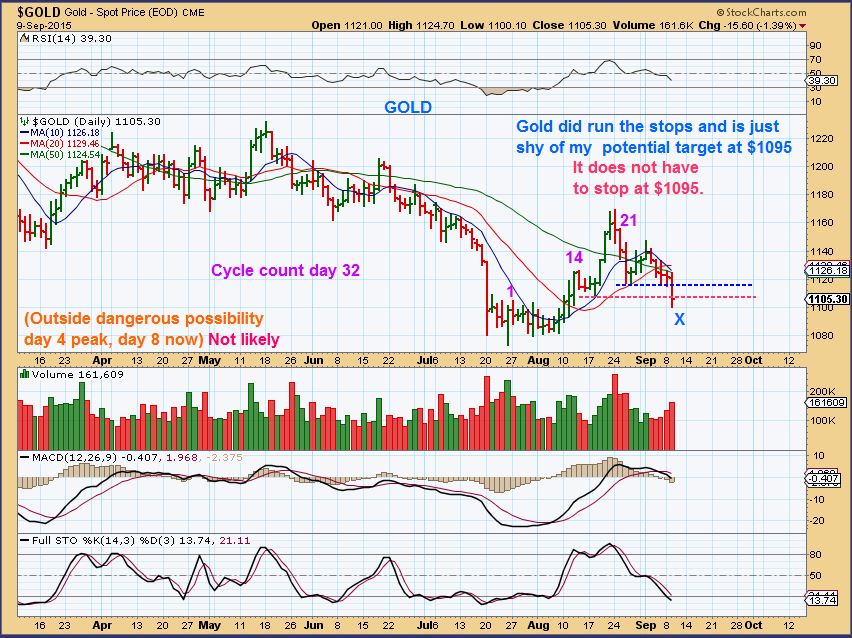
That said, I need to see this reverse and close higher on a weekly basis. We need a weekly reversal candle Friday . Cycle wise, we are LATE in the timing for a daily cycle low and we should move higher soon. I did write an unlikely thought on the chart about a possible DCL. The ICL was right translated, so we should make new highs in the 2nd daily cycle , that is why it is unlikely that we are rolling over in the 2nd daily cycle here and now, but I wanted to mention it. I own a position in JNUG and am now slightly in the red.
.
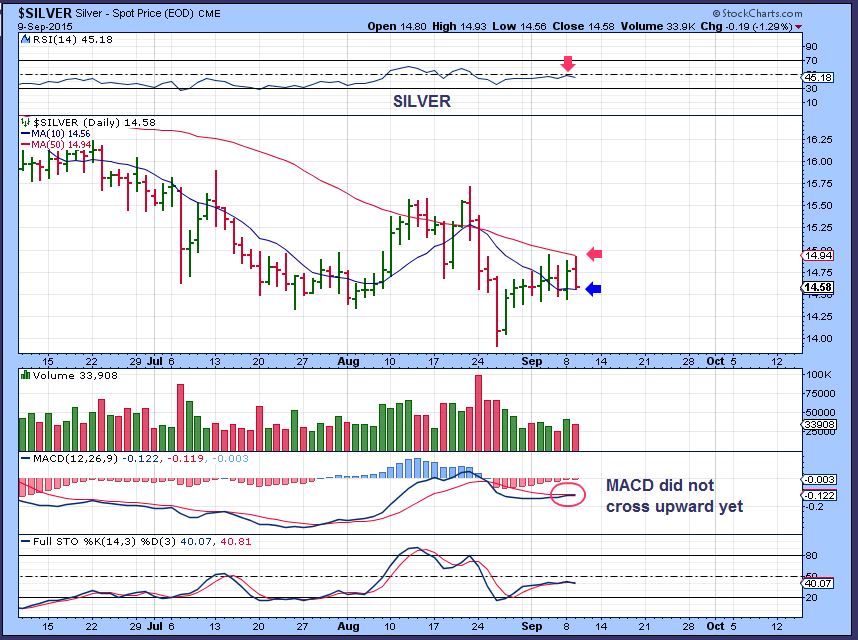
SILVER – Silver doesn’t look too bad, but it needs to move higher a.s.a.p. It shows signs of weakening.
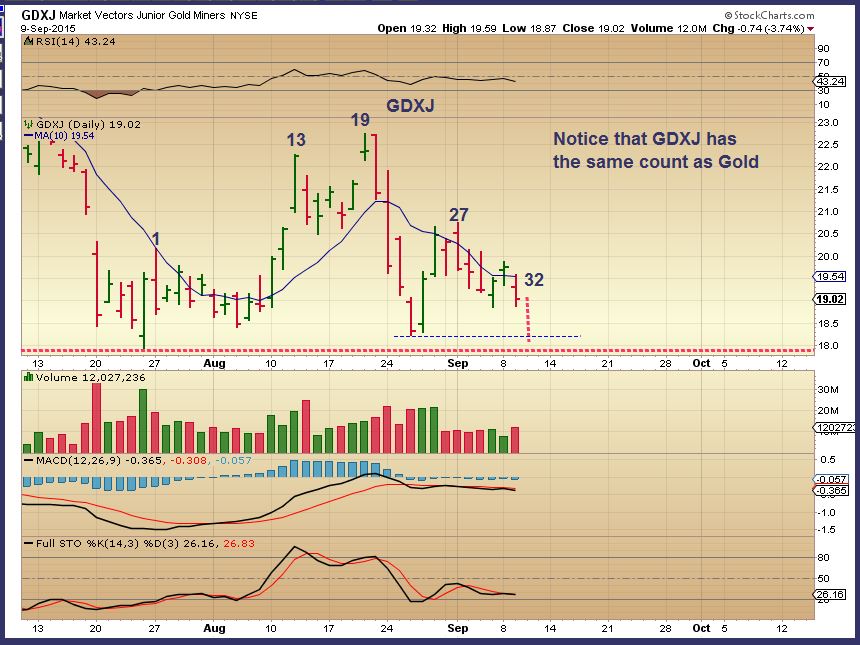
GDXJ – Notice that GDXJ never broke to new lows like GDX did, so the GDXJ cycle count could be the same as Gold. GDXJ could start a new cycle with Day 1 matching Golds day 1
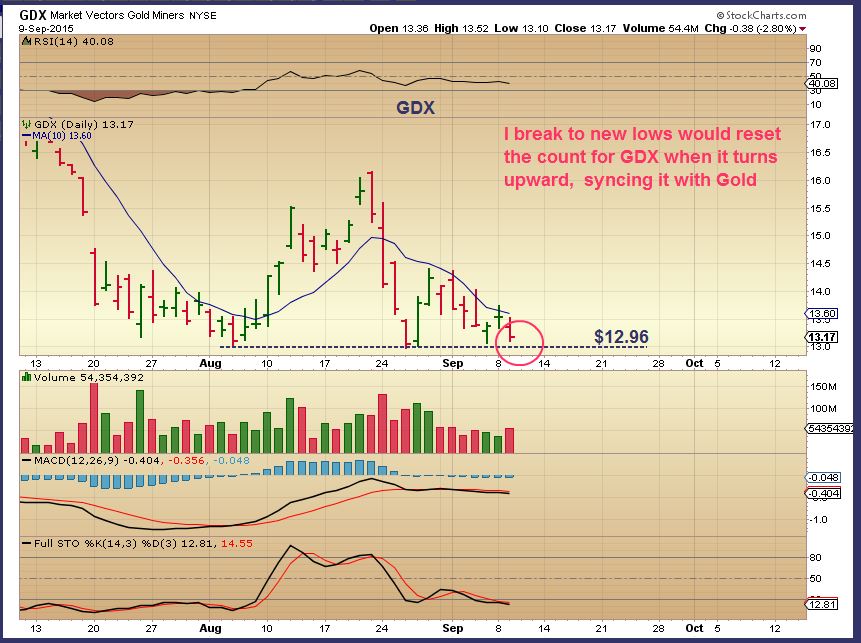
GDX– We know that GDX broke to new lows, but if it does that again now and then reverses higher, it would also finally be in sync with Golds cycle count. It would start day 1 along with GOLD and GDXJ. At this point, I am just using Golds count.
SO how do I wrap this up? Are we still on Track? Basically we are, but there are signs of a little extra sliding going on. We have to admit that we are in a tricky time for the markets as a whole with this volatility. I believe and have stated that I think the Markets are in a topping process and commodities could benefit from that. The CRB, OIL, and Precious Metals had solid looking lows put in on weekly charts recently. I took positions based on prior ICLs and bottoming that took place in the past in these areas, the timing appeared right. Wednesday was a bit more volatile than I expected, so we need to honor our stops if we face the unexpected until the dust settles.
Frustrating? Absolutely. So many ‘set ups’ were proper and though they may still play out properly, the volatility that we are experiencing is causing a jittery reaction.
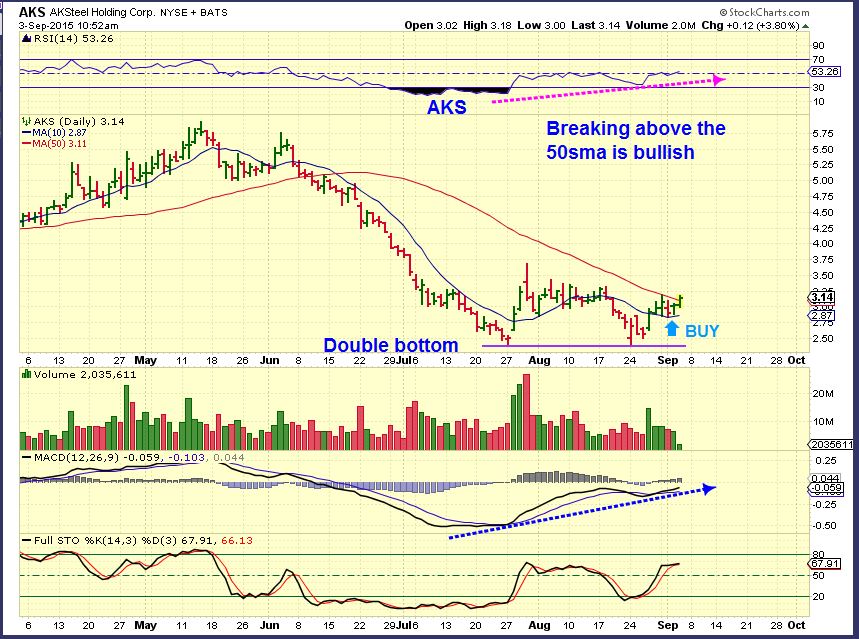
Look at AKS for example. Before & After.
AKS – Double bottom, breaking above the 50sma and the RSI is breaking higher. Looks great.
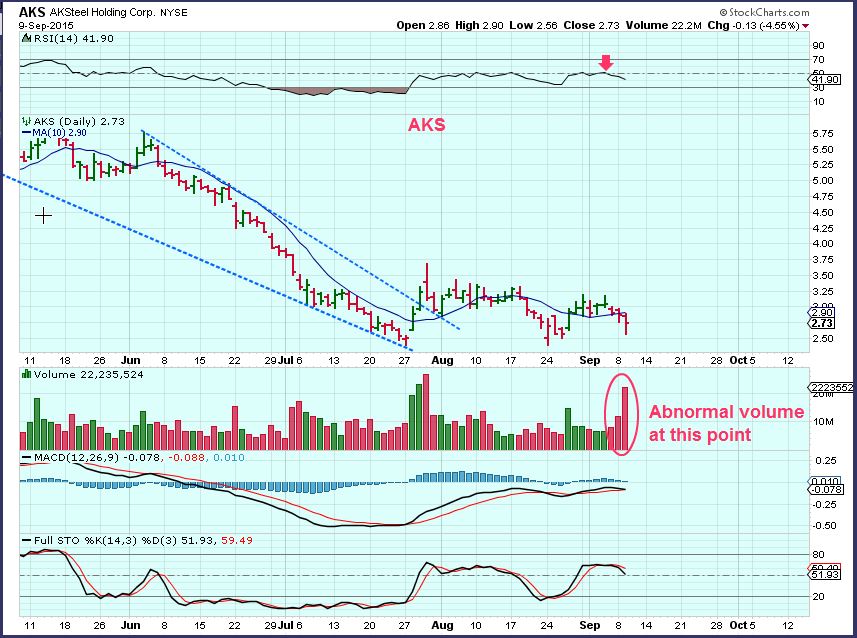
AKS – Market sell off dragged AKS down below the 10sma too, with very big volume. There was some buying in the end so we have a reversal candle, but it causes jittery trading.
Lets stay alert, the short term volatility can be tough. Step aside if you are unsure or uncomfortable. Jump back in when the 10 or 50 sma is regained. We have the BIG FED MEETING next week, and that could also affect many things. I actually thought we would see Gold run up heading into the meeting, and then we’d sell off after Wednesday. Now we have a trickier set up that needs attention. Its always tough to catch a bottom, but this isn’t even about catching a bottom, we were above the 10sma and some Energy stocks regained their 50sma and gave them up today. Stay alert and honor stops, step aside if you want to wait until there is more clarity. A swing low in Gold & Miners today or Friday this late in cycle timing will be a welcome sight! Best to all.


Alex, all, what will happen to GOLD if the FED raises rates? Opinions?
You’ve asked that several times , but never say what you think.
Bill, what will happen if the Fed raises rates ? 🙂
I think I got answers pointing in both directions, plus I have short term memory loss! That is the only reason I can keep trading PMs.
I hear both too, but I mostly hear people say that a rate hike would kill gold.
I happen to remember back in the early to mid 2000’s when interest rates occurred and Gold continued higher. 2004 had rate hikes, Gold went higher.
Does anyone else here remember when the FED would come out at 10:30 a.m. and do a ‘surprise rate hike’. No one saw it coming, but right in the middle of the trading day, they would announce it. CRAZY STUFF back then. No transparency at that time.
I bet they are not going to do it anymore!
Bill keeps asking b/c Bill wants to keep at least some of Bill’s money come next Wednesday…. 😛
Bill, so not the expert here but I have done a lot of reading.
The opinion of the unwashed masses and the ST crowd is clearly that rising rates are bad for gold. You can now earn interest with saving. Gold earns no interest so it is bad and you must get rid of it immediately. I imagine a rate increase will be very bad INITIALLY b/c people will over-react. Gold is a sentiment trade and sentiment will worsen. quickly.
However, I have read a couple of articles on Seeking Alpha that looked back historically since the 70’s to show that gold has in fact risen along with rates the last few times. They had all of the evidence to back up (that I have not memorized). The other thought, back to your inflation bit, is that if inflation rises FASTER than rates, you still set up a negative real rate across the economy. Gold at 0% is better than, say -1.5% (.5 fed rate -2% inflation); gold goes up. We haven’t seen that scenario set up and the word is that it cannot happen with oil in the crapper. We’ll just have to see, I guess.
Solid and non-emotional comments Alex. Just what is required right now. There appear to be so many cross currents at the present time it is unbelievably tricky to read things in the shorter term. And based on comments, some of us are getting a bit ‘chewed up’ to say the least! It is very difficult if not impossible under those circumstances to stay emotionally detached and ensure we make rational decisions. As you so rightly say…honour stops….an absolute MUST…and stepping aside until we get more clarity may be a good idea for at least some of us. It might require ‘licking some wounds’ in the near term but at least we ‘live to fight another day’ and hopefully a bit more clarity isn’t too far away!!
Well said also. Especially where you said , “…tricky to read things in the short term’ .
Sometimes you can have the big picture correct, like ” I think we get a strong rally after the Fed Meeting next week”, but in the meantime , chop chop chop on a day to day basis is chewing people up in the equity markets.
Of course, Leverage in any way compounds that emotionally unsettling part.
As you say Alex, leveage right now can just compound the problems! And I cannot remember the last time I saw such huge daily swings on the US indices, day after day and with much of it happening in overnight futures resulting in huge opening gaps when the cash markets open. I watched the Dow futures hit 16,460 a few hours ago and now at 16,190 and the cash markets have yet to open!! Just another typical day so far!!
Yeah quite the overnight futures session! /ES ran up a steep 30 pts and then dumped 35 pts straight down. Not for the faint of heart.
Definitely not OFT!!
Whats the chance we started a new cycle Yesterday in Gold? The last cycle ending at 36 days. Refresh for chart.
Your cycle count is not taken from the low on Aug 26th? I do not see a lower low on any other gold chart that I look at. I have gold on day 33 today.
Actually, 1 other chart I use for gold does have a low earlier. Must have been an overnight print?
I have a low of 1071 on 7-20-15 and a low of 1117 on 8-26. Are you starting a new cycle on 8-26? Do you count non trading days in your cycle?
I do not count non-trading days. Only the days shown on the charts.
Well actually gold trades continuously so there are no non-trading days like the miners. Right?
It doesn’t trade on Saturday, it closes from Friday to Sunday night actually.
Bill, I have yesterday (pending confirmation) as the probable low. Unless, of course we dump $20 at the NY open tomorrow. I had some chart as you describe, fwiw
I’ve heard a lot of talk lately (not necessarily here) about the bear market in GOLD being done. I don’t see anything on the chart to support that. Anyone else have an opinion on that?
Although for various reasons I would be in the camp that believes the bear market in gold is done, I would also have to say that from a purely technical viewpoint we continue to make lower tops and lower bottoms, which if I’m not mistaken is your basic definition of a down trend!! And on my read, until we get back above 1170 at a minimum that will remain the case. Of course, if we have just made a low around 1100, then you would have the first glimmer that we may have just formed a higher low but would now need a higher high above 1170 to put the next piece in place and suggest a more important low has just formed. But just my opinion.
Yes, anything else is pure speculation (and wishful thinking, more likely), which the world is rife with, of course.
I see 1101 Yesterday, thinking we get up to 1167 in 14 trading days. Just SWAG on my part. Then another beat down. So still a downtrend
I have a down trend from the Jan and May peaks currently around 1154. So back to 1167 would either be a false break/bull trap or a further hint a major low is gradually taking hold. But of course we would then need to see where the next low forms. So 1167, if reached might be a nice place to take some temporary profits and wait to see where the following low develops. One thing is for sure, as keen as we all might be trying to catch the lows, if/when a new bull cycle begins there will likely be MAJOR upside to follow and missing the start will pale into insignificance!
Agree, agree, agree.
this monthly PPO chart (13,20 eMAs/9eMA trigger) of $SILVER:$GOLD ratio, going back 35yrs would suggest that the bear end maybe close.. although there may be some further downside. I hope that clarifies the matter 😀
take note of the trigger line crossovers (marked by blue verticals) … in 1991 (& so far similarly in 2015) there was some further kick down in both gold & silver, before both rallied in 1993…. and in 1997, a kickdown, then silver ran away from gold for a while on a short bull run, while gold carried on down.
Hi SOG. I’m not sure if I’m reading this correctly but from what I can see, when the crossover occured with rising gold and silver prices, prices kept rising as in ’87, ’03 and ’09. However, if prices were falling when the crossover occured they carried on falling for quite some time as in ’91-93, 97-01 and now!! If I’ve got that right I’m not sure that looks too bullish near term!! Hope I’m wrong…’hope’…a VERY bad word where investment is involved!!
the downward momentum of price does seem to cause an overshoot doesnt it?
Unfortunately yes! At least that’s the way i read it!
well we have already had a degree of overshoot, so its possibly over & done with.
obviously this is positive divergence
Except that in the two prior periods the overshoot went on for years!! However, part of what makes me bullish gold is the current state of the global ‘fiat’ monetary system and if they can keep that going for anothher few years in it’s current form then I will be truly amazed. But who knows! They’ve already kept it going longer than I ever thought possible!! But ‘bottom line’ as discussed with Bill earlier, we are technically still in a downtrend and it’s hard to argue against that!
all i can say, is to repeat what Alex keeps telling everyone… not all bottoms look the same!
(even on a monthly chart)
We’re really going to need to see inflation set in for gold to take off. Right price of gas is cheap, no interest rates to speak of.
Inflation may well kick off again at some point but I would argue it’s not necessary for gold to rise in price. Gold/silver can rise for other reasons. In the 30’s gold and gold mining stocks were the ‘go to’ investment and that was the Great Depression with rampant deflation. Based on so much of what I read we are heading towards a global ‘fiat’ money crisis, when there will be a general loss of faith and confidence in ‘paper’ money. Inflation or deflation would be irrelevant then as gold would be in demand for very different reasons. However, I would say that a loss in faith in paper money would be almost certain to lead to rampant inflation in the prices of hard assets but for me that would be coincidental with a rising gold price under those circumstances rather than the actual cause. But the main point is that based on history, gold can happily rise in price even during periods of falling inflation or even outright deflation.
Good points Chris, but I have been hearing about the coming fiat crisis for years. No effect on gold, yet.
I take your point Bill about ‘for years’. What’s difficult is that the underlying issues build up over decades. In the modern case it could be argued since at least the 70’s when we came off the gold standard, which had acted as a restraint on central banks and kept ‘paper money’ relatively honest. Those shackles were cast off years ago and CB’s have gone nuts since and most especially in the last decade or so, attempting to print their way out of an exploding debt problem. Solving a debt problem with even more debt…if only!! At some point I can only believe this will all ‘tip over’ and once it does the speed with which it will unravel will be truly frightening. But the exact timing is as you suggest impossible to call. But I do personally believe it’s ultimately inevitable as countless examples down through history would testify and we get that much closer to the ‘tipping point’ with each passing year. Just my opinion as always, although shared by many others who are far cleverer and more knowledgable than me. Part of me hopes it never happens but I just can’t see how we will ultimately escape it!! Unless ‘this time it really is different’!!
That was the whole QE game for PMs – printing gone crazy will increase money flow and circulation and give rise to inflation. Except it didn’t.
SOG, not sure I get it. There are 4 lines on the chart. Which lines represent what?
its basically a % version of a MACD indicator.
relative values rather than the absolute values of a MACD.
showing the difference between a short & a long moving average.
the short 13eMA is in black is showing its position relative to the long 20eMA which has been stretched out horizontally across the middle as a thin brown line (= 0 on the left hand scale).
the pale 9eMA trigger line is just a smoothed version of the black 13eMA, to reveal its turning points.
the other two lines behind, are the $SILVER(grey) & $GOLD(yellow) spot prices.
Potentially reflecting just how tricky things are right now…I’ve posted this 1 hour chart of oil a few times now and noted how the 200 period ema makes a useful divider between shorter term bull and bear trends. I was long above 45.0 believing we had put in a cyle low and had completed a possible simple abc correction. That view was clearly wrong and I have since been stopped out. Although we continue to hold above the 50% retracement at 43.5 we are currently below the 200 period ema around 45.0. For me this makes the very short term trend about as clear as mud!! Bottom line we are potentially still in a more complex correction of that first leg up. Back above 45.0 and things will start to look more positive but until then this 1 hour chart has a slightly negative look about it…not enough to short it but enough to ‘wait and see’!! Hope that might help rather than confuse.
Thanks for pointing out those levels, Chris – I’ve been wanting to start a position in USO, OIH & XLE but you’re so right, it still looks risky. If you’re looking for something in energy, Natural Gas was beaten up first and hopefully has bottomed, I have a position in FCG that continues to linger at breakeven, keeping me alert – we’ll see
On my 1 hour the 200 period ema worked like a dream for capping bear rallies and the 80 period ema for capping the smaller bear rallies on the way down. The fact that the price is currently back below both but also holding above the 50% retracement level just has me on the sidelines until we start to see a clearer trend again. I’ll certainly take a look at Nat Gas Cal but ultmately I’m happy to go wherever it looks like there might be a solid chance of some action. So pretty much watching and waiting right now!!
Thanks for sharing. I loaded up some more USO right before close yesterday. Hoping for more follow through tomorrow. If we get up towards $48 I’ll start to trim pretty rapidly then re-assess.
We topped again around 45.80 in overnight trade and as I write this at 10.00 am (British time) we’re back at 45.0 and sitting right on the 200 period ema. So hoping it will hold this level and use it as support for another up leg otherwise it will look like more sideways consolidation for a bit longer yet. Very, very frustrating when you are waiting fro things to happen! But so far I thinks it’s fair to say that this consolidation phase has dragged on longer than any of us were expecting. On the upside, a move back above 46.50 would start looking more bullish short term, which would be a break back above the short term falling trend line and back above the previous minor high. Hope the trade works well for you.
I have UGAZ up 400% that can’t be right?
Check out UWTI 🙂
Tell me something is messed up. I sold UGAZ two days ago……
Reverse 1 for 5 split
Thank god, I would have been beside myself after selling it.
Alex, what do you think of CENX? Up 40% off the bottom, diverging MACD and RSI. Above the 10 and 20 ma’s. Compare with AA which is up 100% off the bottom, might be lagging and have the same capability.
I like it if it stays above the 10 sma.
looks good.
Further to my earlier post…oil now back above 45.0 and 200 period ema! Currently at 45.40. A ray of sunshine through the clouds maybe!!?
Chris, where is your ICON picture from?
I live on a small island called Guernsey (only 25 square miles!) which is part of the Channel Islands. The icon picture is a photo I took a while ago on one of our cliff walks. This particular walk runs down the lower part of the east coast and that particualr shot is overlooking a rather nice bay called Fermain Bay. You need to drop down about 250 feet to get down to it via the cliff paths but well worth the effort and an award winning beach cafe at the bottom when you get there, where you can have a really nice meal and a well earned beer/glass of wine!
Sounds wonderful. I’ll meet you there when the miners get back to 2011 highs! Cheers.
The island is too small for some people but I feel very lucky to have been born here and love the place and there is some stunning scenery for such a small area. You’ll see for yourself when the miners get back to those highs!! Lol And the first beers will definitely be on me. 🙂
Sounds Great, and looks even better. Found this on the web, looks like the same place you took yours from. refresh
That’s definitely Fermain Bay just a little further along the path from where I took my photo. 🙂 The cafe is just out of shot in the lower right part of the photo but you can see some of the white sun umbrellas which sit over the outside tables near the flag pole. In fact, if you look hard enough, I think that’s me down there enjoying a beer!! Lol You can also see the black high tide marks around the cliff sides. We have some of the biggest tidal movements in the world I believe and the tide can drop more than 9m (30+ feet) between high and low water on our biggest (spring) tides. This picture was definitely taken close to ‘high tide’!
Wow..u r very blessed chris…. sounds like my kinda life. Yet u have good Internet access&speed enuff to trade?
I do consider myself very fortunate Maria and definitely worse places to live. The island I live on (Guernsey) is the 2nd largest of the group (The Channel Islands). About 25 square miles and around 66,000 people live on the island. Unlike the smaller islands we do have cars!! And air and sea links to France and England. Quite decent infrastructure as well as internet access..thank goodness. Not the fastest in the world but certainly adequate for my needs. And sandy beaches as well as cliff walks within 10 minutes drive…so rather nice when the sun is shining!! 🙂 And I love the sea..which is jsut as well!! Lol
stunning…
Hey, it just so happens that ‘stunning’ is Chris’s middle name.
o my … I’m intrigued…. ;o)
It does begin with ‘S’…but as to ‘stunning’…you would need a very vivid imagination!! Lol
I think so as well Maria. As I said to Bill, only a very small island but sometimes good things really do come in small packages! Lol We also have a couple of smaller outlying islands which are very popular for visits and short stays. No cars whatsoever…so very peaceful and absolutely lovely, especially when the sun is shining. The nearest one to us is called Herm and is only about three square miles but has one hotel, some self catering cottages and a very nice restaurant and bar. It’s not unusual in the summer to hop on a boat and head over there for a few evening drinks and a bite to eat. Makes quite a novelty for visitors, taking them out to dinner with a boat for transport to the restaurant!:-)
… heaven…
heyyy … now that sounds like an adventure… (just so happens, adventure is my middle name) ;o)
Sounds like an excuse for a ‘party’!! Lol And if those miners are back at the 2011 highs, we’ll hopefully ALL be clebrating!! 🙂
Well the good thing is that the dollar is not looking well here. The bad news is that gold isn’t reacting to that; at least yet. Ugh Caveat, of course, is don’t read too much into intraday, very short term action.
We really need the miners to lead the way.
Well, we’re in deep stuff then!
CRK for a ride. (expecting MPO type of move)
@chartfreak1:disqus out of BB was overbought :))))
(refresh)
@LeChiffre:disqus so were WG and ACI….for many many days, but kept going higher 🙂
ahaha our long time debate. Would you say that BB sensitivity depends on the stock? CRK does not like to be out of BB. (statistically – better to close position)
Actually, I do not disagree with B.B. sell theory (lets call it that for now). I would say it works exceptionally reliably over 90% of the time or more.
What I was saying the other day in our conversation was that I dont use it coming out of extreme oversold conditions or bottoms. The example of ACI and WG are rare, but I’ve been burned by it in the past. Selling the B.B. to get in lower and lower may never come. Eventually you get the reversion to the means ( like ACI now) , but then the steam may be gone from the ride higher if it was short covering .
Refresh for another example. So it was out of oversold lows that I’d rather use a trailing stop and not rely on the B.B. .
.
like I said, some stocks are more sensitive than others. To be on the safe side, I also use the BB (13,2) settings.
I like that – I just back tested it on CDE 2012 and ACI , WG, and CRK. Looks a tad more lenient 🙂
STOPPP.. i JUST am looking at the CDE chart… CRAZY!
Mine was the yr 2012
Whats up with CDE today? Cant find news. Weak miners today …argh
idk.. it’s been weak .. for mnths. just been trading it..
I know… crazy! it’s been such a dog.
miners update (refresh) NGD on sale!
PPP, AUY, CDE all hit 52 week lows today. FSM has hit a new 52 week low 6 out of the last 8 trading days. OUCH!
CDE Perfect AB=CD pattern, should head higher now.
…. are u seriously gonna make me ask to see your harmonica?
Yes, please.
CDE refresh
it was down 7% with gold up a few bucks. For now, I’m going to pass.
tee hee
love your animated .gif.
keep them coming
they’re not animated gifs… the scientists have found a way to directly view M’s brain activity
LOL!! THEY MUST BE BLUSHING!!! ;O)
I agree with statements below by Onlooker & Bill …. Miners not finding any buying with Gold up and the Dollar is showcasing its weakness : (
Not encouraging
Gold has been leading for awhile – noticed that when gold is up miners respond but weakly (for example about 10AM this morning), but at no point since 1st cycle top have I noticed a ‘leading’ action.
@Maria:disqus
went long BAS… 50% retracement from the lows. Good support. Tight stop. (just heads up)
i saw that… (i did swear just a tiny bit) LOL …
here’s what I see (level 2 and volume)
(refresh)
boy it just dumped!
they are running stops…. s of bitc…..
got out… not looking good.
i know… it becomes more difficult every day to use stops… or should I say “work and trade” lol
next support $4.19 area
long BAS again…
reckkka frezzzza … *&^%$#!! ha ha
i wasnt in the mood to give anything back…seriously needed to walk away from that trade w/ my nice stash in tact.
sooo .. i figured it get the ax .. (still cussing tho.. lol)
if Alex is correct (brilliant analysis) and we’re about to get a roaring rally. Some value play are going to get rolling. VDSI and YRCW are playing along today (quite nicely). Charts look bullish.
(refresh)
is GDX/J gaining some traction here??
possibly. Wait for confirmation.
(over 10MA)
(refresh)
MDR wants out of that channel…(looks like) lol
I like the looks of a few today like MDR, ECA, AREX, WPX.
Yesterday I flipped a coin to buy AREX or PACD…I liked both. I bought PACD : (
yes… i took a piece of that cherry pie today… it’s very tasty…. so farrrrr…
Which one…AREX?
where do you set a protective stop for a coil like this (GDXJ) ?
will it overthrow & reverse??
in your eyeballs… ?
very cool ………
yeah, but how far to let it run below??..
i always wait & wait…..& wait… and by then its gone too far and i have to stick with it all the way to the bleedin’ bottom :l
I always say that it’s not good to do that, but I did that with a few off my energy stocks in March . It worked out ok in the long run, but I hate that feeling.
Pull up a chart of BAS and look at March. NOT GOOD, but then look at April – thank goodness.
8.10 down to 5.00.. not surprised it felt not good!
I may regret this, but I’m still in.
Looking at gold now, the GDs may gap down today and stop me out after all, and at a lower level… grrrrrr
now GDXJ dropped down out of coil.. sell or stay?!
yay!.. i might be getting slightly better at this lark, …. GDXJ overthrown & reversed at 18.88?
my sell stop at 18.85 had a bit more wiggle room this time
Glad I’m not the only one with that problem. When it is really close and I don’t want to lose by a penny, I’ll use a ‘mental stop’ and watch close. But I’ve also had that technique go down in flames. Or the next day is a horrid game down. And you ask your – do I still sell knowing I am giving it away at the lows OR am I getting ready to save myself from a big drop.
REXX… might want to fill the gap in the low 60’s. then rocket up!
BAS bounced back nicely.
EXXI is trying also
Look at REN yesterday.
Cancel that EXXI…it rose up and tagged the 10sma and dropped again 🙂
.. i think the correction is over & it’s in impulse 1 up (of 5)… right now. (oil)
and we all know what happens in 2.. lol .. reee traccce mennnt….
GDX could seriously be doing a Heinz Ketchup commercial right now…….slooowww drippp downnn….
the GDs look do-or-die here
one of my nat gas fav… RRC is trying to fill its gaps!
(refresh)
@disqus_brXtHPogSz:disqus
my BAS idea is working out. I didn’t expect such a reversal.
sorry bout that… my cde is stuck in quick sand too .. oh wait… hmmm .. life?
bought and sold BAS for quick profit.
I meant to at 4.2x and wasn’t quick enough. Dang.
Yeah, that was a BAD clue today – PPP, AUY, and CDE which had been early winners – ALL hit new 52-week lows, they were down 6-7% with GDX/J still positive at the time.
EOD energy shopping list
Well, looks like we’re poised to take another drawdown again this morning. Gold just cannot get momentum. This late now unlikely to be able to prior to Fed mtg. Which, by the way, I am SOOOOOoooo tired of hearing about. It’s a freaky 1/4 pt. Just do it and let us get on with trading.
Oh, and a special thanks to Saudi Arabia. Thanks, guys. Needed that one. Appreciate it.
Good morning – what was the news? I don’t see anything on a search
Morning, Cal. Saudi refused to hold a joint OPEC/non-OPEC (like Argentina) summit about oil prices. Tough when you have a solid technical set up and it gets trounced by news you could never foresee. Source: cnbc.com
Thanks, Cason. I’ve been wanting to get into Oil & related companies based on the good technicals that Alex has pointed out, but 2 different cycle guys with a good track record are looking for a retest of lows, which has kept me out. Waiting has certainly been conflicting – thanks for this info on fundamentals, guess I’ll keep watching for now
The last couple of days I thought Silver’s bullish up channel from the bottom might be morphing into a bearish rising wedge & today is supporting that idea. Doesn’t bode well if leaks over to GDX /J – although this late in daily cycle it’s hard to stop out – should probably pare back to weather a draw down though
i see premarket GDXJ price at $18.74
Sometimes I think that no matter what I do or who I follow everything will be wrong. With that mindset you would think we are close to a turnaround in the miners but that will likely be wrong too.
LoL.. you’re wrong, even when you’re right
At least NEM is up so far today. Probably not for long.
a lot of the energies are dropping out today.. least they are a lot easier to buy after a fall, rather than wondering when to get in during some sideways correction
Yeah, it seems that RIC & GPL are a bit confused today too.
Look at RIC and NEM now. Maybe they are trying to tell us something. (Maybe not)
ps.. i didnt sell my GDXJ in the end. only got 200 shares anyway, so will keep as a core holding.
there’s no way that they’re not gonna pass back up thru this level again (famous last words!), so may as well keep em for the journey back up
Alex, your picture looks like my portfolio crashing.
I am stopped out of everything for a loss too.
It seems that Pre-Fed nothing is working out as a long term trade. The volatility is chewing everything up ( seriously just about everything).
The chart for OIL is not broken. Today’s price is still higher than where it was in the morning yesterday, and oil itself looks fine. 50% pullback from the rally.
In the back of mind mind, I keep wondering if this is the day that stop losses get run before the next pop. The big boys seem to make their purchases in the last hour of trading so we should get a clue at the end of the day
I know, and many reversals recently have been on a Friday. I just dont think I’ll be adding anything until after the Fed. If GOLD is this late in the daily cycle, I would imagine that that Fed Decision may be the only thing holding things down.
Agree !!!
Gold is at 1102 currently, not that far from where it was Yesterday. Miners down huge. I’m still in, I think we slowly edge higher into wednesday to about 1130, get another mini slam, then steadily move higher to about 1160. Just guessing.
and yet RIC is up?
Alex, been watching $tran and $sox the last couple of days and notice they seem to be diverging from the major markets. Hitting resistance now at 50dma but given the lead on the way down, maybe….thoughts? BTW I’ve almost given up on commodities since all stops triggered yesterday so it may actually be almost time to get in…just saying 🙂
Hi Deshy,
Its funny that you say that. I spent last night going through charts and noticed a similar thing. I looked up JBLU , HA, UAL and was really surprised.
And its frustrating with the trades lately ( I am completely stopped out too this week, most were losses). The GOLD chart is ok, it matches 2 of my charts for a pullback to $1095. Miners, however, have taken it on the chin again, after a nice run higher in the first daily cycle. GDX new lows again ( GDXJ higher lows , but are we done selling yet, or will it drift down pre-fed?
OIL, the chart is actually fine, but some energy stocks lost the 10sma and stopped me out too.
Charts of SILVER & COPPER look pretty good. FCX, TGB…not bad.
Deep down, Gold is very late timing wise…I feel there will be a POST FED rally, but maybe not until the Fed.
Tough stuff guys. Thanks for your thoughts Deshy.
bumfreeknEr… feeln your pain mates…..
DQ seems to be my only solid play …..
well .. HK is holding in there as well …
looks like many are coming out of double zigzag.. woop
https://www.tradingview.com/x/TfyMJFyH/
Looks like a 3 drive pattern,
huh?
Google it
im working… but i do want to learn all about harmonicas.. very soon. those patterns intrigue me.. (and im being serious)
ok .. i googled it.. lol. so you think bearish or bullish drive?
TA – in the end is all about semantics… same patterns-different names… imho
FWIW :
Stop run on Miners like Silver in August ?
what dyou think Ken.. are we good to go?
Gotta be close SOG with Gold on day what 32 ?
If we can get a daily swing in GLD and GDX break of the TL and then close above the 9 sma I would feel comfortable adding……that’s just me though. 🙂
nice…
BAS? boy…
after yesterday reversal.
any EW input?
never mind got out.
Reminds me of 1987… A little article and charts with bonus Paul Tudor Jones special sauce
https://www.evernote.com/l/AAXbY-tz16pFgry-VOV2N9c_zOlsHvG00H0
Reminds me of 2011, the drop & sideways price flow is similar. (REFRESH) This time is likely going to continue bearish after eventually rising up & testing the 200sma.
The Monthly & weekly charts lean that way ( It was in my weekend report).
Alex,
Now look what TLT (bonds) did that same time period……
Right, but that was with the markets recovering too, right? I’m not sure that I expect that this time from the markets, so TLT?
Stocks had hard correction the 3rd quarter of 2011 where Bonds increased in value by over 30% in that same quarter. Unless I missed something ?
Well, I see what you’re looking at.
TLT actually ran strong July to OCt when SPX bounced sideways. SPX then ramped up in Oct and TLT dropped, so I see that inverse correlation. Then they moved inversely again Jan to April.
So …. If “we” agree that the stock markets are possibly moving down in a correction, crash or long term bear market would it not behoove us to have some cash in bonds?
I’m going to say it, but I’m NOT recommending acting on it. Pre-Fed is still tricky, but…………….
Some of those SILVER STOCKS do look good today reversing lows. SIL, EXK, SSRI, PAAS
EXK way to go
Check out RIC
AND PPP…most are turning green , but these are up exceptionally well.
Reversal in many Miners. GDX shake out? Oh I hate this game 🙂
still have this fear we might just be back testing the GDXJ coil apex.
i’ll be happier once we are thru & pulling up & away
o u luv 2hate it….
I DO LUV TO HATE IT.
And Alex…… I love.
Now we can make real money.
Thanks for your input.
who’s buying GDX/NUGT?
holding for the weekend???? yikes
Still holding GDXJ from 19.70. Bought IAG a few minutes ago at 1.49. Could have been a bad move but will see…
been holding IAG since last DCL. (and EXK).
so choppy….
I have a Fever. And the only thing that cure it is….more JNUG!
Bastards! Another shake out at the lows. Unbelievable. Not gonna chase it although this reversal sure looks good here. Miners are always tough, but this DC has been a real nasty b%tch!
It broke down out of the little channel I posted on the 30 min chart the other day, then backtested it and broke down again (and of course just below recent lows), and then wham, reversal. I hated getting out there given gold’s impending DCL, but just looking at the GDX chart it was ugly with a possible waterfall to come. Which could still come, of course.
Not really much volume either, but then that hasn’t really been a helpful indicator other than selling and buying climaxes.
I don’t trust RIC….
these markets are so shaky….
I want to see more proofs….
RIC was up all day. It will come back to earth, but pretty amazing during the sell off earlier.
man, every oil play is turning to shit…
Yup, except for that DQ
CRK? really.
LINE.
and BAS
just sold them all… frustrating
giggle…
Wow…thats 3-D!!
NADL jumped $.12 (considering it was .70 at the time) in just a few seconds this afternoon. I had been in and sold the pop.
Notice how miners dug out this afternoon? Oil plays did NOT!
Long NUGT since $2.65- aiming to hold until eod and maybe sell in ah
Serious BIDS on NUGT
Well ….. Can we close above on GDX and then next week close above the 10 sma ?
Classic stop run?
ITS CRAAAAAAAAAAAAAAZY. I luv it.
So I looked at NG ( Nova Gold) and said, “Wow, near recent highs!”
Then I looked at SBGL … ???? …. No Comment except for, “How did I miss that again!”
Look at it on a 2 yr chart. What a runner!
LOVE IT TOO>
NGD guys, told you about it. Strong choice.
where does SBGL come from? never heard of it
love chart
I love that chart too. It wasnt phased by the recent pullback at all.
headquarters in S. Africa
Quick miners update.
(refresh)
If you ran that at 10AM would have painted a much different picture!!
NGD, good setup for next week. I LIKE it! 50ma around the corner.
(refresh).
SBGL (newly discovered – Alex just mentioned it)
wow, what a chart and volume.
(refresh)
Have a good weekend everyone.
This will no doubt be one of the most difficult weekend reports I’ve ever written. What can I say ??
I have a family reunion Saturday and plans for Sunday, but if I can, I will try to get it out by Sunday night or EARLY EARLY Monday morning..
Basically, there are going to be 2 types of traders early next week…
1. Risk takers who might take positions before Wed Fed , maybe bought today or Monday? They may even plan on exiting by Wed.
2. Play it safe traders/investors who would rather wait and enter after they see what kind of action comes from the Fed Mtg.
The volatility has been shaking things up a lot lately, it’ll be nice to see how things go Post Fed Mtg.
Have a great weekend.
have a great weekend Alex!
I’ll tell you what – if I get an exit showing on any of my positions before the Fed – I’m out!
Check this out – it’s actually Fed Thursday this time. I know, weird, right? It’s always been Wednesday. But it is 16-17 Sep. I just double-checked at their website: http://www.federalreserve.gov/monetarypolicy/fomccalendars.htm
So is that more time to just whip around directionless? 😛
I couldn’t help myself. I grabbed JNUG on the reversal. Seriously, I must have a problem. Tight stop. If it bucks before Thursday, I’m just off the ride!