
Moving
In last weeks reports, I was pointing out the things that were moving and really catching my interest. Lets review and see how things played out and what that can mean going forward.
SPX WKLY – We had a very high volume sell off & reversal this week. The last 2 stand outs had 2 different immediate reactions. Aug 2011 just went sideways for weeks, while Oct 2014 recovered strongly.
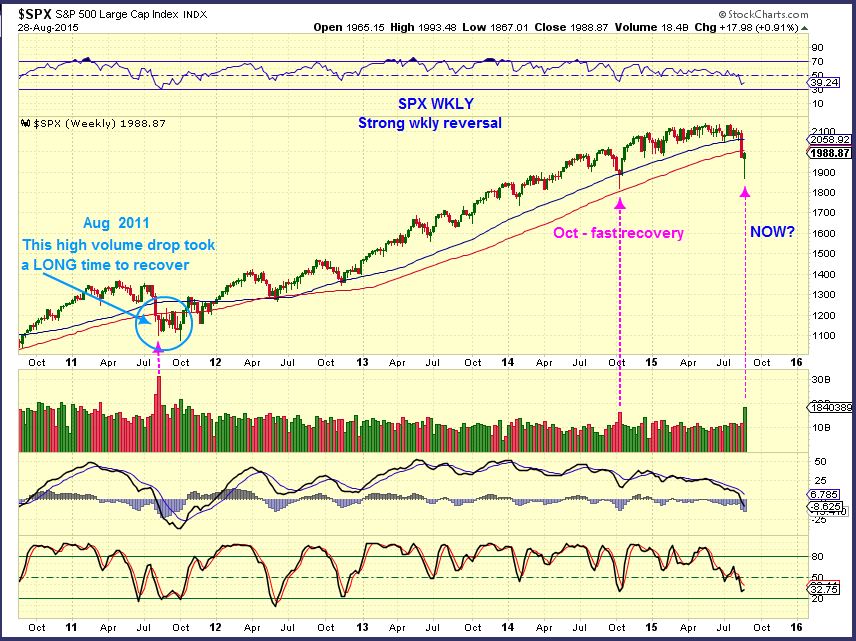
Which one is likely here, or is there another possibility? …
I posted this Monthly chart last week, but now I updated it. I just want to point out that at the start of a bear market, that 1st drop might be forgotten after weeks of trading sideways or up & down ( red circle).
I already hear ” BUY THIS DIP – The Fed wont allow it to drop”. They couldn’t do much about that first drop, huh? It followed the FOMC meeting. We may trade around for a bit, but I think this market is cracking.
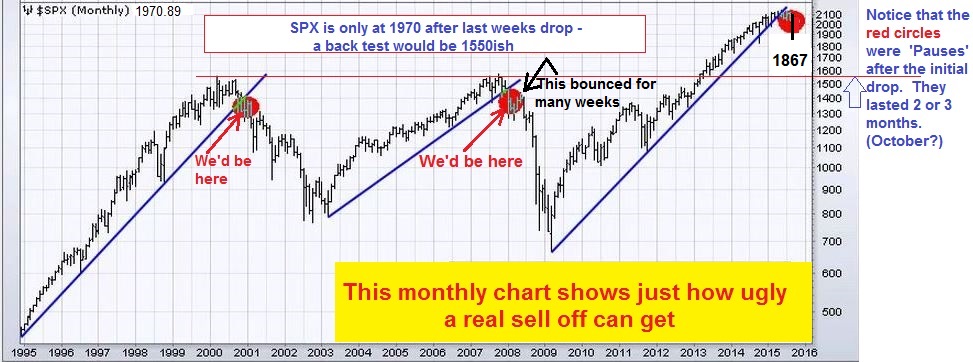
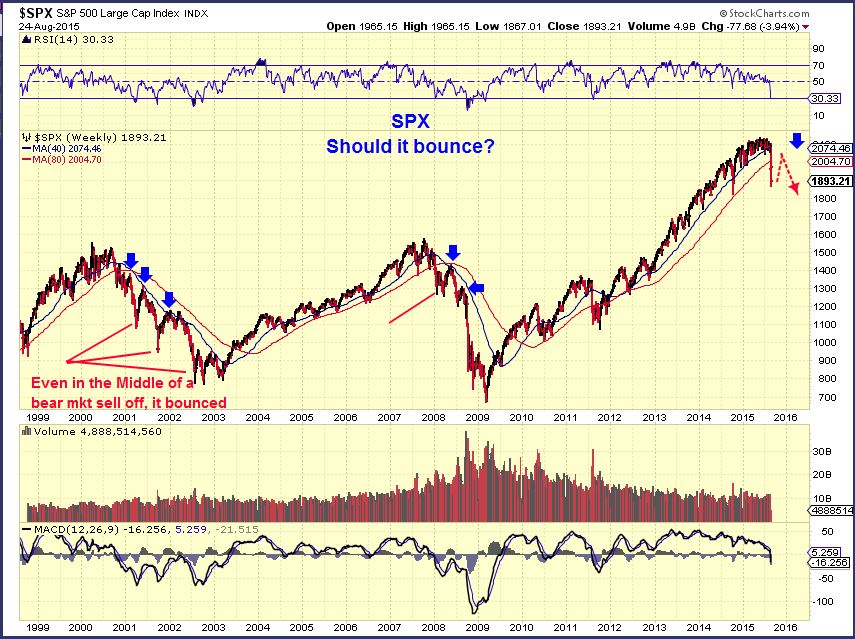
AUG 24 , I said that I do not recommend going short at the first drop (last week) , because it gets very oversold and we can bounce. Tops are a process , and we have been Topping since the SPX highs of Mid May. Those May highs have not been taken out all summer, instead volatility & sideways trading occurred. Now look at the tops of the year 2000 & 2007 below. A couple of sideways double tops and down she went.
SPX – 28 Many began to buy the dip last week along with short covering. Like past dips, some were feeling that they may be missing the next big rally. See how FAST October recovered? Can we expect that here? on Friday, the daily chart has a doji at the 20sma and possible resistance may hinder things a bit.
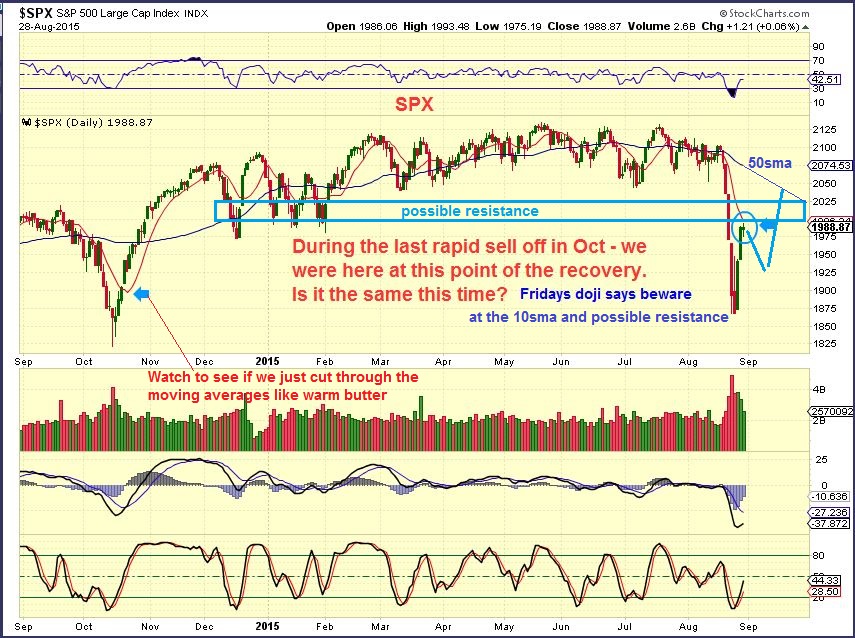
I have said that we could bounce around and make it back up to test the 50 or 200sma and then drop. That could be about the next FOMC mtg in September. Will we bounce around for months like the Monthly chart above shows? I do not know. These markets are on high margin & leverage. The house of cards may just tumble with out QE4. Time will tell, but I remain very cautious.
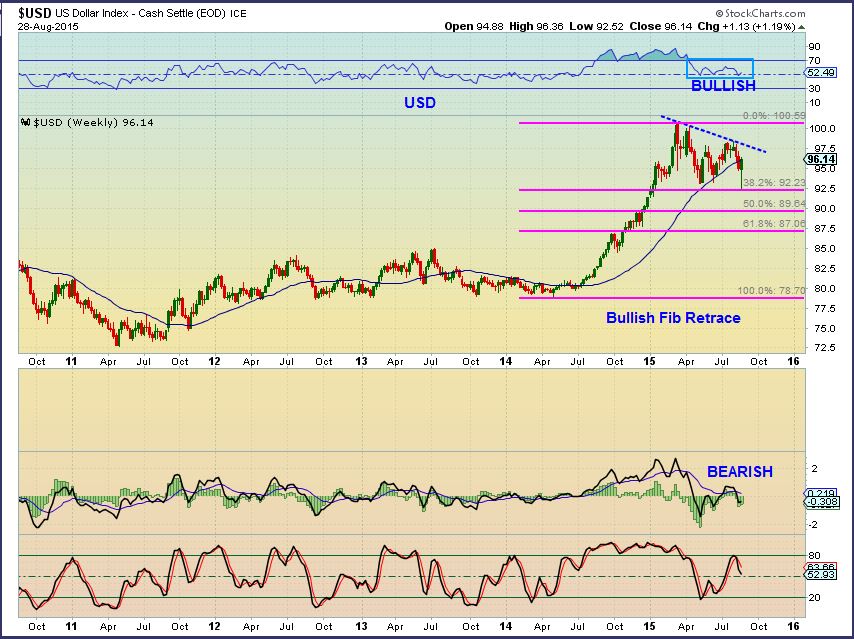
The weekly USD looks pretty strong. Reversal off of the 38.2% Fib line (Amazing, huh?). I have said that I see weekness short term for weeks now . Was that drop all there was to it?
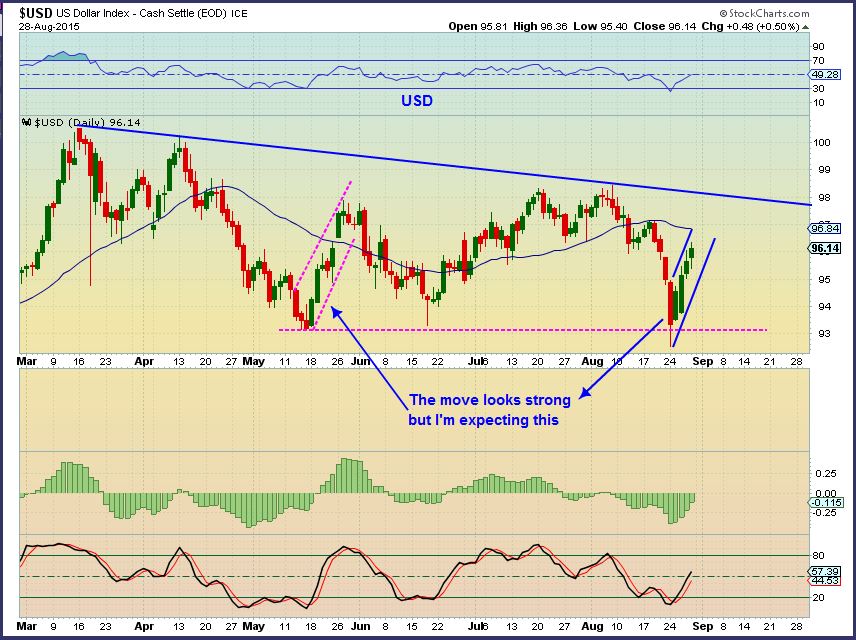
USD DAILY – I still see weakness within the rally, just like I saw earlier. THAT CAN CHANGE, but for now, I see this. I think we could see 97+ , but commodities are also possibly indicating that the dollars rally is a bounce.
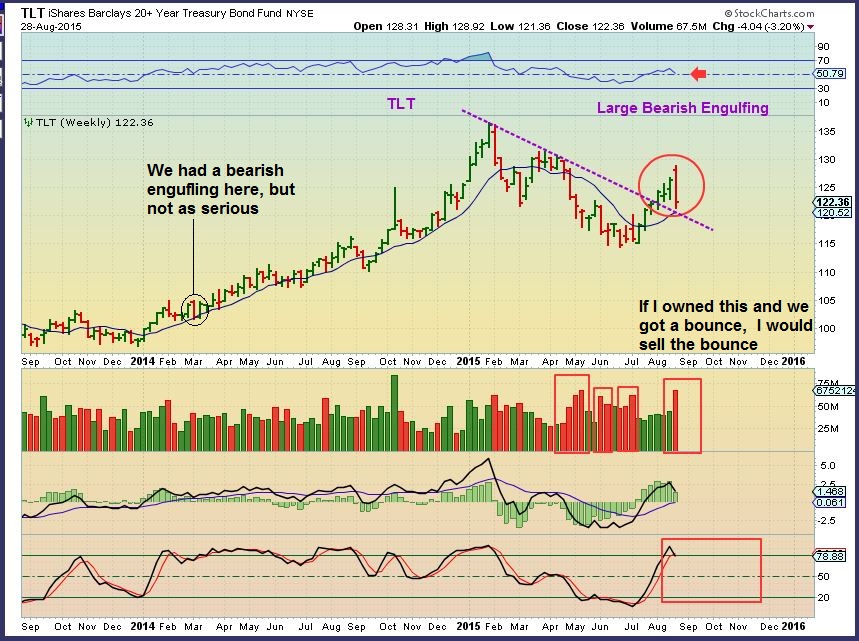
Of concern for those Long the TLT. Thats an ugly candle on the weekly.
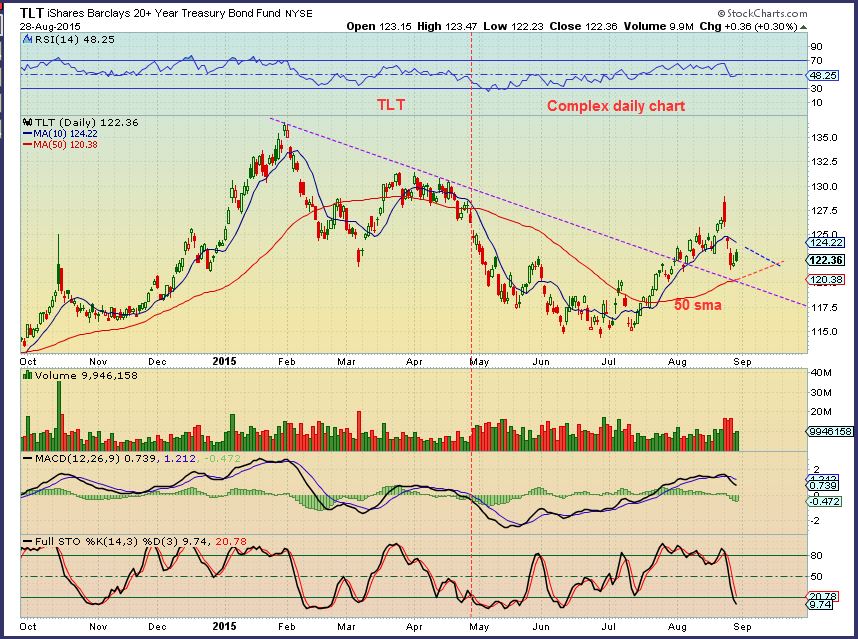
TLT DAILY – STATS: BELOW the 200sma. Above the 50 sma, stoped at the 10sma last week. Light volume on the bounce, likely heading for that 50sma and purple trend line. Stay alert.
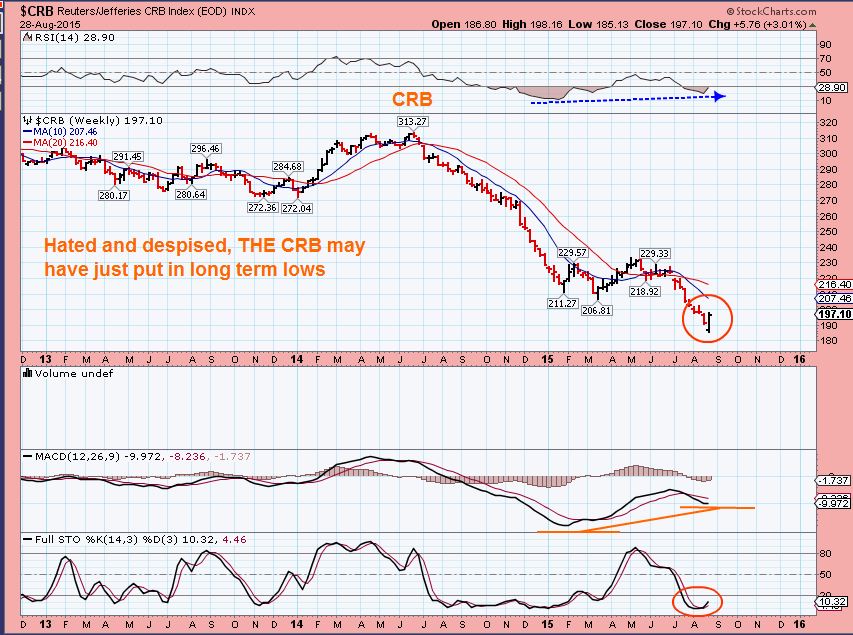
CRB – Rising with the dollar this week. Bullish Engulfing at the lows. Strong divergence on the weekly chart.
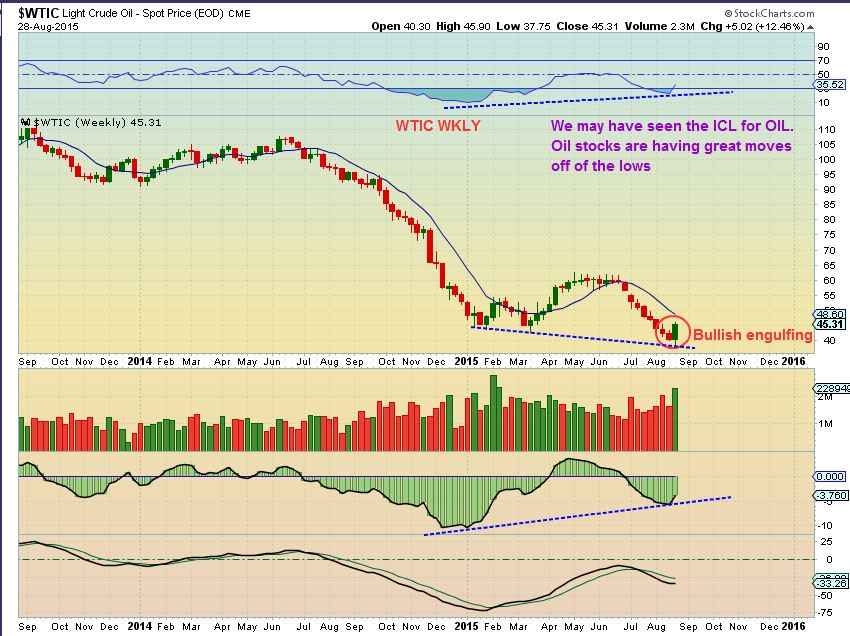
WTIC WKLY – BULLISH Engulfing Candle at the low. Strong buy I.M.O.
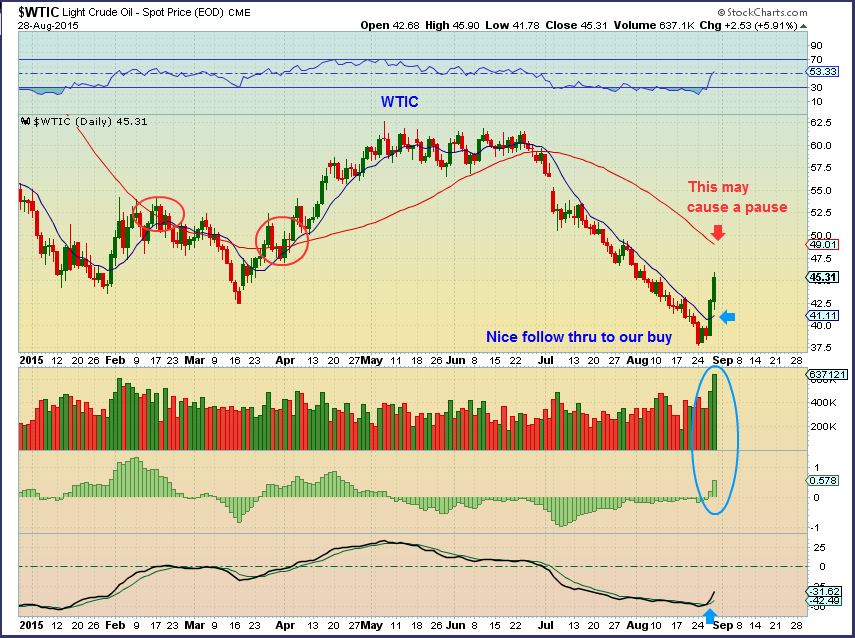
WTIC DAILY – I called Aug 27 the FAT PITCH in my recent report. A Buy on OIL & ENERGY STOCKS. Friday many more ENERGY STOCKS ripped higher. For oil, resistance is a bit overhead and this may cause a pause, but I think we could get a strong rally for weeks. I am still hearing $20 Oil by many on CNBC. I use that as a contrary indicator. We play it step by step.
GOLD,SILVER, & MINERS
MY PREAMBLE ( I know, some want to call this my pre- ramble ) : I like the set up & timing of where we are at with Metals and Miners, we are in proper timing to put in our daily cycle lows. I should mention that we are early in the daily cycle compared to recent DCL’s (Daily Cycle Lows) that came at day 31 or so. I THINK MINERS could have their DCL in, Gold has me undecided and I want to explain things that way. I’m not overly concerned, I think Gold is VERY CLOSE , but I see things that need to be pointed out. Lets get to the charts!
.
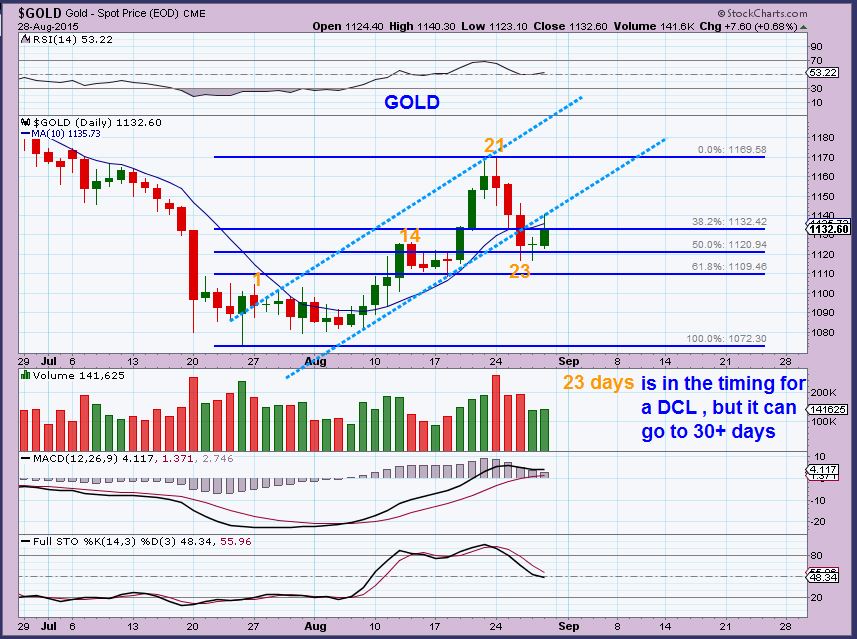
GOLD Aug 28. – Positive looking set up. Breaking above the down trend line. A break above $1146 is a bullish swing, a break above the 10sma is bullish too, but has yet to happen. If we dont have a daily cycle low in place here (red arrow) , we are on day 25 and some have gone on for 30+ days.
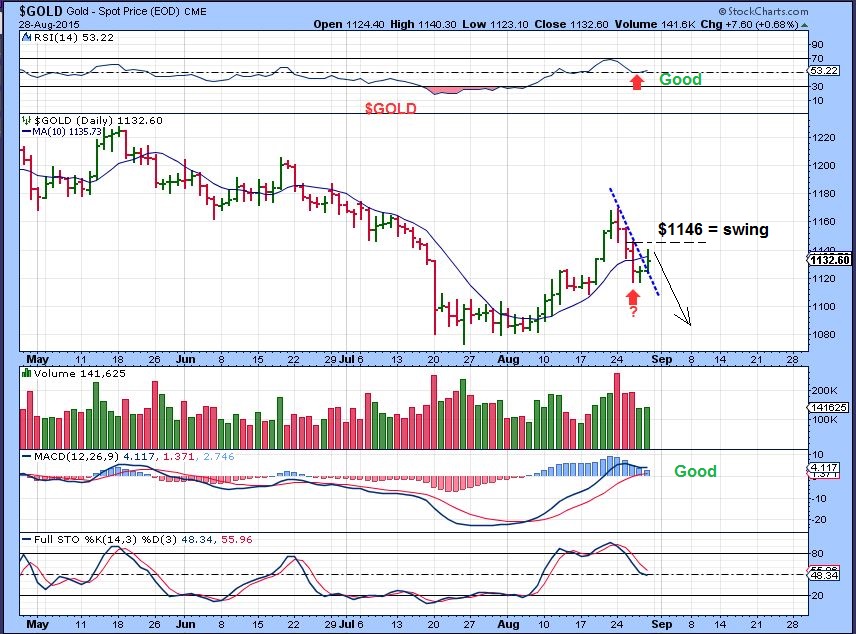
SO along with the above chart, I see this when I look at the Gold chart Technically. Was gold rejected Friday by the 10sma and the trend line, or just a pause? Light volume buying so far.
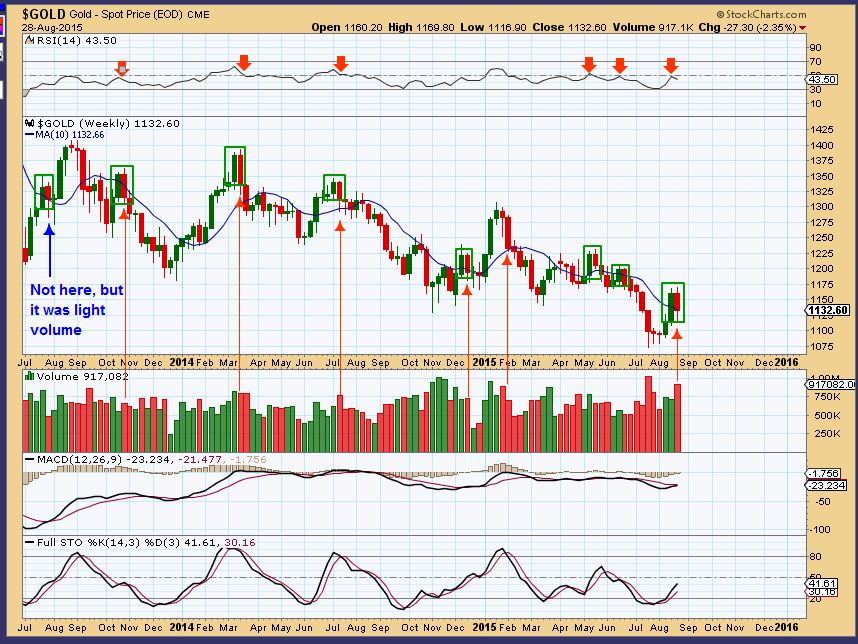
SO I look at the GOLD WEEKLY CHART. More concerns. I see this pattern of gold spiking up one week and spiking down the next, and it almost always had follow through down. 🙁 That was a high volume spike down, and as a technical trader, I do not like that. Actually I forgot to write on the chart that we saw this in Jan 2014 . It exploded higher for 6 weeks after.
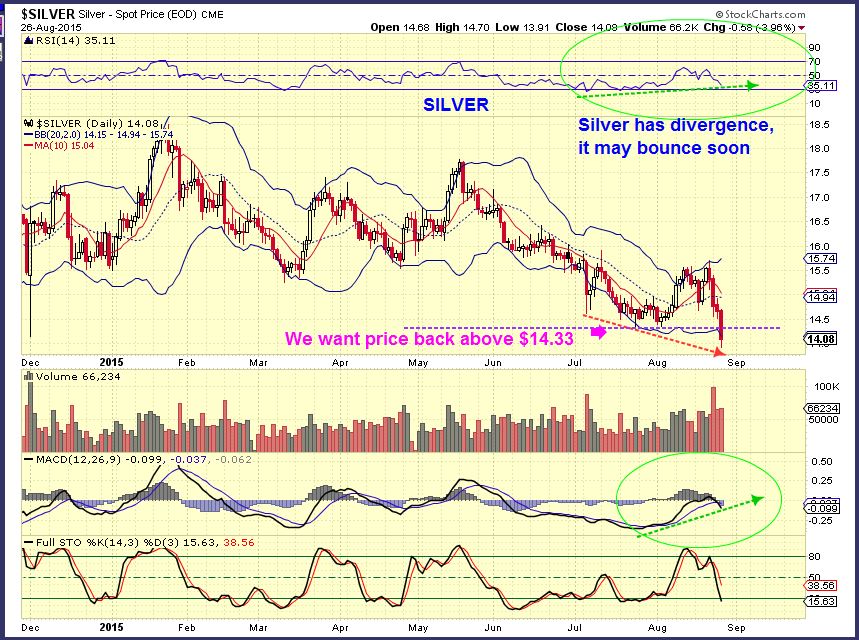
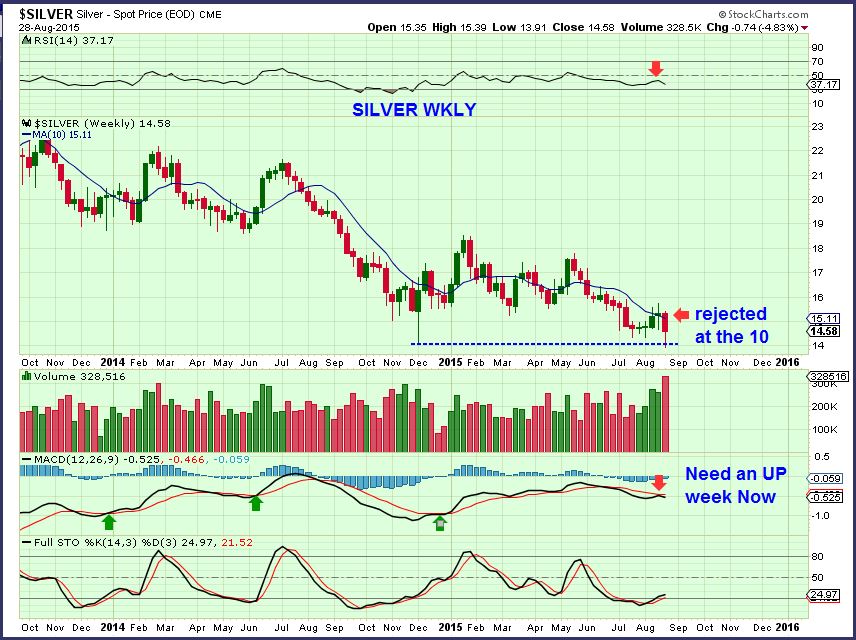
SILVER – Aug 26th I posted the break down and said that it would be good to see SILVER back over $14.33. Divergence was encouraging.
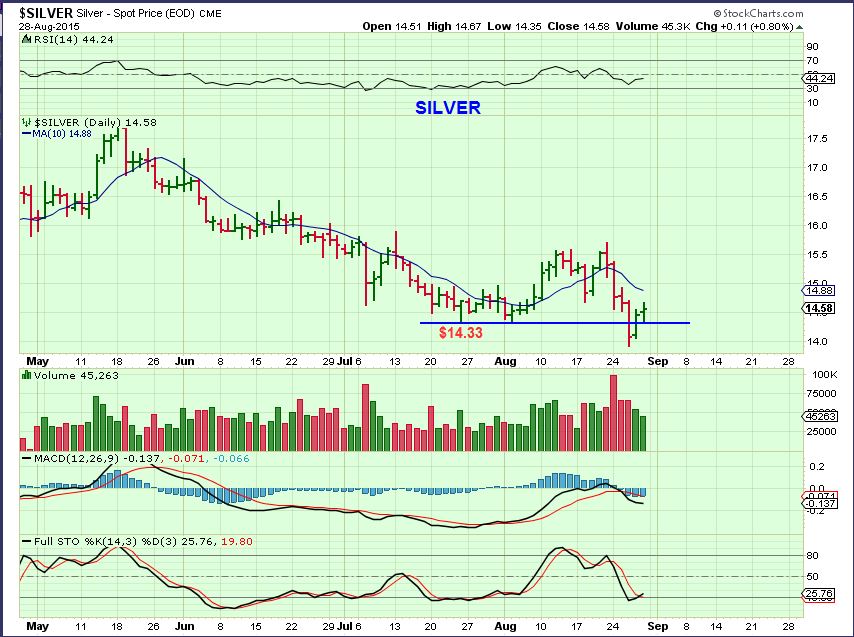
SILVER NOW – back over $14.33
Silver weekly – It is a bullish reversal of sorts. Silver got rejected at the 10 ma on a wkly basis, and it was a high volume reversal. It could be a high volume capitulation type stop run, that would be great. Sadly, the MACD got rejected on a weekly basis, that concerns me for now just a little. We need improvement this week. I am watching this carefully.
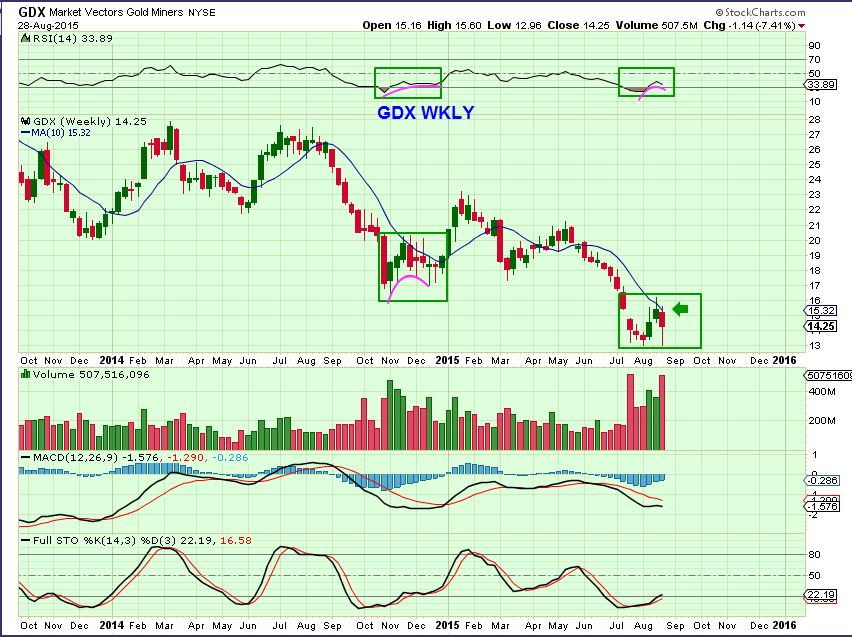
GDX WKLY – This is similar story to Silvers weekly, under the 10 ma and a high volume red candle, but basically the GDX daily chart looks like a good set up. I am long.
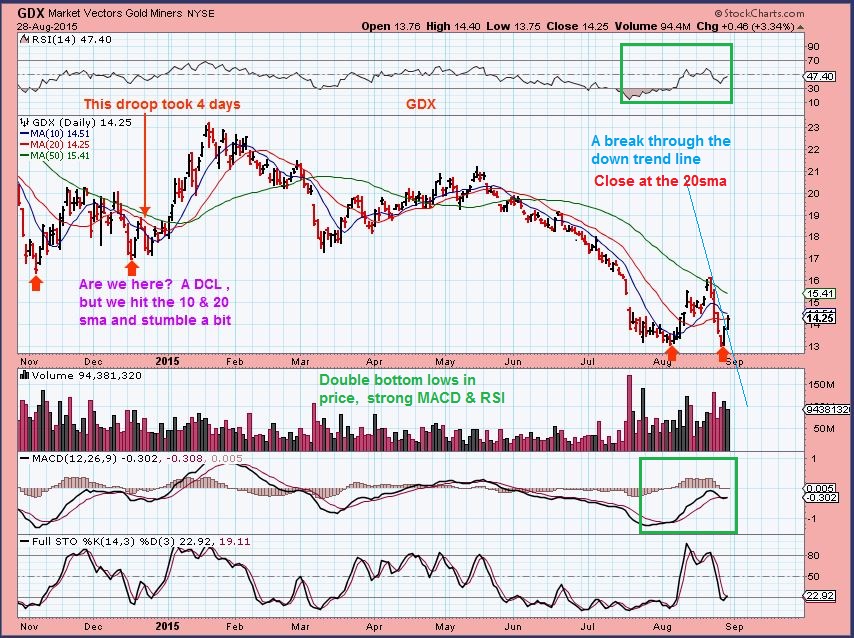
GDX DAILY – It looks bullish in many ways. We want to see a break above the 10sma. It is oversold and turned upward. In Dec. at the start of the 2nd daily cycle we ran to the 20sma and dropped . The lows were in, but this was the 1 to 2 of a 1-2-3-4-5 move. It shakes out longs. We may or may not see this here, we could also break above the 10 & 20 sma to the 50sma and then drop down to test them in the 1 to 2 of a 1-2-3-4-5.
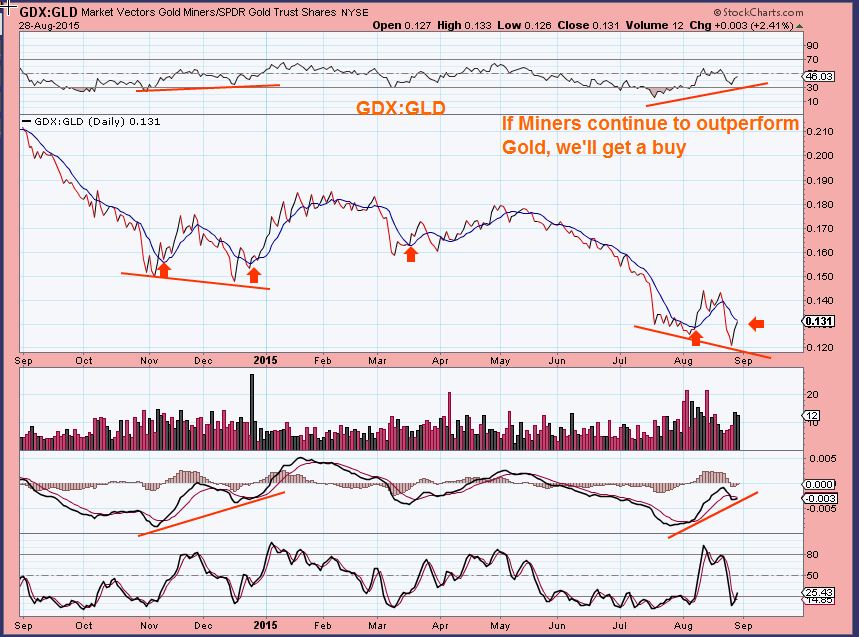
GDX:GLD is heading in the right direction
SO I am cautious about what is happening in the broad markets. Some are saying the selling is over and now BUY THE DIPS and THE FED will keep her afloat. They may see higher prices, or they may get washed out soon. These are volatile markets.
I am seeing very good things with the CRB and OIL and ENERGY STOCKS. Along with the CRB , I mentioned in past reports the set ups in AKS, X, FCX, VALE, MDR and the likes. With OIL AND ENERGY I pointed out many that are also moving nicely higher. BTU & ACI — MOON SHOTS. ACI has now gone from $1 to $8.50 Friday ( Do not buy , its way too late).
This is from my last report…
“I will cover more in the weekend report, but I just needed to post today to point out the FAT PITCH that has been tossed our way. We need to swing at it to make the gains desired. There may be POPS and DROPS and pullbacks to buy, but for the next few weeks , we should see good gains in these areas.
Look at our old energy stocks like BASS- EXXI- OAS- LGCY- HAL , FCG, XES, ENLC, TEX, QEP, CPQ. Smaller ones like WRES, REN, GDP, SFY, SD, TPLM, MHR, etc are real cheap, but may be a tad riskier if they come out with earnings and miss, so beware of when their reports come out. I have seen 4 reports released so far and all took off upside, so that is interesting ( NADL & SDRL for example) .”
I think METALS and MINERS may have bottomed. We are waiting for a confirmation in both Gold & GDX, but I see many things saying that it is likely in place. I bought back in last week, along with Energy stocks coming off of their lows, and I am still holding. Some of the Miners are moving along nicely. SA has held on to its 100% gains. MUX was up 20% Friday and AKG was up 18%, etc. We may have up & downs, but if the lows are in for the start of a 2nd daily cycle, you will see Miners begin to tack on gains. If we get some pullbacks to low risk entries, I will post charts in the coming days. Right now (As I said in my last 2 reports) If you see an energy stock up 14 % off its lows, do not mistakenly think it is too high, and that you missed it. Some of these will race up 10%+ each day and are still considered coming off of the bottom.


warm buddah…
ps. that’s a cool app u must have that u captured a video of you playing hopscotch & turned it into stick figure…
Thats me playing the MIners at times 🙂
LOL, myself also at times.
Thx Alex! Fingers crossed and let’s see what the week brings.
I think with ENERGY its pretty clear. We could get a pullback, but I think we go higher for a while.
GOLD,SILVER, MINERS have some “DIFFERENT” things happening that I am not used to seeing. It will take this week to get clarification.
All I can say is that SILVER/GDX drop changed the charts a bit & I need to see how this goes moving forward. I’m not trying to scare someone out ( GDX looks like possible swing in place, just needs further confirmation), but I want people to use stops below the lowest lows at least. We can always get back in higher, but getting out much lower is never easy.
For now, I like the set ups 🙂
Good morning, Alex! Since I’m new, I don’t think I’ve seen you say: do you enter your stops into the market or use mental stops? Are your stops on a closing basis? Thanks!
Mine are mental unless I wont be in front of the screen.
Then it depends on where the position is. Near the lows? Has it moved up higher (I’d use a trailing stop). Etc Hope that helps
It does, Thanks – I know of several people who warn of having positions picked off in aftermarket if stop is nearby, so I always like to hear other views. I don’t enter mine, just watch; although I should probably start using tradestops.com again.
Natural Gas looks good today giving a great entry point with a close stop-loss if you’re bullish
I admit it…in a moment of weakness I took partial profits on $WTIC. It was part of my plan so let’s see if this “Plan the trade, trade the plan” thing works out 🙂 Great work Alex!
Markets reacting to comments perceived as the Fed still moving toward an interest rate hike next month. A potential game changer IMO.
http://www.bloomberg.com/news/articles/2015-08-30/fed-at-jackson-hole-gearing-up-to-hike-amidst-rocky-terrain
“There is good reason to believe that inflation will move higher as the
forces holding down inflation dissipate further,” he said Saturday on a panel on inflation dynamics with other top central bankers…
Inflation is good for Gold
Agree. If the Fed takes aim at inflation they may kill the stock market. I suspect that if gold were temporarily taken down because of a rate hike the damage to the stock market would exceed damage to the precious metals complex.
Hi Alex. Another highly enjoyable report and loads to think about as always. Can’t help but agree with you on the slightly mixed picture on the different time frames in gold/silver and PM miners and it looks like there may be a few more twists and turns in the coming days to contend with. Also VERY much agree with your wariness over the general equity markets and that they are potentially cracking. I personally think they have been on borrowed time for far too long so freely admit to a bearish bias. One thing I would note in your top SPX weekly chart is that unlike last October but like Aug ’11 the index has now broken below what I believe is your 80 wma and MACD has crossed below 0. Based on all the research I have ever done, that is a classic hallmark of the early stages of a bear market. I personaly believe this current short term rally will fail but likely probe higher this week first as you suggest in your charts. Then we get some more plunges during September. If so, it will be very interesting to see what happens from there. Back in 2011 they introduced more versions of QE and ultimately aborted the bear market signals. It will be very interesting to see if they can do that again!! If not, then it will be a major ‘game changer’ for general equity markets in my opinion. One way or another, plenty of action to come I suspect!!
Thoughts on GAS and UGAZ?
rut roe….. does kinda look like gold is in the 5th of 5 now ….. anyone?
https://www.tradingview.com/x/mDVN5J5q/
Maria, pretty much what I see. Will it effect miners? I would think so, but I don’t know. My view on GOLD is attached (refresh). I see 1105 as the low eventually working higher. The blue candles are expected. The yellow is a Harmonic pattern, near perfect Gartley.
soo cool…. cant study it now but will later…. :o)
How flexible is the timing for that low? Is it locked in or can it be moved to an earlier date? I ask because for GOLD to drop to the low on Sept 16, it would be a 40+ day cycle ( and thats not likely).
The candle pattern comes from November 2014 and March 2015. Both are similar and recent. The harmonic pattern just lays out from FIB numbers. Daily chart.
45 DAYS, 33 trading days from 3-17-2015 to 5-1-2015
Not sure, I really think it is likely we’ve had the lows in this cycle, don’t we a stretch and drop personally.
IF we are starting the 2nd DCL then weve seen the lows. If not then who knows. I think we are mostly of the opinion that the ICL is behind us.
Thanks for sharing, Bill. Sorry, re read and wasn’t that clear – referring specifically to 2nd daily cycle. No reason to revisit ICL discussion, that is decided.
Thanks Bill.
Sorry Maria I make a mistake, I placed it wrong.
No Problem
Depends, what do you have in next higher set? 5 of 5 in 3 or 5 of 5 in P5?
Alex,
Things GDX moving rather quickly. Would seem that 2+ month TIME target GDX ICL to 2nd DC top might be a bit too long this time.
In my report above , see GDP daily chart. I mentioned that we should expect a pullback just like we saw in DEC at the start of the 2nd daily cycle. It ran up, hit the 20sma, and pulled back.
So far, no change.
Er sorry, was actually referring to eventual intermediate term 2nd DC top (not this takeoff pullback), sometime 2nd half SEPT but perhaps, at the pace of things right now, coming in a bit short of 2+ months ICL to 2nd DCT….?
Oh, I actually thought you were saying you think its already in, because we were pulling back today and you daid GDX was moving quicly ( down) . :).
Sorry for the confusion. Are you wait and see on that 2+ month time frame then, let past history stand as the best guide, etc.?
Yes, I’ll be watching for the signs of a top into the 2nd daily cycle once it gets going.
2.5 months NOT etched in stone.
Bought GDP in the red, I think it’s set up to run soon. (base)
WRES -SFY- EOX- HK – TPLM, BBG, EXXI, PACD, etc Popping up nicely
Oh, and OIL 🙂 UWTI which was clearly in the RED this a.m.
Darn it. I missed oil again. I was at work and simply not available (lunch break now) so wasn’t for lack of trying.
FCX r/g breakout.
wow.. did u c bas? i went from grrrrrr to ‘hey now”
…. nice moves out there…
Any short term resistance in BAS?…..close to 20SMA now?
The real nice moves ACI (hit $10 today) , BTU, MPO, EOX ,WRES, SFY ( chart of SFY looks like nothing, but 50%-Gain is very good last few days)
( I think REXX is set up to do another leg higher, low risk on the 20 sma )
Just noticed GST $1 to $1.50 and it only looks like it is just starting.
NADL? Notice it never dropped this morning in early oil sell off.
vroom vroom
Grabbed last week, but missed the add early AM.
and HK .. well .. that’s been S o l i d ….
Energy update. (nicely done FCX)
(refresh)
You might want to add EOX .
indeed. Done
Will continue to buy dips in GDX unless/until something breaks or CF determined charts have changed message.
Not sure why but my Spider-Sense has been tingling correctly recently. Sold near dated GDX calls for solid profit Friday so avoided today’s drawdown. Ready to add to monthlies.
spidey? lol …
It’s like cat-woman intuition. But for dudes!
teehee
Something to watch…
.
(Refresh) This is GDJ after the selling this a.m. If it can close a little higher by the end of the day, it will have pulled back and built some steam to push above these 2 moving averages. Then hopefully they hold and we continue higher.
.
If it cant push above , I would expect that we get another drop, possibly building steam to try again.
.
Nice close on the miners. Selling was light all day. GDX only 53m shares volume. I think tomorrow we take these moving averages out.
All this did was let me save money on next group of calls to purchase. Really liked low volume day, volume surge at close, GDX at highs, J just pennies below. BTD!
I am looking for laggers with signs of life in Energy for quick POPS.
Bought GDP & SFY today. Their charts look like they’ve hardly moved, but they really are putting in some % – Gains. if you look closer. I like the bases and think they have more upside.
I did the same thing with WRES & EOS before it took off.
Bought GDP in the red today at $.77…just hit $.93. Thats about 20%. Fast moves out of these lows for traders. SFY is just starting to move higher, I like the volume on a daily chart and the base type set up, now above the 10 & 20sma (Thats what I am looking for).
EOX, MPO, WRES, GST today – SWEET! Good examples of the possibilities of this short covering / buying frenzy ( while it lasts).
Hi CF,
I am holding REXX, SFY and CRK (got a really good entry on CRK). I have the urge to sell on big up days but don’t want to miss upside. So from your report it sounds like we have a few weeks of upside. Do you recommend trimming on big pops or are we early enough in the move that it’s best to sit tight? This is always my conundum.
Hey Alan, I own those too.
Your conundrum is mine also. There is a trick to selling , but in these types of runs higher, the top is really unknown, because they are so beaten down. You can use FIB #’s from the past top to the recnt lows and sell some at a 38% bounce, more at a 50% bounce, etc . Thats 1 method. I am just sitting tight at this point.
For Ex: If I owned ACI…I KNOW that I would have sold that near $4 or $5, its at $10, so it’s a tough call. STUDY BTU – it ran up, pulled back sharply , now up huge % – wise from $1 lows, I’d have sold that and regretted it.
There is always the chance of a gap down after a strong run too, but in these type of runs higher, a trailing stop can at least lock in gains, or if you get a super run like ACI- Taking your principle off of the table would be nice & let the free money run.
BASICALLY- I think OIL has more upside, but there will be pullbacks along the way ( Like 1-2-3-4-5 maybe) .
Hope that helps?
Yes thank you. This is helpful. My plan: place a trailing stop on 1/3 or 1/2 of the position and let the rest ride. I think that’s the best compromise between my urge to take profits and desire to hold for bigger gains. Will see how it all works out.
I wasnt watching OIL.
It is nearing the 50sma at $49 , and I do believe that OIL will pause and get its first pullback in that area , Energy stocks may react the same.
I may take some off of the table of overextended ones, and look to re-enter if there is a pullback to moving averages or another level of support.
Good observation.
I had same question. Thanks for the thorough response!
Example ( refresh)
Posted below, but thought that I should add it here.
Watching OIL.
It is nearing the 50sma at $49 , and I do believe that OIL will pause and get its first pullback in that area , Energy stocks may or may not react to that oil pause.
I may take some off of the table of overextended ones, and look to re-enter if there is a pullback to moving averages or another level of support.
PGH long here.
Alex, look at the bid at $1.41
wow, 31,000. And the guy with the ask at $1.42 isnt budging – lol
I know 🙂
love Level 2
here’s the chart (refresh)
PS: FCX idea long still has room ($11++)
I didnt know that one. I like the pop off of both the 10 & 20 sma today. Good volume too, already hat it has had the last 2 days. Looks good. ( 50sma 30cents higher , if you want to keep that in mind).
Agree Alex, Oil at the 50 sma and rather “long in the tooth”.
Harvesting 50% USO Call profits, Plus reducing energy stock positions……casino money now. Will look to add back after a pull back (wave 2), if no pull back “let her ride”. 🙂
Nice work, Ken. I am more sorry I missed it with every passing minute.
Thanks Cason.
You should get another shot at Oil imo I will add back at the 38 50 62 % Fib levels if we get a correction.
Maybe some leap calls too in case this is a start of a rather bullish trend to hold long term. Just my 2 cents worth. 🙂
RRC target. $45.2 area.
(refresh)
BAS. next resistance is $6. (also 50ma)
(refresh)
oo baby…..;)
what a nice move!
ikr?
i did shave some…i thought it might have some trouble at the 5.26 area…
USO is out of BB,
steam will be released in the next 2 days. (gobbled puts at eod)
(refresh)
DWTI is out of BB. decent long here.
(refresh)
Yea. Agree Frenchy. I was considering either hedging with puts or red fusing exposure, needless to say I reduced exposure.
Great job !
SDRL – good candidate on a pullback.
(refresh)
oooo… me likey….thanx frenchie
avec plaisir
;o)
yes pullback… it looks like 5 truncated on the smaller timeframe..not enuff steam to propel i higher .so probably nice/deep 2 – pullback ahead..;o)
https://www.tradingview.com/x/1Y2dyvym/