We all know that the markets don’t move in a straight line, and lately the volatility has made the path to successful investing a bit trickier. At times it is best to get a longer term view of where things are headed, so the wiggles or shake ups don’t knock us off course. Lets look at some charts.
SPX – This summer I was looking for that drop in the markets.
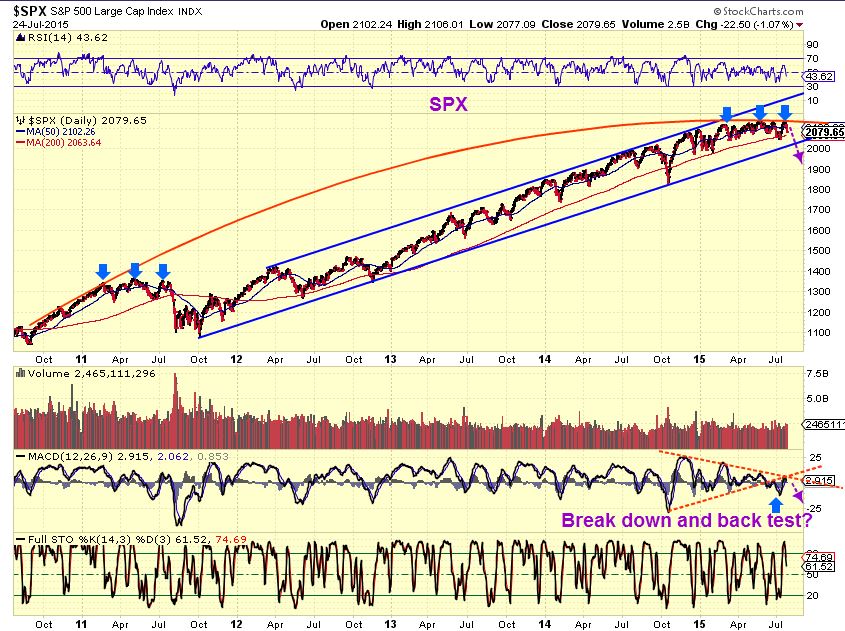
The question is , is it done?
I think a bounce will get everyone bullish again and many will praise the buy the dips team and endless bull market moves again.
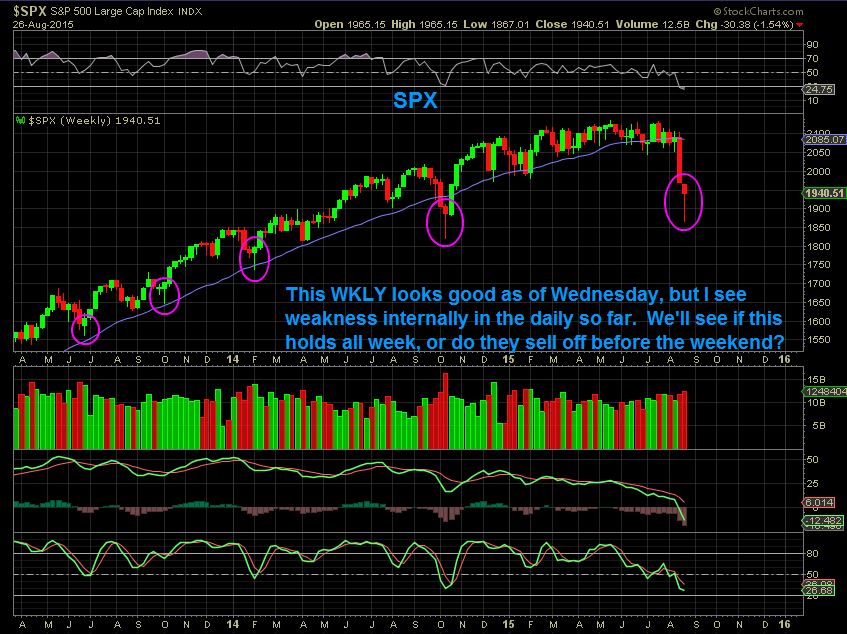
This week we have a recovery in process. As of Wednesday, this is how good the SPX Weekly chart looks. The PATH that I am looking at is playing out and 1 thing that I am really interested in is , ” Will people keep buying Friday and hold over the weekend? Will we get some selling Friday?”
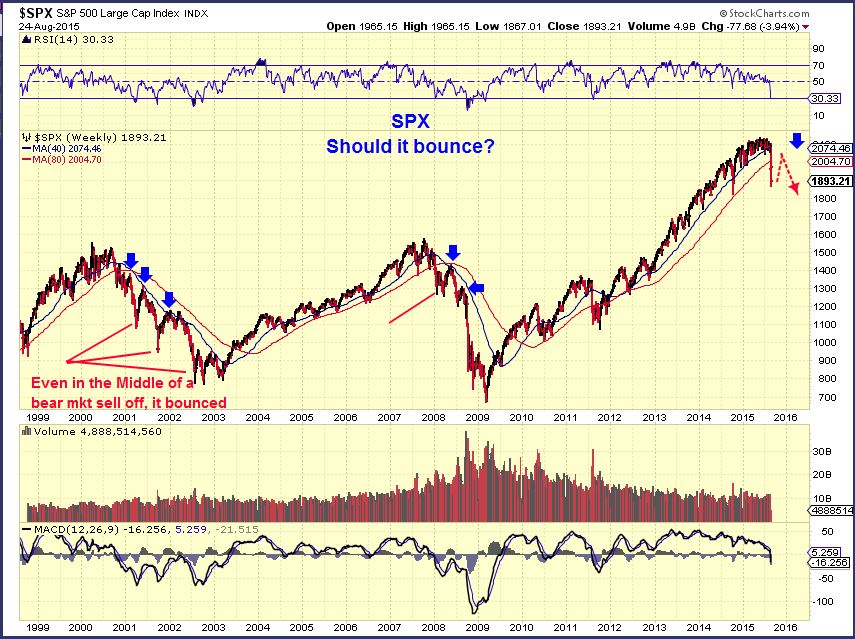
SPX– If it holds, it is a beautiful reversal candle, but the damage is done in my opinion. I expect further downside in the future. I may even recommend shorting a tag of the 200sma if we see that in September.
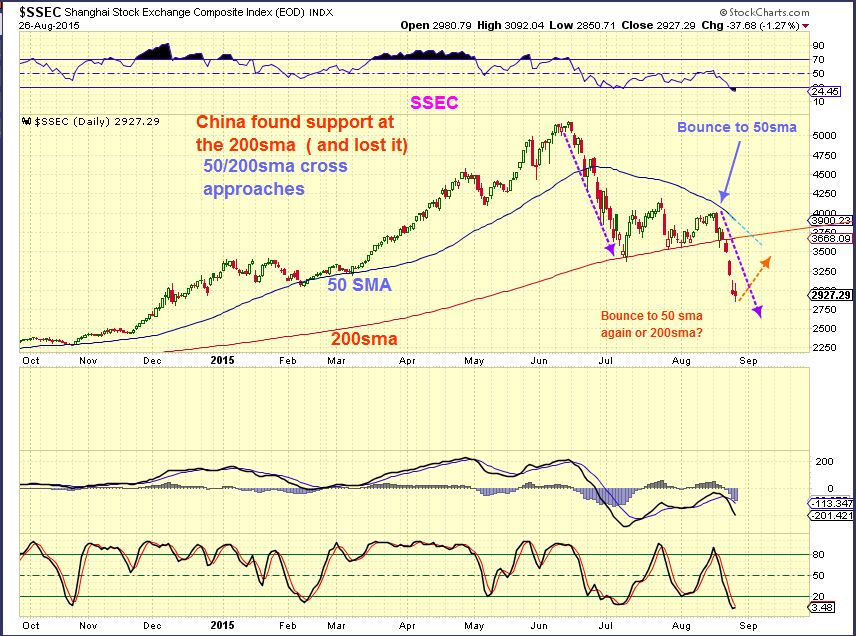
SSEC- I want to point out the ‘Temporary’ support in the SSEC sell off at the 200sma. Their was a recovery in progress there too, but the bullishness fell apart. THIS is similar to what I think we will see in the US markets for a recovery. I’ll have more in the weekend report.
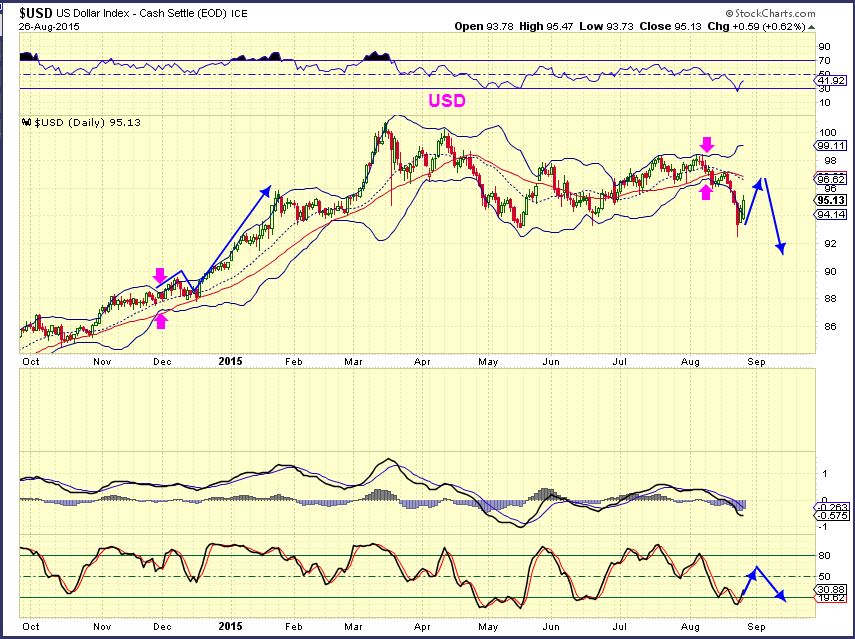
USD – People think that the past 2 days shows DOLLAR STRENGTH and fear that it will hinder Gold. Internally I still see weakness. I will let you know if that changes as time goes on, but so far the path that I think we will see is that the dollar will roll over again.
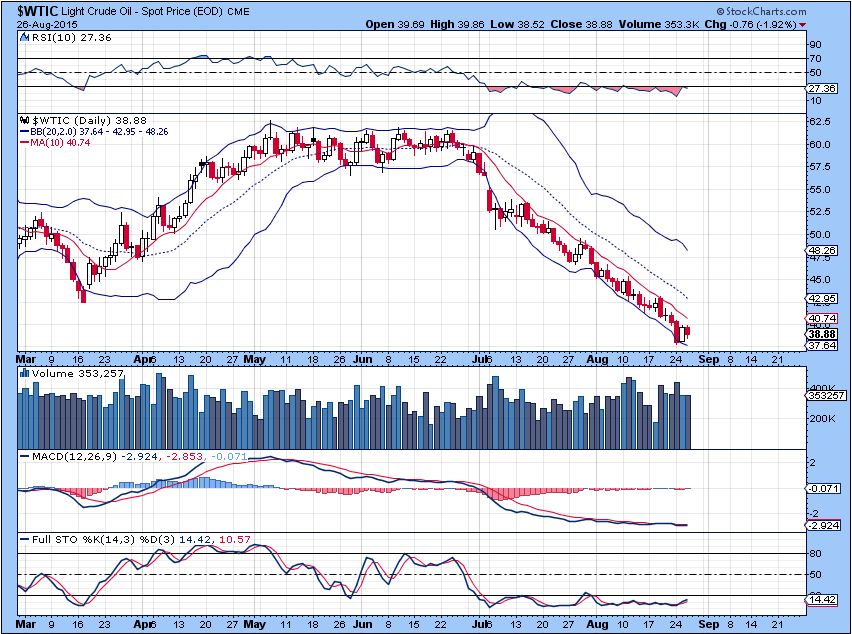
OIL – Again a possible $33.55 target?

OIL – Relentless selling. A close above the 10sma would be encouraging. Not a buy yet, but a sweet rally should follow and I will be looking at some Energy stocks at that time. If you look at some now, they POP 20% in 1 day on just an oversold bounce. They could become great %- gain trades.
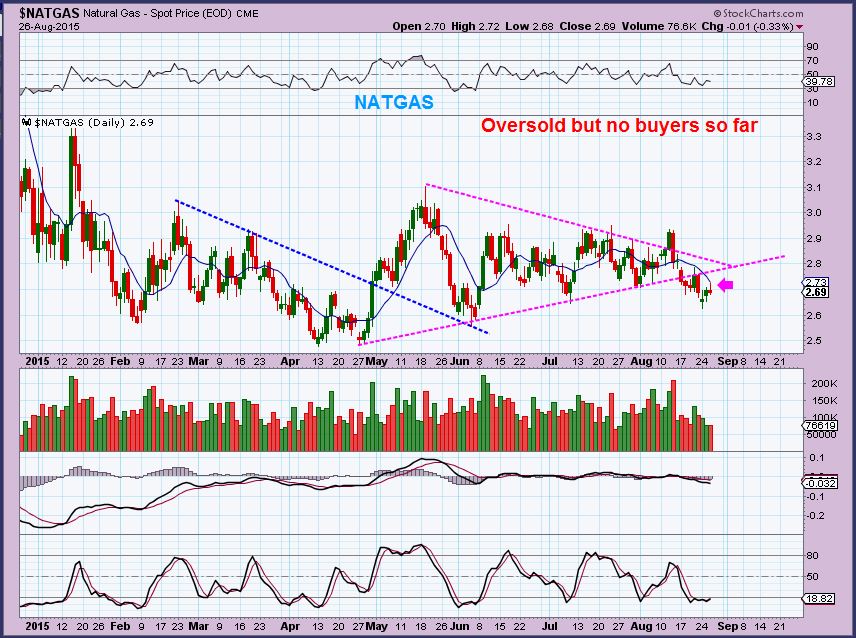
NATGAS – This turned from Bullish looking to Bearish , back to Bullish and then , “Oh, we’re in a triangle.” It has broken down at this point, but isnt selling off quickly, so I don’t see this as a short or long candidate right now. It is oversold, but it is also weak. Natgas reports come out on Thursday. What day is today? Maybe we’ll get some clarity.
GOLD,SILVER, & MINERS
What can I say? Does anyone remember the theme of yesterdays report? The waiting is difficult day to day, and in our comments section we see eager traders (myself included) just watching for signs of a bottom forming. I still expect a second rally phase, and timing wise it could start at anytime. The cycles used to measure the precious metals waves or phases have been stretched lately, so that should be in the back of our minds.
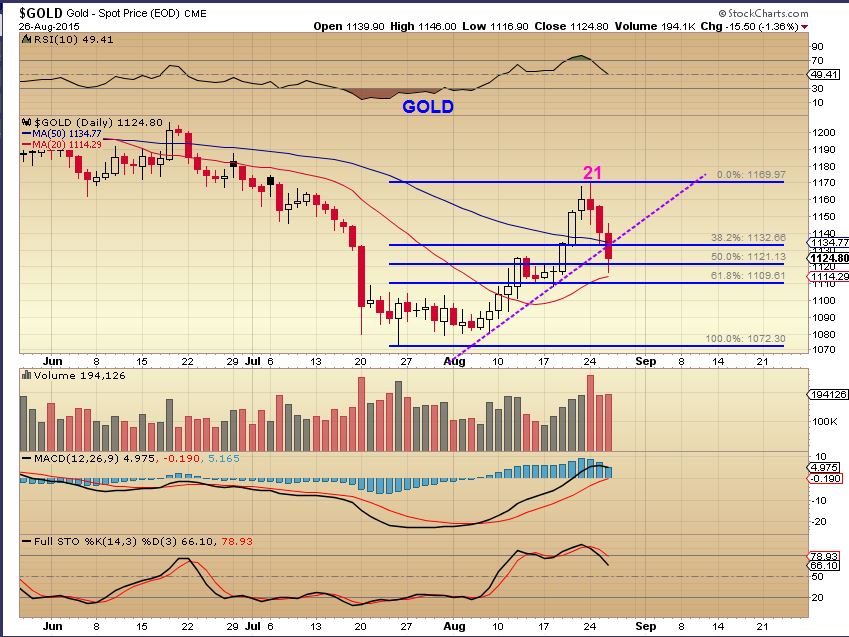
Gold cycles used to average roughly 20 to 28 trading days from low to low. The recent length has been in the low 30 day area. We are on day 24, so we could see the lows soon (Anytime now), or this could easily stretch on to next week. IF IT DID , I would expect less sell off and maybe more sideways as shown in this prior chart.
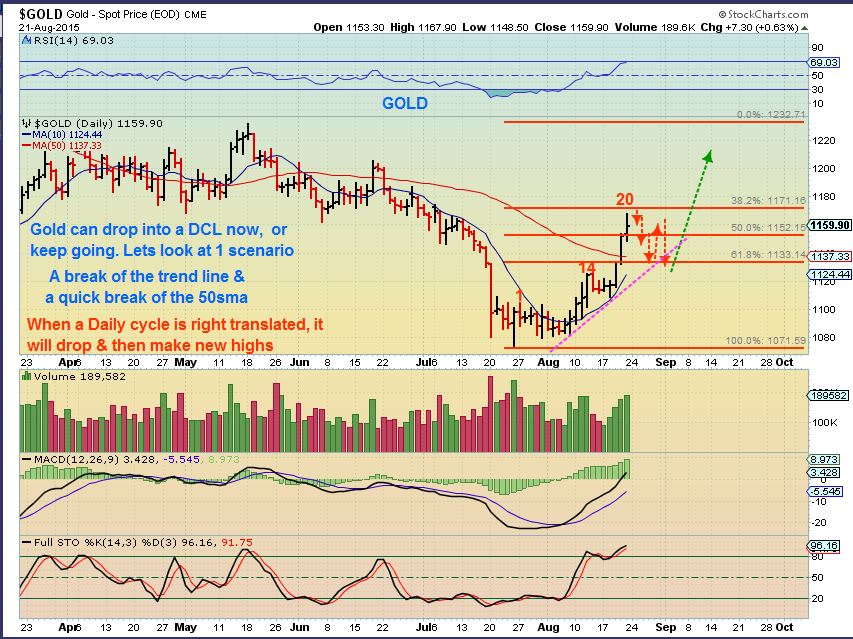
GOLD Aug 26 – will areas of support hold, or will it drop like the Miners have? $1109 is still acceptable.
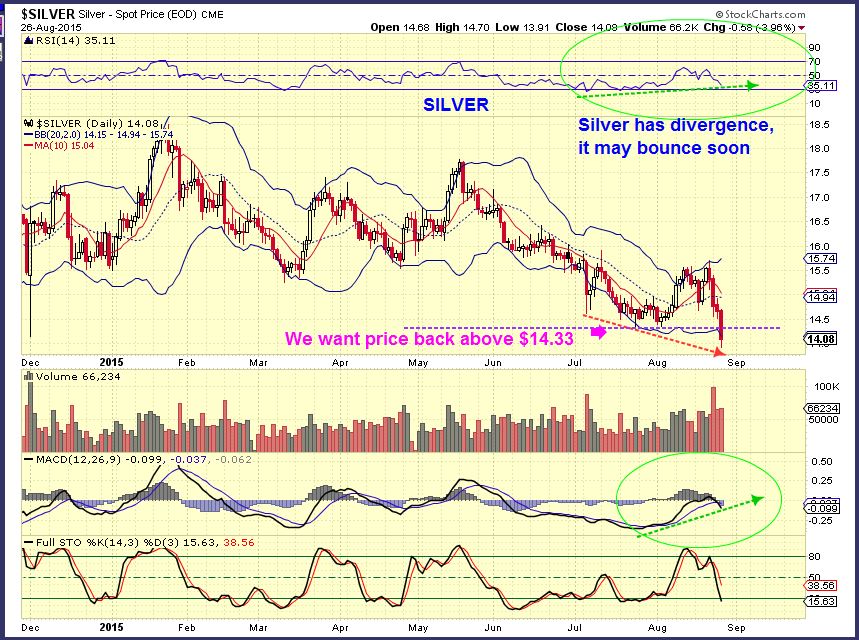
SILVER – Silver broke down. I am not touching it yet, but we may look back and see this as a nice buying opportunity if it recovers ( I think it will). I want to see $14.33 recovered by the close Friday to get a warm fuzzy about this possible shake out.
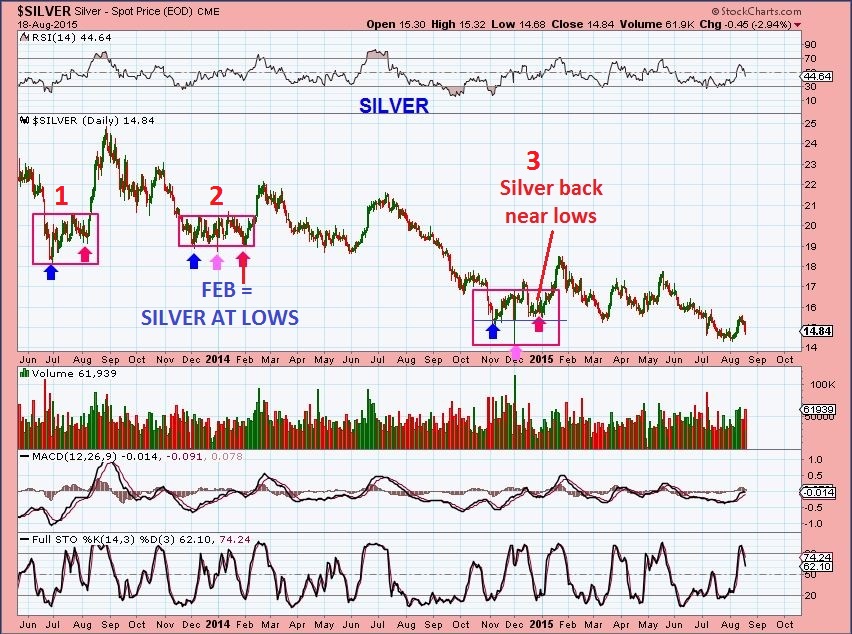
Remember what I said about SILVER Aug 18? It drops back to lows in the first daily cycle, but in the 2nd daily cycle? The 2nd rally phase is often explosive ( see AUG 2014). I would imagine many are shorting this break down, adding fuel to the fire.
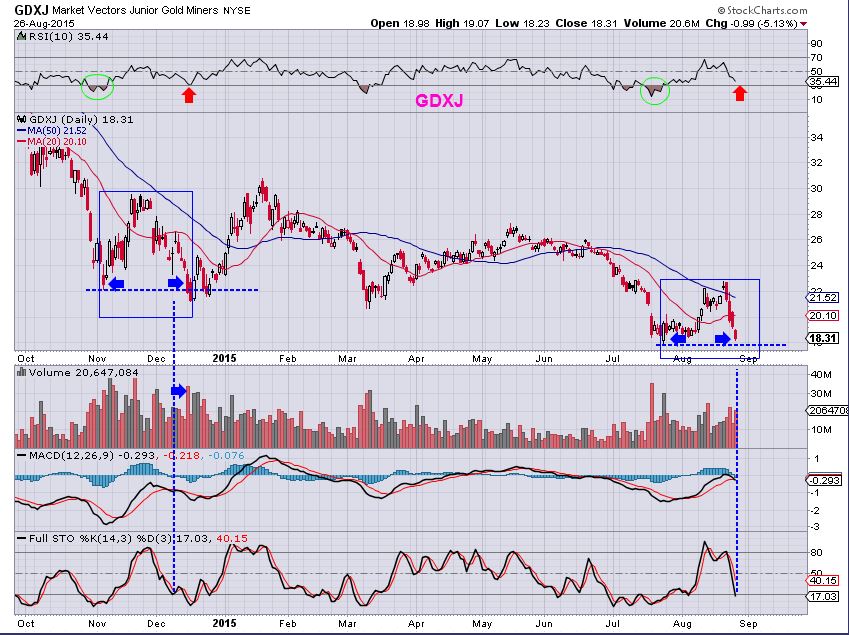
GDXJ Aug 26 – In Novembers 1st daily cycle we undercut the lows bounced and came back down again. The basic indicators like the MACD and RSI looked quite similar to what we see now. You can see that cutting to new lows in Miners didn’t negate the 2nd rally phase through January, and this is the path that I still expect up to this point.
So the waiting is still the hardest part. We are waiting for a swing low and we may even get a false bounce here & there as time unfolds. When I started writing Gold, Silver and the dollar futures were all green. Is Gold going to put in an early swing with smart money seeing that the dollar has weakness? I almost doubt it. I would say a false bounce and little more bouncing around would allow the daily cycle for Gold to stretch out a bit longer.
To identify the start of a new daily cycle we look for a break and close above the 10sma and a trend line break upward gives further confirmation. It would look like this.
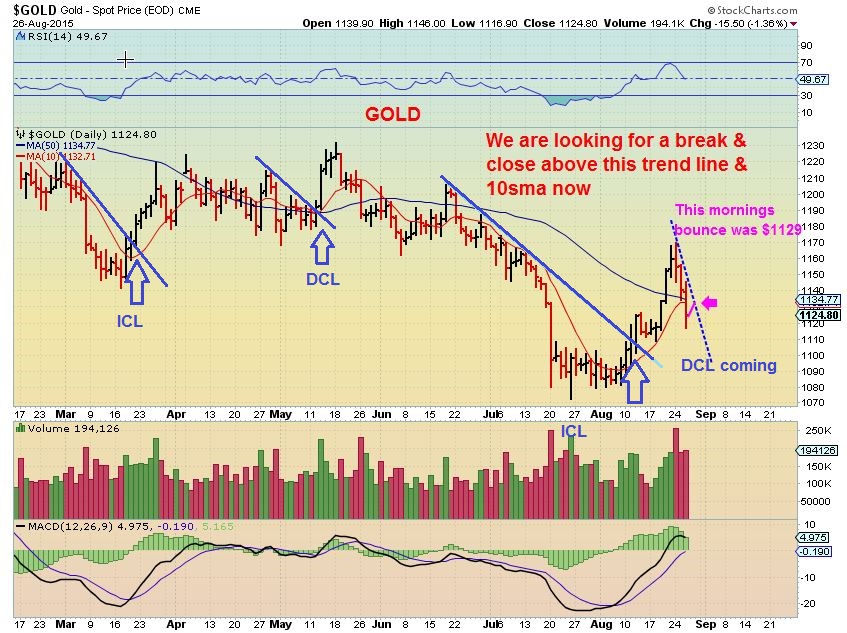
For newer readers here, I do not always have a Friday report. What I put in Thursdays reports often doesn’t change much and then the weekend report will cover the past week and what we are looking for going forward. IF Gold starts to rise quickly breaking above the moving averages in the above chart, I would write about that Friday, but I think the dollar has a little more upside and Gold may sell off a bit more and bounce around. If you are new here, please read some of the older reports to better understand what I am seeing. Also note the comments section below the reports. That area has a lot of good conversation as the day goes by, you may want to check that out daily.
The waiting is the hardest part, but patients in trading and waiting for a proper low risk entry can be quite rewarding in times like this. Thanks for being here.
~ALEX
The Hardest Part 
 The Fat Pitch
Scroll to top
TKS Alex, you just reminded me to wait for a proper set up before jumping into a trade. I haven’t been doing that lately, and getting burned in the process. It’s very tempting to jump in today but not the right thing to do as market could turn and test. Not a time to be complacent. IMO 🙂
I’m not sure which market you’re talking about, but in the Metals, Miners and OIL, I am always tempted the later we get into a daily cycle (knowing that a low is imminent).
You can see from OIL that that isn’t the best because oversold can become more oversold. We are either over day 60 on Oil, or maybe that 60 day period somehow should be broken into 2 daily cycles.
You’re not alone, I often front run a proper swing low set up due to other factors, but he safest is a break of the overhead trend line and the 10sma. IN the past, even these roll over and quickly recover too however, but it is usually just that little 2 to 3 of a 1-2-3-4-5 move .
u mean wave 2 correction…?
yes, thats what I meant, doesnt break the lows again, but falls away from the 10sma 1 more time at times.
Hi Alex – I just signed up for your premium blogs yesterday and I am fairly new. Just to be clear, for a conservative trader, you would recommend waiting a little bit before getting into oil stocks if we are looking for a long haul. Your thoughts on USO and GUSH ?
Looking at a sMA ‘safety net’… silver looks a lot like a mini-me version of last November.
…expecting this to recoil back to the ‘net’ some time soon
When I look at that, I personally would love to see some precious metals buying come in going into the weekend Friday (past Fridays have had that). It would ‘fix’ the weekly chart 🙂
welll .. when I look at that…. my eyes roll back into my head ANNND I feel like i am stuck in a Halloween spider web….. lol
soo .. is that just price overlayed w/ a moving avg ribbon???
yup.. its real homemade sMA ribbon
A quick update on the Shark Pattern. We are almost at the typical end of the beat down (GDXJ would be $18). When it turns its generally expected to retrace 50% ($20.38) at least and a good possibility of 100%. So that ties in nicely with the next DCL. I think we all expect a lower number in GOLD, maybe miners will lead the way again and start higher. Fridays have been a good change of pace lately?;-)
Bill! Welcome back, you were missed yesterday .
Thanks CF
..were you hiding in a fallout shelter, whilst the miners were getting nuked?
giggle…..
hey MissyEQ .. riddle me this …can you see a 5 wave completion in silver here, or am i just making it up?
LOL i was jussst going to write u… it looks like it is working on an “extended” wave 1 of 3 wave.. woop woop!!
if so… = very shallow 2 of 23% then onto our favorite big kahuna … ;o)
I really don’t speak Maria!
LOL … well .. according to the wave sequence& patterns.. it appears we are on our way..well – in silver anyway… so..hang on…
no im at work and im trading and im counting waves…annnnd im trying to sit a spelll to chat w/ the guys… maybe later i can look at it . ;o) sorry? ha ha ha
pss. I’m a visual & tactile learner…
ps. i FEEL your pain… every time someone says ICL or DCL my eyeballs roll back into my head… ;o)
Really? A smart girl like yourself ? Here’s your simple lesson. The DEEPEST LOW is ICL, the dcl can be wave 4 of 1,2,3,4,5 and then A-B-C “A” is the next dcl. & “C” may be the next… Clear? 😉
…
lol.. no actually I am anxious to learn all about cycles… but … my hands are so full right now i can’t even breathe… soo .. after sonnyboy is dropped off to college, after ‘opening of school’ gets underway .. thennnnnnnnnnnnnn i might have a few seconds to sit down & learn it …
ps. thats short for .. “get your lesson plan all ready CF .. cuz Imma gonna come a callin” for my video lesson ;o)
lol, the lesson above didnt help? I tried to ‘Elliot Wave it up’ for you
CLEAR … AS MUD.
I had to refresh this to see the probable emoticon rolling her eyes and see nothing. #Very disappointed
here are Maria’s eyes.. i borrowed them over the weekend..
◔◔
Very handy …and now I see the smart alec chatter box girl that she posted below .
Dont save that one – lol
That one below is exactly how i visualise Maria in action.. haha!!
(i think its one of her selfie ‘videos’ she made on her iphone)
Double Ditto!!
annnn this one is REALLY good too….
(and a couple catwoman gifs i cant post since this is “G”)
HA HA
lol.. yeah.. it’s pretty good.. ;o)
but .. honestly i vacillate between that one … annnnd
this one …
ps. she’s quite the Gal …. or so it’s told… ;o)
i can see this 5 waver, but i dont know how it fits in the bigger picture.
it found a new low for silver… sooo.. is it an ending 5 for the whole 4year bear…
or is it an expanding B wave
ohh … gotcha.. yes.. agree w/ that as well… you’ve seen my LT silver chart..right? will try and find it later
ive been gazing at that 4year silver wave, wondering if, what we’ve been presuming to be a 5 waver all along,,, is actually a double z/z (ABCxABC) or other weird corrective combo…
or a flat.. 5,3,3 ….. often found in B…
you mean 3,3,5?
cuz the C wave always has to be 5.
5,3,5 for z/z
3,3,5 for flat
yes
I went to a funeral for my portfolio! 😉
LoL
(sorry shouldnt laugh at funerals)
I’ve had plenty of those…. 🙁
Do have a target on GDX for 2nd cycle?
$BPGDM was slammed back to 0…
(the price above is $GDM index)
interesting. I wonder if the COT changed too. The selling started more on Wed, so prob wont show on this weeks COT
GOLD DOWN, MINERS AND SILVER up. Now thats more like it : )
Yes, leading the way
double bottom for GDX seems too obvious.
is it a double bluff.. they just playing with us!
I know, right. But sometimes it really is just that “simple”, in hindsight, of course. You know how that is, looking back at charts and saying, “it was so obvious; classic technicals there” and so on. We’ll see.
Ok so if it is a double bottom then I was actually on to something yesterday with my GDX comments. No one expected a bounce before running the stops. Expect the unexpected? We’ll see.
I don’t know, Bill. I’m playing it – dumped DUST and went for GDX. If we pull back tomorrow I’ll add.
Maybe a solid NUGT entry here? Thought for a minute great macro data was going to trump technicals. Time to rally!
Check out NADL, KEG, EOX, BTU, MPO and SOOOO many more.
charts of MPO & NADL hardly looks like it’s moving, but its up over 24%
Gary has made a good point lately that gold will generally put in a daily RSI under 30 on a DCL. On a quick scan of the chart that seems to be the case. So that would add to the case for more time for a DCL to develop, and probably more downside, though it doesn’t have to happen. And not doing so would surely be a sign of strength for the second DC.
Really? Refresh for the chart and thats using RSI 10. RSI 14 would be less likely. whats this …less than 1/2 the time?
.
Oops, sorry. I left out RSI 5. My bad.
Yes, but RSI 5 hits repeatedly over and over. Its too touchy to be an “indicator” of a low.
If it didnt hit below 30, I’d agree with what you said, – It indicates strength if it doesnt get there
It’s certainly not a stand alone, and that wasn’t meant to imply that the first instance marks a DCL (far from it; though that may generally be the case in an uptrend). As with most of these things it’s just a little piece of the puzzle taken in the context of all else.
agree, I was clarifying for newer ones. Dont buy just because someone says rsi below 30 is the key, when it can be hit or miss. You know.
It doesnt hurt to check it and see if its in that area I guess, another tool in the tool box.
For a new person , It could fool someone into thinking that the low is in when we go under the 30, and it may go under there 2 more times after bouncing around.
SO I guess as another tool, it could be used loosely. I’d use something else more accurate.
Sorry, I guess I should type up a standard caveat and post it with anything said about this type of thing.
i.e. “Not a stand alone indicator (as there are none, really). Has to be taken in the context of the larger picture using other technical tools. And certainly isn’t a sure thing, as there is no such thing. Do our own due diligence, as I may be wrong.” 🙂 etc, etc.
That certainly makes a lot of difference. Thanks for catching my error (leaving out the 5 implies the standard 14, no doubt).
With an actual divergence in place on GDX (lower close and pos divs on RSI, MACD among others) putting in a swing low is a pretty good buy signal. That means, of course, exceeding yesterday’s high. That was a nasty tease yesterday and I was “this close” to bailing and waiting for that swing, but I held on. Here’s to hoping that was a good decision.
NADL up 31% now. SOme of these beaten down oil stocks are going to bounce Big.
Nice POP in SILVER with Gold down
#Interesting 🙂
ACI & BTU – COAL is back in style.
Agree…..although just can’t seem to trader this “dirty hence expensive” sector with the abundance of NG available, which makes a little risky. 🙂 imho
Well, the dollar has conquered the 10 DMA (so far) and it’s approaching the down trendline, which also coincides with the prior DCL on Aug 12. Should be a decisive point if it’s destined to turn down hard soon.
I think it has to go higher to break the trend line overhead. If it’s going to rll over as L.T., I would expect it to have 5-9 days to peak (not straight up, but so far it’s pretty straight up and gaining strength). If you look at the month of may, we are doing something similar to that , so far.
EXXI had a double bottom with strong divergence in the MSACD and is popping up almost 20% . These are really starting to pop
Well here ya go……Oil above 10 sma, trend line break and MACD line break. Final ay ? 🙂
I’m loving these oil stocks gains. Now BAS did a baby pop on its chart and its up almost 20%
yes.. im in bas… did NOT like the trip down to the bottom drain of the swimming pool…my ears were starting to pop&i was running out of breath… did find some pennies down there I’d been lookn for .. ;o)
Alex,
I’m in BAS…in your opinion ( or your gut talking) does this look impulsive ( start of a new cycle) or just a corrective bounce and we can expect more downside over the next couple of days. What levels should be looking for?
Thx
At this point, they are all moving at once, breaking down trends, and OIL is also. looks like the start of a new cycle at this point.
Agree maybe even an ICL ?
Either way I am going to start building a position in Crude.
Yes, Likely an ICL
Ken, did you get in? Oil was up 9-10% by the time I caught up enough to chart, I wasn’t chasing. Next pullback maybe?
I did Cason.
Building a position in the Jan. 2016 USO in the money Calls once it broke the trend line and the 9 sma. 25% vested.
I am seeing a possible pull back though in the near future so…….
Alex, For what it’s worth GDX seems to have made a swing low and broken the sharp descending TL. Start of second DCL??
Possibly, but 2 things here. We may just be setting the less sharp descending trend line. If I use a 1 month chart and draw a line down from the top …it doesnt connect all 3 days. We may pop & drop 1 more time. THAT could look like last nov lows too. Refresh for 2 charts.
.
It might be a safe buy, but also a tad early with a bounce here & 1 more mini drop to scare out todays buyers
.
We just hit the area where I was saying we could be bouncing to ‘set the trend line” .
Now all we have to do is get above it and it is more likely a DCL
Great question, Deshy. I jumped in small today anyway. If it is up tomorrow, I’m good. If down then I’ll just add ready for DCL.
RRC is doing it!
(refresh)
Hi Ho Silver…AWAY
Alex Silver has put in the bottom in your opinon?
It is possible that yesterday was the “Shake out” and today regained the lows. I would say most likely
I like it for next week if we can get above the trendline end of week.
Good morning, CF! Do you have oil stocks that you recommend? I’ve been watching Crude for a low – and one appears to be in?
Yea good question Cal.
Maybe a top 5 Captain?
See above …I’m not sure what the different traders here are looking for.
Those will do. Thanks! 🙂
There are many that I like , those are off the top of my head
OAS was good. PXD, MDR, MHR, BAS, EXXI, PQ, DQ, DOM, RES, REN, and many more .
LECHIFFRE has a list with most of mine on it…I’m sure he’ll post when he checks back in, or I’ll put a list in the report.
That depends on what type of trader one is. Some wont buy under $10. I trade by charts and not always by fundamentals, so some stocks that I like the charts may not be buy & hold for long.
Some are looking for beaten down under $1 . They could be higher risk, but also might POP & double in price. ( They also might go bankrupt if their fundamentals aren’t strong enough), etc Those could be KEG, NADL, WRES, GDP, SD
Some only want Semi- Safer stocks above $1 , like REXX , LGCY, CPE, TPLM, CRK,
Thanks for that – I’m putting together my watch list and these will help. At some point I’ll want to buy some for the long haul, but that will be after we finish out this bottoming process. Some short-term gains could be had on what may be this intermediate low – thanks for your recommendation for conservative traders to wait for a close above the 10day ma in crude!
Or maybe some larger companies, RIG, SLB, OXY, EOG
yes, and HAL , FCG, XES, ENLC, TEX, QEP, CPQ
FWIW, GOLD is following the same trajectory as the Nov/Dec breakout. Much closer than GDX. Gold made a perfect AB=CD pattern at the ICL. With this in mind we could still see $1105 as the next low.
The chart for NGD particularly looks healthy Its move today is almost taking back 3 down days and is much stronger than the move off of lows in early Aug
GURE just getting started.
EW gents… what do you have for crude count?
i cannot tell if it just finished 5? or it just finished 3 and we hav 4&5 left…
im leaning toward the latter…fwiw…??
https://www.tradingview.com/x/TmPOwdIq/
correction… just finished 5of5 or is in 3of5
Maybe its ABC time
that looks like exactly how i woulda labelled it …
so lets go with a 4th wave ABC as Bill says.
then a short 5 for a double bottom retest.
Picked up CRK this morning but in typical new trader fashion I find it hard to hold when i see a profit. Will be eagerly reading analysis from all the very smart people here. At least if we just had an ICL in oil I should try to keep my finger off the sell button for a bit!
Miners update on a GREEN day!
(refresh)
Man, AUY stopped me and now my shares are on a rocket up 🙁
Energy update on a GREEN day!
(refresh)
reminder, RRC is one of my favorite.
**careful with stocks under $5.
H .. O .. L .. Y …… CRK :-O
ohhh my word… being at the bottom of the pool isnt so bad now… LOL
which actually…. i think i do know a couple people that would be happy to hold my head under water for a few minutes… or days….HA HA HA
I dont like GBR due to the volume , but it was up 60% today.
And BTU – still trucking.
Maria, You know DQ is calling you.
oh .. you know it CF… in fact we had a convo last night & the night b4… .;o)
https://www.tradingview.com/x/VfazpA1c/
Brazil stocks might be interesting too, with oil possibly bottoming.
EWZ, BRZ (3X), EBR, PBR
If you scroll down to DESHY’s comment, he was asking about breaking the trendline this a.m. and a DCL? I posted charts showing that we actually may just be bouncing to ‘set the trend line’ now, but bouncing to the line taken from the 2 top candles.
. Refresh for a chart, I think that is what we just did. So if we just set the trend line, a break above is more likely to be a DCL, BUT the DCL may already be in place, this is just further confirmation when we get a swing , break of the 10sma , and this trend line.
.
I did get a buy on the 2 hr chart for a possible DCL in place yesterday. No confirmation yet.
Yeah, definitely think today was probably the DCL for GDX/J. I flipped from DUST yesterday to long GDX. Do understand that we could dip and test before confirmation. But…Buy the Dip!
Nice looking double bottom on AKS.
And with VALE, FCX, etc popping, it could be time for commodities.
X, AA, CENX all look like they are forming divergent bottoms
Was today a miner bear trap?
Or bull trap?
That was a sweet push into the close, I believe it pushed GDX above that trend line.
Yep, excellent finish. Fixed that candle up nicely. I’ve gotta admit, that pull back had me on edge.
is that what you might call a bull hammer for the last hour?
not massive volume though
I am seeing good volume ( looking on 10 minute, 30 minute, 1 hr, etc ) .
ok.. i had it as 14m for last hour.
maybe i should look under the bonnet at the last few mins..
yes, I have about 110 million for the day too .
actually it was my stockcharts dotcom.
really slow to update.
looking much better now
It was definitely bullish, and just based on what we saw in commodities today right across the board , I’d say things turned very bullish.
Bullish set ups everywhere.
Man, I watched GDX back to 13.3x and NUGT to 2.82 but didn’t pull the NUGT or JNUG trigger. Darn! I did start the morning with add to GDX calls at least. They were up nicely today. Been wanting to jump on crude and just barely held off a few times. A starter position would have worked out in this case. Next pullback…!
YES!
GDX An ugly candle forming, but often you see these kinds of candles coming out of lows as the push/pull plays out. Kind of like the Nov 14 low. Much
worse to see a big upper wick after a run up.
Possibly a good shakeout of longs too.
Nice! Looking good if we finish strong into the close where the huge vol comes in.
That was the 2nd buy today, but I missed it. Drat.
I just looked at ACI and realized where it was and where it went to today! WOW!
$1 to $7 in about 2 weeks
Holy crap! Huge vol too
CRK …what was that?!?!?
Someone popped the CoRK!
and BTU also .
oh… so clever of u CF… (er)
CRK !!! omg
wanna hear something cray cray… all day long i kept following CRK and i noticed it looked an awful lot like Aug 12th movement.. sooo .. i put in a crazy sell at 3.23 … thinking what the hay… DONT YOU KNOW THAT ORDER HIT AT 3.59!! ohhh myyy gawwwd…
We might have the gold DCL when it breaks down from the range to 1109.
I think we may have the DCL in miners; but still could be a few days in gold, this could definitely play out. If it does, I would likely be a buyer at 1109.
im still liking this ole gold chart…sorry for the repost – i cleaned it up a bit…
what u guys think?
https://www.tradingview.com/x/YvQ70iD3/
got no complaints about that one
Looks good. I do think that we will hit significant resistance btw 1180-1200; that may top out DCL2 and then we head back down. Doesn’t mean that it can’t be Leg1 back up; higher low in place then another run? We’ll know one day…