
U Turns
What a week! The Fed spoke on Wednesday, Thursday we saw Draghi shaking things up, and now on Friday we will have the November jobs report and The OPEC Leaders will discuss whether or not to cut production. Yesterday we saw some U-Turns in the market place and it’s not like they dont have further implications. Lets review.
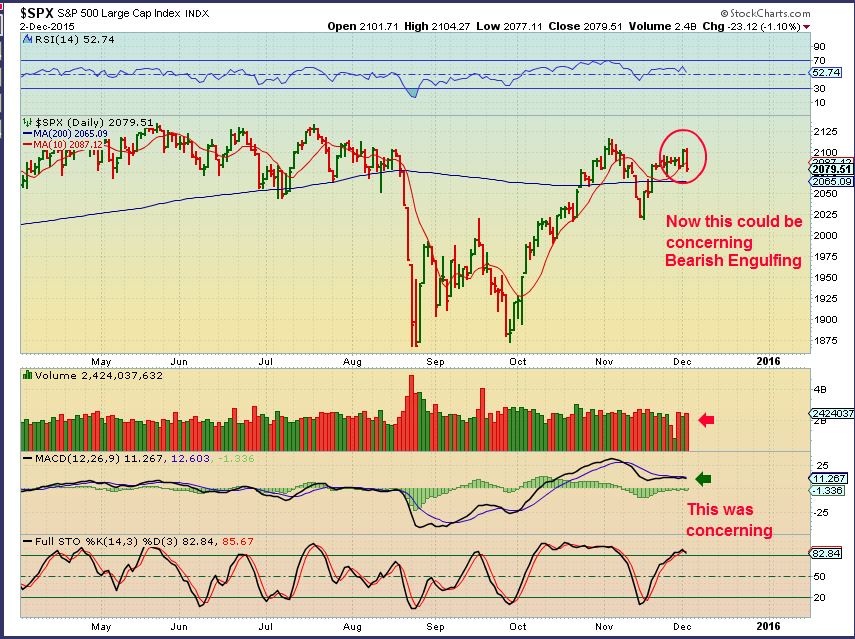
SPX – I recently started pointing out weakness in the rise of the markets and the Dollar. These were from Dec 2.
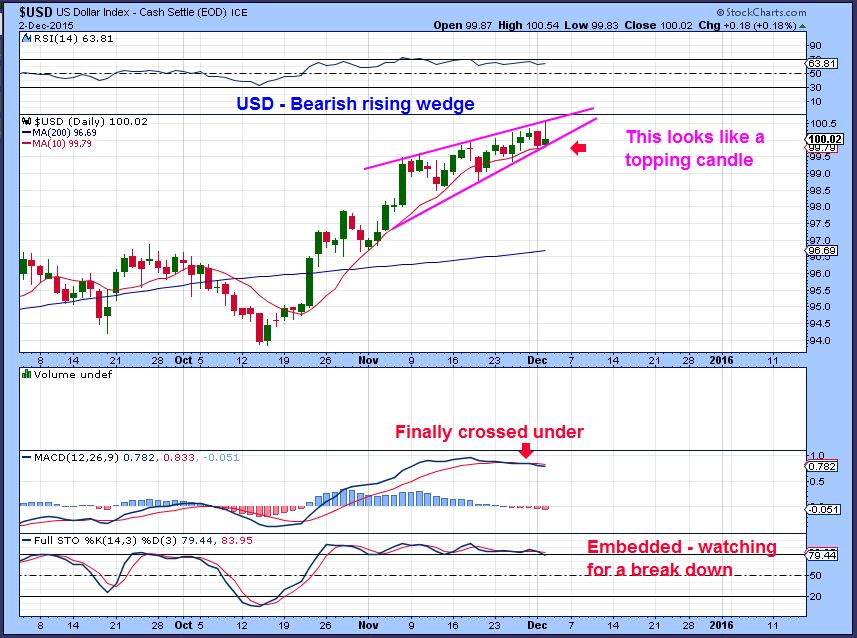
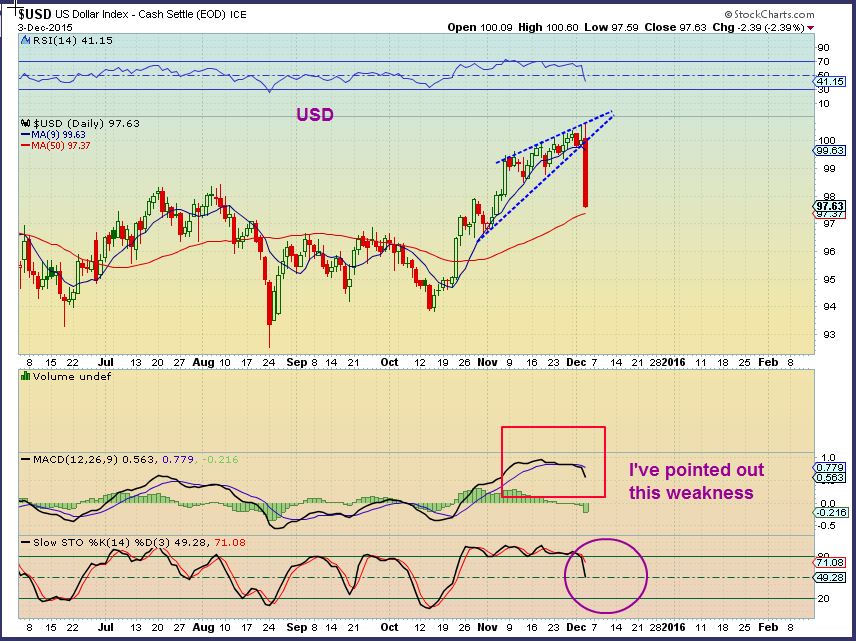
USD Dec 2 – Bearish
Now lets see what happened and discuss what the implications going forward might be…
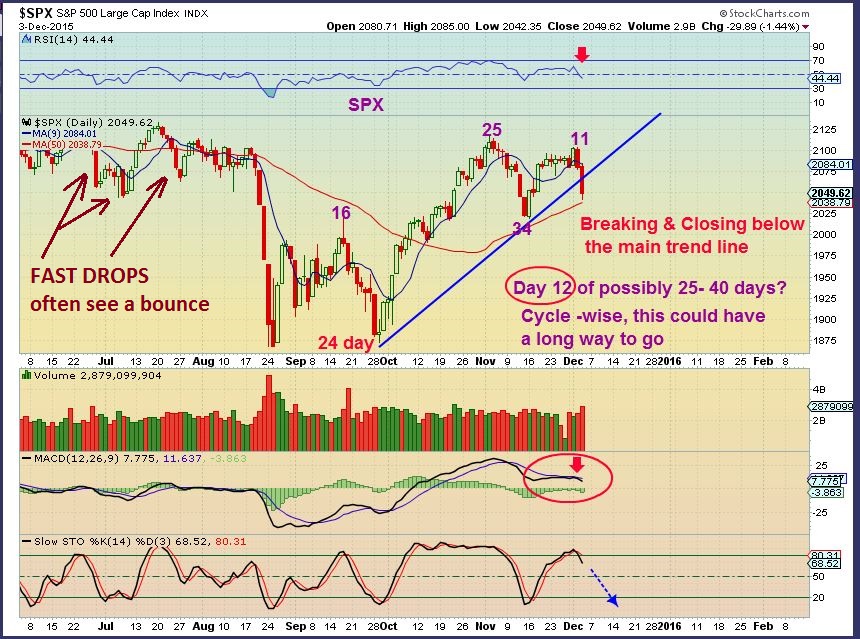
SPX – It is early in the cycle , so this may be the start of a larger break down. The main trend line was taken out, the MACD is crossing downward. Can it bounce? Yes, see the left of the chart in June, July, Aug. We could bounce, go sideways, or just start trending downward. It will be important to see where this is when the Dec Fed Mtg takes place.
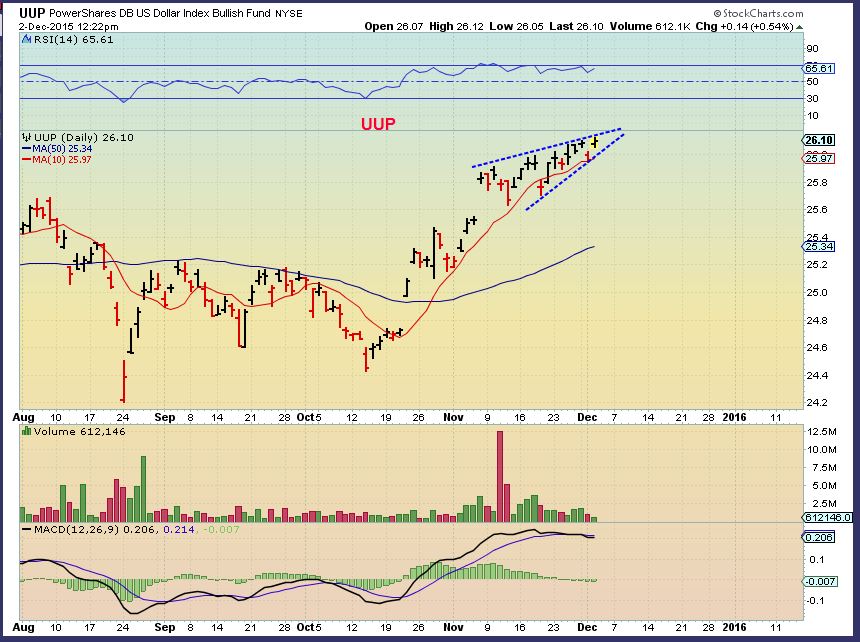
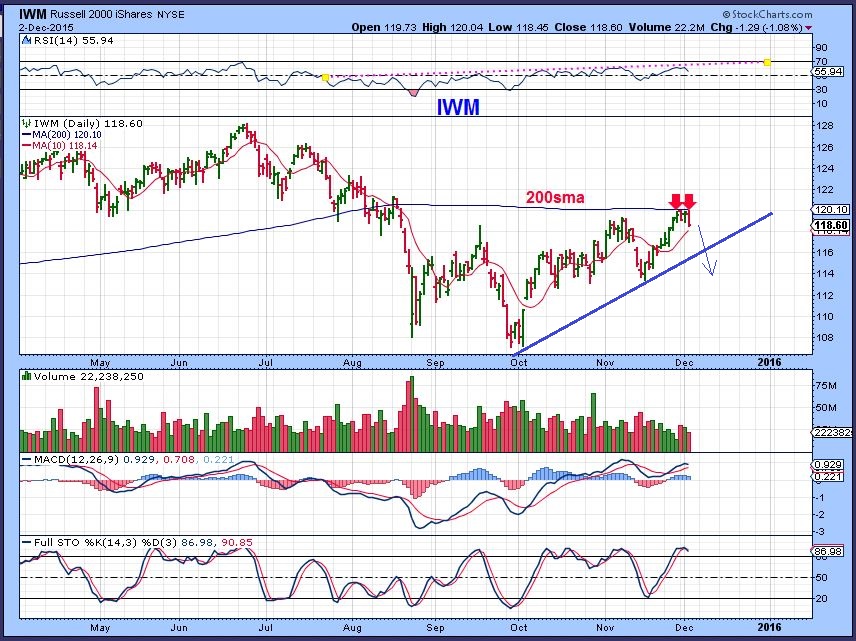
Dec 2, I pointed out the IWM resistance holding back price, and expected more downside.
USD _ The mighty dollar was not stronger than the rising wedge. This kind of drop can be followed by a bounce. I am disappointed that GOLD did not react as strongly to the upside, because what do you think Gold would do with a dollar bounce? More of the same?
 .
.
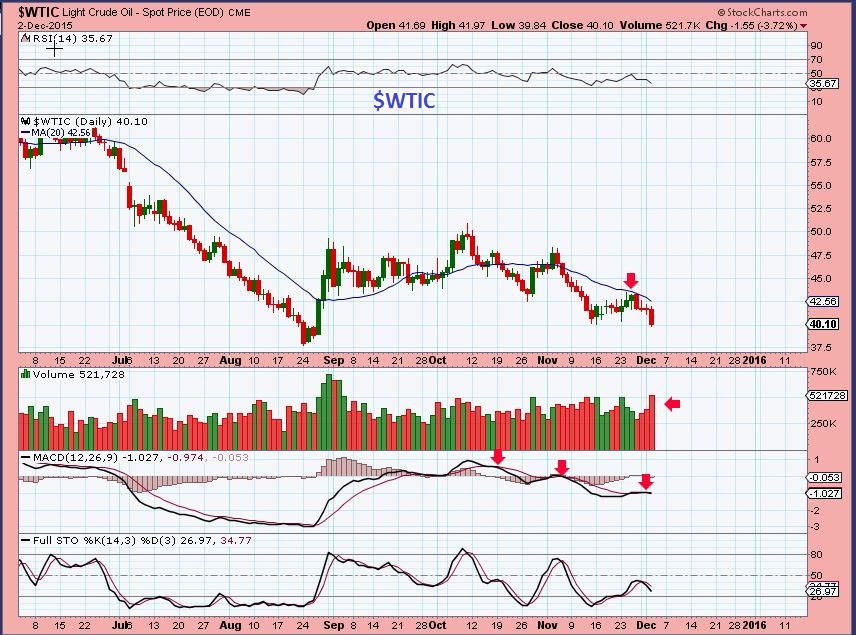
WTIC – I’ve mentioned that OIL ‘Failed” and should trend lower. Dec 2 I showed that the 20sma seemed to cap it recently and the MACD remained weak.. Yesterday may have started a change, but the OPEC MTG will likely decide if any follow through will occur.
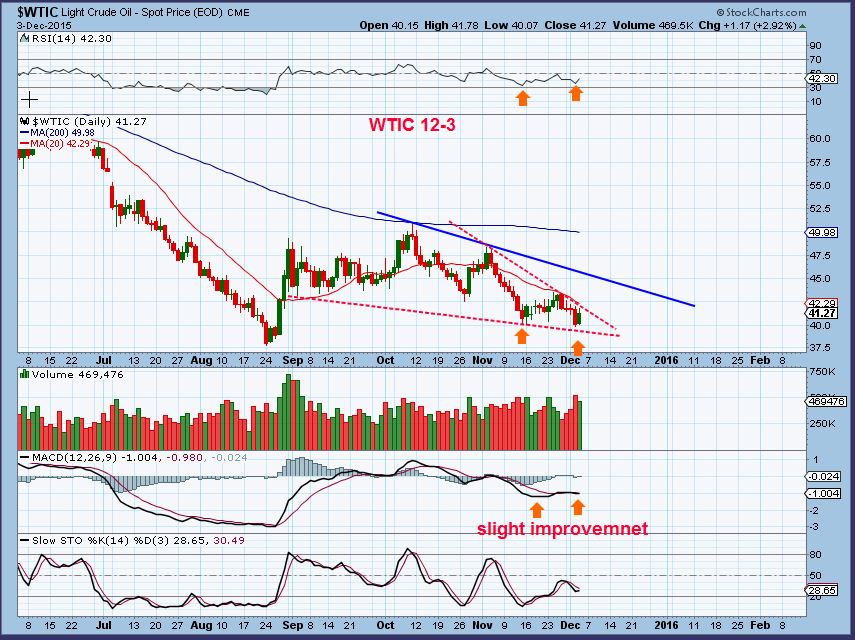
WTIC – Notice a slight divergence and a possible wedge. It is possible that OIL puts in a DCL here and bounces to the blue line, but I am not comfortable playing OIL long or short at this point in the move. This is just an observation at this point. I expected OIL into the 30’s, but now everybody is talking about OIL, so maybe we get a bounce.
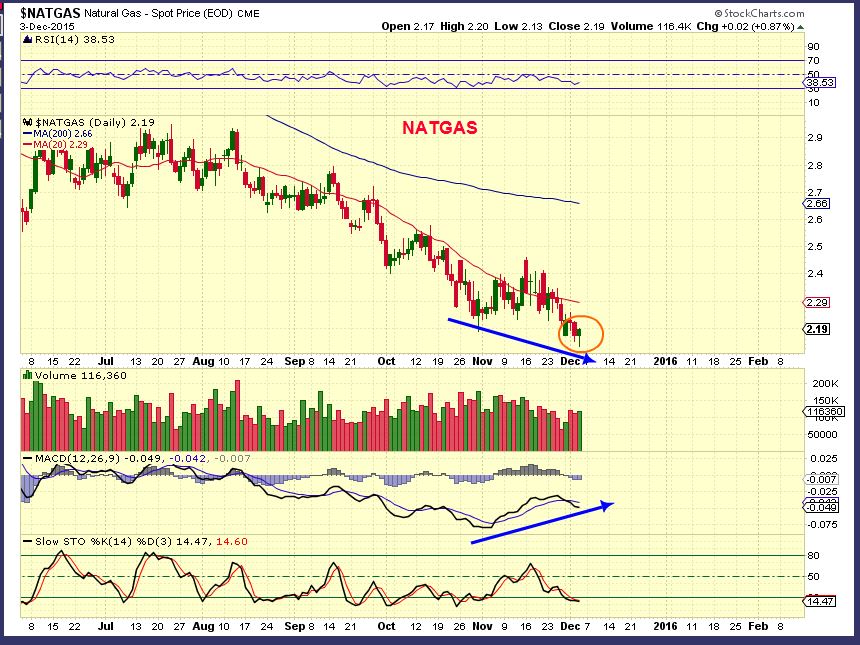
NATGAS – No recommendation, but it put in a reversal Thursday and has strong divergence. I think it may travel higher.
.
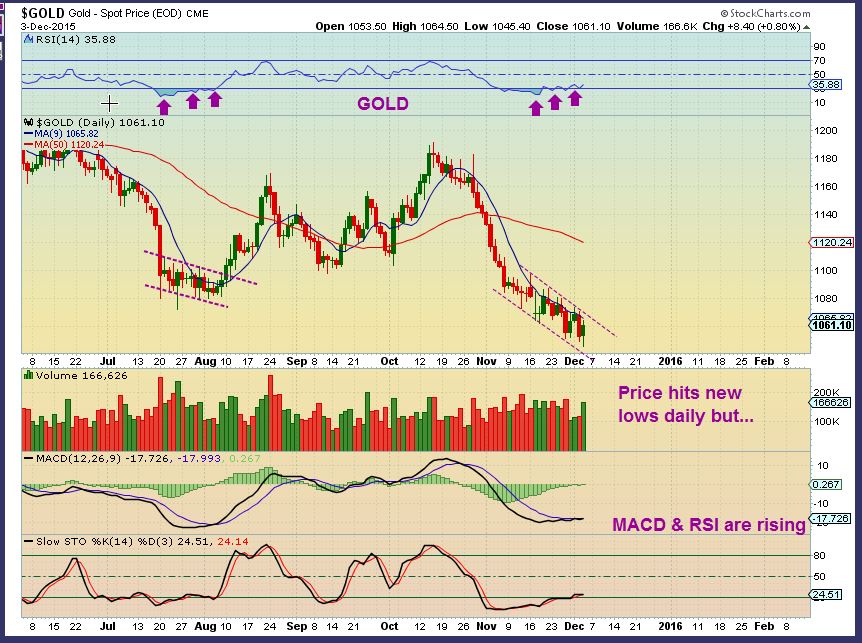
Gold – New lows again and another reversal candle. Divergence is growing, but I was surprised that GOLD didn’t jump higher with the massive Dollar drop. This keeps trending lower. There are similarities between the last ICL and this low.
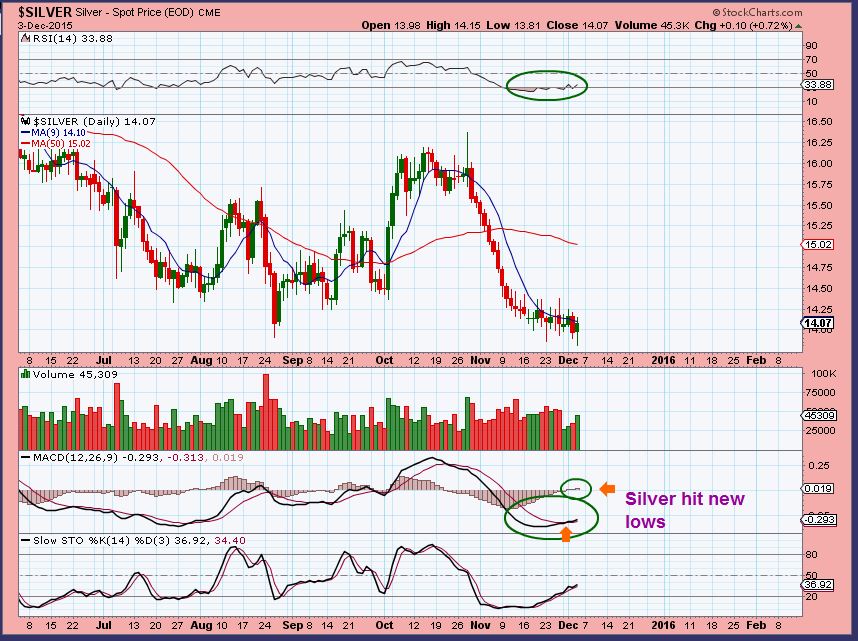
SILVER – Hitting new lows and the MACD HIST went positive
 .
.
.
Before we get to miners I just want to say that GOLD is making new lows, Miners are ignoring it. The COT and smart money positions are more bullish than in the last 14 yrs ( That is 2001). That said : I am going to show both the bullish and bearish possibilities, because anything can happen and we have people here buying leveraged positions. Longer term I think the above mentioned set up is Bullish for a nice strong rally in Precious metals. Pre-FEd Mtg – anything can happen, right?
.
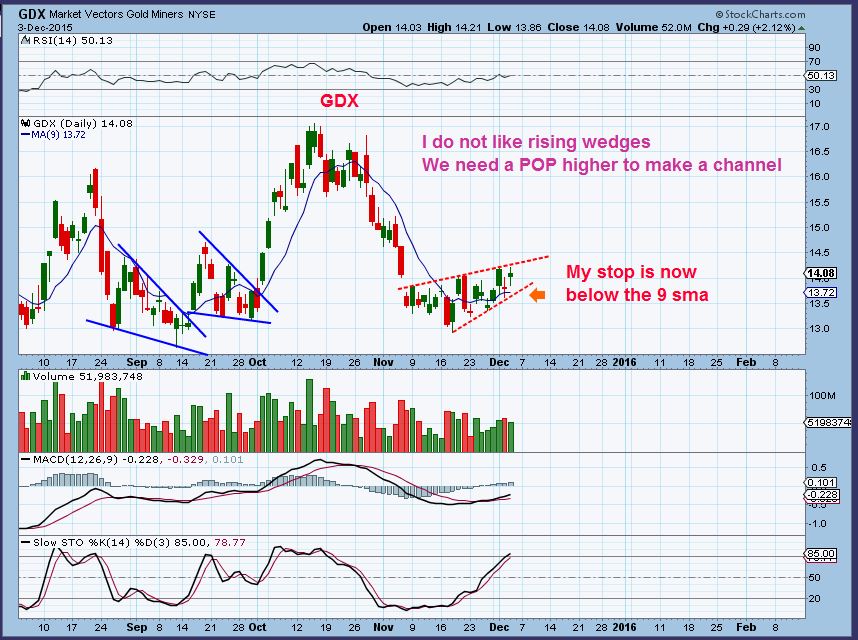
GDX ‘a’- The following observation became important to me when GOLD didnt rocket out of the lows when the dollar slammed down. Watching this move play out, I noticed that the 50sma held price down in the past bounces/ rallies on the left of the chart. I would like to see a move to the 50sma quickly. THAT would make the recent move more of a channel. Why is that important?
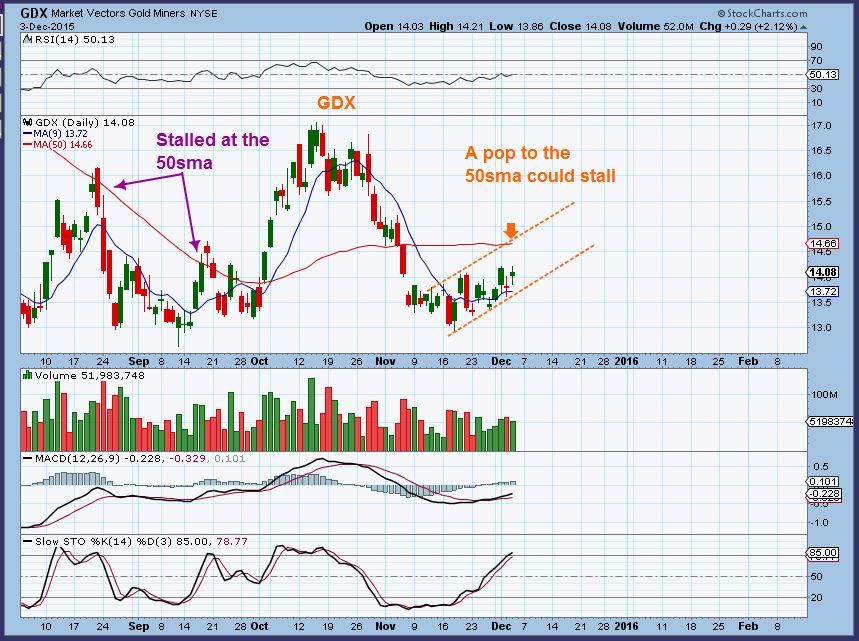
GDX ‘b’ – Not to scare people, but I hate rising wedges. Yes, they can move higher as shown in the above chart and form a channel. We have 8 more days until the FED WED RATE DECISION. Look at the last 8- 10 trading days. Price is in the same area. I’m very interested in seeing where GOLD & MINERS are in 8 more trading days. Setting up to run , or setting up to drop? Longer term, the set up is very bullish.
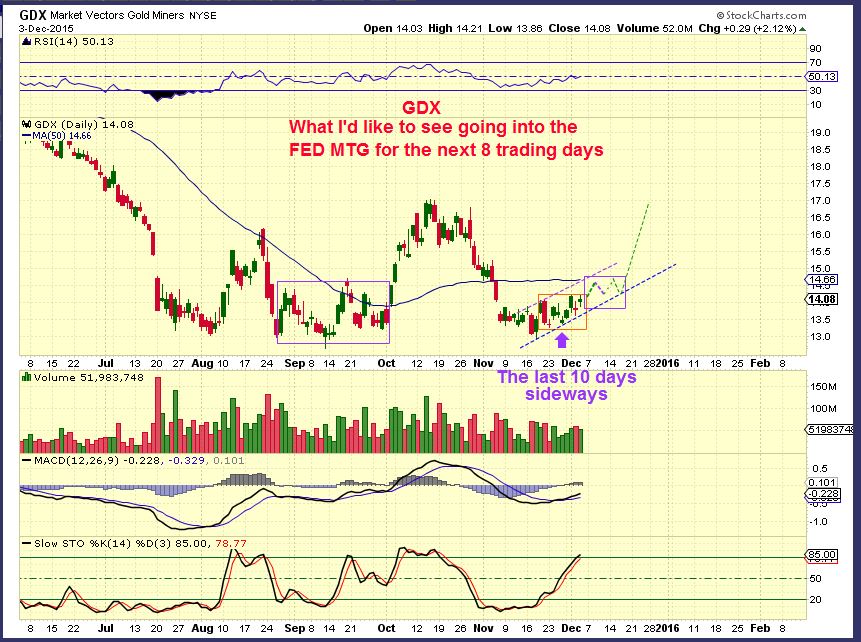
GDX ‘c’ – This is what could happen if the Miners are being bullishly accumulated ahead of the FED. They have just meandered higher over the last 10 days, and we have 8 more until the next FED MTG. This will make people nervous holding positions long going into that mtg, but this sideways type of activity is normal, and sideways movement happened in Sept / Oct at lows. I AM NOT SAYING THIS WILL HAPPEN – It is an idea of what could happen to drive those long or short crazy.
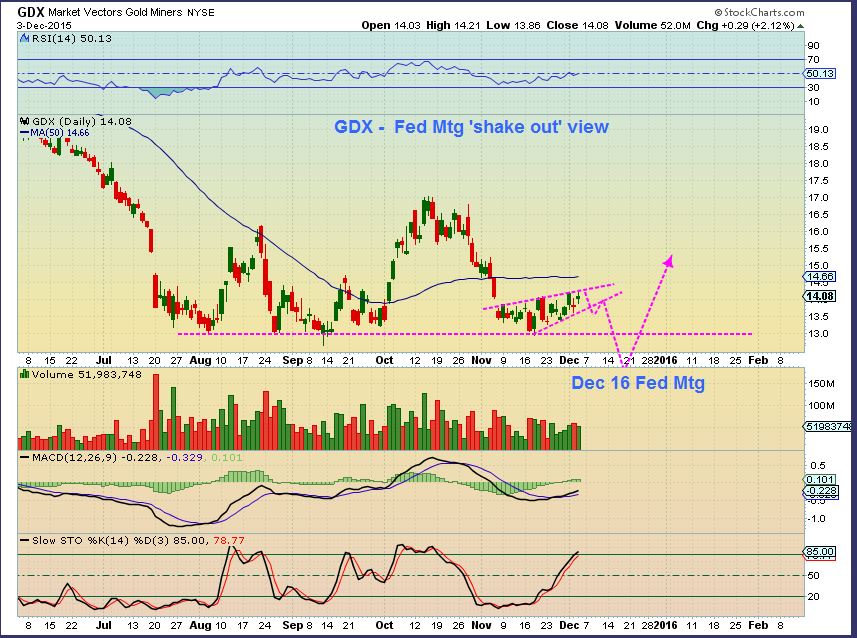
GDX ‘d’ – I have to throw in the dreaded Fed Mtg Shake out view. This would drop everyone off right before a real meaningful rally takes place. The comments section would become very emotional and filled with words and phrases like “Horrible” ” Absolutely ugly” ” I hate Miners” “No one expected this!” “I give up, I’m not buying until…” “remind me never to buy miners near lows” , etc etc etc. May I remind people now of the dangers of high leverage at bottoms. It causes emotions x3 too. 🙂 This would actually feel horrible , look ugly, but be extremely bullish with massive short covering.


Thanks for K.I.S.S. (keeping it sweet & simple) yesterday, Alex – and for the Friday report to keep us on our toes today! LOVE your comment that 3x leverage gives 3X emotions
Hey Cal,
Thx and things look pretty good right now for the follow through in precious metals. Finally 🙂
woop…
and yeah .. what he said.. thanks for the kiss yesterday…
well done Alex
Thank You Marinho! The weekend report should be easier now ; )
The WEDGE pattern in GDX has been broken, and we look more likely to get that channel higher (See both charts in the report above). YAY!
Good call…so close to the 50dma would you wait to add? (hoping your crystal ball is fixed :-))
It’s tricky…this may now just blast through. I personally wouldn’t hesitate to add some and then see what happens.
Do you remember when I pointed out that when the 50sma is flat or rising, it doesnt always hinder price? In the past, it was sloping down and caused a pause, the 50sma is now flat to rising and GDX may break through with ease.
In the past we have seen NUGT up 22% ( so GDX up 6+%) in a day and 10% the next. We may get that here, since GOLD/ SILVER has now come off of the lows.
I repeat : This is a tough call though 🙂
Thx! (as always.)
hi
if you buy something, you better look at GDX and/or gdx stocks
since GDX is stronger than the junior miners / GDXJ
something which is stronger usually goes up more !
Or be selective.
Check out NG, BTG, SA, PPP, NGD, etc
Not bad for moves off of their lows.
yep that’s right-
indeed the stronger ones from GDXJ
ALEX…. as always THANKS.
WEDGE pattern is that GDX-B ????
Could you please place a charts this moment from the GDX?
Kindly greetings.
I did, see above if you sort your comments by ‘newest’
.
refresh to see what I mean
.
YEP….. thanks Alex.
Great work, your wife will be very happy with you !!
aren’t u so clever….
Nice workup on the GDX possibilities, watch the action and hold your horses. Love the 3X emotions, hah!
Thanks Rube – Looks pretty good right now 🙂
Gold & Silver are off of their lows in a nice way (See charts og GLD & SLV)
I just need to point out that the dreaded rising wedge is invalid at this point. The set up should be bullish with GOLD & SILVER coming off of the lows..
.
GDX COULD PAUSE at the 50sma, or burst through.
.
Please refresh for a new chart. Volume looks very promising.
.
Just woke up. Nice to see gold and silver both strongly up after a better than expected jobs report. Question for today is if GDX can get past the 50DMA.
If I had to guess, I’d say that it forms a bull flag on the 15 minute chart underneath, and then maybe takes a stab at it,
Looks like they’re taking a stab right now. Volume on NEM is quite big.
Sold SA Jan15 covered call options – will ride the share price down if this turns out to be just another short covering rally.
Also trying to sell Premier Gold (PG.TO) covered calls, but no takers yet.
F.W.I.W. –
I honestly think that SA is going to break out to new highs. Look at a weekly chart and use the 10ma.
It has bullish Volume and is really strong.
Thanks Alex. I just have small position and looking to add … somewhere.
Nice support on USOIL. UWTI might be a low risk here with a stop at 5.81.
OPEC: No change to production. Just confirmation of how much they are producing.
Seems to me Euro:US$ moe important to price now.
hi
currently it’s a sell off in oil stocks however REN XCO and WG are holding pretty good – so they look like the strongers stocks and should be bought once the selling stops also ok are cppl DO and WTI just to name a few
keep a look at those in the coming time they could be goodies
ray
EGO is in a classic H&S pattern and recovering with a possible $5.82 target. BUT, its lagging others (AUY). Not sure if there are any fundamentals holding this back? Anyone have any news?
https://www.tradingview.com/chart/EGO/XYxV8Kon-EGO/
They have a ruling from the Greek courts coming up on their mine there. That may be holding it back some. I’ve been playing that reverse head and shoulders for awhile.
a lot of hammer candles in oil stocks right now – looks promising XLE looks to hold support around 65
Thx for the heads up – I wasnt even looking at the energy sector.
Just looked at CJES and SGY . Not bad. XLE looks like a H&S though, with a MACD break down.
I’ll have to see how everything closes on this Friday
I think oil looks like death. A few fought back around 11AM only to get recrushed in afternoon trade. I remain hopeful for a good trade soon and an eventual technical reaction move up in crude. But there is absolutely no way the fundamental picture could be worse for crude than it currently is.
hava great weekend friends.. :o)
Jay Gallemore often mentions that when “momentum figures” are around zero with strong price, it usually means short covering more so than longs taking a position.
what ‘momentum figures’? MACD hist?
I’m not exactly sure – I think of them as MACD hist, but it’s likely something “proprietary”.
Well, I’m not sure what that implies to him .
It would seem logical to me to believe that after a deep sell off, most of the initial move out of the lows would be short covering, and then momentum buyers & others would enter later. The early smart money buying can be hidden within the selling, but may trigger the short covering.
What we need is the initial short covering to take it to a level where new longs feel comfortable jumping in to really make a move. That would also hopefully choke the holdover bears that hadn’t yet made their exit.
Have a good weekend all!!
look for an intraday dust trade on monday — http://screencast.com/t/0KdwX5QSdcJ
Newmont and Barrick were #1 and 2 in best performing large cap stocks this week. Gold Corp was #5!
Well the huge rise in Euro on Thursday gad little impact on commodities immediately. PMs of course positively reacted Friday.
Oil it seems to me was digesting OPEC.
Us$ started sizeable correction via a major double top (see last March).
This could also impact Yen to strengthen and stocks to weaken.
On verra.
Saturday Silliness!
I’ll refrain from posting an image which may “freak” some people out, but it can be seen here:
http://www.greaterfool.ca/2015/12/04/the-predicament/
Naked short trying to avoid an oncoming commodity bull comes to mind.
suited up & playn around in the batcave… still watching this for SA .. SOG remember that old chart? ;o)
https://www.tradingview.com/x/iftyyLpl/