
She’s Breaking Down…How Bad Is It?
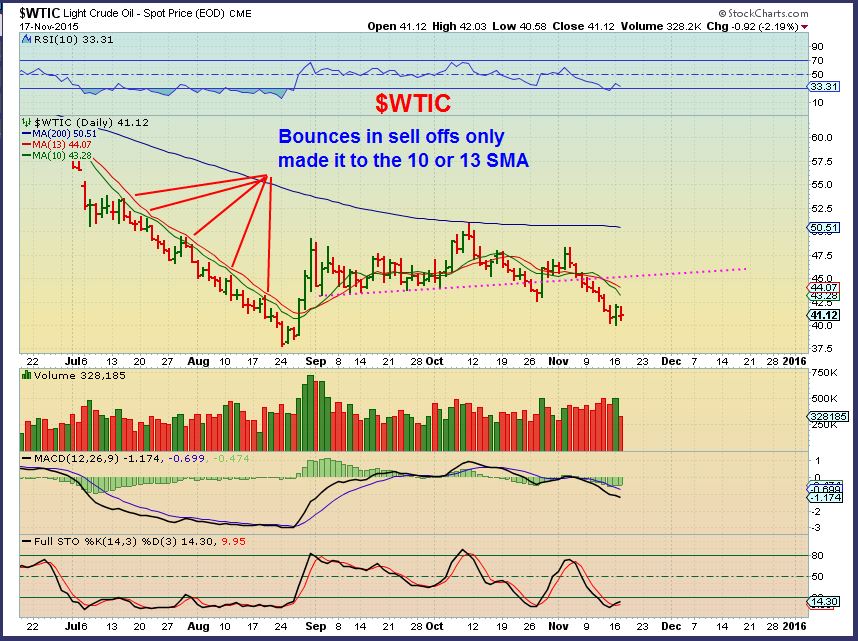
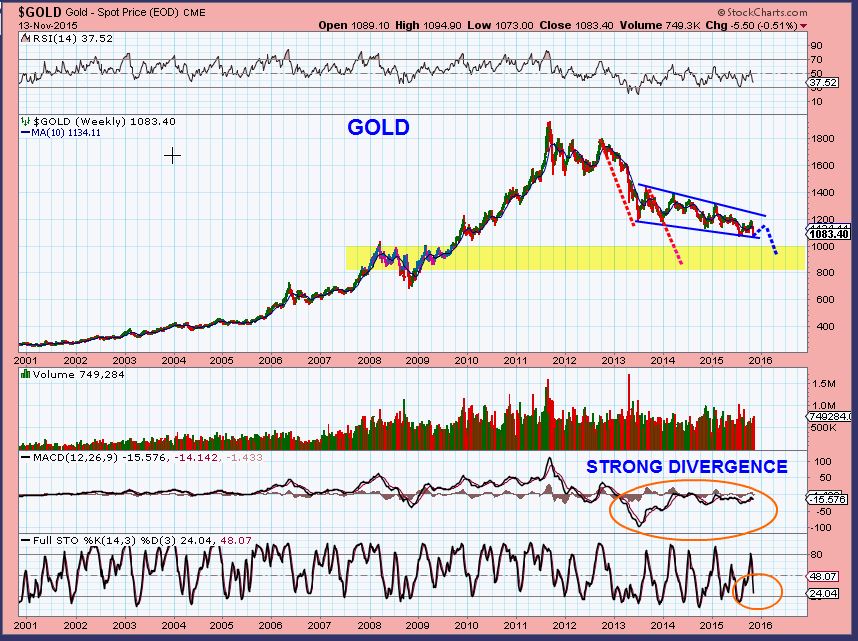
We saw GOLD break to new yearly lows yesterday and I read in several different places that people were going short for the drop to below $1000 (Again). We will discuss why I do not agree that this is the time to be going short. NATGAS remains interesting and OIL and Energy Stocks continue to have my attention too, so First lets look at a few other charts.
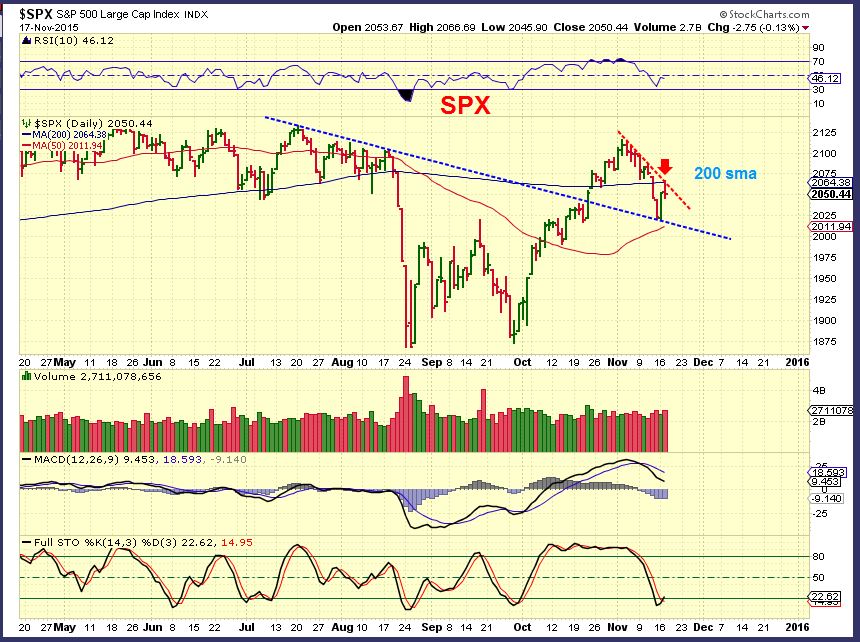
SPX – The markets stalled at the 200sma and a down trend line that I mentioned earlier. We could drop to the 50sma, but timing wise, we are due to go higher soon.This may be a pause before breaking above that 200sma.
The USD has been strong , but it may be due for a rest. Yesterday was a short term topping or reversal candle, but it is not a strongly reliable one. If the dollar is due for a rest, what might that do for the commodities that are now being heavily shorted?
WTIC – I expected a small bounce in Oils downtrend and drew this on Nov 13. This is NOT exactly the path that I think oil will take, it is basically drawn to show that I do not expect oil to drop straight down.
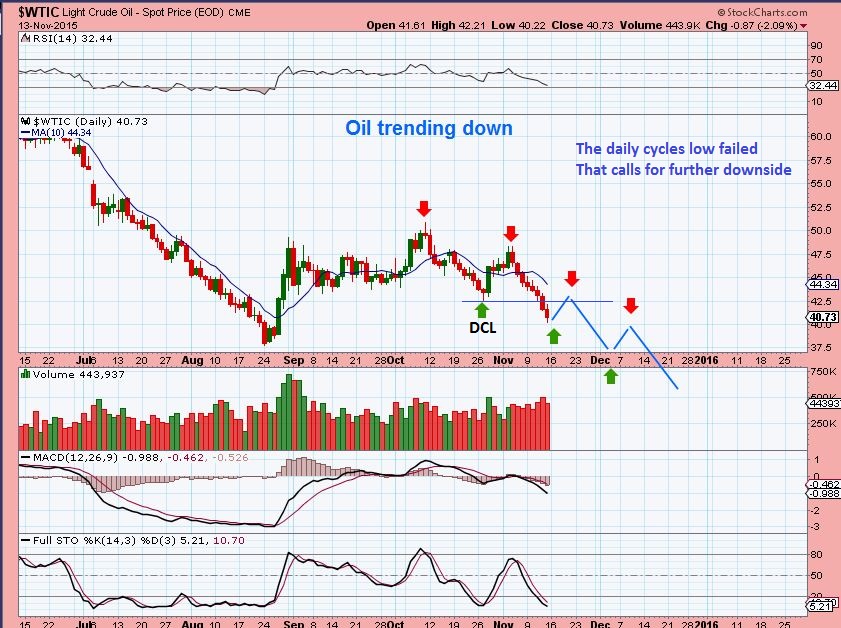
Lets look at OIL in possibly a more accurate sell off. In the last sell off, notice that OIL struggled , unable to get above the 13sma. You MIGHT see that again. With a small a-b-c down finished, I expected a bounce in OIL , but notice that those can also just move sideways to that 13sma. I thought that we could bounce to the MAGENTA line when the 13 sma was there, now we will have to see if OIL can really get that high as time draws the moving averages down. That MAGENTA line could be drawn from Sept lows to Oct lows. We are almost there now.
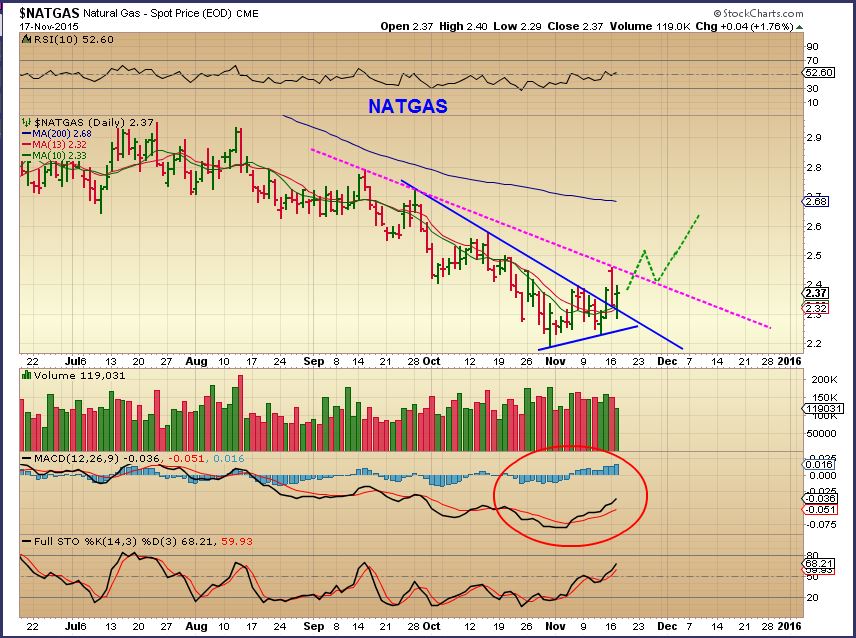
NATGAS – I drew this Monday expecting a possible quick drop & reversal. We may have completed that with yesterdays drop & Reversal.
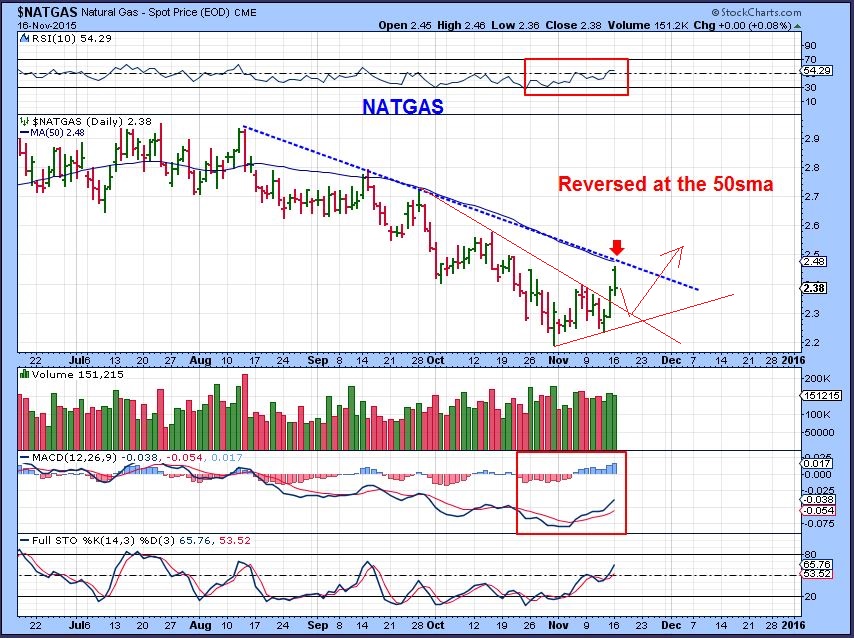
Midday yesterday I noticed that NATGAS did that drop & reversed higher. I captured this chart of a perfect back test. As a day Trader, this is exactly what I would look for and I’d buy that reversal on the red line with a stop just under the red line.
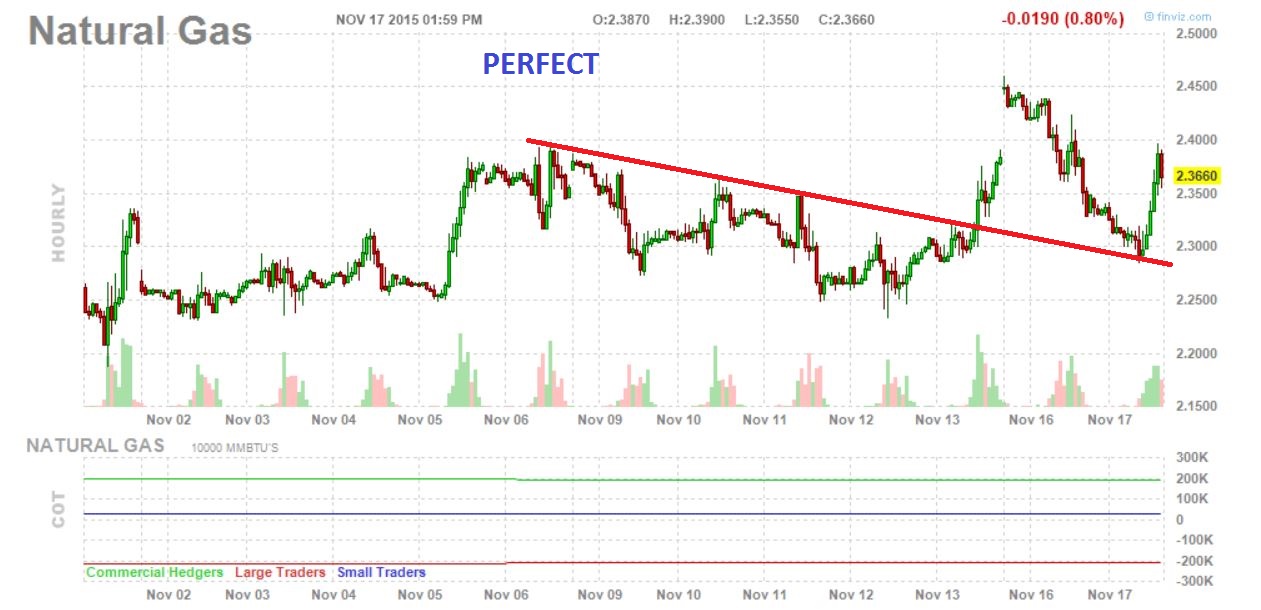
As a medium term trader, I would still be in NATGAS. That would not have shook me out, although I would possibly raise my stops. It is tough because NATGAS is not rocketing higher, it is mostly sideways at this point. Thursdays have been rough on NATGAS at times with the inventory reports.
GOLD SILVER & MINERS
This is the big story. With Yesterdays break down in Gold ( breaking the July lows and breaking to new yearly lows), many have gone short expecting their crash to $1000 to finally come in capitulation fashion. I believe that this will not crescendo into a crash mode at this point, so I would not recommend going short here.
.
2 possible ideas on my mind – we should quickly review both since we cannot tell at this point which one will occur.
I have mentioned both of these ideas already, this is a review.
.
1. We will either find a dcl (Daily cycle low) soon and bounce, but that will roll over, followed by another dip lower into final lows-
or
2. We will put in that deep trade-able low (ICL) and rapidly move higher.
.
( 1. From above ) Timing-wise I wouldn’t be shorting because a daily cycle low is due. IF we only get that 4th daily cycle… That would produce a “Bounce” and my chart from the weekend report would play out like this. You could then short that bounce.
( 2. From above ) I drew this in my Nov 4th report. An ICL in mid November would match what we have seen recently. ICL’s have been arriving faster at 4 month intervals in very steep drops.
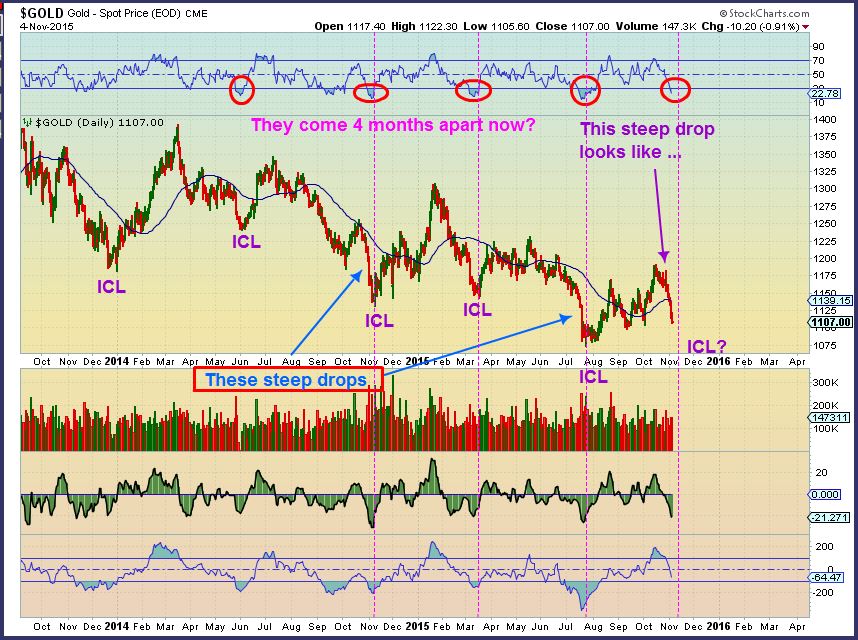
Yesterday GOLD broke to new fresh lows. You can see that we are in the timing that a low is due to be put in place at day 32. It could be that ICL and we could then move higher for weeks. Now that many are shorting and the COT has been improving, this could be the case ( Today is the release of Fed Minutes). We wont really know until the move starts unfolding. A 4th daily cycle would become weak and roll over as left translated by day 5-8 most likely.

GOLD CURRENTLY – We saw GOLD undercut last night and reverse higher. That could be the “test of the lows”. Lets see if it holds.
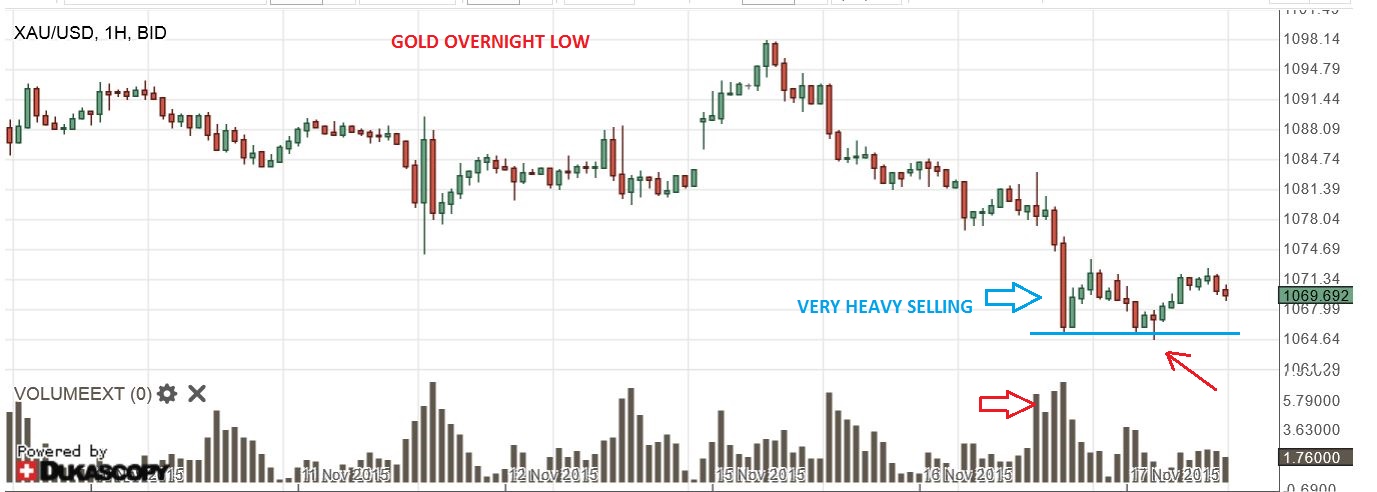
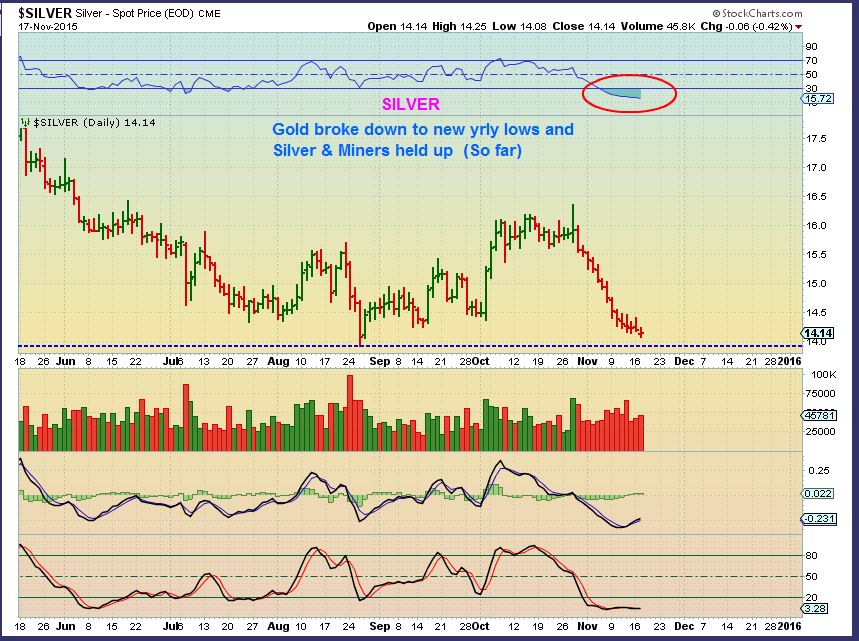
As GOLD broke down to new yrly lows, it is good to note that both SILVER & THE MINERS did NOT break to new lows (yet) . Silver & Miners usually lead moves down and up. Is this a sign of strength in the lead sectors, or will they play catch up?
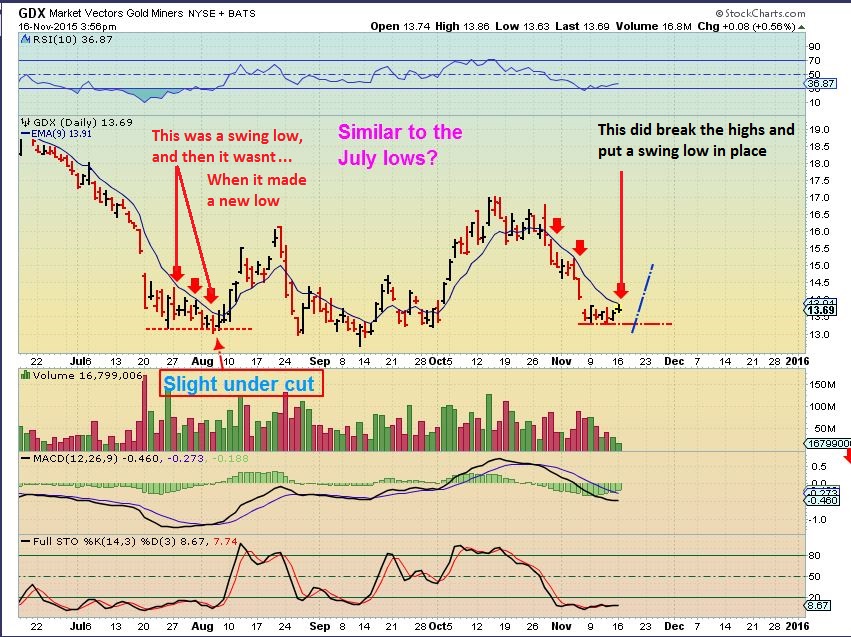
On Yesterdays chart of GDX , I mentioned how we had a swing low in place in July, and then it got undercut. I pointed that out so that if it happens again, we have expected that possibility and it doesnt surprise us . We did undercut lows yesterday too. Lets review.
The chart from Monday night – read what was written on the left side about that low being undercut. Price was rejected at the 9 EMA.
Another chart of GDX showed these wedges. I wrote in my report that these can drop and test the break out too.
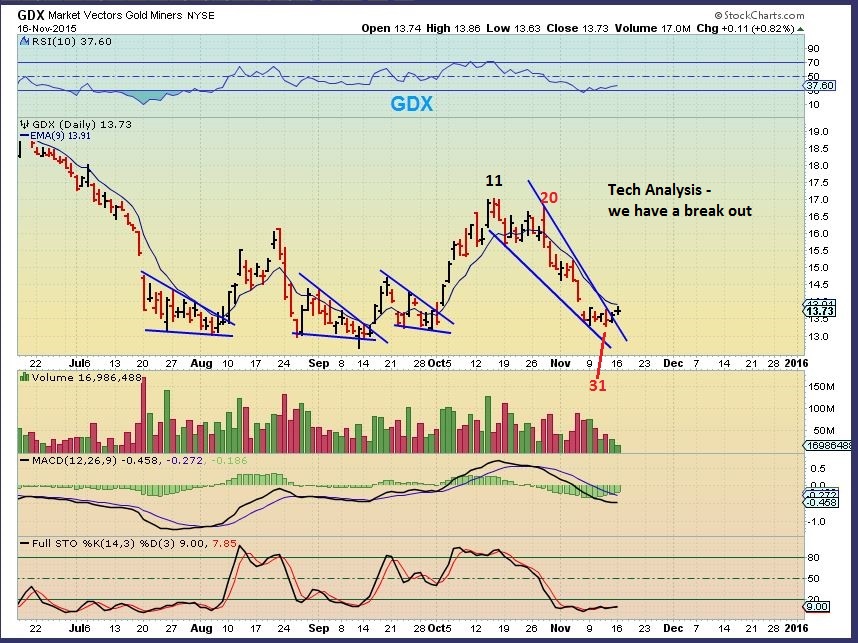
GDX yesterday – GDX can drop further, but on day 33 I personally would not be shorting Miners now.
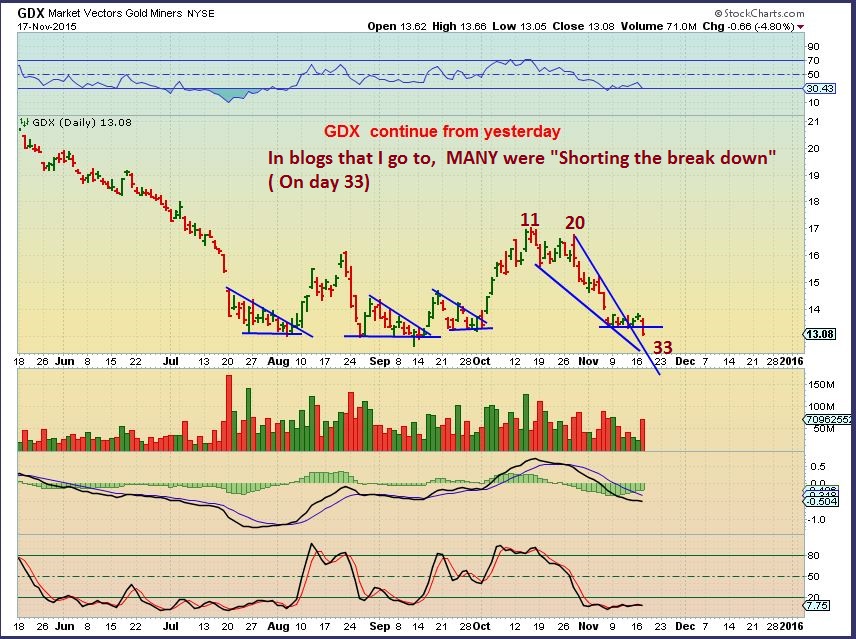
In conclusion – I hear from many traders here, and I know that some were buying yesterday anticipating a low ( long Miners), and other short term Traders will try to buy a reversal / swing low when Miners begin to bounce. With that , I would keep the more bearish out look in the back of your mind. You may want to try to catch the lows for a trade , but remember that if this is a 4th daily cycle, it will roll over soon ( And DUST may be the trade at that point).
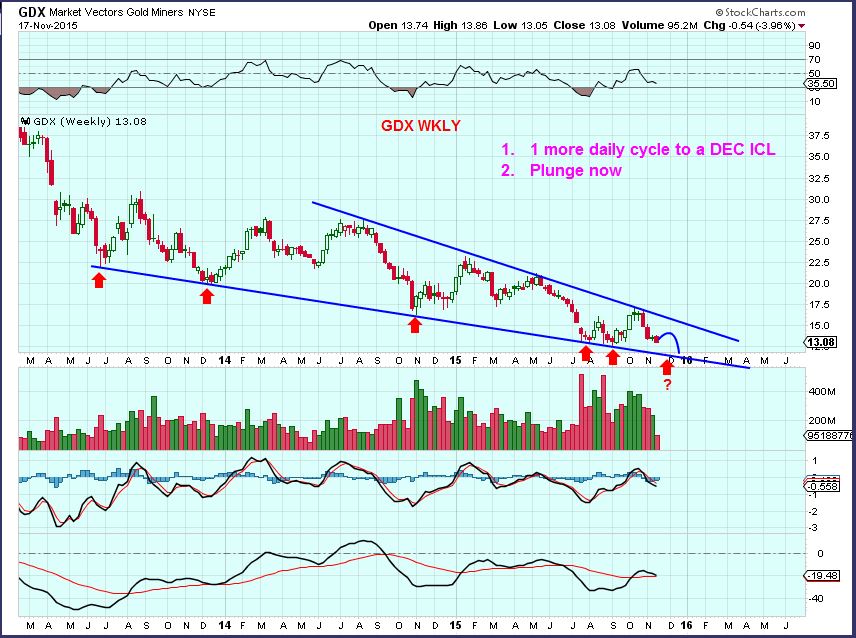
What would that look like and does it fit the bigger picture of GDX?? This is the GDX WKLY. We could do a quick plunge now to the lower trend line, or bounce and tag it later. A bounce & Tag would lead to the Dec Fed Mtg.
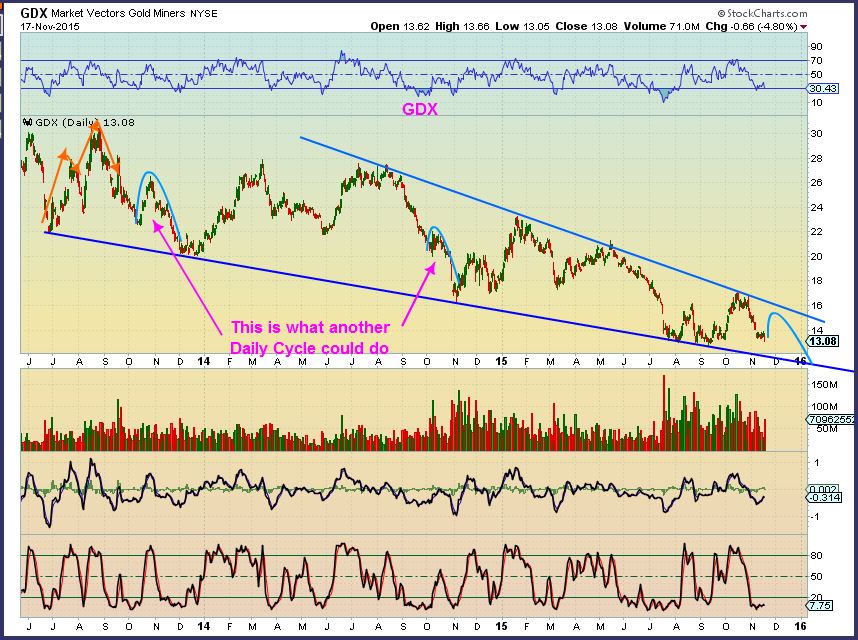
GDX DAILY Longer term – This view is showing how another daily cycle would likely unfold, and I’ve shown past late daily cycles in Blue.
Today the FED minutes are to be released. On that Fed Wednesday Gold reversed lower quickly and started its sell off. We had volatility. Wouldn’t it seem odd that the release of the minutes would now cause a reversal and a run higher? We are due for a low though, and odd things do happen in these markets. In my head – another possibility with the release of the Fed Minutes is that we get a quick slam down to lows ( 1 or 2 days). That would match the reaction that we got on that Fed Wednesday. That also fits the above 2 charts for miners, bringing the price to the lower trend line in crash form. It also might drop GOLD to the 1033 support area discussed last summer.
So at this point I am advising patience to see what happens after the Fed Minutes are released. If we are putting in an ICL, you do not need to catch the lows the minute that they happen, although experienced traders can just use my reports as a guide of possibilities to enhance their own trading style. As you can see from this report, there are still a number of possibilities that lie immediately ahead. Best wishes!

URA ETF up 100%???
I’m not seeing it
https://www.tradingview.com/x/Z7HOXlSH/
I dont know what that is all about, but it closed at $13.56 according to 2 other charting services
so it’s real?
No- It closed at that $13.56 yesterday . Use a different charting service
http://bigcharts.marketwatch.com/advchart/frames/frames.asp?show=&insttype=Fund&symb=ura&x=18&y=18&time=7&startdate=1%2F4%2F1999&enddate=11%2F18%2F2015&freq=1&compidx=aaaaa%3A0&comptemptext=&comp=none&ma=1&maval=9&uf=0&lf=268435456&lf2=4&lf3=32&type=2&style=320&size=3&timeFrameToggle=false&compareToToggle=false&indicatorsToggle=false&chartStyleToggle=false&state=15
sorry to be a pain but i’ve got basically no move on stockcharts and 100% on tradingview Am I lookinf at the same thing?
Did you click on my link above.
Trading view is wrong. Stock charts is correct ( It closed there yesterday) . Click on the link above & you’ll see another charting service matches stockcharts.
Basically what I have been saying is….Trading view is not accurate.
indeed, manyb thx. reverse stock split confirmed on web
PAL & NXE are stronger ones
meant pdn and not pal : )
JD,
URA 1 for 2 stock split this morning.
I own it and received a notice.
ah, got it thank you
isn’t that the opposite ti what normally happens with etfs that have gone down a lot? Don’t they normally do 2 or 5 for 1 for etc, as opposed to 1 for 2 or 5?
is there value in this? seems to me the massive waterfall ended 2012 but has been drifting down ever since. technicals suggest the end of the fall is near but can still be weeks or months
what do you think?
Well …… I have been building a position in URA the last few months for a Very Long Term investment. I don’t think Nuclear Power is going away any time soon IMHO.
100% agreed and I upvoted your comment. Builidng long term positions in crashed assets is a great strategy and I’d love to hear more of them on twitter and blogs etc
http://www.prnewswire.com/news-releases/global-x-funds-announces-reverse-share-splits-for-five-etfs-300170550.html
They split SIL too – I didnt know that .
Alex,
In reference to Oil, I still think “respectfully” Oil might have had a 60 day extended DCL but if WITC falls below 40.06 and especially 37.75 I will concede to your opinion and hedge my oil junior portfolio. Just a thought fwiw.
Hey Ken,
I’m open minded and open to anything when it comes to these crazy markets, but …
But your dead wrong and from this point on – I’ll never speak to you again!
(J/K) 🙂
Lol……Hedging now !
Airlines : Energy. Refresh
What’s the thinking behind a REVERSE stock split when the stock price has crashed?
I can understand the “crooks” who split the likes of UVXY etc
Two reasons for a reverse split from investopedia.
In this case, reason #2 seems to be the more likely.
1 – In the vast majority of cases, a reverse split is undertaken to fulfill exchange listing requirements. An exchange generally specifies a minimum bid price for a stock to be listed. If the stock falls below this bid price, it risks being delisted.
2 – A secondary benefit of a reverse split is that by reducing the shares
outstanding and share float, the stock becomes harder to borrow, making
it difficult for short sellers to short the stock.
Read more: Reverse Stock Split Definition | Investopedia http://www.investopedia.com/terms/r/reversesplit.asp#ixzz3rrRW9Yvr
thx a bunch. don;t really see either in URA. Interesting nonetheless
DQ – Earnings this morning and they had some nice increases in various areas. Nice Pop and good volume relatively speaking.
giggle…
like to keep an eye on VSLR as well…
Initial response to minutes (which were dovish – quelle surprise!):
Euro picks up, oil and silver do too, as does TLT
Chek out this ride 🙂 Personally I think it may end bullishly.
(GDX 3 day chart and the last electro cardiogram part was the minutes release )
.
Refresh
.
.
Indeed. Qu’est-ce que c’est?
Seems to me Euro has still a good prob of getting back above 1.08. Above 1.09 would be super bullish for it, commodities and USTs. On verra.
And the dollar is due for a cycle high. A drop in the dollar would help all cases. ( I am speaking short term for now, until clarity occurs for the longer term).
Well Euro is basically opposite of US$.
What’s the chart of?
GDX 3 day 5 minute
That’s confused me Alex. I have GDX priced around $13 rather than $23!!?
Oh sorry…Ur right
I must have switched to NUGT….I’ve been eyeing NUGT, GDX, GDXJ, JNUG, GLD, SLV, etc etc
No problem. Just threw me. The pattern looked right but the price didn’t!! Lol
so did U jumped on nugt or jnug? or are U waiting ?
Well…..
I trade for a living and am in front of the screen when I need to be, so I bought the break up above $22 on NUGT with the high volume pop ( See the NUGT chart refresh). It was a small wedge pattern with a strong volume break out . Now I just ride it
.
ok – got in myself at 23.13 –
any exit on your mind ?
suppose this is only a few days good before we see the final decline????
Sweet..ur up almost $1.50 as I write 🙂
SO far it could be a decent burst out of the lows, because many were going short yesterday. I will hold on a for a few days probably and see how it looks.
If you scroll back up to the gdx chart with wedges in the report… look back at the last few times we had reversals at lows, the next couple of days were higher and then it turned back down, so I may play it that way.
It’s hard to say not knowing how this will move, but maybe I’ll be looking at it Friday with a view toward selling 1/2? The odd part is, we wont even have a swing low in place until possibly tomorrow.
Nice entry, Ray!
sweetness
Ok, THIS time it’s GDX 15 minute. It looks like an inverse H&S on a 5 minute, and on the 15 minute it looks like GDX wants to build some energy and break above the recent break down.
As a trader I would buy that 🙂
.
I do think today was the buy in SA.
Nice reversal again just a bit above the 50sma
Just in case anyone who is looking at GDX finds this useful, this is my 1 hour chart (price 20 mins delayed). The live price is currently testing the (green) 50 ema. As someone who is looking for medium term rather than short term trades I’m looking for an element of trend development before I climb on board. For me this is a close above my 50 ema on my 1 hour chart, so not there yet. Some VERY similar developments to the last two lows in Aug and Sep so hopefully just a matter of time for a buy signal (for me at least). It’s worth noting that at the two prior lows we did get quite a few hours of hesitation around the 50 ema before breaking clear, so we may see some backing and filling over the next day or so before breaking clear. I know some are already on board and likely making a nice turn but for more conservative traders I would argue we are in no way too late to join the party but as always with an appropriate stop loss. Good trading to all. 🙂
Alex, really appreciate the clarity today. Sometimes there are so many possibilities that it is hard to take the right trade b/c this might happen or instead something else, etc. Really feel like we have a playback on PMs regardless of what curve the market throws at us. Excellent stuff!
Long SPY, short volatility (XIV), long nat gas, some energy languishing. PMs no position.