
Free Falling
Count the Green days vs the Red days in Gold for the past 2 weeks, and you could say that it has been in free fall for a bit. We’ll discuss that after a market review.
The SPX has been moving rapidly higher and recovering from the August – September sell off quickly. Since the former highs could offer resistance, we may see a drop with the jobs report .
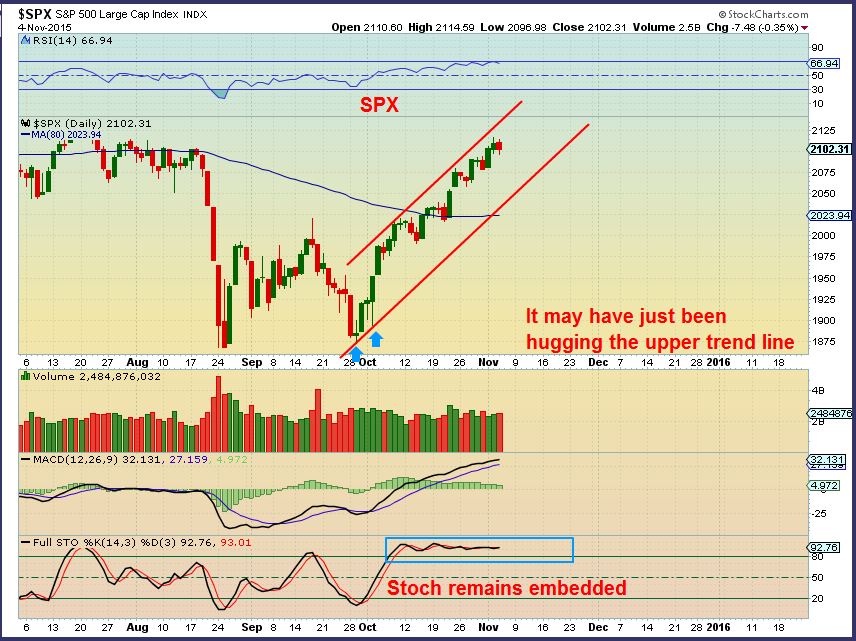
Now I want to show you a chart of the SPX that really looks like a drop could come soon.
We have all seen what happens to the Bearish rising wedge, and this may be one as we approach former highs. We are heading into the jobs report . I see 2 scenarios as likely …
-
We get a brief burst higher to new highs to suck in the Bulls and then drop into a dcl.
-
The daily cycle is late, we may go higher today and just drop on the Jobs report.
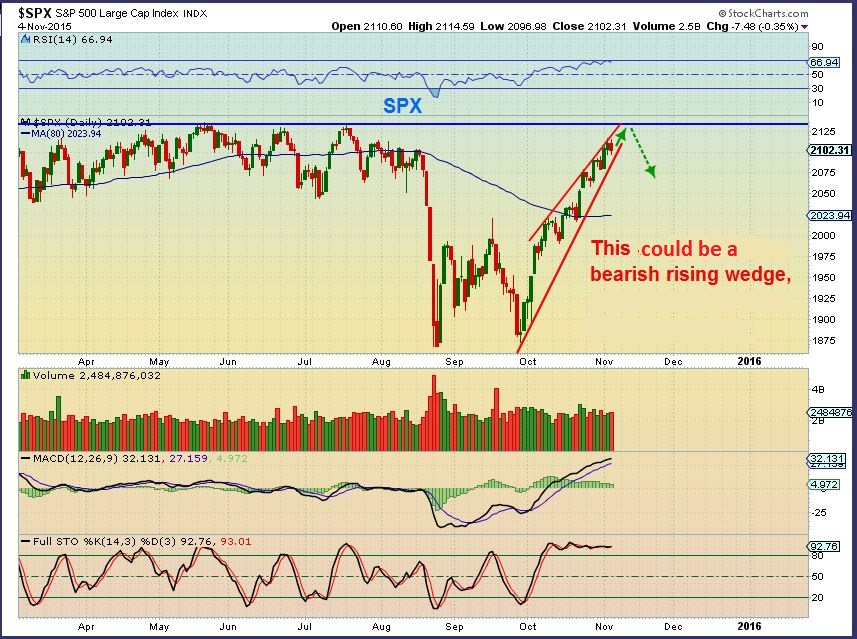
I’m not saying that the run is done, just that we could see a normal pullback after the jobs report is released. We still may be seeing the blow off top type parabolic move discussed recently.
.
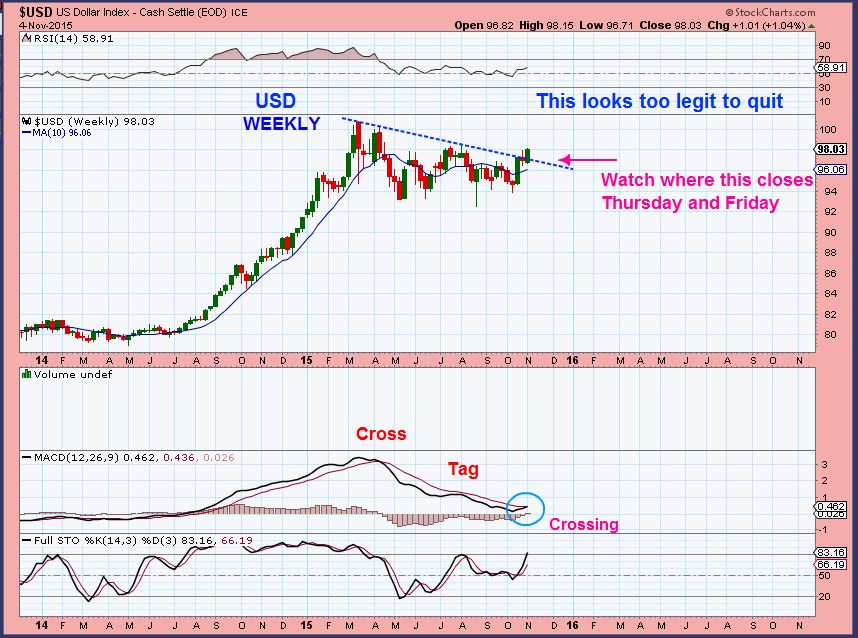
USD – The jobs report could affect the weekly charts close, but so far the Dollar has a break out.
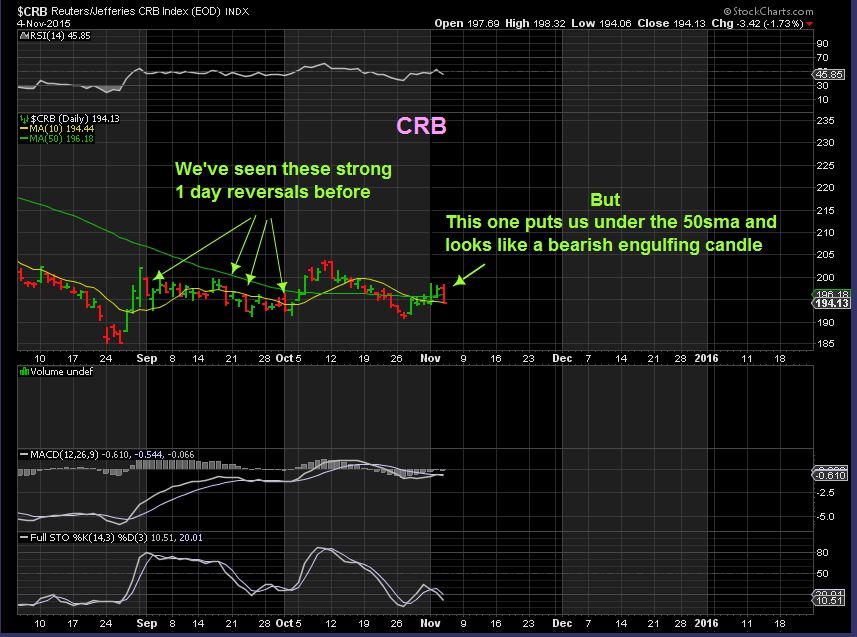
The CRB – I dont like the drop on this chart. We’ve seen 1 day drops in the past and recovered, but this dropped below the 50sma and the run higher has been more of a sideways move. It would be too easy to break to new lows, so it should be monitored.
WTIC – Oils drop wasn’t as concerning at this point, since nothing was violated. Price remains above the 10 & 50sma, but the volume was a bit too heavy for my liking. I do not want to see follow through below the 50sma ($45.83 currently).
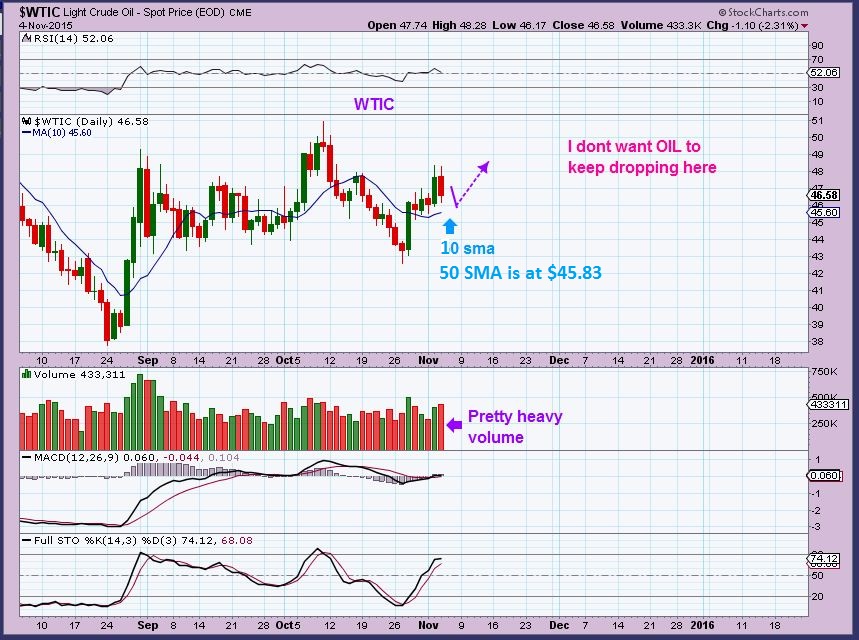
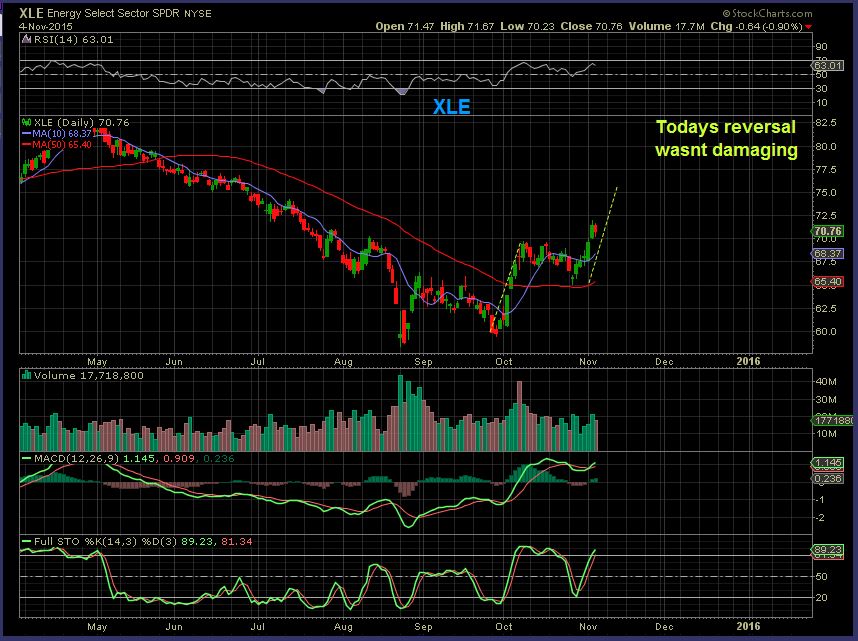
XLE – The XLE still looks strong at this point.
GOLD, SILVER, & MINERS
We expect selling into a Daily Cycle Low (DCL) after a period of time. When the daily cycle gets into the 20 day plus time period, we look for the drop. Miners have held up recently , so the drop seemed normal in Gold, but after returning home and really looking things over I see something else may be occurring. One of the readers here asked me, “Do you think this is a DCL or an ICL?”. Thanks for asking D.P. Miners were holding up so well that I assumed its is a normal daily cycle low (DCL), but I thought about it a bit more and want to point out a few things.
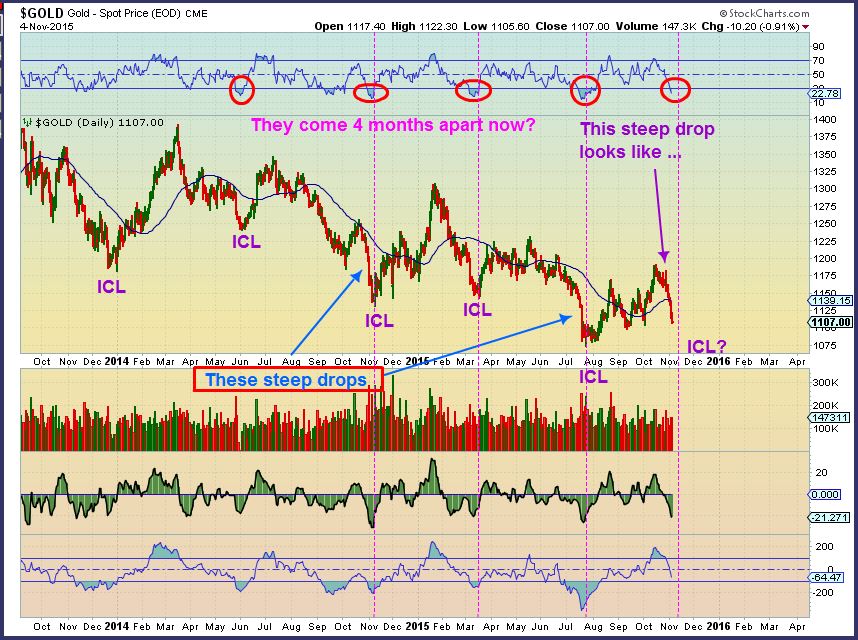
I used to point out that ICLs (Deep trade-able lows) came along about every 6 months. Lately we see them every 4 months or so. Conditions in Gold now mirror prior ICLs. It has been almost 4 months since the July lows. Note: Most were not V-Bottoms, they bounced and did a final slam at lows (jobs report?).
Do you recall me mentioning that ” WHEN GOLD FORMS A TRIANGLE, CYCLE COUNTS GET BLURRY TO SOME”? I have been saying that there were signs of a short 2nd daily cycle and that we are on the 3rd daily cycle. ICL’s CAN & HAVE occurred in the 3rd daily cycle.
.
-
We are in a 3rd daily cycle and could get an ICL
-
if we bounce & have another Daily Cycle, I think the July lows get taken out and the Bear continues.
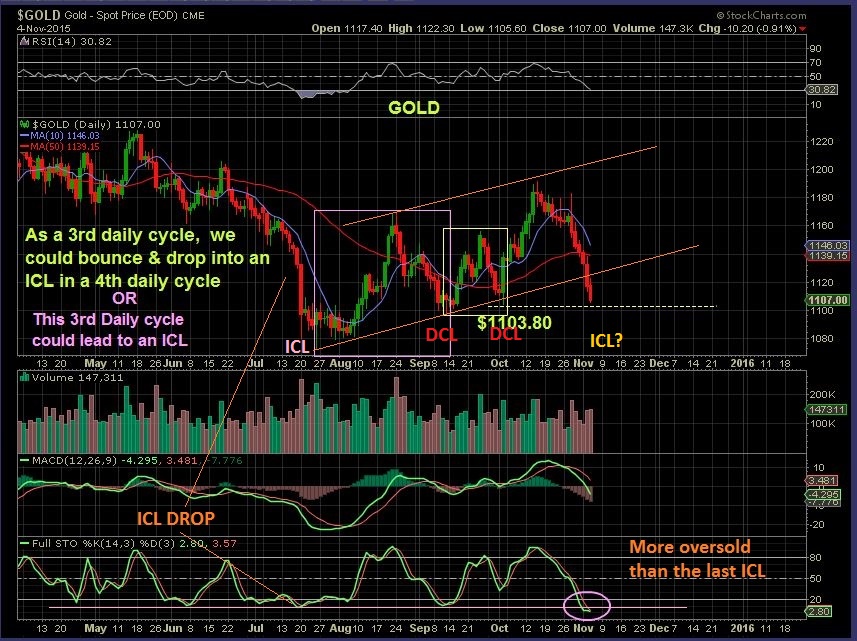
Yesterdays chart showed how normal it is to break out and “Test” the break out area, so we may be close to a low. Again, I mentioned they are not often a V-Bottom, so we may see Gold acting volatile around the jobs report, and then move higher.
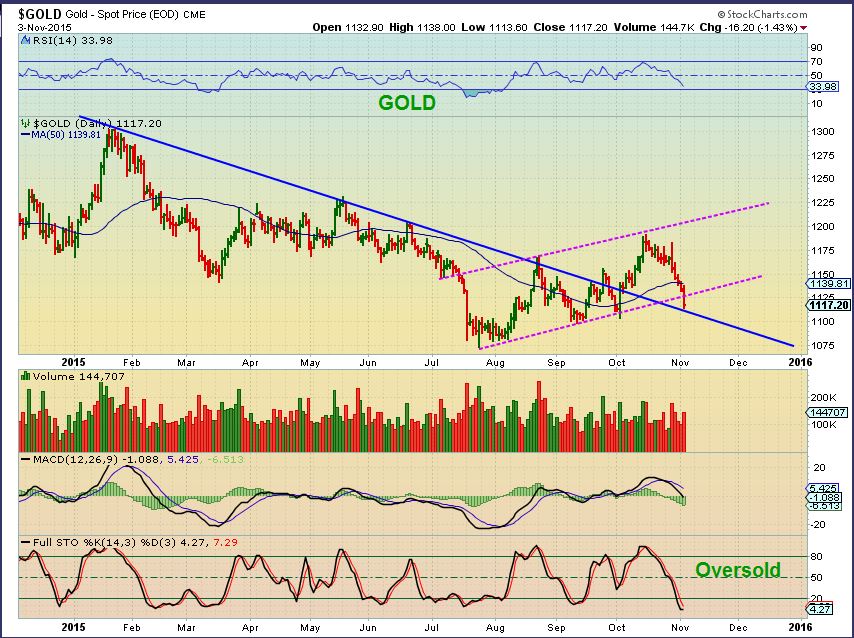
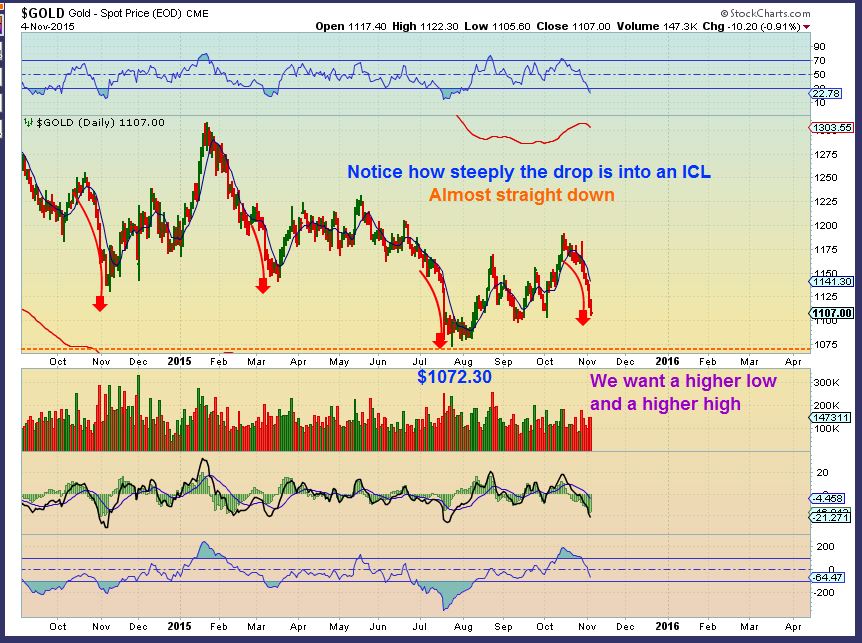
Looking at past ICL’s, you can see a similar sharp sell off occurring now. Notice again that those lows were not V-Bottoms. We do not want to break below the $1072.30 to remain bullish longer term.
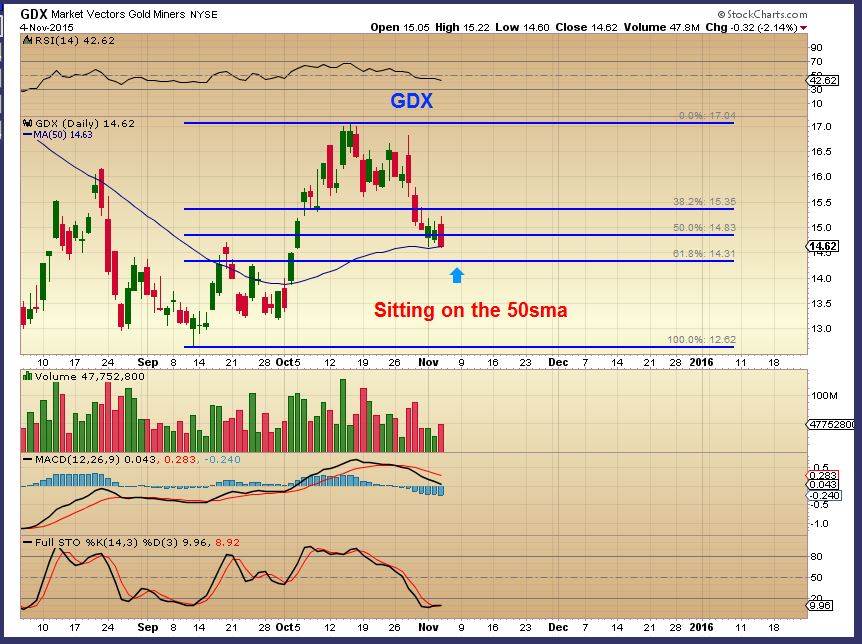
GDX – The Miners have been holding up well (So far) with light volume selling. It is possible that we get a stop run and a drop to the 61.8% retrace. That is just a guess and I only say that so that if we see the GDX lose the 50sma today, no one thinks that it wasn’t a possibility inside of a bullish scenario. We do also keep in mind that if the Bullish scenario comes off of the table, Miners can sell off sharply! Honor stops.
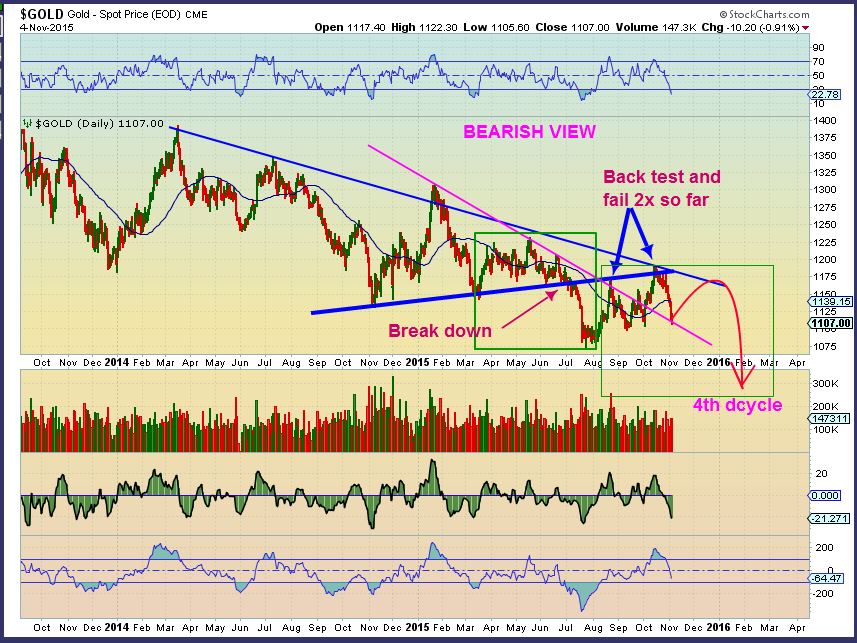
Now to be fair, I have to throw out the Bearish view too, right? We have broken down below the blue line of a triangle and have not been able to recover with 2 attempts.
Lets say that we have another daily cycle ahead of us after some type of weak bounce . You’d get a run higher/ sideways into day 8 ish and then roll over for 20 days or so. It could look a bit like this. Picture a repeat of the 1st Green Box.
With all eyes on the Jobs report and so many areas of the markets at possible turning points, I think we will only know better after that report. That gives us today to prepare for various scenarios pointed out, both Bullish & Bearish for Commodities. One of those scenarios should be that the SPX is recovering and the Dollar may be breaking out….things continue as they have for the past 3 yrs. Markets run higher with the dollar and Commodities just bounce on the way down.
So we ask with a Jobs report & possible rate hike in Dec, “Will that Dollar drop and close the weekly chart back under its recent break out, or is it breaking out for real?” “Will Friday end Golds sell off and put in an ICL?” “Will the SPX break out an run higher in parabolic fashion , or will it drop from a rising edge and seek out a daily cycle low?” Gold may bounce into the Jobs report and then get a final quick slam into an ICL ( no v-bottom). Miners and Energy stocks have held up well (GDX & XLE) and those may be clues to a bullish scenario going forward. The CRB stumbled, clues to a bearish outcome?
In any case, we have to keep our eyes on things as they unfold and try to let the markets tell us what they are doing. ‘HONOR YOUR STOPS’ because even if the bullish scenario plays out & you got dropped off on the way down, you can always get back in when things are clearer. There is Always another trade! Thanks for being here and Best Wishes.
~ALEX


Hi Alex. I found your report especially interesting today. I’ve felt very confused by recent action in the oil and PM sectors especially, seeing potential set-ups get underway to only then quickly fail. I made a real effort to step back today, clear my head of all the jumble and start with longer term charts and work back in to shorter time frames. Whether by luck or by actual judgement I came to VERY similar conculsions to the ones you have highlighted so well in todays report and not least the thought than an ICL MIGHT just be about to form in gold. BUT although I am seeing some bullish divergences etc on my shorter time frames and thus some kind of low may be close, I could also fully appreciate that the longer term picture still allows for an ongoing bearish outcome after what might be just another short term bear rally. Based on some other research I have I am seeing the possibility of a pull back in the USD short term (1-2 weeks) before heading higher once again and the EUR especially heading to new lows later this year. IF…IF… that proved to be the case it would allow for a bounce now in PM’s and commodities generally but would then potentially see everything ‘roll over’ again around mid November. That would fit with your possible scenario of 8 days or so up in a new daily cycle before a further 20 days or so down into the ICL rather than there being one forming now. IMHO you have absolutely nailed things today seeing that both possible scenarios very much exist at this time and EVEN if we rally after jobs report, it will be still too early to call an ICL or not. IMHO we need another few weeks of price action to have a clearer idea of the bigger picture and although there may be some very good trades to be made in the near term, honouring stops will continue to be of paramount importance as you so rightly stress in this report once again. Thanks as always.
Well said Chris, thanks for your extra input.
Thanks Chris
I still like many of the Energy stocks, but with Gold / Miners I do think we are going to drop the way they always do. GDX broke the 50sma, but will it stop at a 62% retrace?
I am seeing very heavy volume in GDX for only 1/2 hr into trading, so we may get that wash out selling that we always see at an ICL. If we reverse & bounce higher on light volume? I’d say we may have a DCL & a 4th daily cycle would just Roll over after a week or so.
I think it’ll be a tad clearer by the weekend report..
I sold my AUY and added it to CRK this a.m. .
I like the Energy with earnings released a bit more right now.
I think one of the biggest issue we face is the Fed. Headline news trumps technicals short-term every time. We had a solid technical rally in GDX off the 50 day destroyed n/c of two words from Yellen in front on Congress. I don’t know how much I can do before Dec. They need to get this over with so I can get on with trading.
Just an interesting FYI Ticker WPX – They’re doing a live conference call at 10 a.m. eastern and the stock just broke higher . It sold off during the beginning of the call, and now recovered up 7%
(No Recommendation…the call is till happening I believe, and if they say something bearish it could turn down again).
WTI (Ticker) also breaking the 50sam higher
hmm .. I’m feeling this .. anyone else??
https://www.tradingview.com/x/xgOtyy6A/
Well, it does appear to be a channel
same for Mux https://www.tradingview.com/x/RBV12ZN8/
and a reversal candle to boot
mmmHmmmm
Nice base in IFON ( MAN!)
Watching the miners and seeing some intraday buying here .
Not sure if it will last, but many are well off of their lows for the morning.
SGY…breaking out from cup and handle on 5min? with Oil down….
SGY has already released earnings too.
WTI & WPX still looking very good too ( SD, CRK, WG, GNE, ok too)
Energy doing well with Oil falling below 50SMA…maybe just a stop run? Do we get concerned if it closes below for the day? Cycle wise…you fee oil can rally another week or 2. could this have been a 1/2 cycle low?
thx Alex
Cycle wise , Oil seems quite early to expect a big drop, and with XLE & some energy stocks moving higher, I’d say things are fine.
If I was trading OIL or UCO , USO, ETC ( UWTI especially) I would trade off of oil itself and be a bit more alert if Oil CLOSED below the 50sma, but with the energy stocks I would play them based on their own charts.
WPX, WTI, SGY, ECA, CRK,TNP, ETC above the 50sma and moving higher…one could use a trailing stop, raise it a bit daily or sell if OIL really dropped.
great….thx Alex
I’m actually seeing more of them turn green and thats a good sign.
OAS, SWN,& QEP & more Just popped too
BAS and GDP have earnings behind them. BAS flirting with 50 day, I posted chart earlier in the week.
Nog was down around 40 cents, just flipped green , up 14 cents 🙂
Nice reversals in energy
Bill…. where are, it’s so quiet?
Do you have a chart from GDX?
Thank-you Bill.
Sorry for the delay, I was out Yesterday. I think my original course is still in play. We are at the 200ma currently and that could reverse the move. Trying to trade that little move in NUGT was a mistake. If you remember I said we shoud get 3-5 days higher and thus the trade. Didn’t work out.
https://www.tradingview.com/chart/DUST/5gU7IX18/
https://www.tradingview.com/chart/GDX/DIh9zcpu/
anyone else taking a pop at GDX/J down here?
looking like it wants to go higher with divergences.. and that ending diagonal looking wave today
i’m thinking this intersection might also be a relevant point for at least a bounce of some degree
Nope! Jobs before open, too!
All I can say is thank goodness for stops. Glad I got taken out of that NUGT mess yesterday!
Will try to post a chart later, but I firmly think Nat Gas has bottomed here. Sure, we could go a little lower, but I don’t see $1.95 coming again. 8bcf over consensus today. 2 weeks left in injection season, that’s it. Watch Jan futures. They were at 2.50 early in week, we need to catch that or UNG/UGAZ will face heavy contango. But that shows traders think weakness is shorter term.
Refresh for chart! Captured 8-day EMA (short term indicator), Stoch has crossed up, MACD getting ready to cross, RSI out of graveyard. Pull up the weekly and look at the MACD divergence from summer lows to recent!
Updated BAS chart. Good Luck all!
So GDP losses double the expected number. Shares up 5% following day…
Makes sense, right? Of course they went from $11 to $0.56 so have to guess how much of that is baked in. Not saying all are a good long, but shorting here says, I think oil continues to break down and this cuz company will go bankrupt near term. Which is possible if oil doesn’t recover at some point. Oil svcs job losses are now affecting jobs report which in turn helps drives Fed. Isn’t that a turn?
Alex, wouldn’t be looking for a report today, think we’ve more than covered the,possible moves. But if you see anything crazy after jobs and can post a text only update, that would be pretty cool!
Well, anyone buying miners in here? GDX now below 50DMA and below the 61.8% retracement levels. Gold at a place that should see some support. Do we think we are headed to new lows?
I’d be more inclined to chase short, actually. I’m down with falling knives. I’d rather pick it up off the kitchen floor…
That number was HUGE. I would expect 2 more days of downside pressure. Asian markets haven’t had a chance to react yet (during their market hours).
I don’t see how we can avoid at least testing Jul lows, just too close now not to do that.
I tend to agree with you. It definitely doesn’t look pretty.
Carl, agree with your bounce comment. I thought it would be earlier this week and was wrong. So, while we should get one, I don’t seem to be able to time it right now which is why not currently trying to trade that.
Yeah personally I would useany bounce to unload some positions I have. At this point I wouldn’t necessarily play it on the long side.
oops, reply is above
I’m not buying but I am still holding. Last time I sold at this level it started a ICL.
Nothing but crickets in here today!
One would think that we would get an oversold bounce, but it seems that new lows will probably come afterward? I’m waiting until after this emotional first hour of trading, and then may start unwinding the miners I’ve been accumulating under the assumption that THE gold metal lows were in place. Enough damage has been done to the gold metal charts that I don’t think that’s a safe assumption anymore. Waiting until the last trading hour of the day/week sometimes gives a sense of direction in metals
That’s kind of what I am thinking. At some point a bounce. Then a test of the lows or new lows before the real bottom. But looks like that may drag into 2016 now.
Good luck, Cal. I didn’t like the pullback we had been getting and my entries had been well above The recent Lows. I have been out for weeks and am very glad about that (except for the one quick, losing NUGT trade). I’m not going to get cute here, these things are flat dangerous when they decide to pull back.
i bought a small amount of GDs yesterday thinking a countertrend bounce was due.
level for the day though, due to amount of $ im holding acting as hedge (Im UK based, so $ risen much against £ today).
9 continuous days down for $GOLD, so a rally is close.
Is Newmont positive now or are my eyes deceiving me?
It is indeed! 🙂
Alex or anyone, thoughts on crude oil? My energy stocks look fine, happy there, but my USO position is buried. Unlike gold, stronger economy is actually good for energy commodities. Except the dollar shooting straight up like a rocket. So which force wins? Essentially, I’ll start unwinding if presented an exit, but starting to move towards undisciplined panic mode, had expected 50 to hold.
you still happy about UNG?… dropped back to hourly 50ma, but held OK so far
now looking good in green!
I am, yes. I think it will be bumpy for 2-3 more weeks, no V shape here. But I would use random plunges (no change to fundamentals this morning, rates do not affect had much) to start/add positions.
I’m still long WTIC, this down spike is not a positive.
Bill, you kindly informed us of tradingview.com
Best free charting facility I’ve found. Many thanks.
Now if only some reds can move to green…
I’m good just about everywhere except crude. Getting crushed on that one.
I’m sure you are all aware but Alex has just posted a bonus Friday report! 🙂
Thanks CHRIS…. I didn’t know it, but I will read it now.