
Energy Bull?
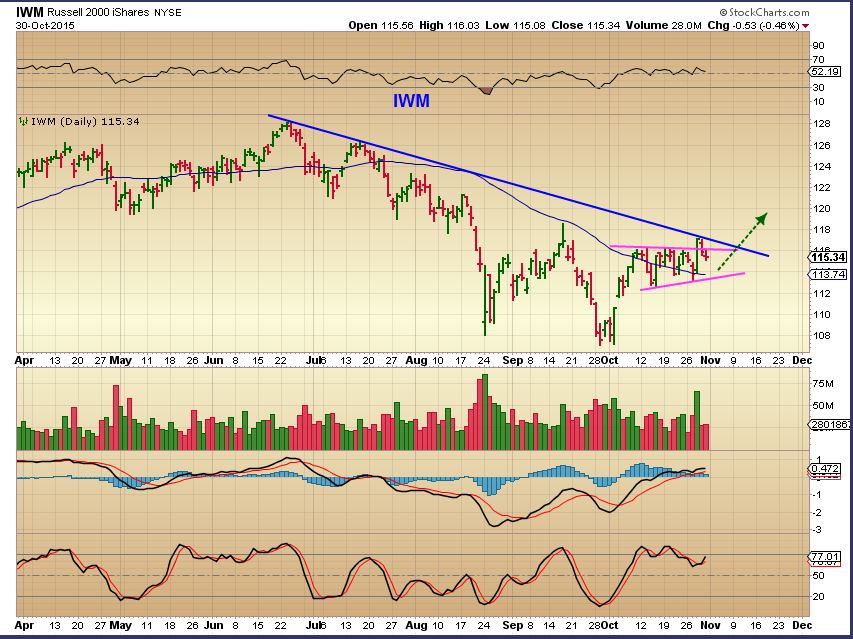
I want to discus a few things in todays report, and then I will have a small ton of charts & Set ups in Energy and Commodities. I will start with the markets and their nice run higher lately. I did mention that the IWM, TRAN, and the IBB looked to be lagging a bit. IWM had a bullish set up and popped higher, but it hit another short term resistance area. I wanted to see a pop higher if it is going to possibly play catch up.
This was the IWM at that point on Oct 30. I expected a break higher.
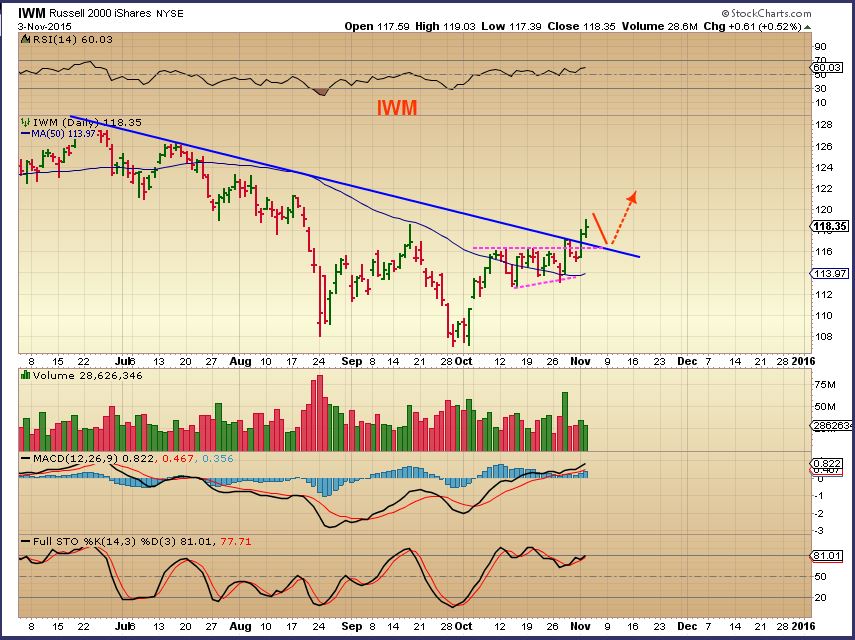
IWM Nov 3 – We got he break higher ( Note: We may back test that break soon).
Lets look at the NASDAQ before we discuss Energy, The CRB, & The Precious Metals…
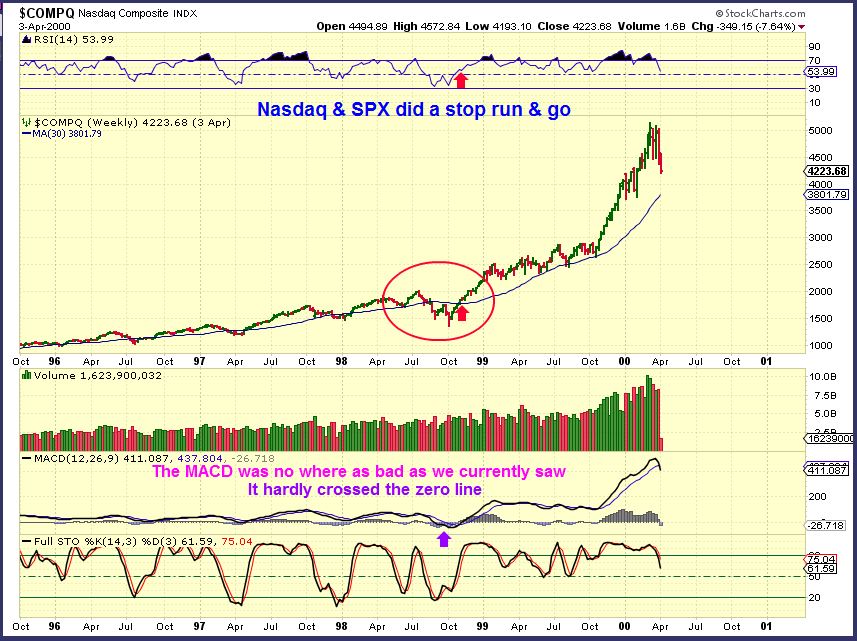
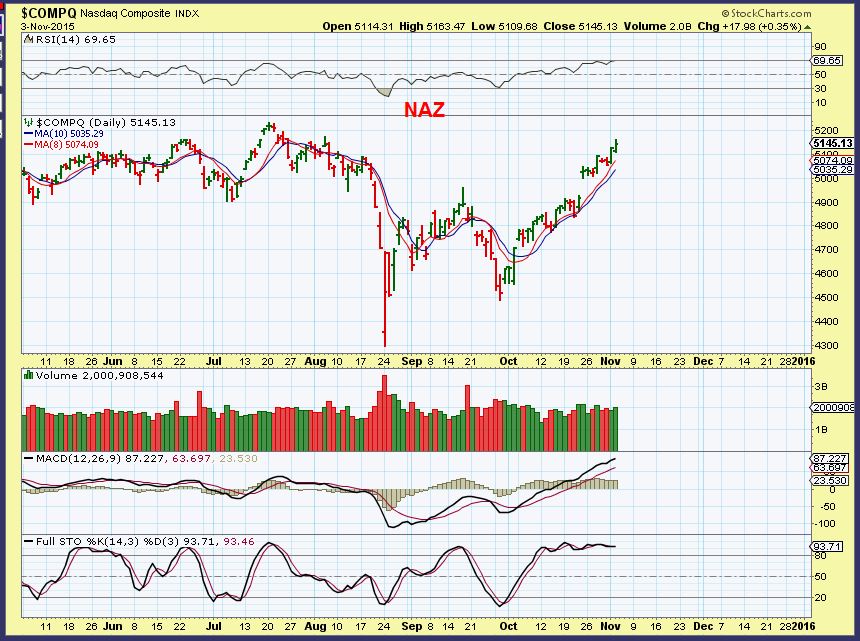
I pointed this blow off top in the NASDAQ in an earlier weekend report. Why? We still cannot be sure if the markets are currently back testing a break down and going to drop soon, or are they going to follow this pattern and break to new highs in a blow off run. The RED ARROW was where we were when I posted this chart below.
I want to examine this blow off run from time to time.
Close up 1999 – resistance at the former highs and then a steady climb higher above the 10sma.
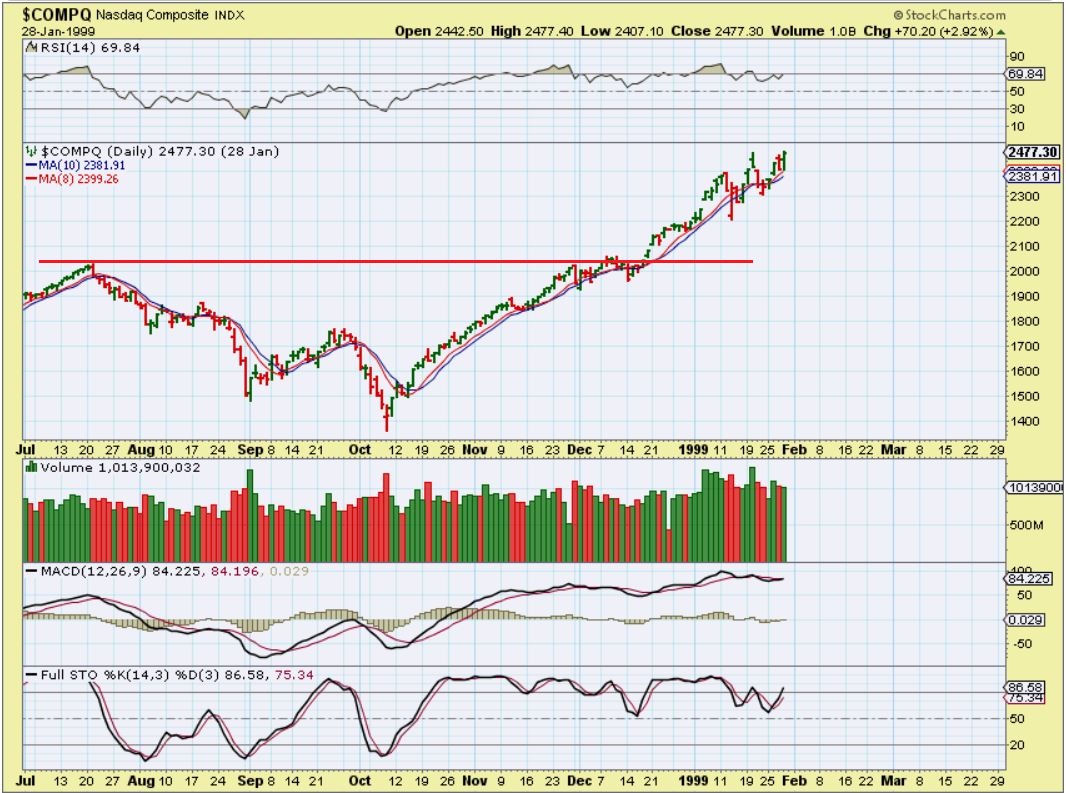
NASDAQ CURRENTLY – Also riding above the 10sma, almost at former highs (possible resistance) . You can see from the ABOVE 2 Charts that we have plenty of time to go long if we are to follow the 1999 blow off pattern. Right now the NASDAQ is still rising above the 10sma steadily, nearing former highs.
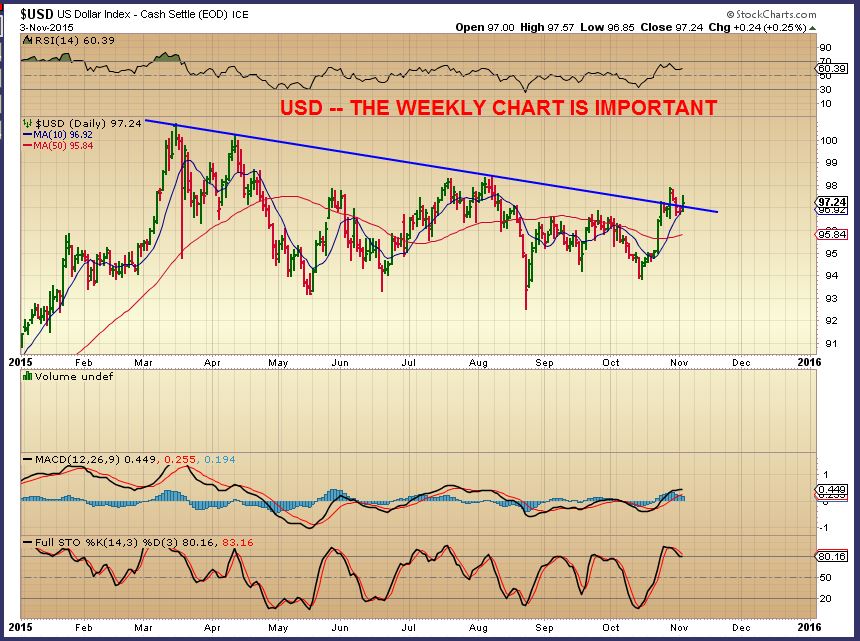
USD – I was watching this in the weekend report. Break out or false break out?
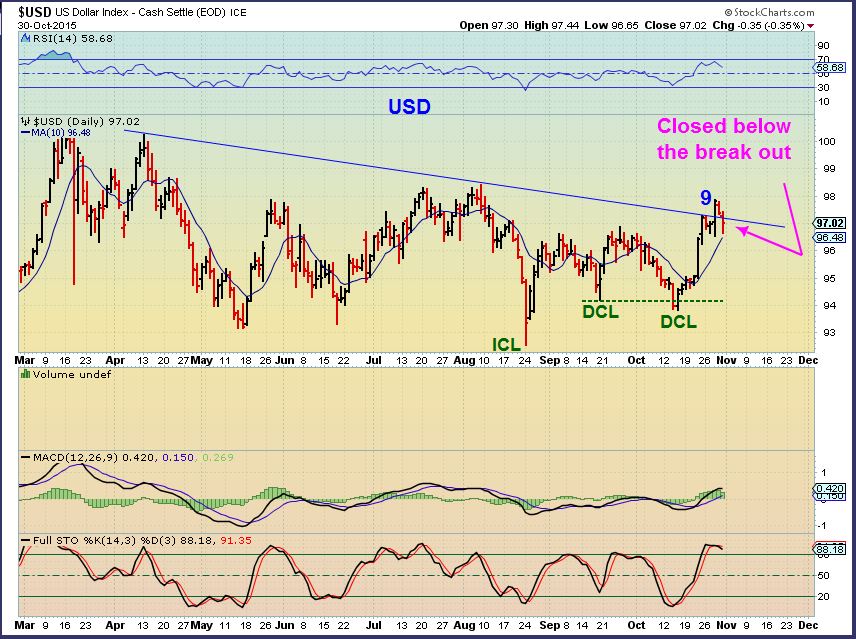
As of Tuesday the USD is rising again, but on a weekly basis still has time to drop or rise further. If the Dollar drops below the blue line by Friday it may continue to roll over. Bullish for commodities.
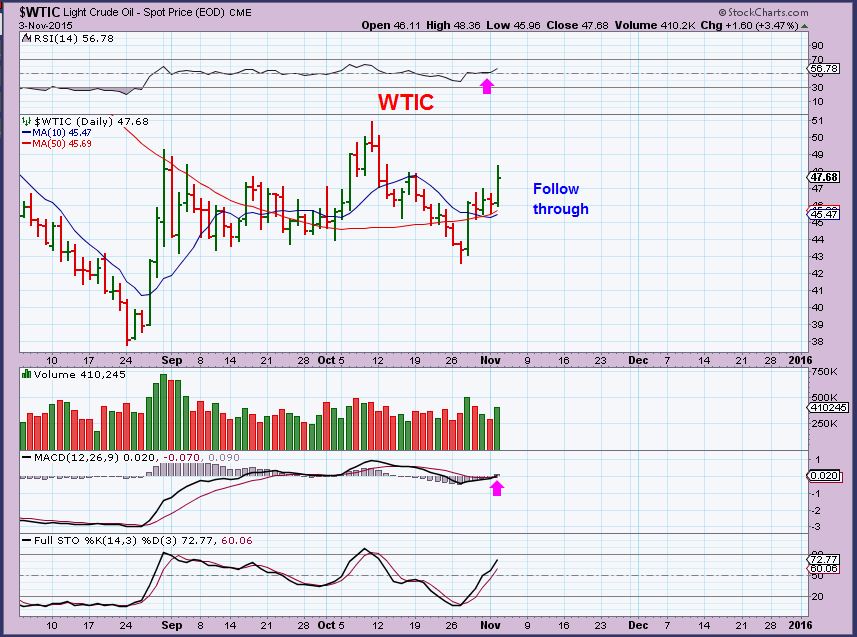
WTIC – We got some nice follow through in OIL. I have been expecting higher prices and keep encouraging the Energy sector for long purchases. I have listed energy oil stocks in past reports and I will list more stocks in todays report.
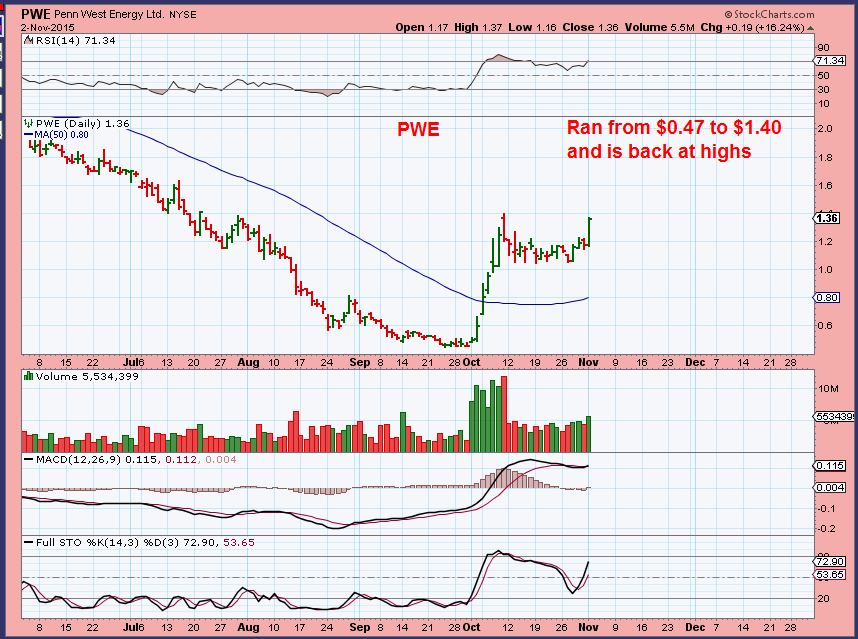
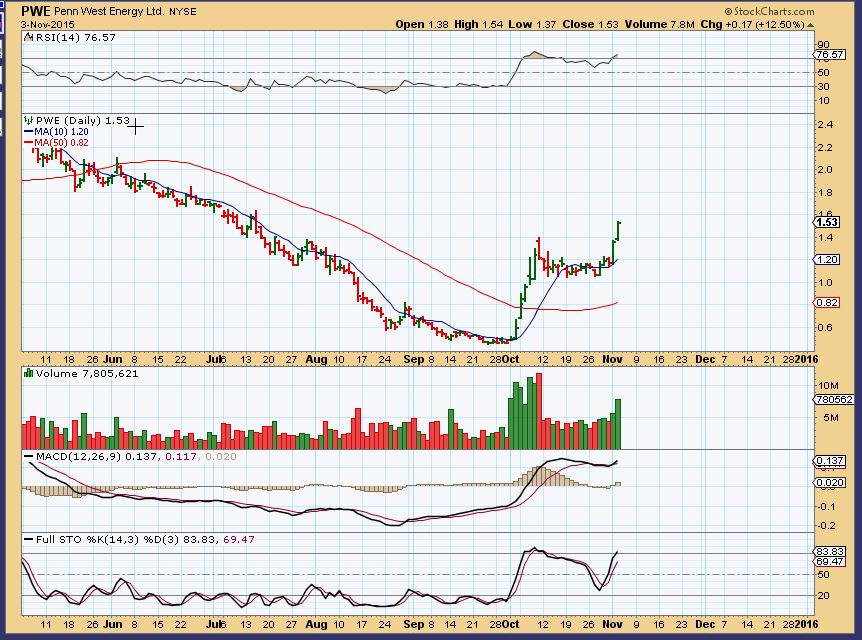
I pointed out some Energy stocks popping from recent consolidation. This PWE chart for example: Notice the follow through yesterday.
I will have a good number of Energy Stocks at the bottom of this report.
GOLD, SILVER, & MINERS
2 Gold stocks – We broke the trend line possibly to back test/ tag the break out trend line. That could be our support? End of selling for now.
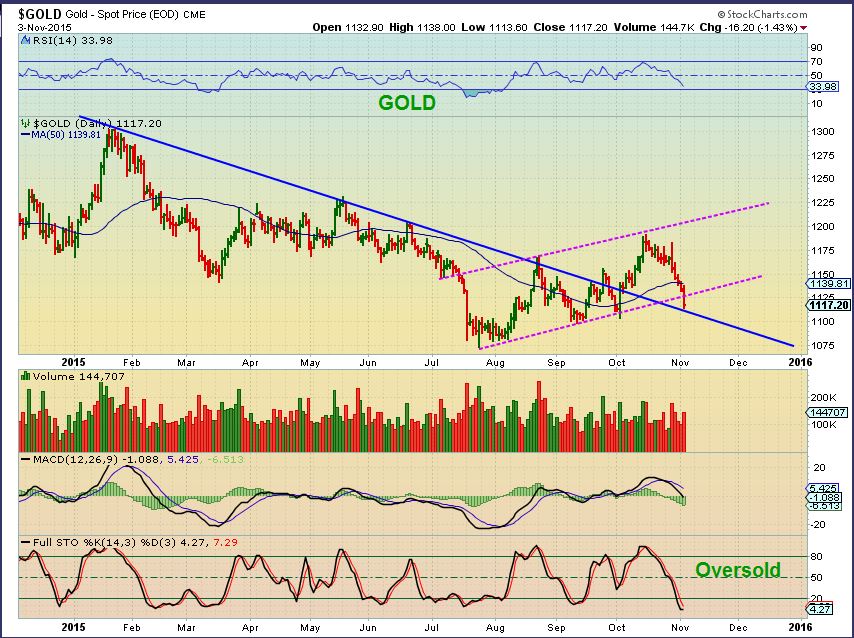
GOLD – $1103.80 is important to me if I am viewing that as a possible DCL. I dont want that low taken out.
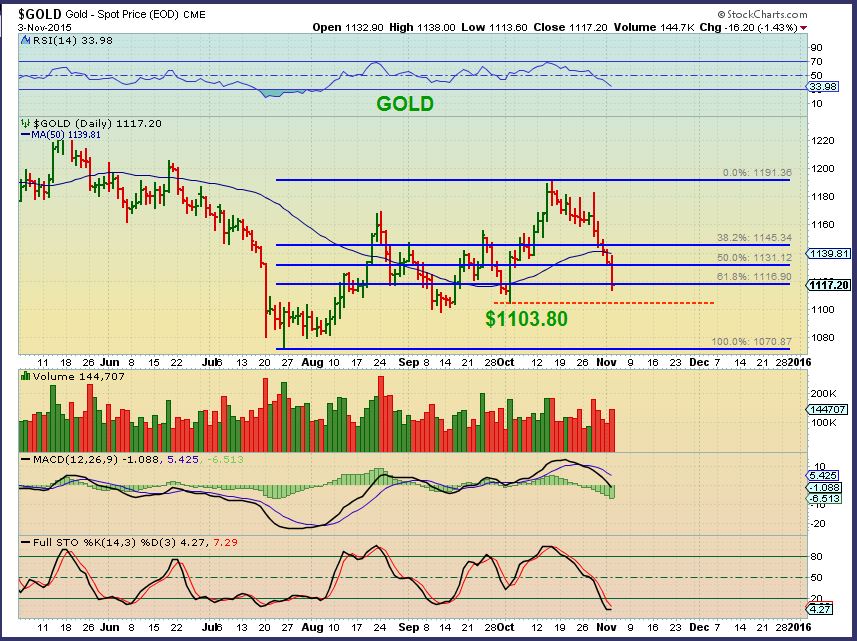
Please note that GOLD has dropped about $27 in the past 2 days, but…
SILVER – A small drop to the 50sma, volume is not too heavy. Silver is holding up with Golds sell off. Usually Silver gets crushed.
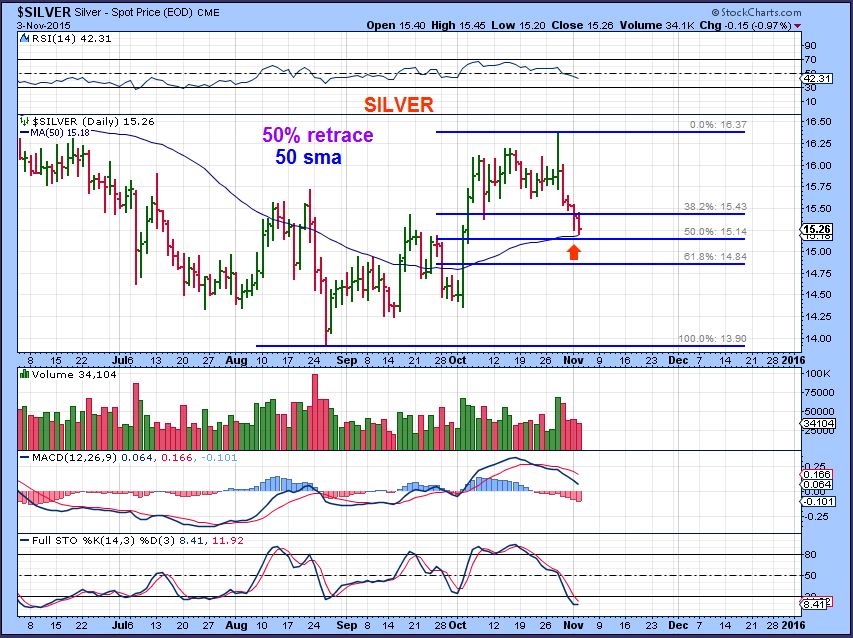
I got SO MANY emails about Silvers C.O.T. and how doomed silver is because the commercial shorts are so high. I mentioned before that I use the COT as a guide, but not as a timing tool. IF we return to the bull market is Gold & Silver, the smart money will be on the wrong side, because they always go short in a rising market. IF They have to cover? It turns very BULLISH quickly.
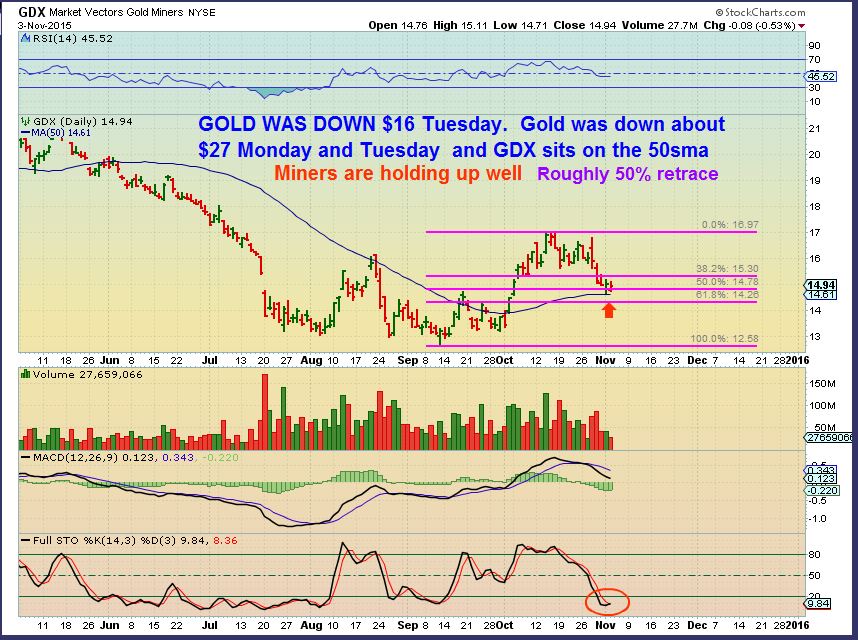
GDX – Again, Gold has dropped $27 Monday & Tuesday. Miners usually get crushed. Not this time, and this is a normal pullback.
As I mentioned in yesterdays report, I am focused on the energy sector too, because the gains there can be rather strong. Some stocks have already moved 10%+ a day and are up 30% in a couple of days. VERY NICE TRADES. You can raise your stops and just let some ride if you want, but please be aware of when each company that you are holding releases earnings. They can drop Pre-MArket with bad earnings. I also said that I expect Oil to move higher for a couple of weeks, so I am looking at the set ups and consolidations and looking for lower risk entries to try to capture some of those gains. Lets look at some set ups 🙂
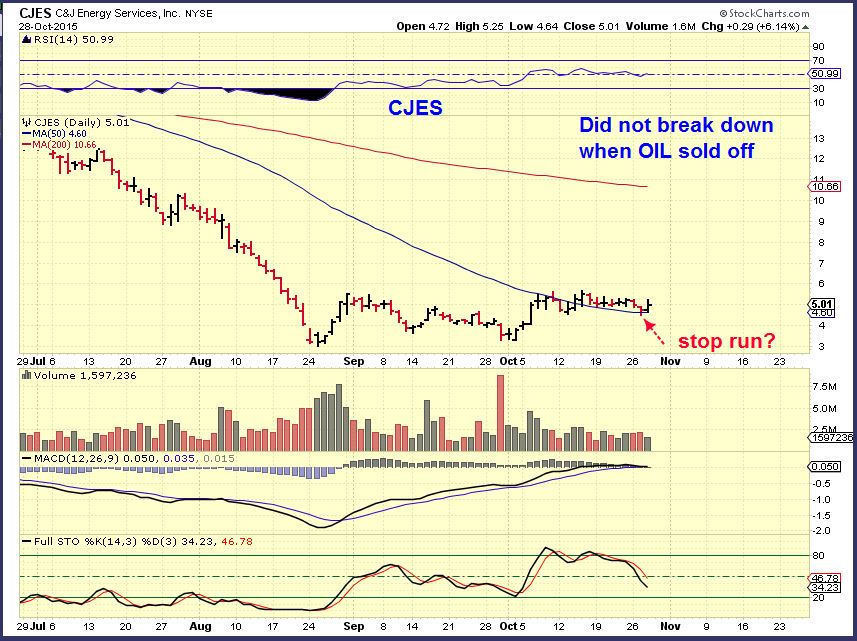
CJES – How many times did I post this consolidation at the 50sma around $4.80. Why? Because it just didnt drop with oil dropping and that can be a good sign. It did a stop run , so I posted this on Oct 28 . Lows were $4.64 as it returned above the 50sma.
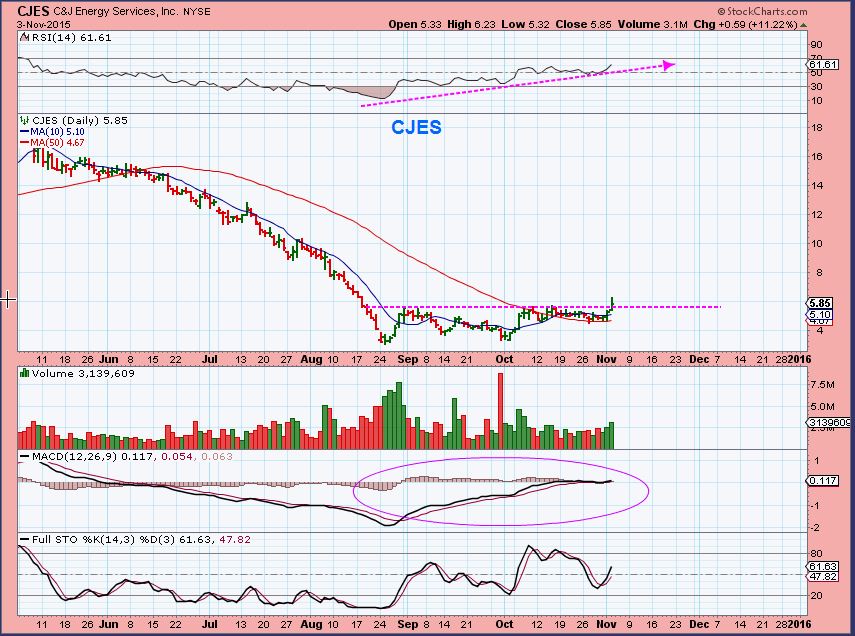
CJES CURRENTY – This is suddenly at $5.85 and looks like it has plenty more to go. (EARNINGS AFTER THE MARKET TODAY – SO IT MAY BE BEST TO WAIT)
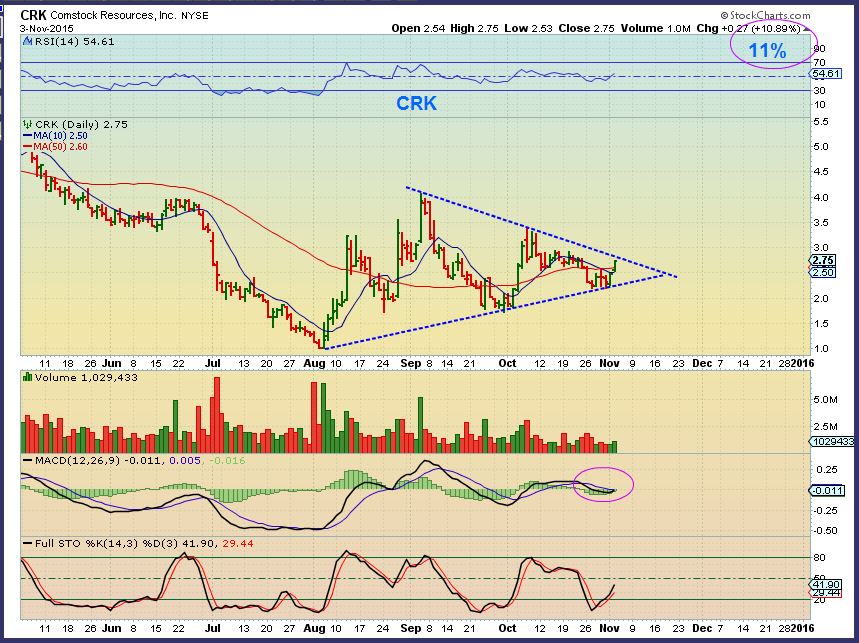
CRK – I posted CRK in Tuesdays report and this popped 10% Tuesday, but had earnings pre-Mkt today. They were horrible. Lets see how the markets treat CRK .
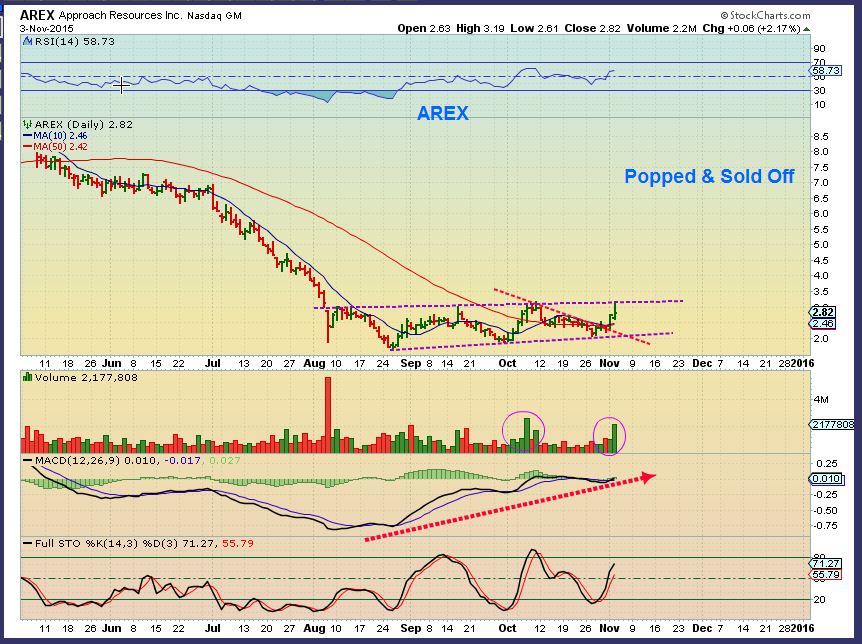
AREX is up 20% in 2 days. Earning come out Thursday.
For the sake of time, I will just list the rest of my charts. DUE DILIGENCE is in order. As you can see from the above postings, earnings for these energy companies has been being released right around now. You may want to get out of a position if you own them or wait to buy them, but Energy does seem to be a good place to get some quick gains. Best Wishes!
.
~ALEX
.
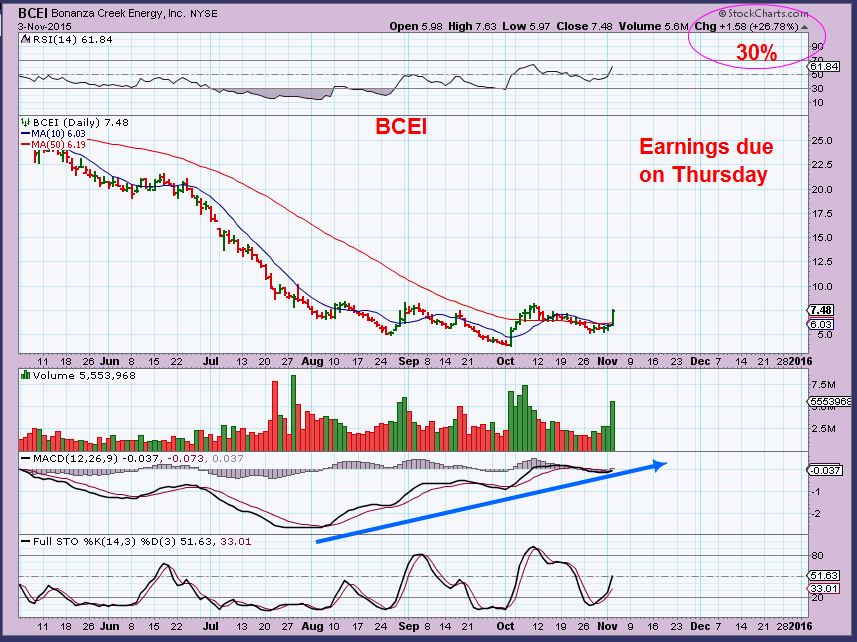
BCEI – Nice base so far, popped 30% Tuesday!!
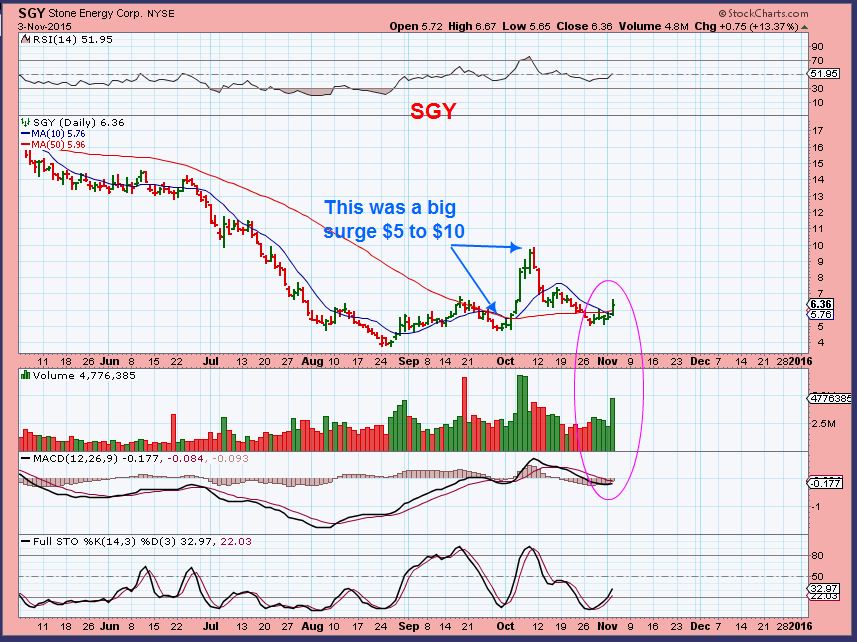
SGY – Mentioned here n the last run of 100%. Popped 13% Tuesday.
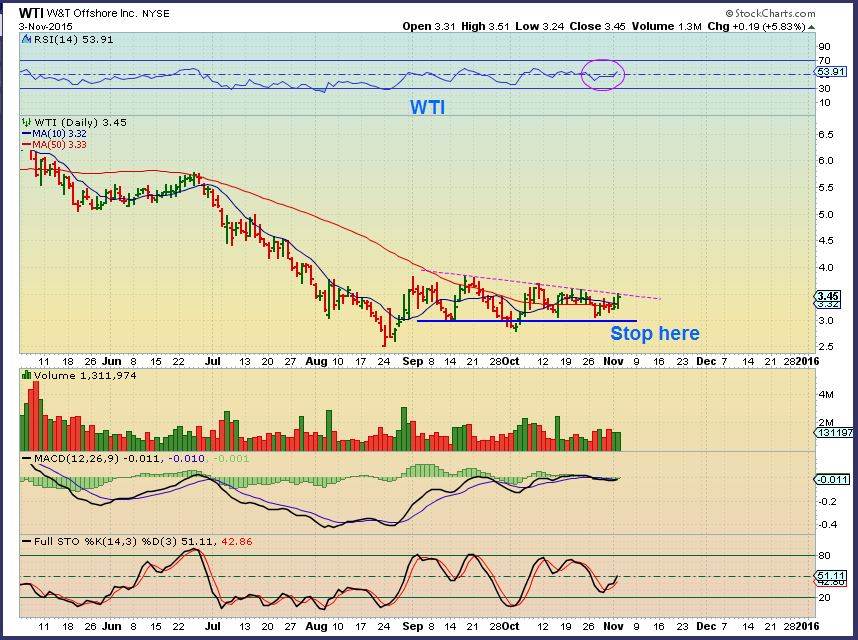
WTI
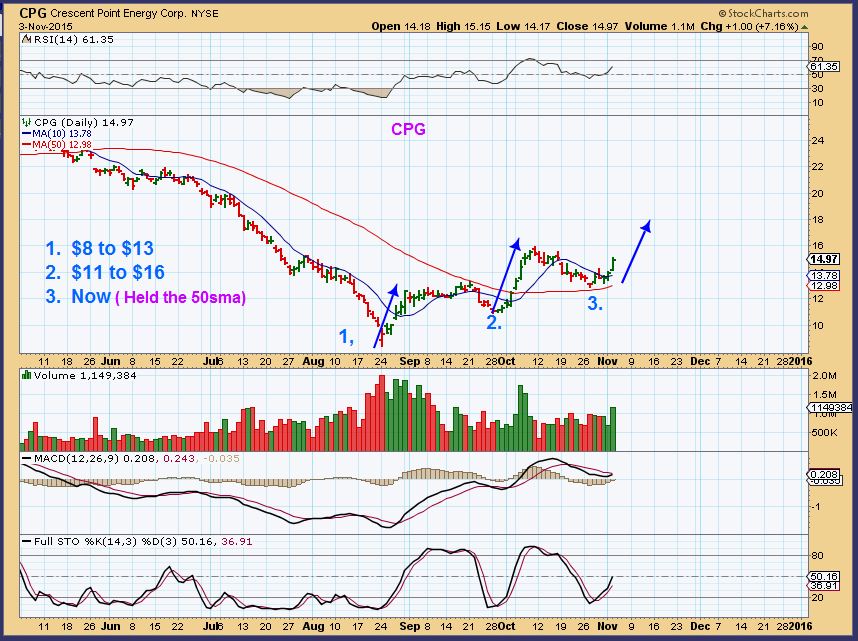
CPG – If you bought in August, It was a double.
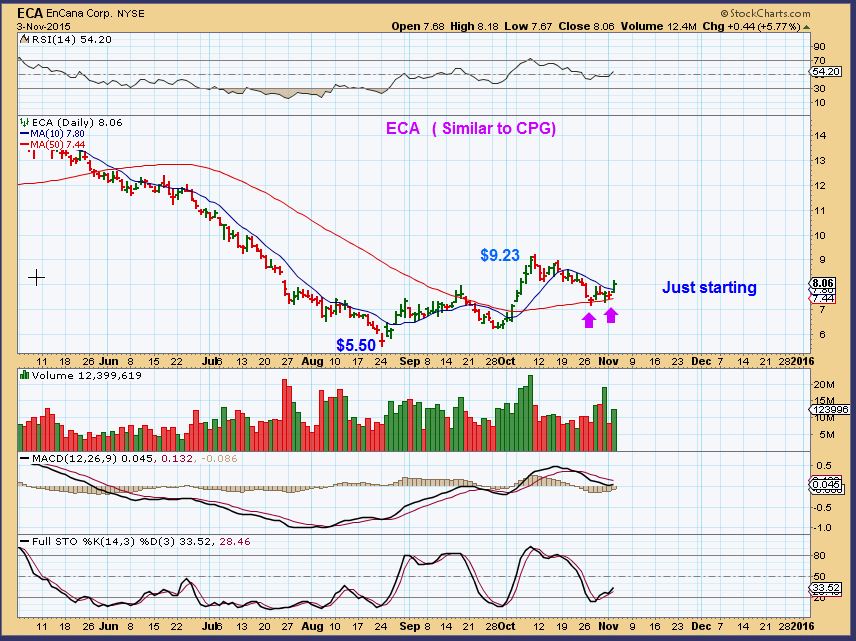
ECA – Almost 100% from summer lows to recent highs too. Supported at the 50sma so far.
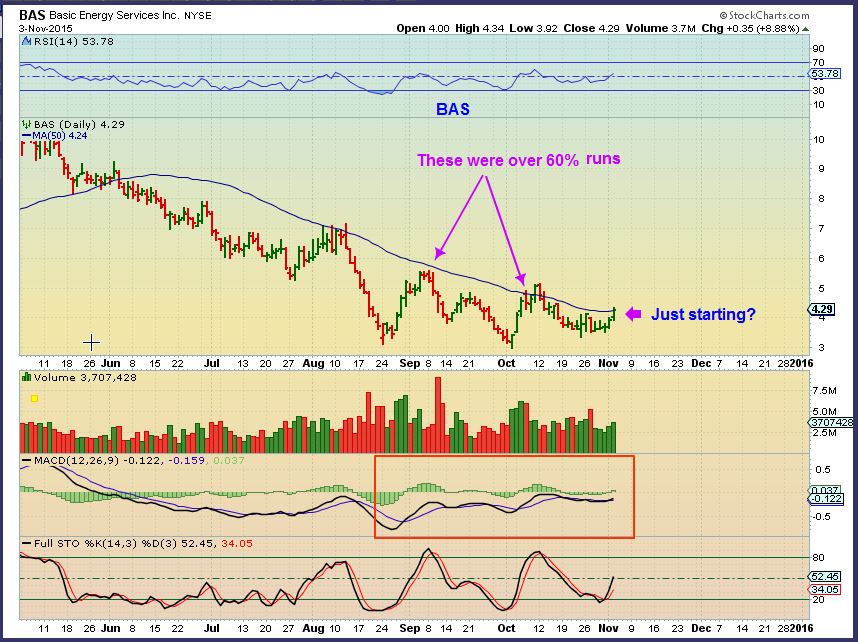
BAS –
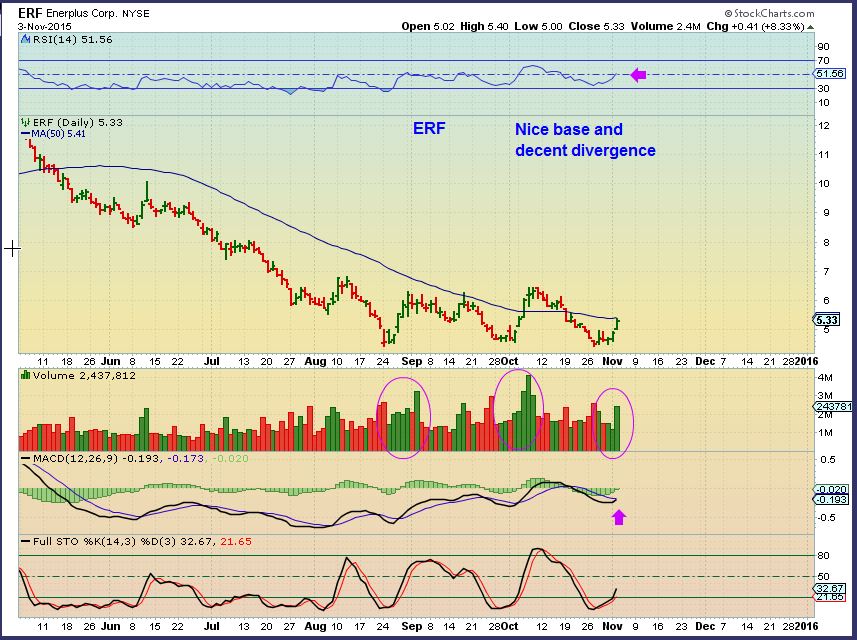
ERF – Possibly just getting ready to break higher.
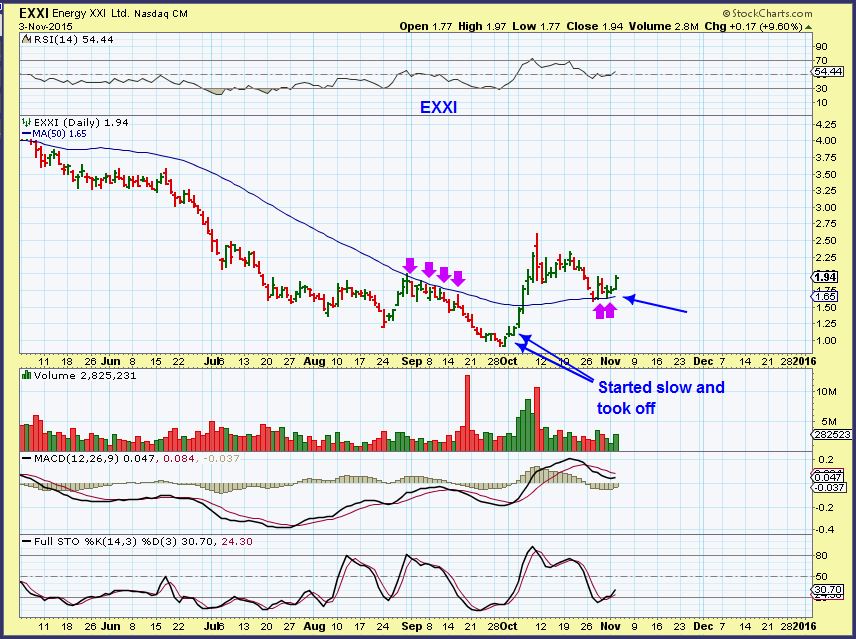
EXXI – Held down by the 50sma at one point, it has found support there currently.
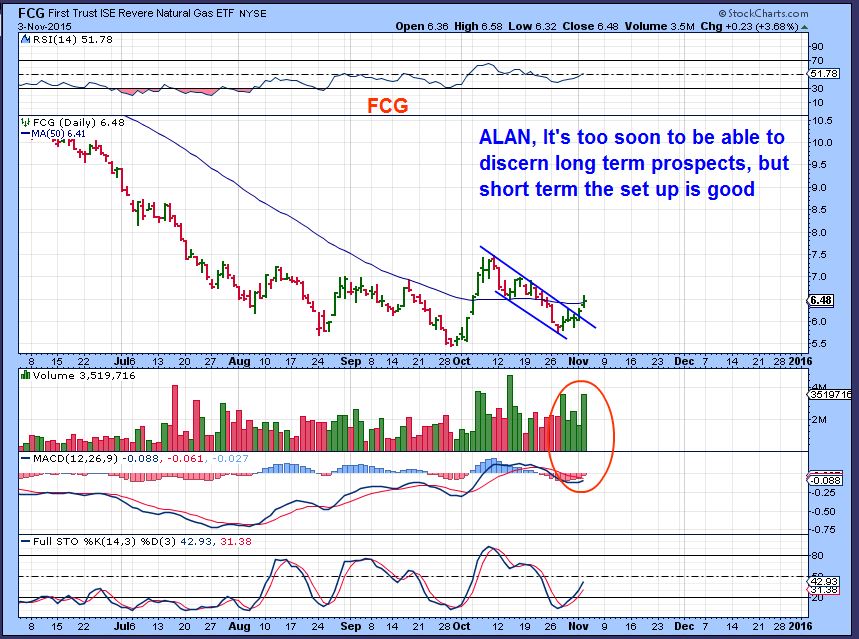
FCG – Not so much a recommendation, though the set up is fine. This was requested by one of our readers.
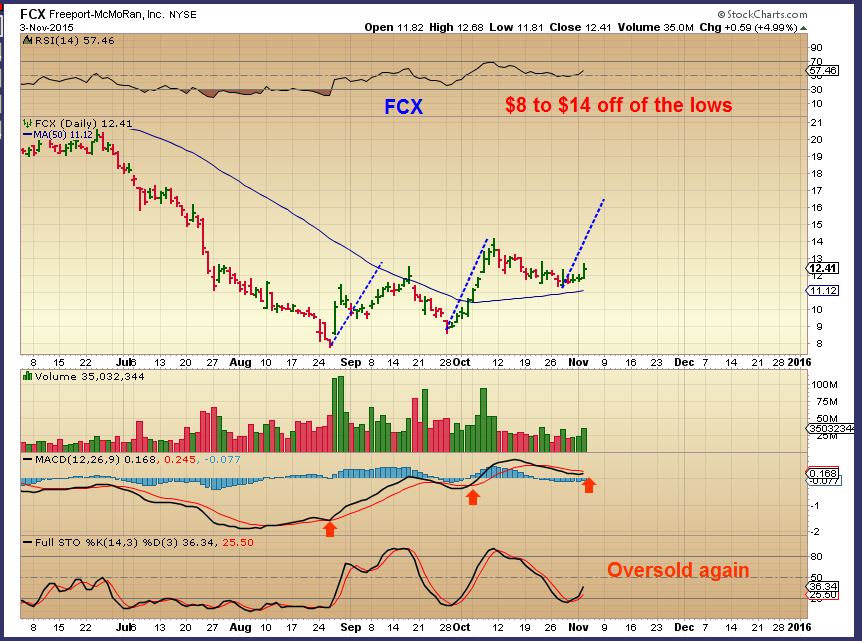
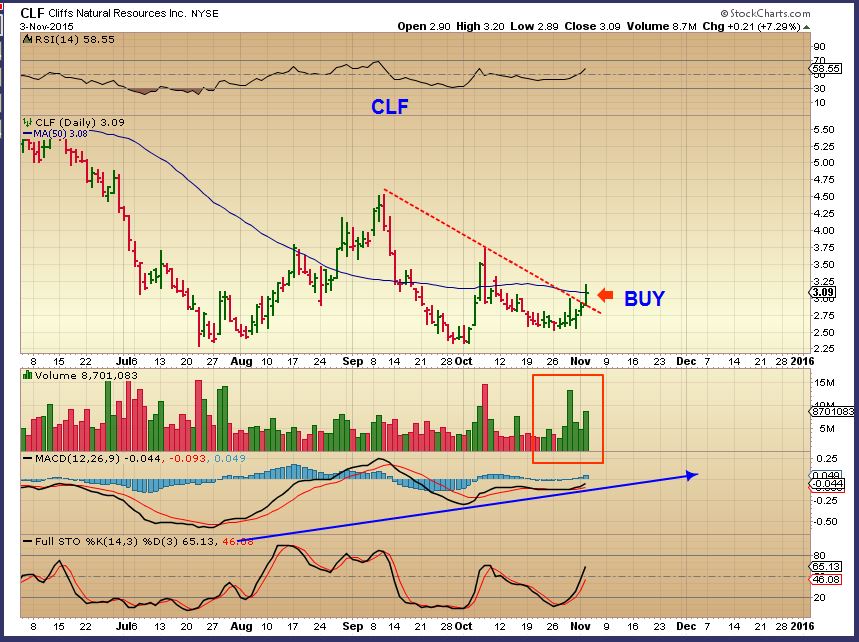
I also pointed out some commodities that I liked the set ups for ( Vale, FCX, CLF, X, AKS, MTDR, MDR, etc ). X came out with earnings and got knocked down in after hrs yesterday. Others still look good.
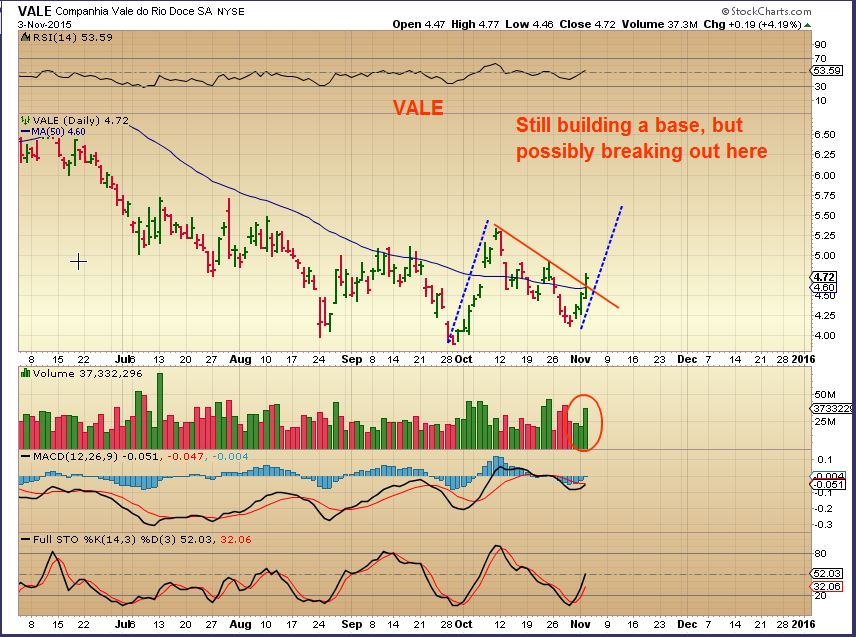
VALE, FCX, CLF and some other commodity companies already reported earnings and their charts look to be improving.
VALE – mentioned in prior reports, it looks to be set up for higher price again. Earnings was already released.
FCX – Earnings released in October already.
CLF


hi,
if some one has more news on NRG stocks and earning reports of the ones mentioned by Alex in today’s report – just YELL
it will be much appreciated – not sure where to get this info over here
Thanx
Ray
TRADINGVIEW lists the earnings day at the bottom of the charts.
I’m looking for a site that says when to buy and sell and is always right? Any ideas?
DON T LOOK FURTHER !
chart freak : )
Try HELLENKELLER.ORG
Aren’t we all! No such thing exists of course.
… someone hacked Jd’s account ..
I was going to say the EXACT same thing about yours! Every day for the last month. 🙂
giggle… oh .. id say longer than that…
#BadCatWoman
Thanx Bill
really appreciated
Bill, you still in NUGT? I got stopped out today.
I bought today some Cason.
Let’s see what Bill is doing, I think he bought yesterday.
CRK had what I thought was pretty bad earnings and it continues higher.
WG, SFY, EXXI, PDS , GNE ( low volume though) , among honorable mention
Jeez. CRK wrote off over $500 million to impairment. Loss of $11.81 per share and it’s up today.
I know- Crazy. Especially when you compare vs last yr.
copy/paste: Comstock reported a net loss of $545.0 million, or $11.81 per share, for
the third quarter of 2015 as compared to a net loss of $1.9 million, or
4� per share, for the third quarter of 2014.
Net loss of $2 million last yr vs loss of $545 million this yr and its up? Talk about forward looking markets 🙂
Wow, I thought GDP rpt was bad. Looks awesome compared to this!!
Glad I didn’t buy RBY on their first drop. They look pretty much done now.
Ouch, I wouldn’t buy that until it has something positive going on.
Looking at the OCT 5 drop, it just went sideways/ down until the next drop. I’d hate to own it and have it just do that again .
3D printing
DDD missed earnings…check out the reaction. SSYS also great .
VJET also looking good, second leg higher.
Hi Alex, would this be a ‘buy’ signal for DDD and the 3D segment in general?
It may not be a BUY signal specifically, but it does seem to indicate that this sector may be ready to bottom & move higher. I have been watching VJET for a little while. I thought that it really did have a bullish looking blast off in Early Oct, and so did SSYS & DDD, but when SSYS dropped and DDD made new lows, I didnt trust any of them. ( See Early October run ups with all 3)
Now I see SSYS & DDD have very similar chart bases, Earnings were released for DDD and it took off higher / SSYS is following, and VJET never dropped.
I guess that I would have to conclude that this sector may be bottoming and ready to follow the rest of the market higher if the markets continue to perform as well as they have.
Maria – Remember the KNDI RENN MOBI DANG
Some have left the shore, others ready to follow?
mmmmHmmmm …. will ck .. 🙂
Too late – MOBI took off : )
That leaves DANG as the last to go
Alex,
Does this look like an expected pull back in oil, and hence a good point to add to energy?
I’m thinking SGY. thx
Along same lines, was surprised pullback as much as it (talking crude) as I read EIA rpt as neutral-bullish, another big pull is gasoline stockpiles. Seem like the spot to add WTI?
Alex, if you can fit in rpt this week to talk about crude targets that would be awesome.
Sorry, I’m not sure here…Are you asking about WTI the stock, or just talking out loud about WTI?
So far, it isnt abnormal. WTIC is above its 50sma. I dont mind the wiggles and pullbacks – they aren’t unexpected, but I was surprised at the volume selling being higher than the buying on the 4 hr chart below .
.
Refresh for a chart. click to enlarge
This may be where the sell off ends,I would use the 50sma as support for SGY ( AND OIL). Stop runs aren’t out of the question either.
You may already know this, but they released earnings Tuesday and POPPED Wednesday, so this may be a good choice. Just bounced off of the 50sma , so I’ll be watching it too.
Thanks Alex,
I got in before earnings…rode it up yesterday….should have cut a half of position then …instead added more this afternoon. Just nervous how oil reacts the the employment numbers come Friday…as it could be a big day for gold
Added second half of NUGT this morning for quick swing. Ms. Yellen is talking up rate increase which has the dollar kicking butt and taking names. Stop is 10 cents below weekly low, may get stopped this afternoon.
And I’m out thanks to Mama Yellen’s yelling. Thanks! Very little portfolio damage. With Fed yammering and jobs upcoming, I’m happier on the PM sideline anyway. Too bad they ruined a solid technical setup.
Watch Euro. Down at support today. If breaks 1.08 then could be negative for commodities.
The Congressional committee was questioning Janet Yellin this morning, and ever since she started talking – just about everything reversed direction.
shocker
I’m gullible…wasn’t expecting any sort of vibration or anything ( UGH)
RGLS ..nice
Thanks, guys. Killed another solid technical setup with yacking.
For those using ThinkorSwim…is there a way to plot or indicate a daily moving average (without having to set it manually) on a chart with a different time frame?
Whoa. Check me out. Found it all by myself. There’s a “Daily SMA” function available.
..
Alex.. has today damaged energy at all, with everything turning red (at least those i was watching)… or just noise?
I cant speak for everything, because I cant look at everything, but what I am seeing isnt damaged. Maybe some are, but I see quite a few looking good with Oil down.
Even Oil remains above the 50sma, and XLE looking strong.
Check out BBG, WG, GTE, CRK, ( Check out the OAS gap fill) , etc
SGY dropped down and regained about 36 cents of that drop so far, and I see some green energy with OIL down.
I personally dont think Energy is damaged, but if one wants to step aside and see what OIL does tomorrow & Friday – no harm in that.
BAS was only down 9 cents after gaining almost 70 cents prior two sessions. REXX closed green, XLE off less than 1%. So that was pretty positive. I didn’t like how much crude lost when inventory was neutral-bullish, not bearish at all. Maybe some of it was dollar, $$ up huge today thanks to Janet and friends.