It was a Fed Week and the Action (or lack thereof ) and reaction were somewhat expected. Lets look at our week in review.
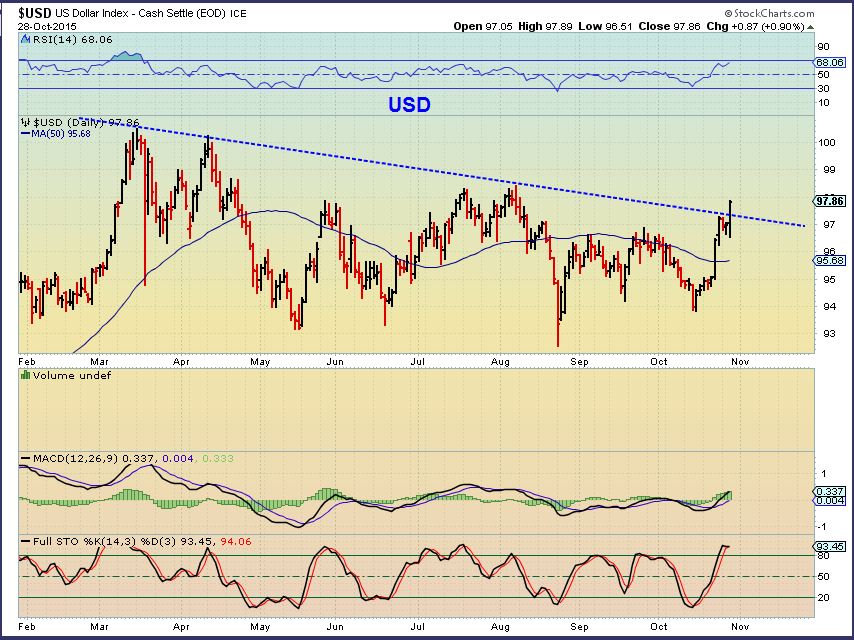
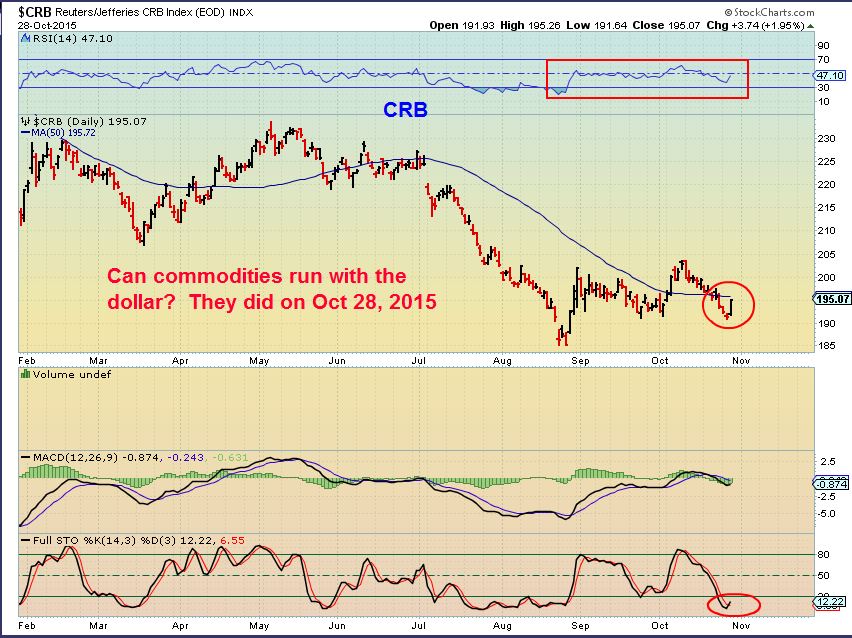
Thursday I mentioned that I found it surprising that the USD & CRB were both moving together Post Fed. Was one faking it’s move?
Now lets take a closer look…
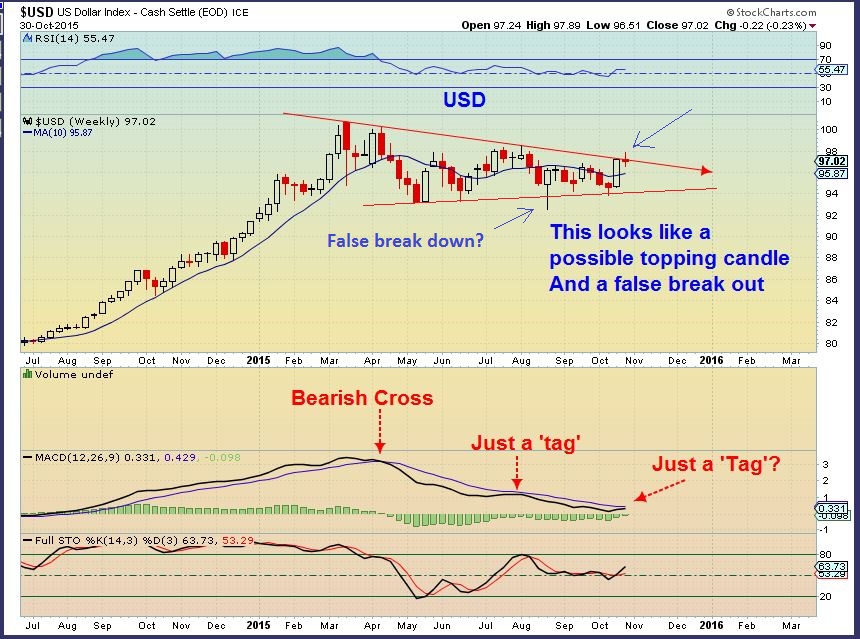
The Dollar reversed direction Friday, closing the week with a possible false break out. If the dollar rolls over, it should be bullish for commodities.
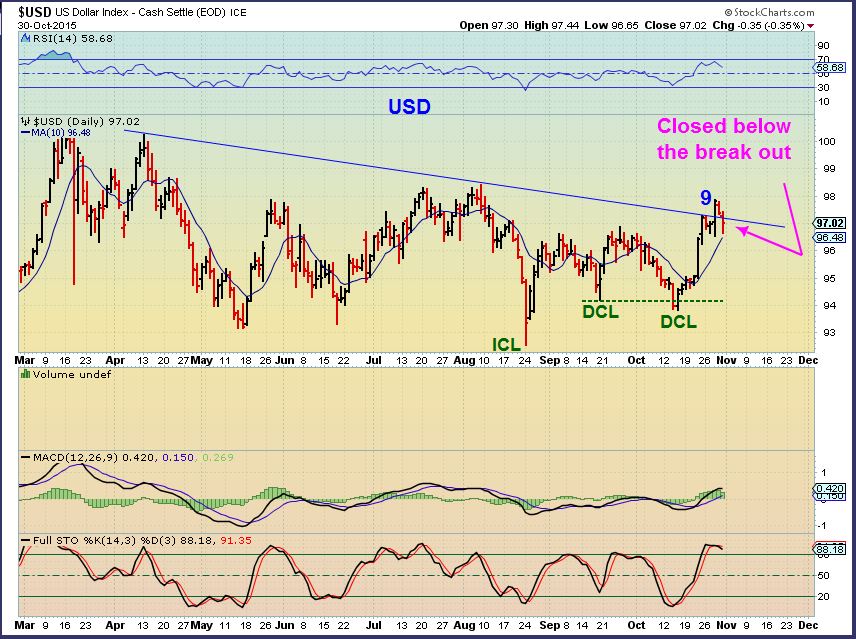
USD – A close up shows that the USD did close below the trend line.
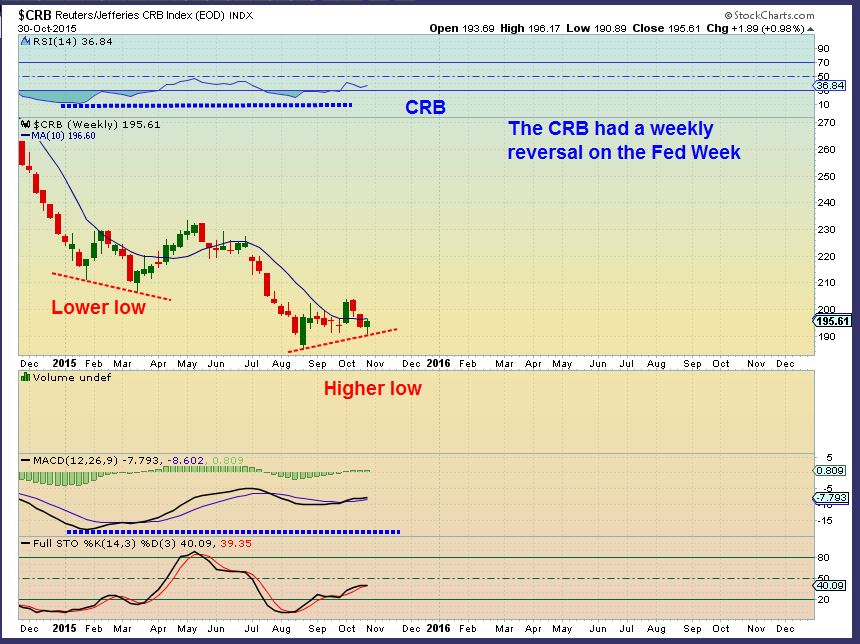
The CRB did not reverse on Friday. Instead we got a bullish looking weekly reversal.
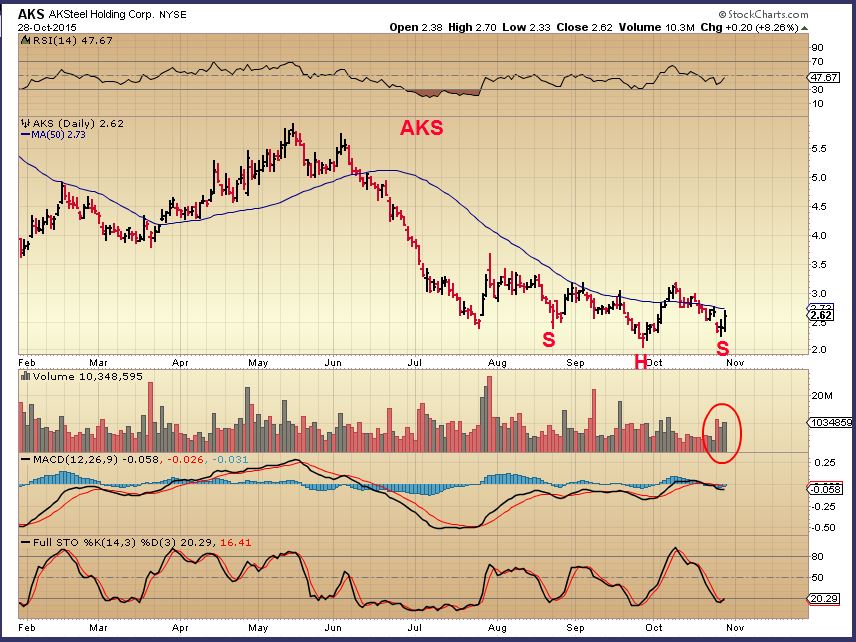
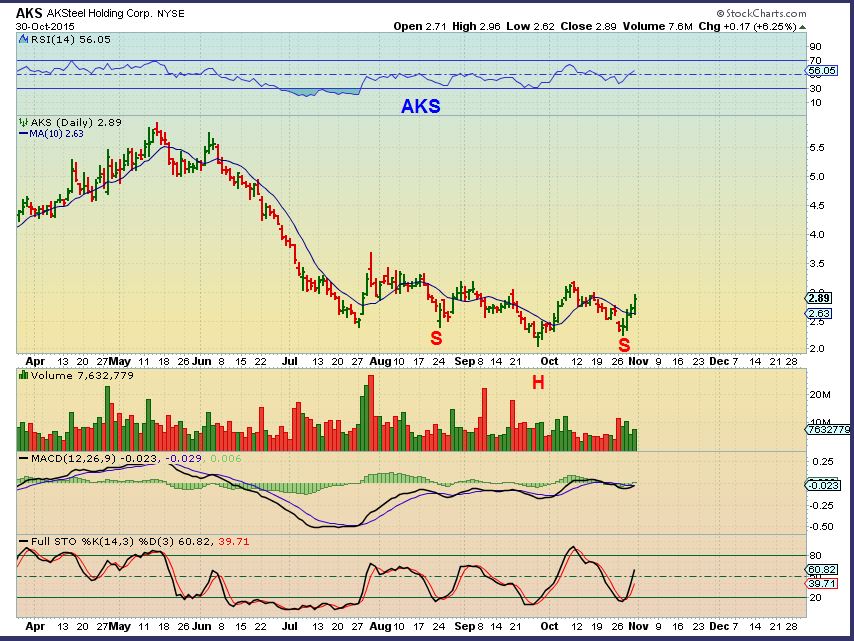
I had mentioned and charted a few commodities that looked like they had been bottoming. I mentioned X, AKS, AA, FCX, MTDR, MDR, VALE, CENX, etc. They look fine after the Fed Decision.
AKS – Then & Now.
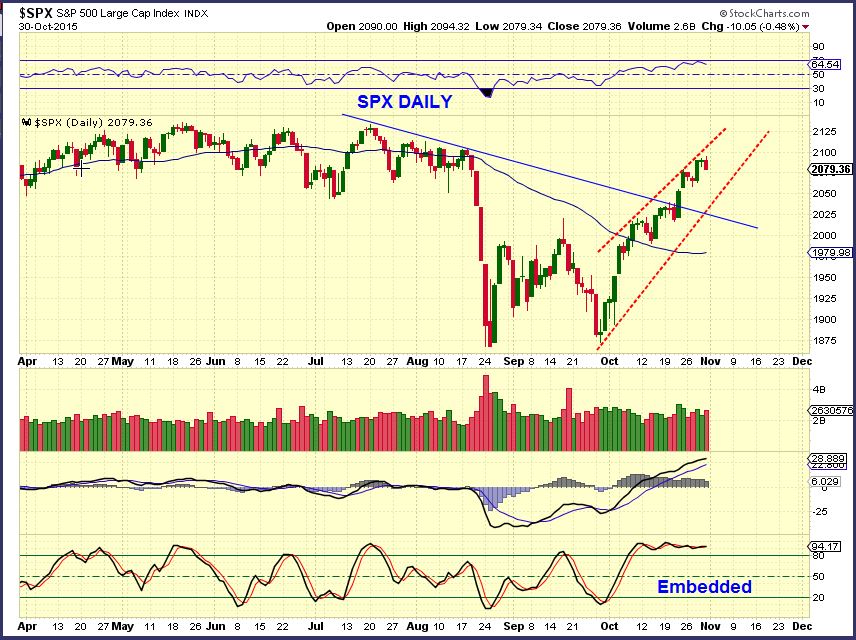
SPX – The markets have had a strong run after the sell off in August. It is not overbought on a WKLY chart and the MACD is shaping up nicely. We do see a Doji candle- a candle of indecision, so we may pause or go sideways here.
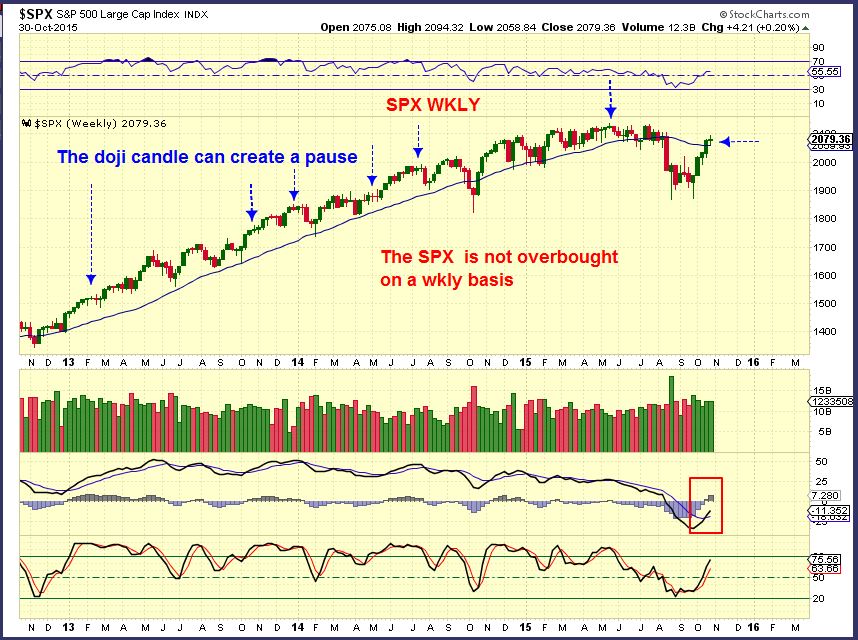
Lets zoom in on the daily . SPX had a strong run higher, partly short covering I imagine. It could drop & rest for a bit. It is embedded on the stachastics (And can stay that way). If it breaks down, we’ll keep an eye on the selling, because…
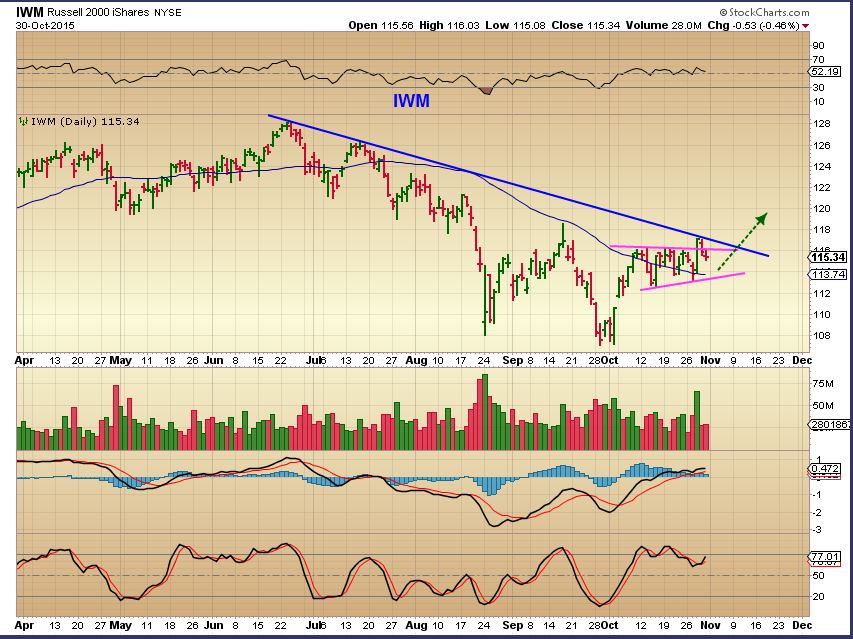
IWM, IBB, TRAN) – When I pointed this out they were still lagging, but IWM had a bullish set up.
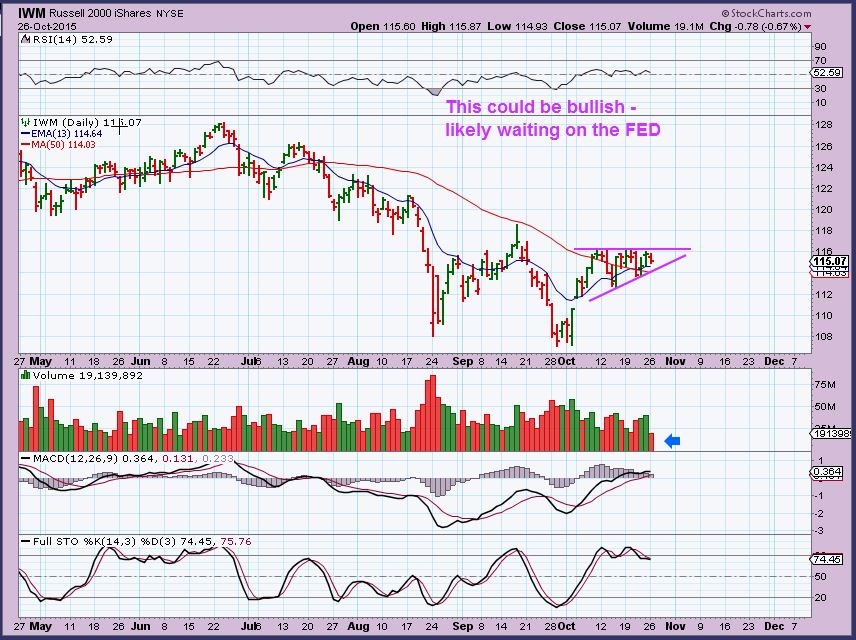
IWM popped and hit another resistance. We’ll need this to hold up or break out or this may still be in a downtrend.
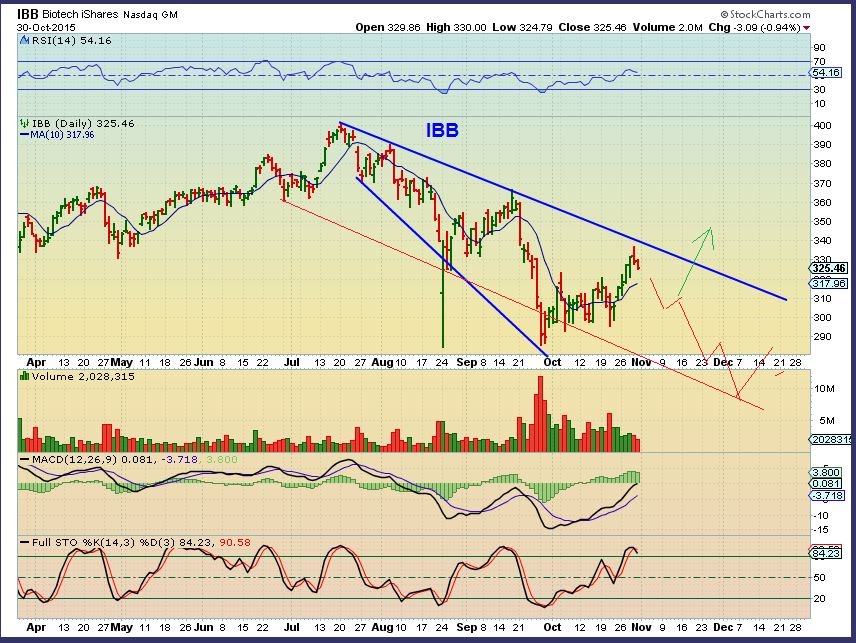
IBB – This could be bullish broadening wedge (Blue lines) . If I draw a trend line from the June lows ( red line) , it is a downtrend. We’ll need to wait and see.
A quick look at a Tech Stock CY that I pointed out shows that we still see progress in some areas.
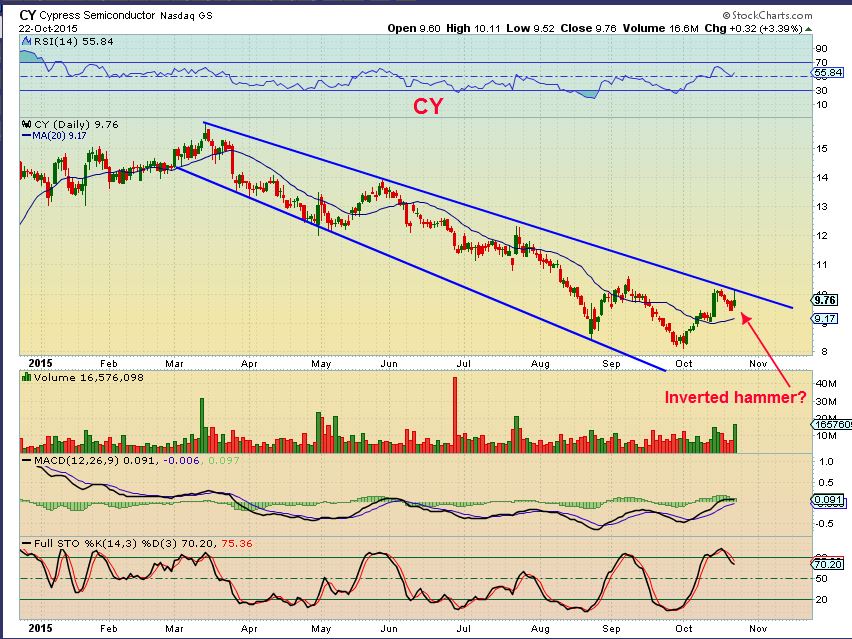
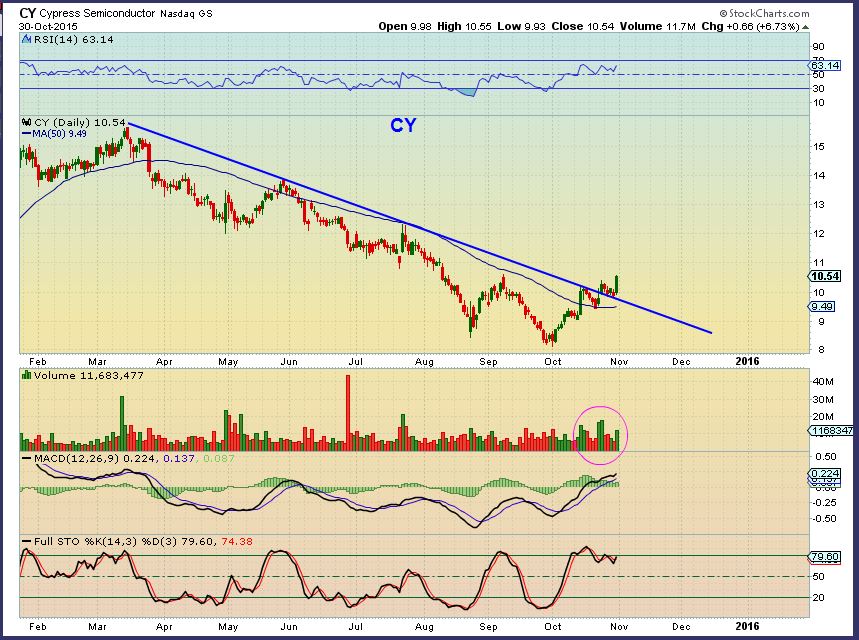
That is worth watching , since some stocks are breaking down and others are breaking out.
$WTIC WKLY – Bullish reversal.
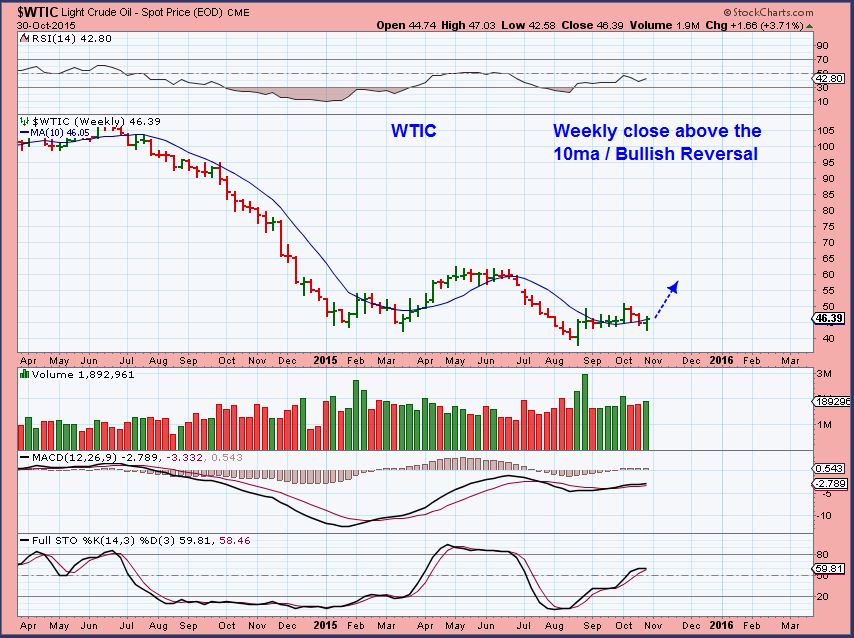
$WTIC – Also held up with the $USD pop after the Fed. 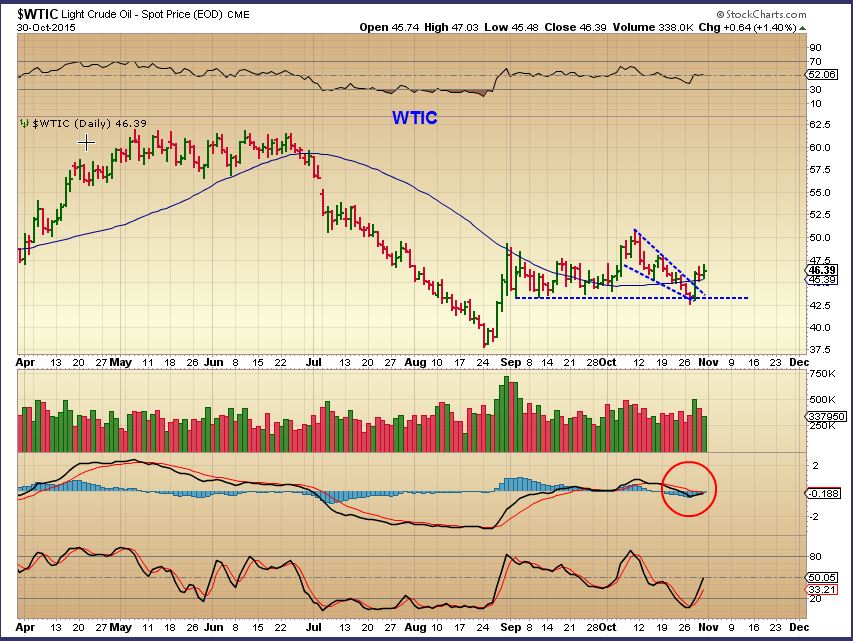
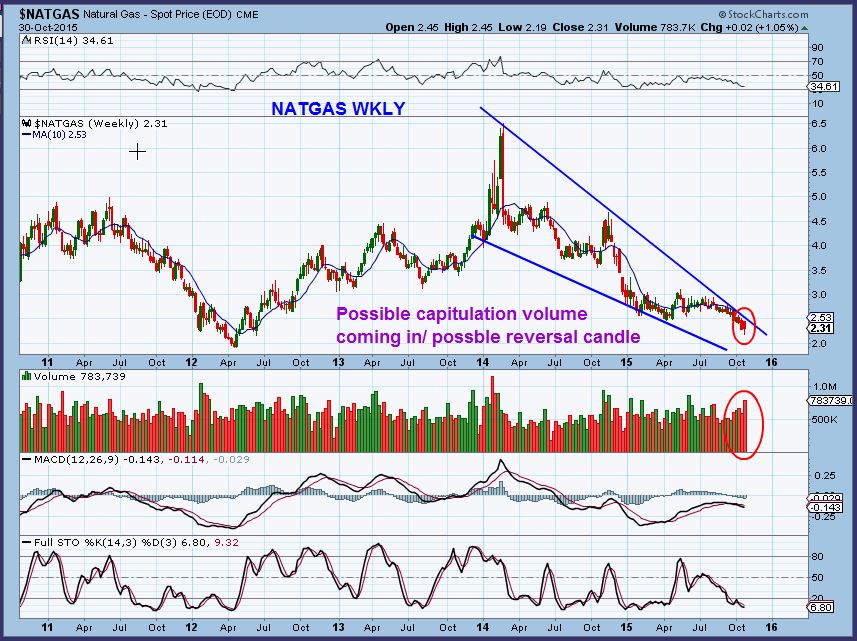
NATGAS is getting interesting. I wrote a public post under the “Blog” tab discussing support levels. The weekly chart has a bullish type candle pushing on resistance and high volume.
NATGAS DAILY – This could be the lows. I’ll be looking for a break out next week. 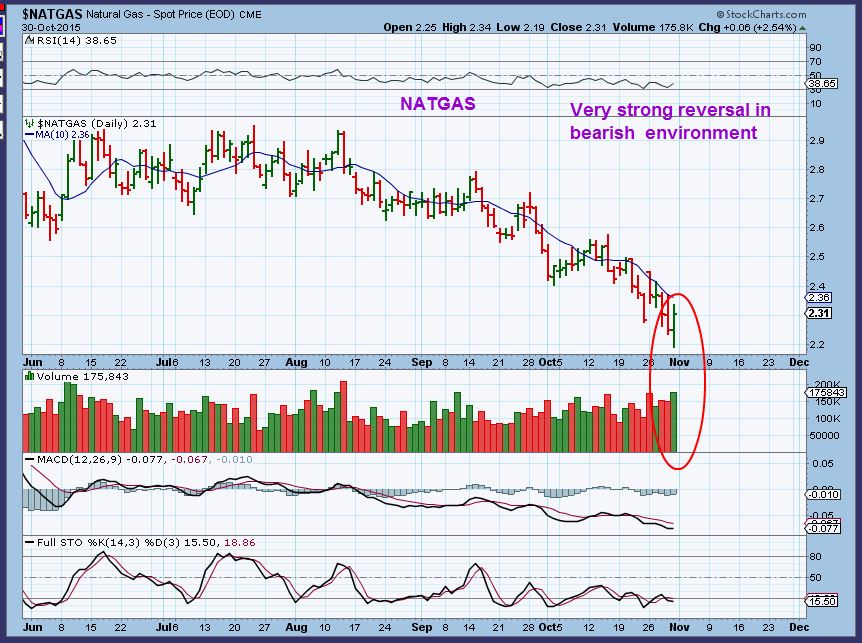
GOLD, SILVER, & MINERS
I have been discussing a possible long term “CHANGE” in the making where Commodities start to bottom and run higher and the Dollar may roll over. My main idea was that The Markets ( SPX, DJIA, NASDAQ, etc) would roll over , since I had been pointing out there topping action since the spring. THAT can still occur, or they can run higher with the commodities complex, So far the markets are putting in a nice run higher, but earnings were very mixed and we saw some companies blast higher while others dropped quickly.
Let me show you something that I have been keeping an eye on for additional clues.
I will show 4 charts below. 2 From October 20, and then how they have progressed since then.
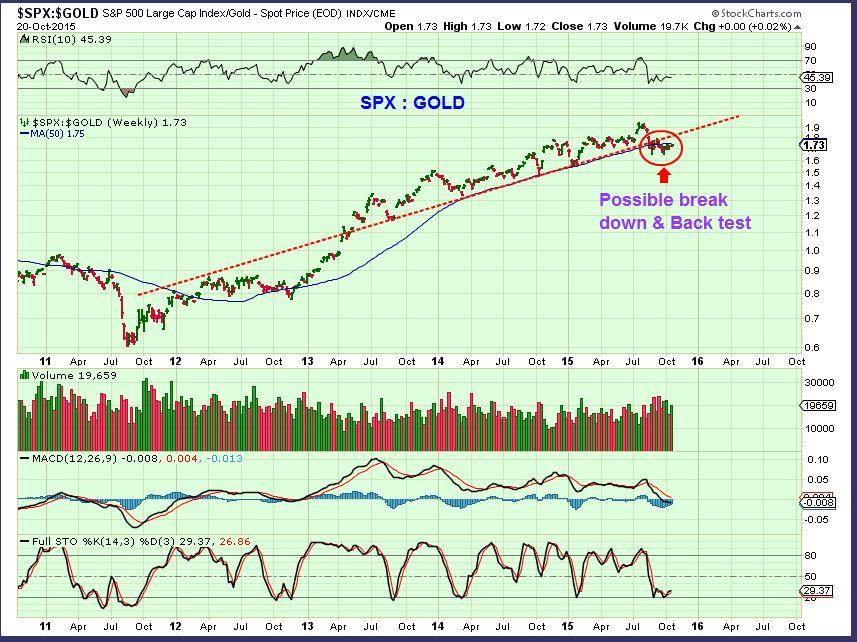
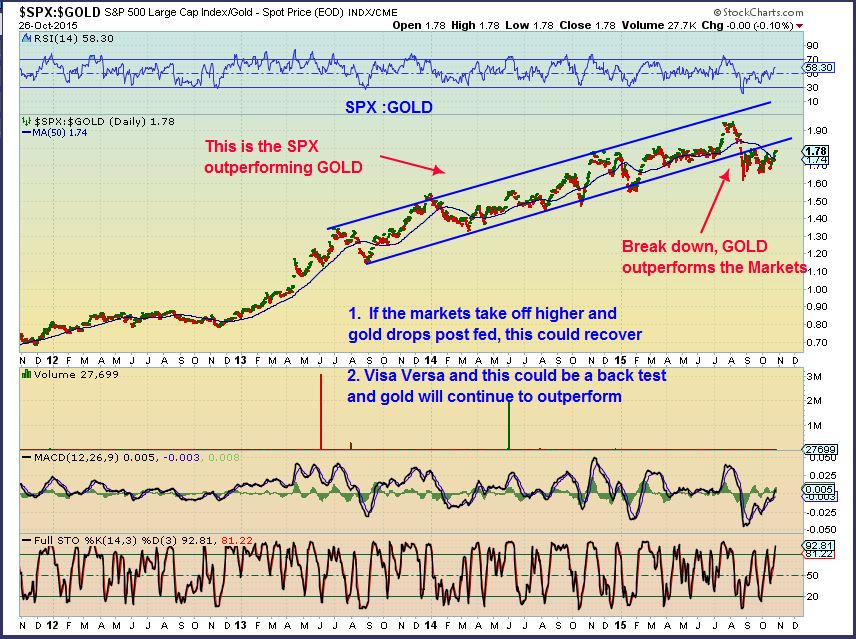
SPX:GOLD – Watching for a break down to see if The SPX is still outperforming GOLD. We had a break down
GLD:SPY shows a break out with Gold now out performing the SPY.. Would it hold?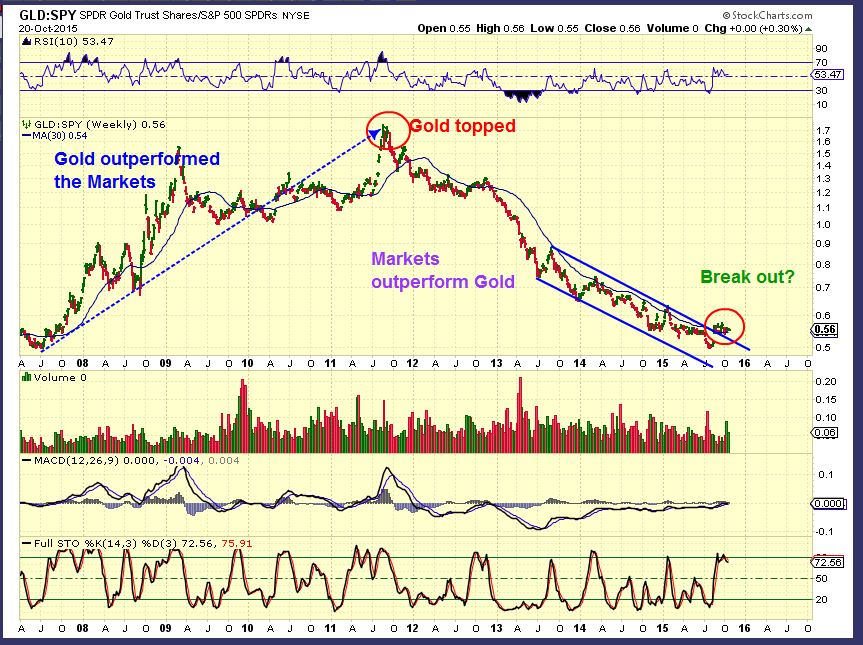
SPX : GOLD – Heading into the FED MTG, The break down was still valid even though the SPX had rallied nicely out of the lows. Read the chart for the implications.
SPX : GOLD NOW – Even after the FED MTG and Golds recent pullback, we see a back test of the break down. Gold can drop further and this would still remain valid , as long as the SPX pulls back too. I think the SPX is going to pull back a bit. Gold may find a DCL and move higher.
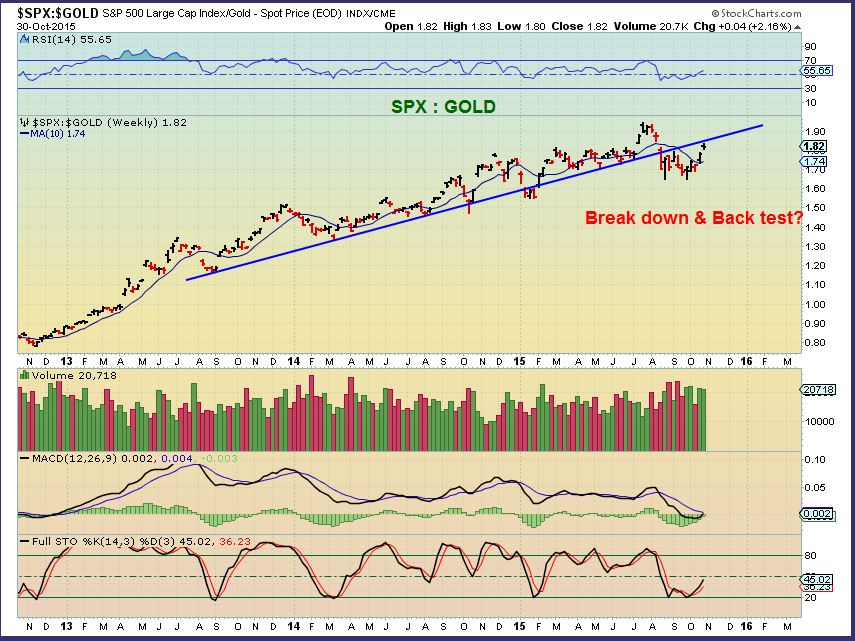
The above chart is a weekly chart. It is bullish for Gold if it holds.
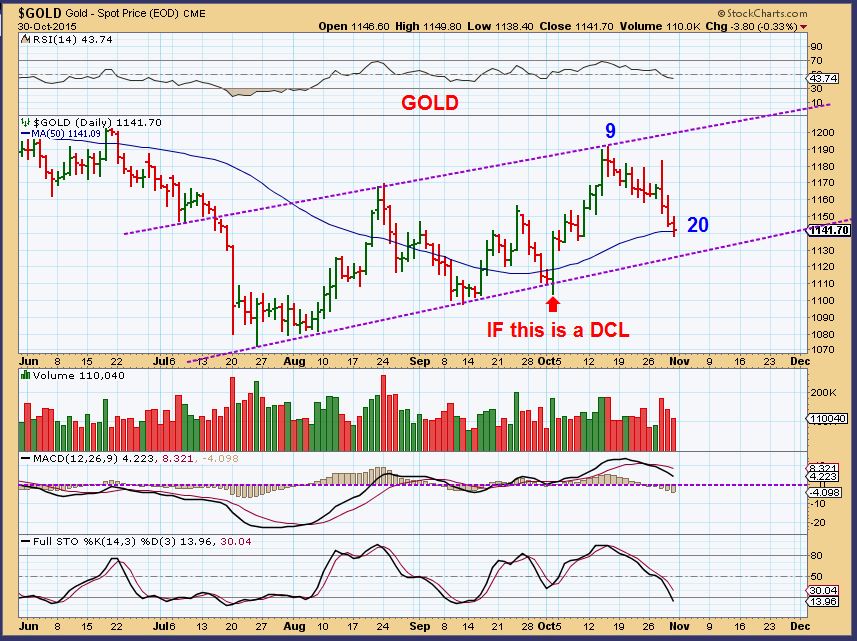
GOLD – No matter if you count Oct 2 as the DCL or Sept 11 – a DCL can come in this time frame and we’ve reached mildly oversold levels. If Gold is going to prove itself Bullish, I would expect it to get back on its feet soon. With OIL , NATGAS, and the CRB looking bullish, I am still thinking that GOLD SILVER & MINERS may be putting in a solid base at the lows.As you can see, GOLD can drop further .
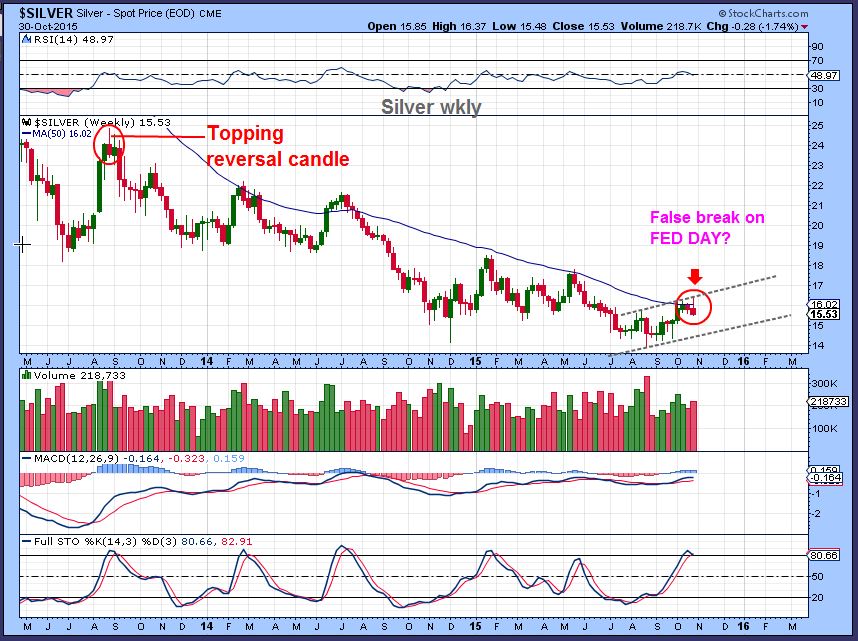
SILVER– Silver has held up nicely, relieving its overbought conditions by going sideways. A false break higher on Fed Wednesday and a drop to the DCL is likley upon us. I’m watching the 50sma and lower trend line as possible support.
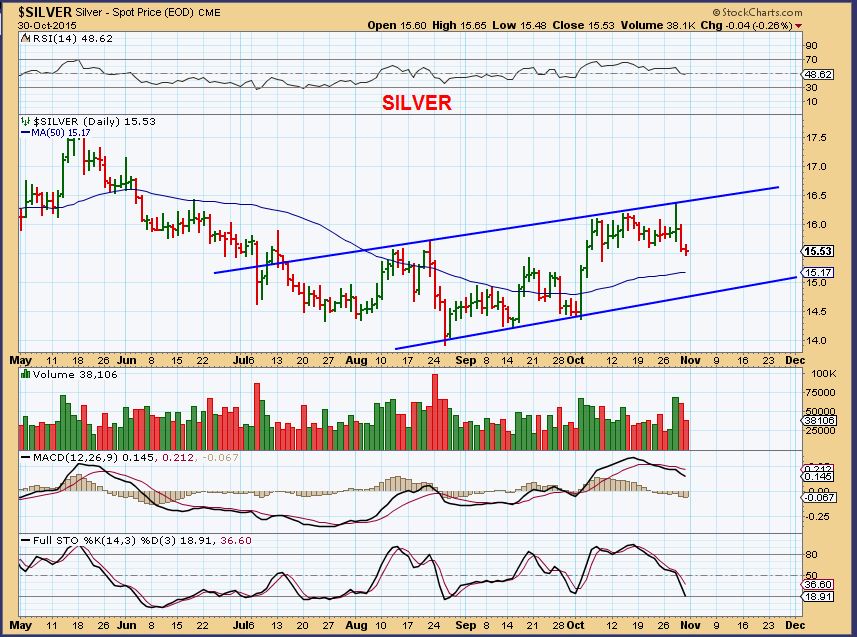
Lets look at the weekly chart of Silver. The reaction on Fed Wednesday looked like we were going to see a break out higher. Now the weekly chart has a topping type candle. We’ll monitor Silvers strength or weakness from here. Sideways drifting down would be nice, but Silver can and often does drop fast. That’s why we will monitor this pull back.
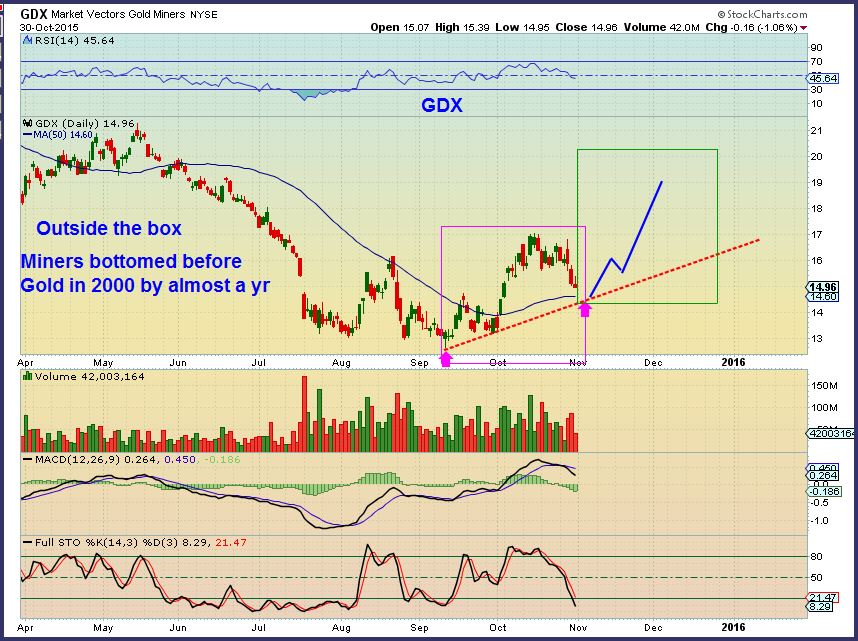
GDX WKLY – Trouble at resistance. NOTICE: We had a drop like this in March and the next week reversed higher. We need to look at the daily charts to see where we are.
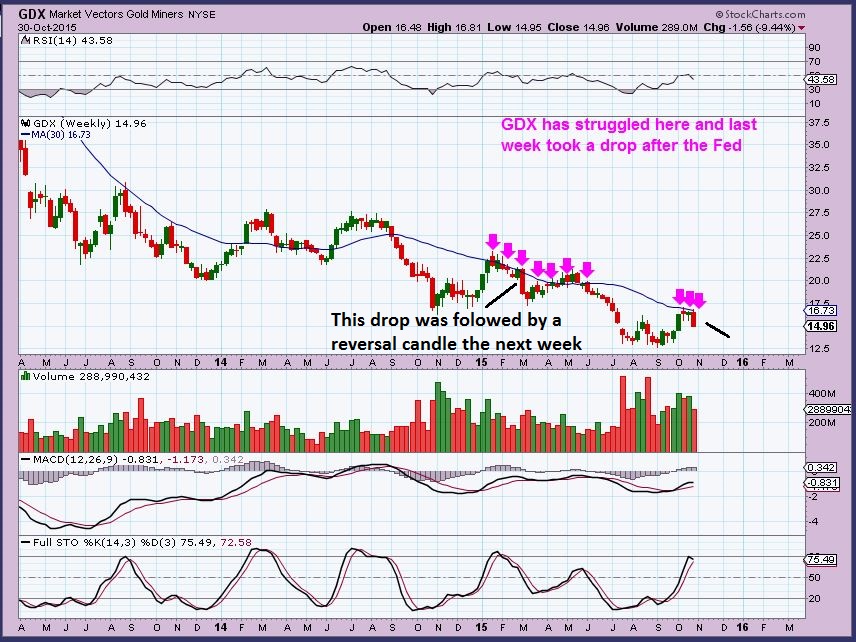
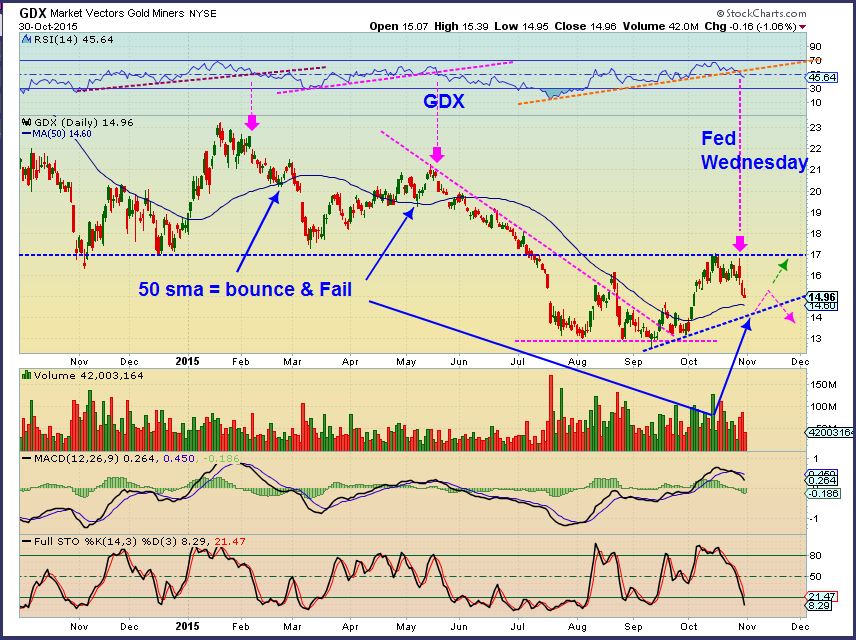
GDX – Big picture. In the past GDX has dropped to the 50sma, bounced and rolled over (Blue arrows). That was in the bear mkt selling. Lets see if things act differently as this plays out. A DCL should be coming soon. Lets zoom in.
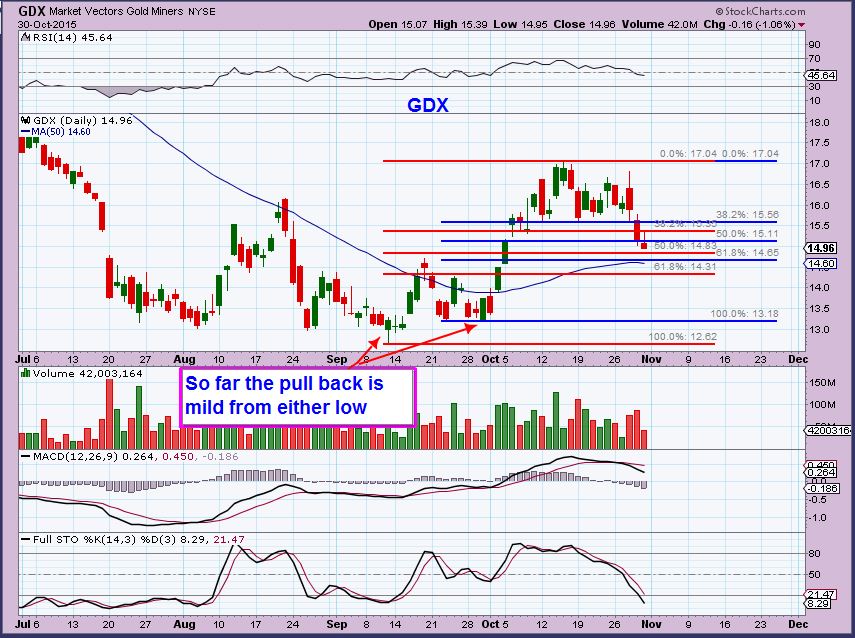
GDX – Currently the pull back is not severe. These are fib retrace numbers from THE lows of Sept 11, and the lows after a mild pullback at the end of Sept.
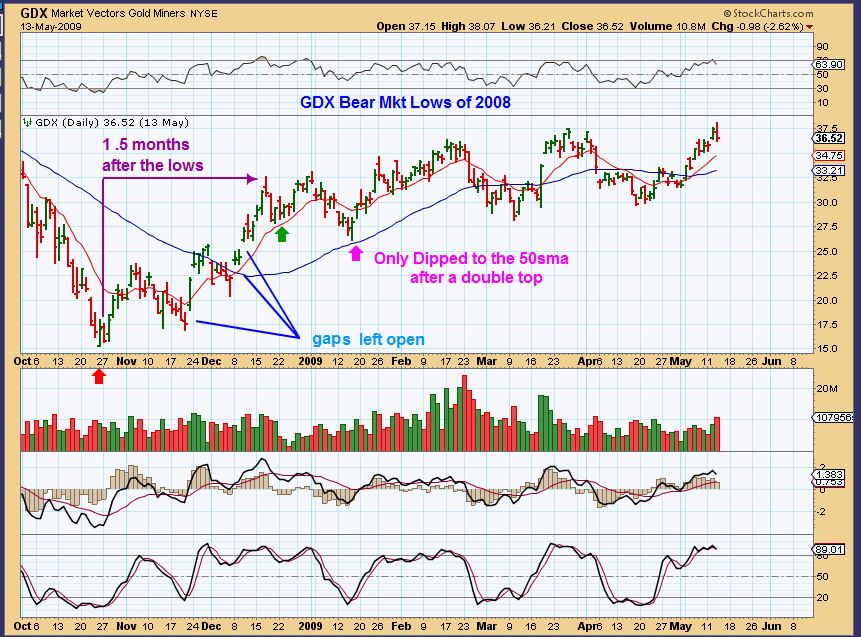
GDX – Bullish projection would be a drop to the 50sma or trend line and reverse to continue moving higher like we saw in 2008 after the lows were in place. In 2008 GDX bottomed on the 50sma .
Reminder 2008 – after the 1.5 months it went sideways for a couple of weeks and then only dropped to the 50sma.
I will be traveling Tuesday Morning and life will be back to normal here from then on. We’ll see what Monday brings and I expect to put out a report Tuesday morning and then I’ll fly be home Tuesday night. Right now I am expecting that we will see improvement in Energy this week , while Gold, Silver, & Miners may be pulling back. Natgas may have bottomed. The SPX DJIA, and NAZ are worth watching. They are overbought , but they can stay that way if we are getting a bullish surge to new highs. I think they are going to pause and could be ready to pullback , as shown on the charts above. We will monitor things as this plays out. I’m interested in seeing the SOX, IWM, and TRAN too- since they did not show strength. Thank you all for being here. I appreciate all of you as subscribers/ readers here and I hope the reports benefit you in your trading.
~ALEX
Riding The Dips 
 Reversals
Scroll to top

Alex, any thoughts on chart of UNG vs. NATGAS? I would normally only chart with the actual commodity, but the crazy contract roll (10% difference) kinda whacked the NATGAS chart (remember you’re remark of it was ‘wrong’ on stockcharts). So, the nat gas chart looks a bit better than UNG b/c it doesn’t have quite the huge selloff last week that UNG saw (due to Nov contract).
CRB is very heavily loaded towards oil. Looks like WTIC found a low last week, so should really help the CRB. If natgas does something other than go straight down, that will also help CRB. Those two together would give it enough power to match/defeat the USD rise. Then when USD tops out, that could easily line up with gold low as you state above. Looks like GDX at 50-day might be a good long. Ride the bounce, tighten stop, so if 3rd DCL rolls over (bear) you stop out quickly. If it’s gets bullish then you still have your position!
I know…I can still use the NATGAS chart for shorter time frame, but with the price reflecting $2.20 it throws off the prior lows being tagged the other day at $1.95 in the overnight session .
thanks chartfreak.. some mad cool charts ..looking forward to the week ahead… best to all :o)
Thanks Princess Jasmine Maria
.. the pleasure is all mine… 😉
hey M.. did Chris ever say where he was disappearing to?.. not seen him on here for ages
Hi SOG. Just seen your question. I am still here but haven’t posted for a while. Mixture of family visiting from Australia proving something of a distraction and when I have checked in I just can’t decide clearly what I think various markets are going to do, so haven’t felt I’ve got anything remotely useful to add to comments of late. So just watching and reading rom the side lines for now until I feel a little more in ‘synch’ with what markets are doing…any markets!!
hi C nice to hear from ya!
Thanks SOG. As I say just don’t feel I’ve had anything of any value to add to the comments recently. Fell a little ‘lost’ in these markets right now, so just watching and waiting!
hmm …. perhaps i should take a cue from u … ;o)
You keep posting! 🙂 From what I see EVERYONE loves it. 🙂 🙂
you’re ignoring the valuable service these comments provide in just alleviating the b-o-r-e-d-o-m of staring at charts for hours, waiting for action.
.. and which is why Maria is sooo useful!
lol … glad 2b of service … errr .. ummm…. 😡
entertainment quality.. 🙂
Would definitely 2nd that. 🙂
..
and yess…. i can still do that…;) some other ‘cool’ tricks as well ………………………..
:o) Hiiiiii Chrisssss … I thought perhaps i scared u off.. HA HA HA
No chance of that! Lol 🙂
Maria the Man-eating Vamp sounds about right
meeeowww
Ooo!! That sounds a little harsh!! Lol I was thinking more…tigress!! 🙂
no .. boo hooo … frenchie’s been super quiet as well. 🙁
Just posted virtually at same time as you Maria! 🙂 But having done so I’m heading off to the pub shortly to cacth up with an ‘old freind’ over a few beers and a bite to eat! 🙂
#jealous…. ;o) have one for me …
I think I might manage even more than one for you Maria. It’s my favourite ‘real ale’ pub and the beers there slip down all too easily!! 🙂
mmm.. yummy… sounds like a great time.. have fun…
I will!! 😉 The first one at least will definitely be for you, so you should hear the ‘chink’ of glasses and the first ‘cheers’ in about 30 minutes!! And then maybe the second about 40 minutes after that!! Lol
🙂
Yeah…so not the open I was hoping for with energy! PMs seem to playing right into your plan. Jobs Friday could be big, so watch positions/sizing ahead of that.
Cas..what index are you following for your energy (i mean out of NYSE hours)?
This morning, just energy futures – WTI and natgas through CNBC; sometimes use Bloomberg as well. For stocks my broker will start giving out bid/ask about 5AM, pre-market trading available at 7. AH from 4-8 PM. Works well for the large liquid names (usually will just check XLE as a proxy) but not for the small cap names; can’t do much there outside of regular market hours – but can guess some based on market open and crude price as to what to expect.
Oil is down 50 cents, but it jumped from $42.58 to $46+ in 2 days , so 50 cents is nothing to worry about.
Alex.. TPLM finally looking good?
to think i was considering this at $2.12 (thanks Xavier for warning me off that one!).. and then again at $1.74 a few weeks ago.
perhaps 3rd time lucky at much better price
TPLM is very interesting – Double bottom with the MACD rising nicely.( at least the downside seems low).
I was Looking at REN and NADL just now. They seem to be 2 of the few advancing while many others pause ( So far) .
PWE and BBG are taking off as well +10% today
Very nice moves
Check out EGO, IAG, SA, AUY,…. MAYBE a sign of a turn coming
Still liking AKS, X, STLD (Steel stocks) & SHLO , FCX< MTDR etc
see also HPQ ( HewletT-Packard)
GDXJ has reversed nicely off that lower rising trendline.. looks like corrections could be done now
(and lower 20,2 BB)
And this is kind of the moment of truth for Miners. I will re-post this chart in tonight’s report if GDX / GDXJ do reverse.
If Miners can break to new highs, we may have a new big picture scenario. If they bounce & Roll over….its that same ole song & dance possibly.
Bounced on 50sma but i’d feel better if it closed the gap at 14.50
Scroll up to the last chart in the report. 2008 lows…gaps never filled until now. IF the Bear Mkt ended, we can gap higher & never fill them.
I think we can go long for a few days (tight stop) until the potential rollover time. At that point, I’m gonna watch until we know more (right along the lines you were discussing).
what u think of HL .. havnt traded that one in ages.. looks finished correcting 2me..?
… for a little somethin somethin like this…??
https://www.tradingview.com/x/aJs8JTyA/
Careful, I think this rally may be short lived. Especially if we are on a 3rd DC.
https://www.tradingview.com/chart/GDX/DIh9zcpu/
I think we can take a trade here. I saw the reversal but I didn’t get a chance to take the trade (work got in the way!) Three days may be as long as I’d stay until we know more.
Alex, do you have eyes on old friend EYES?
Wow – nice Bill! Just looking now,
Loving the reversals in Oils and Miners a lot too
Hi all,
Here is a chart of Oil long term…..this why I am so Bullish on Oil Juniors with low debt.
Very positive today with Oil down .5% and my basket of Oil Juniors up over 5%. I think the Saudis have accomplished what they have set out to do. IMHO.
Also ReEntered Miners via GDX Calls at the 50 sma this morning.
Woohoo! REXX AREX poppin.. crk not too shabby. Im on cell & cant see volume. Was pitifully low earlier ..
Hi Ken,
Do you have a list of oil jr with low debt?
thanx
Ray
Ray,
I think Alex could shed some of his wisdom in that regards.
A few I like though are:
QEP
WPX
PACD
ZINC is a low risk trade at the moment. IMHO. 🙂
I watched that one run on the initial leg up..loved that move.