
One Little Victory
Another little victory for the precious Metals Sector. I like to enjoy them while I can, since I know how fast these markets can change. We actually saw Gold move higher after the release of the fed minutes yesterday, and that was a small victory. A short term top may be close, so we’ll discuss what that may mean.
First , lets review these volatile markets.
SPX- The markets may finally be rolling over.
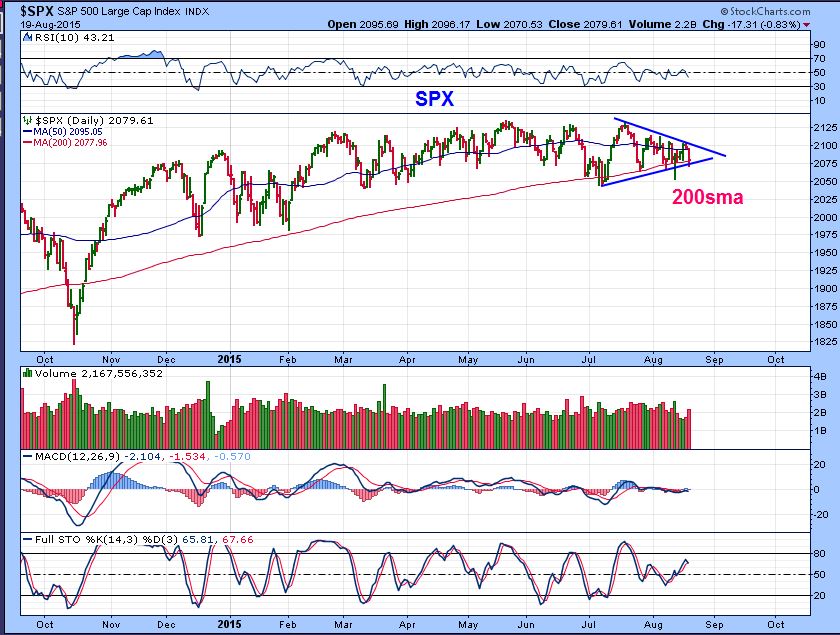
We’ve been discussing this for weeks and I have mentioned that topping is a process, but notice these additional signs.
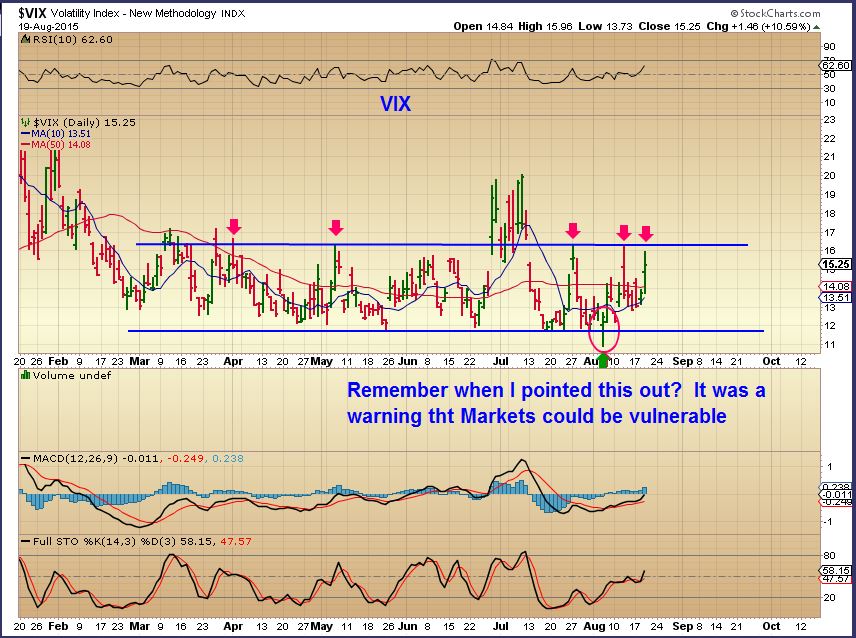
The markets have been in a long topping range and the VIX has been in a long bottoming range. If the vix can break out and run higher, the markets will continue downward.
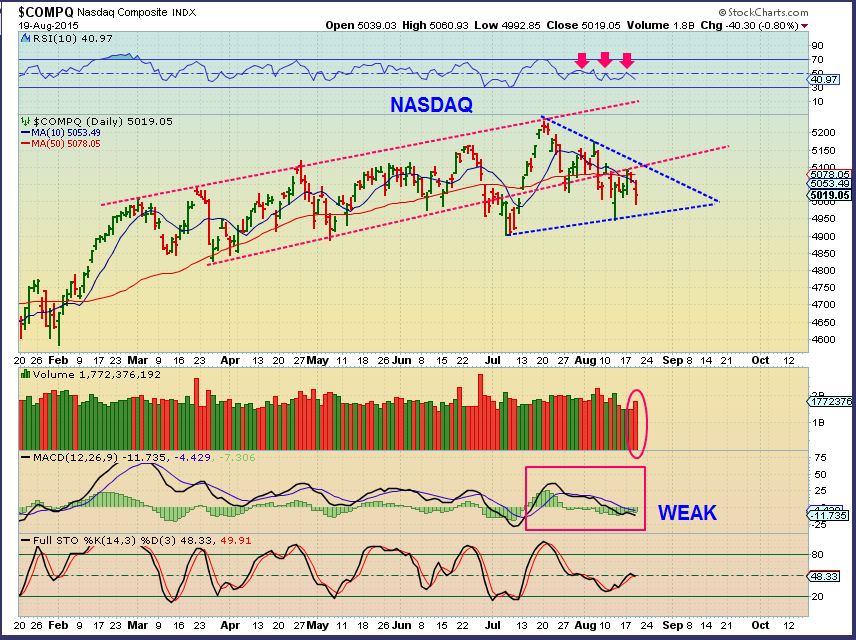
NASDAQ – The NASDAQ was holding up well, but now it is starting to show signs of weakness too.
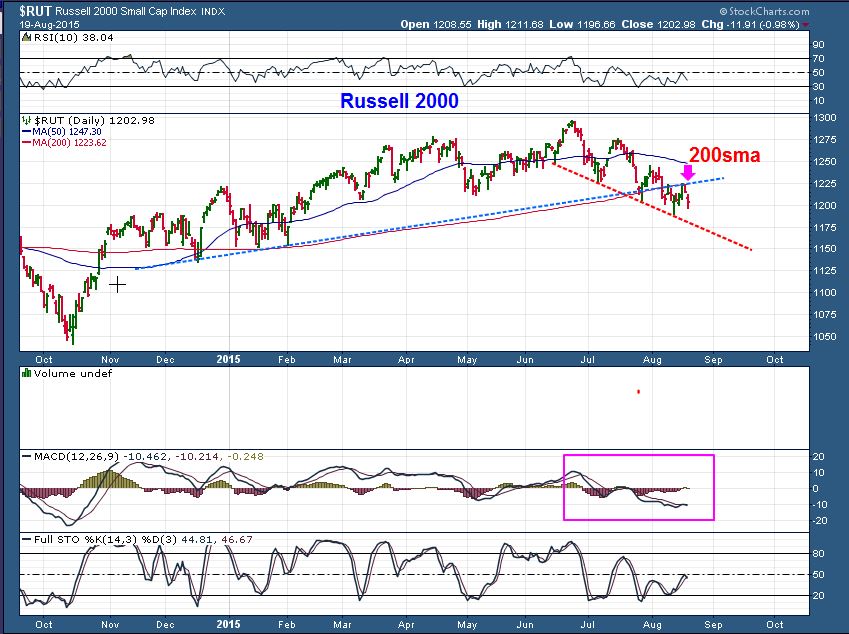
Russel 2000
USD- 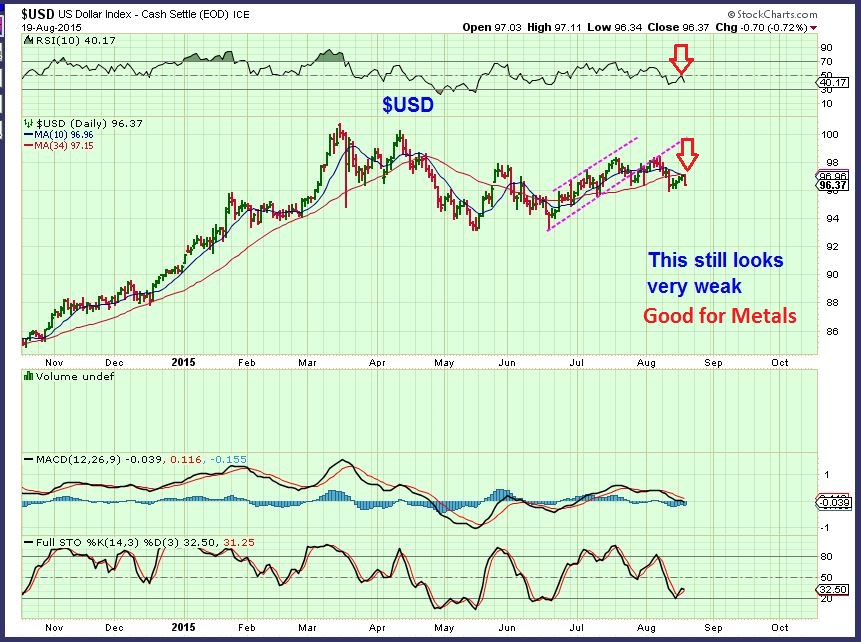
I want to re-visit TLT. Yesterday I posted these 2 charts saying that I expected a drop was possible, we had a bearish rising wedge. We could get a pop higher first or just drop.
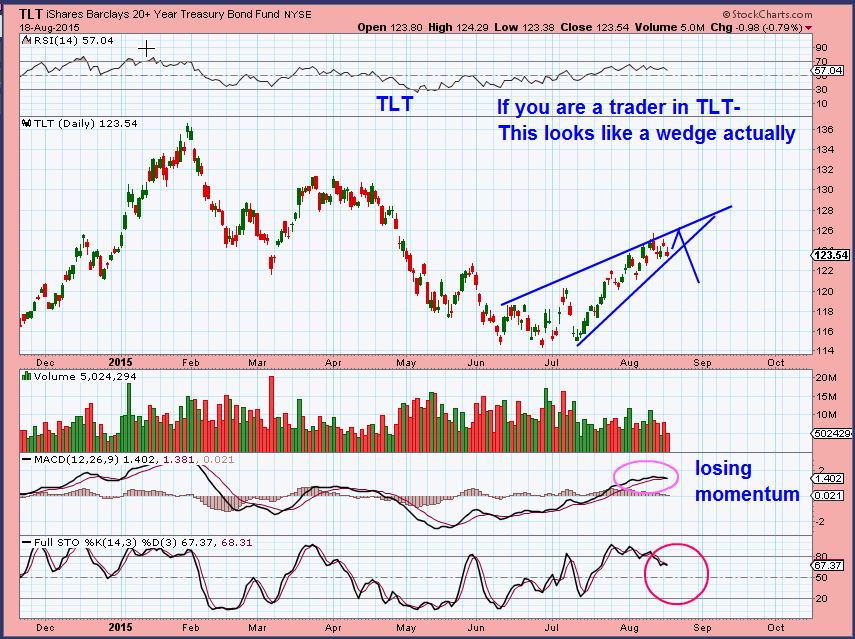
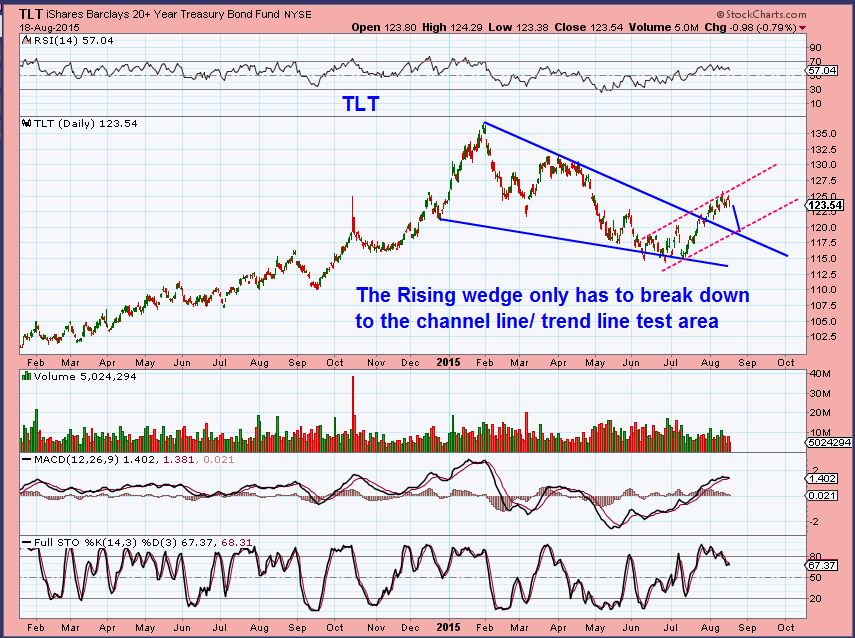
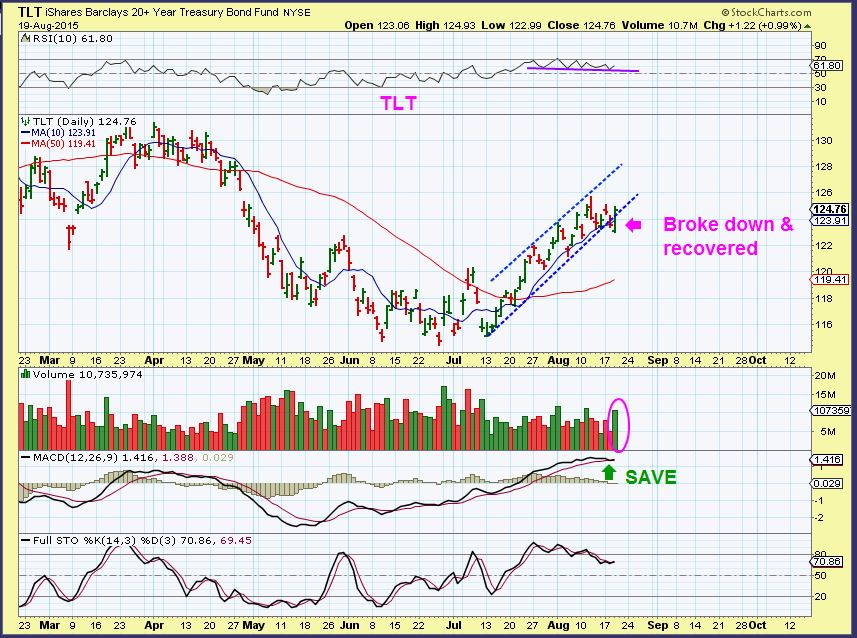
We actually had a drop yesterday and then a reversal. It broke the lower trend line and recovered (bullish) , so I wanted to look at it in another way. The wedge could still be playing out in the move higher, but we also may see a channel form and maintain the recent bullish rise. The MACD, RSI, and other indicators are bullish.
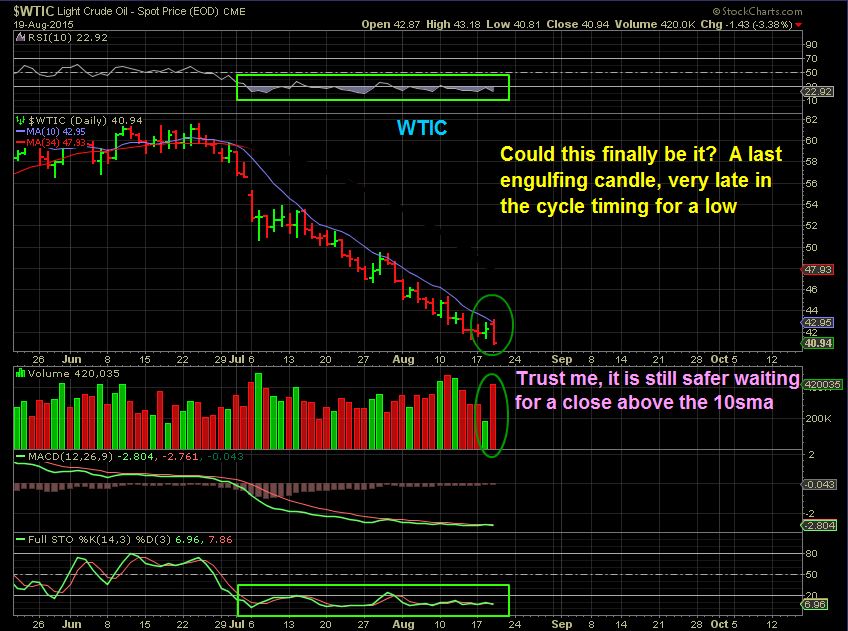
WTIC – Finally?
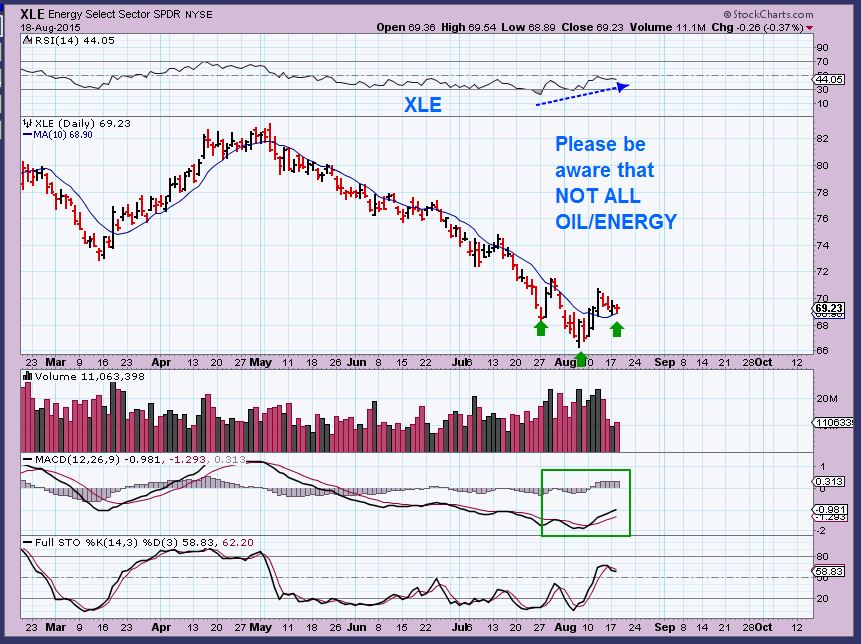
XLE – This chart in yesterdays report showed signs that energy stocks were firming up, resisting oils drop.
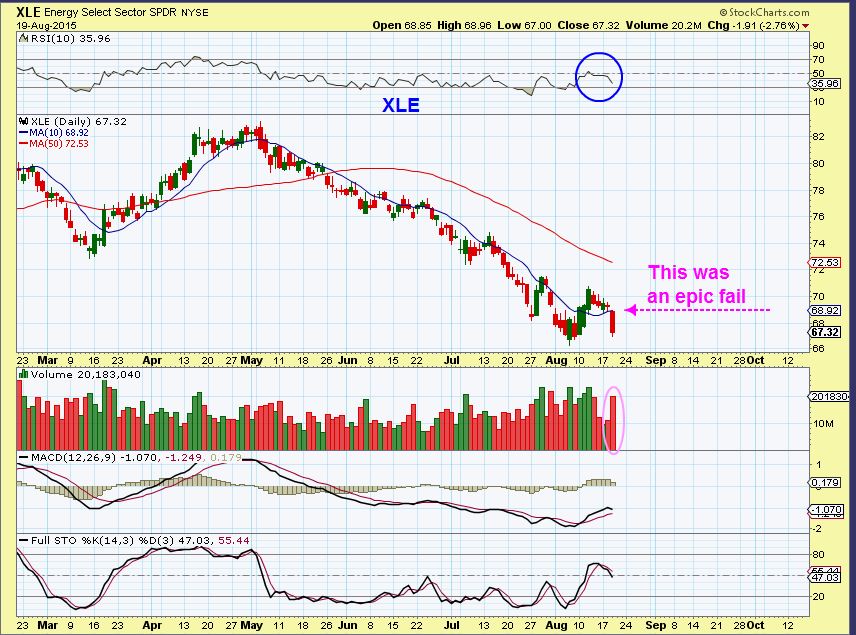
XLE – Epic Fail, no longer resisting oils drop.
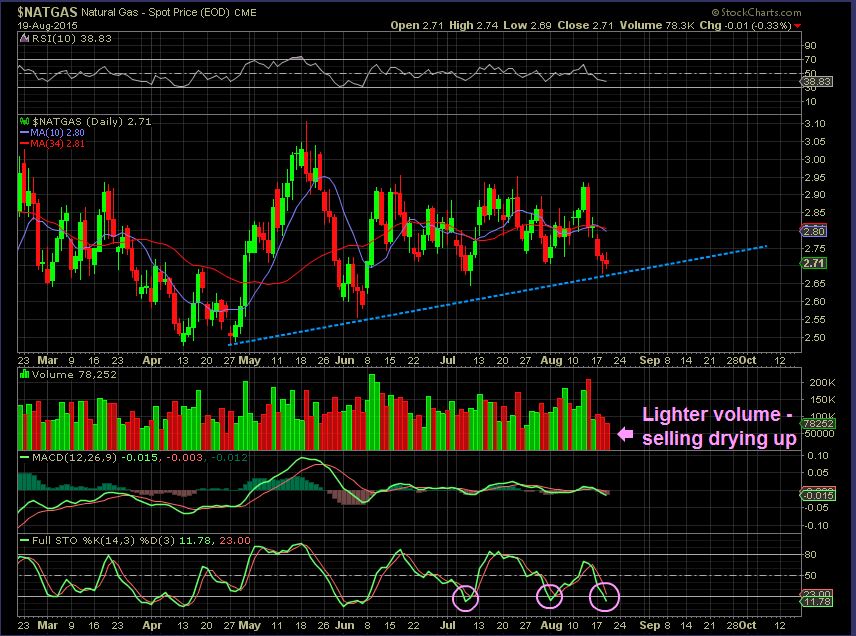
NATGAS – Support?
GOLD, SILVER, MINERS
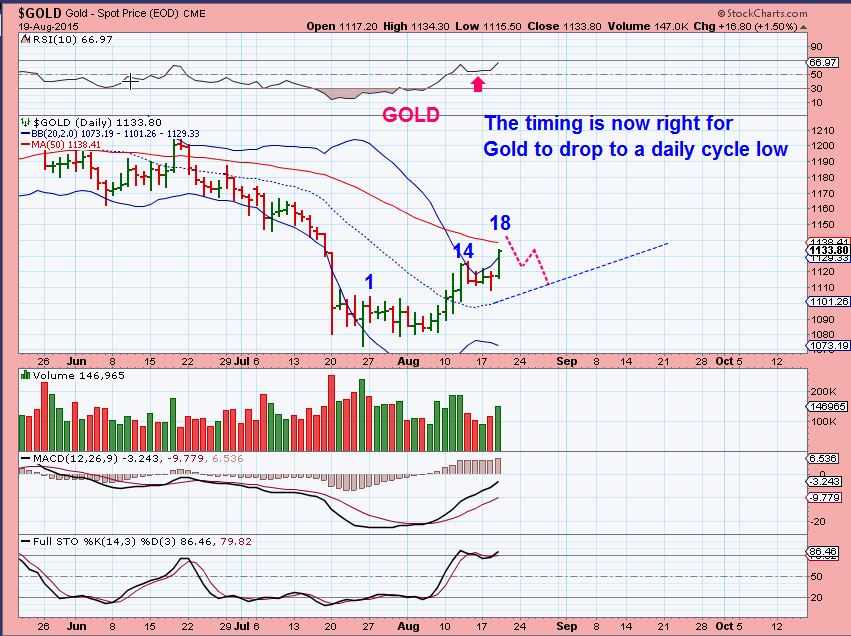
Gold weathered the Fed Minutes release. We are moving along in the cycles timing. The good news is that this is now making a high on day 18, it should be right translated. This further confirms an ICL because it indicates that after a drop into a daily cycle low, it should rise to new highs again in the 2nd daily cycle. Bullish.
.
GOLD – We broke above the 50sma overnight almost hitting $1142. Gold is now strong again. Since we will be eventually looking for a daily cycle low ( A pullback similar to what gold just experienced at the 10sma) and we are hitting above the upper B.B., dont be surprised if we dont get instant follow through into next week. A pullback here is normal and nothing to get emotional about.
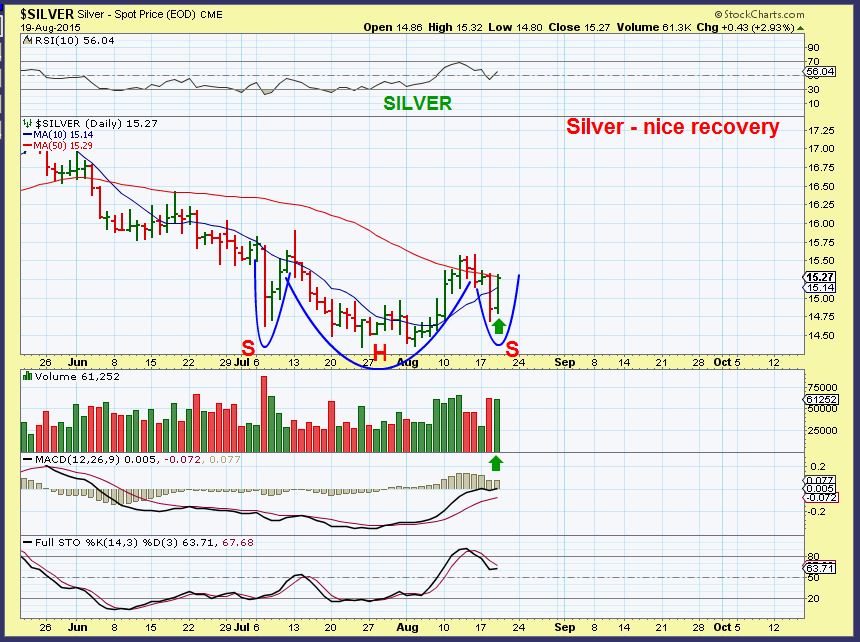
SILVER – The big slam day was followed with a big ‘up’ day. As I pointed out in yesterdays reports, we had seen silver in the past drop without Gold & Miners dropping. Nothing to get emotional about. A possible inverse H&S could be forming. If Gold starts to pullback here, silver may just be bottoming. Silver stocks are the better trade so far.
GDX – This is making things difficult. If you try to use cycle timing on Gold & Miners, they are not close timing-wise. Gold looks to be on Day 18, close to the timing to seek out a low. Miners bottomed 11 days ago and should go higher. Will Miners continue higher while Gold seeks out a DCL? Or, will the miners dip into a shorter Daily cycle? They have done 14 day cycles in the past. This is something that cant be known in advance and I have several ideas running through my head based on past experience. For now I will just advocate not over trading & losing positions, in case surprises come to the upside.
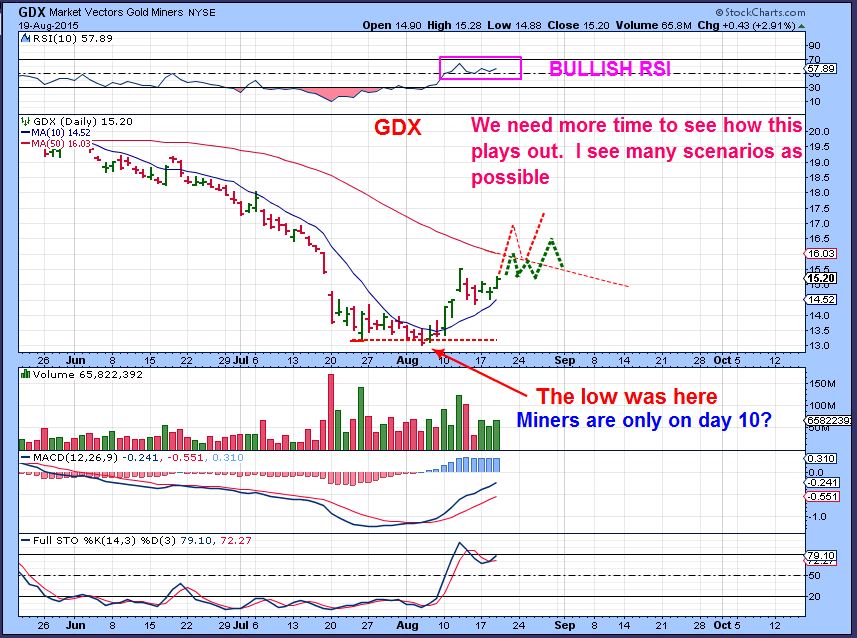
Many miners can just pop, consolidate, pop, consolidate in a stair step higher. They also can run at their own individual pace as we have seen this in the past. For example, CDE doubled last Nov to February, others didnt. SA just doubled in a couple of weeks! I look at mining stocks with a view toward entries.
BTG – Popped on Aug 8,9,10,11
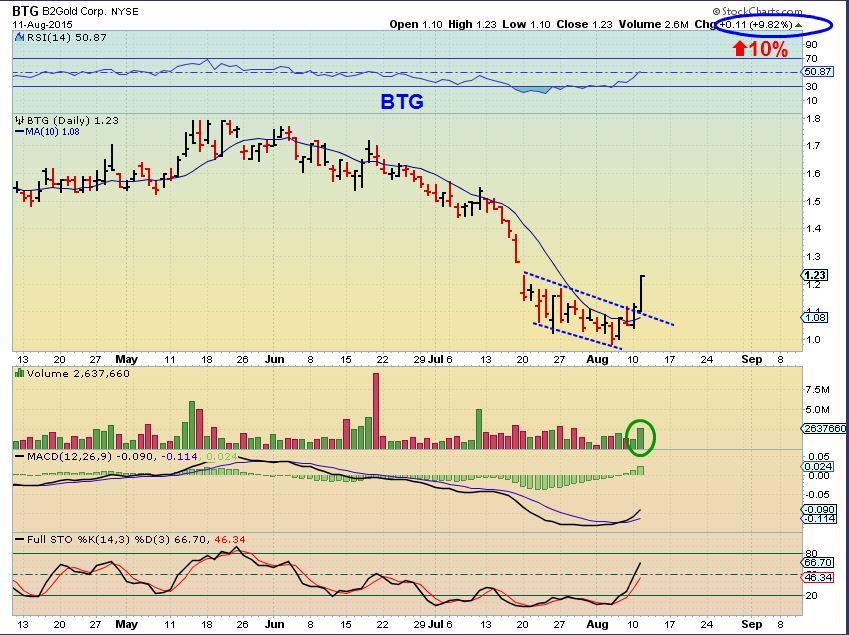
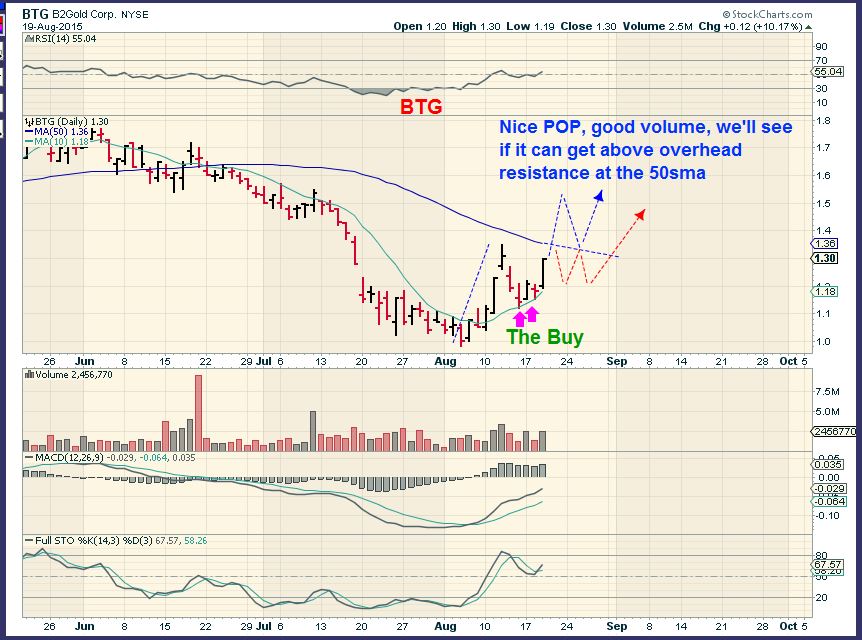
BTG – Dropped back to the moving averages and I mentioned in yesterdays report that it became a buy.
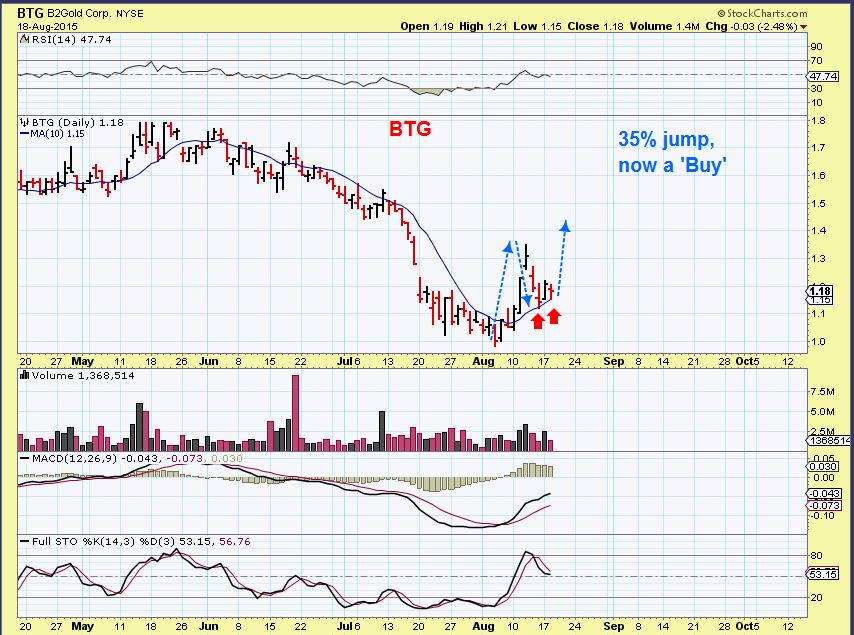
BTG is acting correctly. It may just burst higher and run , or flag under resistance, but the set up was there and is playing out well.
SO…
The stock market looks weak and we are seeing what could be more than a regular consolidation at this point. Is a normal 10%+ correction in the works? Are we topping out for a major drop? It is difficult to know at this point, but I have been saying for Months that this market was acting like a top was forming. Trading here has been choppy and may remain difficult. Even some good looking set ups have been failing. It has also been difficult to short this market, so since July I have really been focused on Precious Metals.
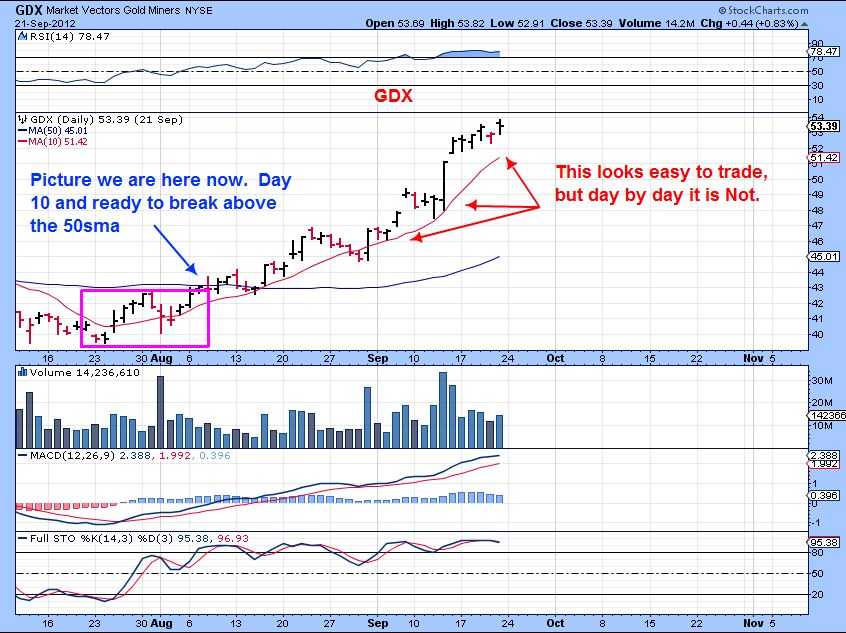
Here is where I am just going to say a few reminders about trading precious metals at this point. I have shown that not all bottoms look the same, right? Price can run higher out of an ICL and just rocket higher in a short covering rally, or it can meander along. Those who over trade that 1st situation often lament that they got left behind. They say that they dont want to chase it, but where’s the pullback? It looks like this …
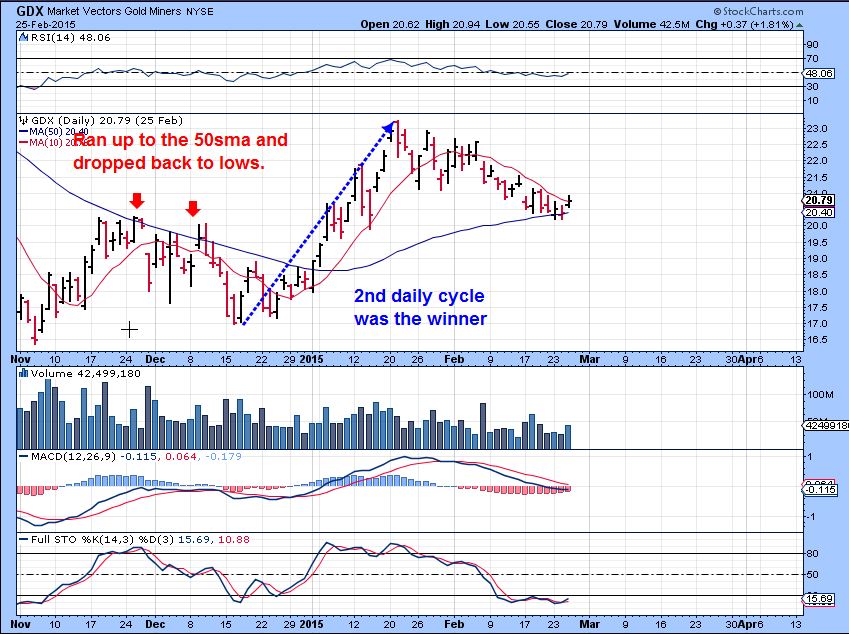
Also, do you remember last Novembers ICL? GDX ran up and dropped all the way back to the lows in the daily cycle low, then it took off very strongly from Dec to February. Buying and holding was painful for some, especially leveraged 3x etf or Call options. 1 month later we were back near lows.
I cannot know what kind of bottom we are looking at, but it does look strong so far. You can raise stops, try to trade it, or just buy & hold a basket of your favorite miners and sell when the 2nd daily cycle tops. That will be sometime in September. Some miners will double, some will lag and play catch up later, some may not do a whole lot. I will try to help along the way, finding nice set ups and entry points in various Miners , but for right now I think the reminder is simply to know where we are in TIME. We have seen an ICL in very bullish conditions. Record extremes in some cases.
Go to this report and scroll down to the precious metals section and read LESSON 2 again.
http://www.chartfreak.com/2015/08/confirmation-time-and-targets/
Know where we are in time. Past ICL’s ran about 2+ months from lows to highs. You dont have to trade very much, but if thats your style, thats fine. Exit overbought and enter oversold, but sometime in September we will want to be aware of the idea that a 2nd daily cycle will top & we should exit and see how things play out from there. We may get a 3rd Daily cycle higher, or if it rolls over, I actually think we should short or play DUST at that point. We may finally drop to the $900- $1000 Gold final bottom, if the final lows are not in yet. Best wishes and have a great day, there will probably be no need of a Friday report, I’ll post if necessary.
~ALEX
Again I want to get this out now, so I am releasing the report and going back to check for typos now 🙂


Oops. Just saw this, posted on yesterday’s. I’ll be scaling gains in calls this morning, more info on last post.
I had AUG monthly expiration so was happy to book profits. Exited runner at GDX $16.00. Still have AUY and FSM shares, baby NUGT position.
Thx a lot CF re US Ts
no problem JD, I was thinking of you when I threw it in there : )
It’s not unusual for a first daily cycle to rally into the mid 20’s before topping. Plus I think the dollar may not find the next DCL until it tags the lower triangle trend line. That could free gold to rally longer than most traders are expecting. Plus I think the early morning attacks are probably done for now 🙂
whats mid 20s ?
He is talking about cycle length of into 20+ days
GDX has strong volume, and shorts could be covering quickly.
GDXJ above the 50sma , and GDX has strong volume.
If GDX is in an A-B-C-D , then it has a price target of $17 minimum , and will break above its 50sma too
Alex, that pattern could only finish still in 1st cycle (as in, not on a straight line but without a DCL like pullback)? Thanks
I dont understand that question, but
GDX can do the A-B-C-D in the 1st daily cycle. When its complete, ti can pullback to test the 50sma as the DCL, and then go higher.
That is a stronger case scenario, but it does look strong today. I wouldnt be surprised to see GDX close the day with close to a million in volume.
Thanks. You read it correctly. Though as, I re-read my question now, realize my question doesn’t seem to be written in English. But that was what I was getting at.
What praytell is an abcd move?
I only know abcde or abc.
Ie. 3 or 5 wave moves.
Show me..ahow me.. (my 2 fav words)
Man, feels great to be up when most traders are down hard last 2 days. I have to go into work before I get fired like Maria. But had one more comment first.
BOOM!!!
Great writeup Alex, definitely helps me to be cautious against overtrading, always a risk given the volatility in this sector. I have some GDX, GDXJ, a few shares of JNUG and modest positions in SIL and PSLV. Going to resist selling my positions while it’s early but I’ll also try to scalp a few percentage points here and there in very small trading positions in JDST from time to time as the opportunity presents itself.
Sounds good CS 🙂
Maybe we fill in that gap from the morning. If so, goo place/time to add? Yeoman’s job, Alex.
LOL- I had to google that one 🙂
I suppose I coud have said well done but that says it in better way:)
SVM turned into a dog. Apparently they pulled their listing from NYSE. I’m out with a flesh wound. Really hoped that was going to be a good one.
Ouch, I was looking at that stock ( its on my silver list) and thinking that it may do well.
Bummer
Had some of that. It’s gone now.
Quite enjoying my ride in DXD (ultra short Dow) at the moment. Just pondering whether this is the start of a much bigger correction which I’ve been expecting or they are going to make one more save around that 17,100 area and force another short term bounce before the downside really picks up steam!!? Alex or any other CF’s have any thoughts? I do beleive we will be going much, much lower by late Sep so maybe I should just hang on and add if we do get a short term recovery?
Agree, but I am certain there will be another turn up or 2 before we could see an actual,equity bear. I’d stay frosty personally.
Thanks Cason 🙂 I decided to ‘lock in’ some profits close to the lows before last night’s close. I think I may have been a little early on that now!! Another lesson learnt. Just keep your eye on the bigger picture and don’t try and play the shorter term moves!! Bigger picture for me is that equity markets will be heading MUCH lower by late Sep. So should have stayed with my short position. Like I say…another lesson learnt!
Markets could still rebound going into the weekend. Certainly oversold on short term indicators. Taking profits always a good move. Sometimes I feel like I learn lots of lessons (but don’t make a lot of money!).
I know just how you feel Cason about the lessons and the money!! Lol I’m just really kicking myself right now as I’ve been waiting for lots of things to line up over recent months in order to take some major shorts on the equity market. I started to get some on board a couple of weeks ago but then got wrapped up in the daily moves rather than standing back and just keeping my eye on the much bigger picture. To give you some idea I expect to see the Dow below 15,000 by late Sep and potentially nearer 14,500. So what an idiot trying to play the smaller daily trends when I believe that!! Should have just stayed with all my positions and kept trailing stops down. I’m based near Europe and have been shorting UK and European indices as well but closed my postions way too early and have left so much money on the table this week it is truly frustrating. I know there will be other opprtunities but I do feel like having so carefully planned and watched for this one I’ve made a right mess of it so far. But will hope for a good bounce near term and re-enter my shorts. It could be worse. I could have lost money rather than just missed additional profits!! Thanks for your replies though. Much appreciated and nice to feel you have company on our journey rather than trying to do all this on your own.
Yep. We’re all here for each other, man. I completely missed this, was just watching the rails, by the time I saw the break down I was just staying away. Likely we get a respite from selling, hit moving avgs from underneath and get 2nd leg before decent low gets put in
Out of XLE calls with very small loss when it broke Resistance with “gusto”…….man that looked good! grrrrr 🙂
I still think that Energy will be a very good longer term long trade soon, but gotta honor those stops.
Ken, keep trying. I’m going to poke at it next week if we see market stabilize. AH right now not promising for Fri, GLAD I decided not to grab today but wait until after weekend!
I know that GDXJ is up 5% but would like to see more follow through in some of the small to mid priced stocks. I would have thought that just about all of them would be up quite a bit today. Maybe we’ll pull back a bit before another surge higher. HUI 130 or so seemed like the first stop on the way to about 160 for this move. Look at ACI and BTU today. Crazy.
ACI got up to $4.40 today. Now back in the $2.70’s.
BTU up 40% when I checked on it at one point. 100% move from lows 🙂
CDE has a lots of potential. Still holding from lower $3.
(refresh)
Ya, LeChiffre, I lost my EGO Yesterday but still holding CDE.
I told my friend That I thought it was a low risk buy ( Bullish Flag/ Wedge type consolidation)
Working on wave 3 of 3 with GDX imho. 🙂
i had this one now Ken, for GDXJ.
maybe get a DCL when 5 tops out.
of course…just a guess, i know .. blah blah 🙂
Problem drawing EW for the miners, is that whilst $gold/silver continues for 23hrs a day, the miners go to sleep for nearly 16hours.
All the nice continuous waves that gold can make, are chopped out of pattern (in the miners), and so miss a lot of crucial turning points.
Thats my excuse anyhow.. and im sticking with it
lol 🙂
Giggle
I can see that….plausible. Your 5 is my 3. 🙂
yeah, gdx and gdxj seemingly on different wave structures, with gdx having bottomed-out long after gdxj
i had your shorter wave 2 zigzag as an alternative 2.
looks just as nice
Awesum ken!!
Thanks Maria. Just what my crystal ball is showing. 😉
Feel free to throw us a chart or two from your crystal ball. Your crystal ball is Much shinier than ours. 😉
;o)
Looks like 3 could be top of 1st daily cycle and 4 the drop to DCL to equate to cycle theory in the above chart?
He he …luvin the EW discussion guys 🙂
Out of pocket most day 2day so reallly appreciate the charts posted.
🙂 bug smile .long & strong….
Meowwwwww… (in my best catwoman missyElliott voice)
On 8-3-15 I made a few predictions. Estimating GOLD to $1554 and GDX to $17. We are getting close friends. Nobody knows if this will keep chugging along or not.(refresh)
Bill..if gold goes to $1554 on this run.. i’m taking out a 10yr subscription to ChartFreak, straight off the bat.
😀
i say … whomever comes the closest gets to host the First Annual International Chartfreak Holiday Party… lmao
Ah yes, heavy fingers $1154.
Already got the 1154. Bring on 1500. 🙂
Shorting NUGT into the close
u cray cray…..;o)
covered for a quick scalp
lots of buyers
Hitting in the multiple resistance zone, but we can still go higher tomorrow (refresh). We may have seen short term highs today , but $1162 looks possible.
.
yep. I see. and this too (refresh)
Negative divergence on GDX hourly and at the 50 ma on daily. Will look for a JDST trade tomorrow.
http://screencast.com/t/otttLn0MNF
GLD up BIG in Asian session. I might wait until Mon for counter trend scalp.
played out got out JDST
Your crystal ball is en fuego! Printed 1162 AH.
yup…cheers to CFs crystal balls… best out there…
oops-i mean ball.
Uhhh…I read that too fast the first time :O
;o)
Alex, any concerns with the significant difference in moves between some of the juniors–i.e some really moving and others just standing still? I’m also getting a little too giddy with gold and too pessimistic with equities so maybe time for me to trim a little off the top. 🙂
according to the ratio. I would suggest a pause here.
(refresh)
Miners update eod.
(refresh)
I got me some FSM. Feeling good on that one!
probably the best opportunity (short vis BIS). will crash the hardest.
(refresh)
That was wild overnight action – looks like gold may have hit resistance overnight – this is a 4-hour chart: http://tos.mx/wBcuX0
Sure was! I saw 1168 in the Asian session. That is WAY outside the upper BB and we’ll above the 50 day, expected pullback. But also coincided with overnight lows in US equity futures which believe it or not are well off their lows.
Im w ken.. i think its still in 3.. 4&5 to come yet
Its only the first daily cycle…it’s right translated. Absolutely more upside to come, a 2nd daily cycle will have new highs. A pullback will be in there, but it can be fast and sharp or sideways.
cyclebabble… 😉
I do believe it saved Ur Butt , the last time you said you hate cycles because you dont understand them. It was at a cycle top : )
lol… annnnd i still don’t understand them… lol
i need a teacher 2 explain them.. that and COT report….. webcam?
Video tutorial? I have thought of it .
Agree !!!
Add on this Pullback.
4-hour US$ – at a good point to bounce, helping a drop in PM ?
http://tos.mx/eUXSFt
Oh, if you care to look at chart, click on link AND then click on chart – don’t know why ThinkOrSwim changed their system…
GDX is above the 50sma, significant.
Is 15.90 a good place to move stops if it closes above 50sma?
sweet sweet GDXJ… going back up before dropping again!
…wave 2 of an A, Maria??? 🙂
managed to exit @ $22.50
Hi Alex,
gold tested back the trend line in the morning. I would like to know what do you think regarding gold’s daily cycle top which can come any day now.
After this trend-line-touch we should have one more higher high – around 1170-1175- before we go down to DCL,shouldn’t we? Where would you wait the DCL?
Thank you
Sorry B.T. – There are many ways that this could play out, and in prior reports I have pointed out that “Not all bottoms look alike’. Not all runs higher out of lows act the same either. Varying factors will affect how it plays out.
Well, when you know, let us know! 🙂
I will know 100% on Dec 2 2015. Remind me 🙂
Silver has just been smacked…again!! 15.72 overnight to 15.09 now. POssible handle for a cup & Handle bottoming formation!?? Just wish I could actually post a chart!!! 🙁 15.55/15.60 is becoming a very clear line in the sand on a 4 hour chart.
C, just drag your pic into the bottom of the reply message (or ‘join discussion’) box
I’m clearly a total idiot when it comes to anything IT. I can’t seem to get that to work either. I come from a pre-PC era and my first charts were personally hand drawn!!
ok…. have your pic file accessible on desktop (or in some other open folder).
alongside have your CF browser window open, with your message typed in the reply box.
then single left-click & drag the file into the bottom section of said reply box.
after a couple of secs, a little thumbnail image of your pic should appear in that bottom section.
then post your message to us all…
wait.. which window should i open now?? my kitchen or bathroom?
any you can jump out of 😀
lol … touché
… ps. if you are still having difficulty Chris, I’d be happy 2 make a video for u…just give me time after work to .. suit up. 😉
That’s very kind of you Maria!! LOl But I think I may have jsut managed it!! At least I can see it here now!! Hopefully everyone else can also!!? I think I need a drink now!! 😉
…it’s 5’oclock somewhere………..
Well it’s almost 4 pm here..and out in 3 hours for dinner with friends, so definitely a few drinks then!! 😉
No idea if this will work as when I said ‘idiot’ maybe I didn’t stress enoough ‘IDIOT’!! And no idea if it does post what size it will be but here goes!!
Yesss.. success.
the pic is the original size you post, but we get a shrunken preview below the comment.
double clicking opens it to full size
Yay!! Thanks for your patience and instructions. And just goes to prove you really can ‘teach an old dog new tricks’!! Lol
no probs..
dunno how strict the ‘rules’ are for C&H formation, but i read that the handle should not retrace more than 50% of the cup.
..and they work best in a strong uptrend.
maybe Alex can verify.
I think you may well be right about no more than 50% pullback so may not be valid. But at this point it definitely has the promise of some kind of nice bottoming formation and a clear and sustained move above say 15.60 would potentially target around 16.70 in the near term. I believe Alex has a potential cycle high forecast for sometime in Sep and based on other research I do I am anticipating an interim peak around mid Sep. I would be VERY happy with a first new bull cycle leg to 16.70 or so over the next few weeks!! 🙂
Yes
Nice job Chris 🙂
Thanks Alex. Not up to your standards but ‘baby steps’!! Lol Couldn’t have got even that posted without SOG’s help.
Interesting with GLD recovering off morning low (as weak BTD in equities failed gloriously).
Even happier now that I closed my x2 leveraged short on the Dow last night….NOT!!! 🙁 That is one painful lesson!!
Chris, dude, I closed SCO at 75 last month for NO REASON and then got scared out of JNUG at 7.79 two Fridays ago before the blast off. Now, that’s BAD! So, feel better. 🙂
Hi again Cason. I appreciate you sharing that and understand just how painful that must feel!! Boy, REALLY painful!! It doesn’t feel right to say it makes me feel better sensing your pain as well though but it does make me appreciate we’re not alone and just how tough it is to overcome the psychological hurdles of trading. Hopefully the next experiences we share will be NUCH more postive!! By the way, in case its of interest based on my look at the charts, gold and silver have both hit important intial resistance levels, gold around 1170 and silver around 15.50/15.55. Gold in particular also looks like it may have completed or be very close to completing a minor EW 5 up which would complete the first minor upleg. This would tie in neatly with Alex’s talk of a 1st daily cycle top anytime now. It looks to me we could take a little breather in the very short term…maybe a week or so before the next and potentially more powerful next leg starts. If that pans out, once we get above and close above 1170 on gold I have an important looking layer of possible resistance around 1220 but really fancy a major falling trend line around 1250 as a more hopeful target by mid September. I’ll post some charts as I get a chance for everyoen to see but jsut wanted to let you know what I am currently seeing in case it’s of any interest.
Yeah, I see some resistance. 1178 or about there stopped decline more than once. So now resistance. 1 other possibility short term, wouldn’t suprise if Gold drops a bit to hit upsloping 10 day then tries 1170-8 area. GL. I know Alex will have some solid updates for us this week.
I’m sure he will Cason. One thing I’m pretty certain about is that the real “fun” has only just begun and what we’re seeing in world stock markets is just the first small ‘shot across the bows’. I think we have jsut passed a ‘tipping point’ and the coming year is going to be a LOT, LOT different to the last few, especially for general equity investors. Precious metals may provide one of the very few safe havens. But I strongly believe we are in for one hell of a roller coaster ride from here on in and the last week has just given us a tiny taste of what’s coming. I have been waiting literally years for this to finally start unfolding and now I’m pretty convinced it’s finally here!! But time will tell and hopefully with the help of people like Alex we’ll all survve the ride!
Alex, Would we ‘expect’ a break of the 10dma as well or just a break of the TL to consider a declining DC in GDX?. Thanks in advance!
I usually look for both to confirm a daily cycle is in decline , seeking out the dcl.
Thanks!
I’ll add back at the 10 day unless we have evidence to the contrary before that.
GDX gap fill going on? Or decline into DCL
half cycle low? We were above 50 and out of upper BB on GDX, GDXJ, and gold. Retrace back to support before topping out and then into low? Could be a possibility. GDX particularly isn’t that late into count.
An interesting chart to look at in times like this . It MAY NOT be the same, but it shows what can happen after a big sell off day when the move was heading higher in GDXJ
.
Position update, exited all GDX Aug yesterday. Exited GLD calls (Sep) and NUGT this morning (missed proper exit, wasn’t paying enough attention). All big winners. Fun to watch miners reset WITHOUT me for once. Still have FSM, AUY, GDX Sep monthly $16 strike calls. Adding at 10 day next week unless conditions change.
Was stalking energy and BTD S&P this morning. Glad that I did not take trade. A week or so ago I was in TQQQ thinking we had upside (don’t worry sold that long ago).
That being said, going short volatility here looks TASTY! For those familiar with VIX products, when it comes off it comes off FAST. Unless the world really really does end this weekend, US markets well oversold. One could take a starter and then check Monday for next move.
Been wanting to post this chart for days. It’s oil (WTI) and as much as I would like to see a low you can hopefully make out that every attempt at a rally since mid Jul has been turned back by the steadly falling 200 ema on this 1 hour chart. Once it has done so as in mid and then late July and now once again 19 Aug, it then spends days where every attempt to rally fails at the 80 period ema. It is proving true to this form once again, so based purely on this 1 hour chart it remains steadfastly bearish at this time although it is once again approaching it’s lower trend line and therefore may soon see another minor bounce very short term. But until it can get past that 200 ema oil will continue to look desperately weak.
Yea I agree Chris.
I am Trying to be patient !! Really hard as proven with my XLE trade. 🙂
ok guys… dont remember who asked me.. but this is what im ‘watching’ in GDX/nugt
we shall see… this would be just the first leg … so 1 or A … let me know if im going coo coo… i did this at 3am this morn..
too much coffee at late nite mtgs…ugggh…
https://www.tradingview.com/x/gEV6Dvdj/
ps. i drew up two scenerios for the 4th wave – which i ‘believe’ we are in now…who knows how that will play out; it could be a quick abc or drag out in a lonnnnnnnnnnng triangle forever…
you need to get out more on your motorbike..
https://www.facebook.com/elliott.queen.5
that is HILARIOUS!! omg…..2 funnny… i actually grew up on dirtbikes, minibikes, and horses…. my name should probably be CuverdINmud …..which actually reminds me of a story ….
Maria, is 3 your DC1 top and 4 the low with 5 the next leg or is 5 the DCL and the next journey yet unwritten. Pretty darn good for 3 AM!
all i heard was blah blah pretty leg blah …..
ha! sorry… my brain refuses to process cycle talk… i need more time to sit down and study that theory… i did read in one of my EW books though .. that it is very close to EW analysis since the ‘structure’ typically follows a certain amount of candles… is it 160??? or something? i could be making that number COMPLETELY up… but i do recall a ‘mention’ of cycles in one of the chapters.
Note to self: go back and read that chapter … (eyes rolling….awww do i realllly have 2 daddy) ??? ha ha ha
They do go hand and hand, but it seems that they all do ( E.W, CYCLES, T/A) . very powerful stuff when used with “EXPERIENCE” – The best teacher in the School of hard knocks !
ahh… yess grasshopper.. nothing like banging your head against the wall a few times to let it all sink in … ;o)
luckily i have a super duper hard head… HA! !!
https://uploads.disquscdn.com/images/ed058bffd674aa1014276d0808cc956c726d8a7860769897414381a8c3c2e7d6.gif
Or a helmet from your Mini-Bike days
Cason, excuse her rudeness below , she was been up at 3 a.m. – She seems to be pointing out ‘5’ as her 1st daily cycle top, then a drop and THEN on to new highs again in the 2nd daily cycle.
sorry… i didnt mean it to be rude Cason…;)
Clearly Catwoman could use a cat nap!
I’ll just take the first question, it was “let me know if im going coo coo”
Answer: Id have to say that all signs point to “Yes”.
Then add , ” i did this at 3am this morn..” and I’d have to say , “Confirmed” 🙂
LOL !!!
Looks good to me Maria. 🙂
dont encourage him ken….
Its missing the a-b-c on the 3-4 pullback and the 1-2-3-4-5 on the 4-5 final top. I’m going to have to totally reject it .
( Shhh, Actually, it looks very possible . Dont tell her)
btw.. nice waves missy
Was stalking energy and BTD S&P this morning. Glad that I did not take trade. A week or so ago I was in TQQQ thinking we had upside (don’t worry sold that long ago).
That being said, going short volatility here looks TASTY! For those familiar with VIX products, when it comes off it comes off FAST. Unless the world really really does end this weekend, US markets well oversold. One could take a starter and then check Monday for next move.
Are you guys watching GDXJ??? USse a 9 sma on a daily chart and lets hear a WOOHOO! for strength.
.
Re-gained the 50sma so far too.
Yea….my order was in didn’t fill. Grrrr
question above for you
Yeah, I was trying to figure out if 1) the pullback just wasn’t going to be that strong this time (due to strength in complex) or if 2) the market being down so much is putting a bid under gold, which is helping some. Which would figure in how early next week could add. That’s the question of the day if you ask me.
QUESTION FOR KEN OR GUDS SON-
Using E.W. – I’m looking at GDX vs GDXJ on hrly or daily charts. They look very different . How do you reconcile the 1-2-3-4-5 move since GDXJ bottomed in July , GDX made new lows & bottomed in AUG? Gold also in July. What are you expecting?
It would seem that GDX has only done 1-2-3 & maybe 4 now out of AUG lows? GDXJ looks like 1-2-3-4-5 complete out of July lows, unless you draw the count out to one more wave up is 5 in GDX and 5 is still unfolding in GDXJ, and now 5 for GDXJ maybe double top while GDX makes 5?
There is no right or wrong answer : ) I’m just wondering if anyone can picture how the 2 (GDX & GDXJ) will eventually match up?
Going to lunch …cya all later
Hmmm, All I get is this
http://www.bing.com/videos/search?q=sound+of+crickets&FORM=VIRE1#view=detail&mid=90581C7CA1B282C9719A90581C7CA1B282C9719A
LOL !!
LOL squared
… i didnt answer becuz u specifically asked K&S
i figured u were giving other members of the class a chance to speak.. ORRRR .. well ..
Anyone is more than welcome to answer , I just went to Ken & Guds son because Ur at work & I thought you’d say “I’ll draw it up at 3 a.m. , my cat-woman / Batgirl suit is at home”.
Needed to have a good stare at GDX.. ive been ignoring it.
(GDXJ is where my cash has been.)
and …. still havent the foggiest idea what the wave counts are for the out-of-sync situation :-/
Just the opposite for me. Lol. I have been ignoring GDXJ (till this morning) and focusing my count on GDX.
the tweedledee & tweedledum of elliott wavery.
LOL !!!
Oh no I saw your hand up first Maria ! Do show!
Agree….time to go work out for a bit.
They are conflicting due to GDXJ bottoming earlier than GDX but ……
Here is my interpretation……. subject to change 😉
Hence my order on GDXJ ( that didn’t fill ) at the 62% Fib And the 9 dma.
Filled. 🙂
Starting to build my 3rd. Tranche.
Thanks & “Subject to change” is very acceptable. I like it , though, it gives GDX room to complete too.
It even matches cycles with “4” being the next daily cycle low, and 5 being the expected ‘ higher high’ in the 2nd daily cycle, because the first was right translated.
After that ?? I’d love to think that was 1-2-3-4-5 of 1 🙂
That’s the next big question, right? Where does Daily Cylce 3 go and is the next ICL months from now a higher low (or do cycle 3 and 4 washout this fall). Only time will tell on that one!
Yeah, my heads already down that road, I wish I could just enjoy the ride now 🙂
i would have labelled a 3 as 12345 rather than abcde (always keeping letters for 2 & 4 corrections AFAIK)..
If it is an overlapping jobby, then i think one of the main rules, is that 3(c as you have labelled it) cannot be the shortest wave…which fits your count fine
.. just noticed your numbers hiding down in the MACD..
come on out little numbers,,, don’t be shy! LoL
LOL !!!
Those are waiting patiently for wave 5 !! 🙂
Does anyone else wish that they put their entire account into ACI 2 & a 1/2 weeks ago ? 🙂 Or even BTU.
oh yeah. rode ACI for a few scalps. but not enough 🙂
Whats with COAL?
I think the beating was enough, sellers got exhausted, and shorts are running for cover?
We may see the same in OIL stocks in the future. (Nadl & GDP are quite over sold).
Took a look at GG (up $0.22) and NEM and ABX… 3 larger components of GDX .
All looking pretty good today
regarding my question on the differing GDX & GDXJ lows for E.W.
If I had to be pressed to sticking to only 1 count…I think it would be
GDX, because it matches XAU & HUI too. HOWEVER GOLD matches
GDXJ.
Hows that for a conundrum?
Thats why I am thinking that
they will somehow sync up later, with a short GDX daily cycle, ending
when GDXJ finishes a longer one with Gold.
Thats my cycle view and THAT is why I asked what the E.W. group were thinking about the split difference.
MYYY answer is one word: Truncation
.. there’s an excuse, i mean Remedy .. for everything … extension, truncation, triangles, 1212, etc….
girly swot
bet you brought an apple for sir
https://uploads.disquscdn.com/images/753332a32e0061f46a861442c520bff69c7609aa611e27dbd8d09a3d15f28517.png
HA HA HA
,,but they, the EWs, certainly have a get out clause for everything
but all kidding aside… it really does amaze me how the psychology of the ‘masses’ does seem to right any seeming wrong in the counts… For instance, in the case of truncation -which occurs when a move/wave has gone too far too fast via extensions- say if 1 extends then 5 will most likely truncate as …. (all together class) 3 cannot be the shortest wave…. ;o)
ok ill stop there b4 i bore u 2 death.
DBC long from now.
checkout RRC SEPT calls open interest
interesting when you put commodity in perspective. (I went long DBC).
wouldn’t you short this chart? out of BB weekly.
Oversold much? S&P is now 4 handles outside of lower B.B. Whoah. Just messing around, just out the VIX:SPY explosion on this chart. That is not sustainable.
Agree. I may harvest some profits on my VIX Calls before the close
Man I don’t know……I may hold, the SM’s are closing at the lows of the day, sooo weak, we may Crash or the PPT may jump in next week.
Bought SDS (double inverse SPX) in lots at SPX 2125 , 2111 , 2103. Selling those last two lots before the close today. Planning on holding that first lot and adding to it at hopefully at higher prices – and then to sell all at what may be an intermediate low in mid-September
REALLY wanted to double positions in GDX & GDXJ today, but the “look” of the charts just isn’t right for today – will review again on Monday. I’m the newbie here, and I’m truly enjoying what y’all have to say and especially the camaraderie & positive attitudes! I’m sure that’s due to our fearless leader ALEX leading the charge!
Hey Cal,
You “could” start to build a position here…….. if your tea leafs are fresh. 😉
Thanks, Ken! – I already had what normally is my “full” position in miners and wanted to double that position since I think we’re near historic lows & in an intermediate rise. I completely flip-flopped on my decision just before the close and went ahead and doubled. After all, resistance is resistance until broken – which did not happen today – trend line & 10 day ma held. If I’m wrong, my average price is still nice, giving me some wiggle room. Saw your advanced level EW chart below – that’s good stuff!
That’s what I like…Commitment ! 🙂
Market dropping, pulling miners down with it! Gold really isn’t down, miners taking a beating.
Not too bad considering what’s going on in the general market. I think this is really good as the gold miners might be the only stop on the train. Might take a bit to digest but I think the big picture will get very favorable for the miners. Look at the coal stocks this week. I think we’ll see some of the smaller gold stocks make similar moved very soon.
Markets really took a beating today, WOW! That was rough, really oversold now. Made a few late moves to get ready for next week. Sold day trade in DUST, grabbed SPY call (1, literally just 1), long XIV (short VIX). New highs? Not hardly, but looking for oversold conditions to work off then I’m out!
Anybody know the last time VIX closed this high? I’ll give you a hint, think last fall….
Anyone here have a thing for fractals?
Top image is 4yrs of $GOLD with an EW interpretation..
Middle image is tiny 1 day only (ie. 2mins period) chart, of a GDXJ breakout from a correction, which went on to exceed the biggest retrace bounce after the peak (forgive the excess gubbins on the chart!)
Bottom image is a superimposed version.
Pretty close,… but make up your own mind!
Lets see if we break the 4yr bear correction channel, currently lying just above at approx $1185.
Oh mann.. cant wait to hava look at that on computer…
The GDXJ chart was the from Oct 9th 2014.
i sent that chart to a gold permabull (only $399 per yr subs!) on the 10th Oct, suggesting we might expect a drop in $GOLD, with a similar 5th wave down over the following months .
Needless to say, he ignored me ◔◔
A little Saturday charting? So, who’s coming to dinner? Oh, it’s the 10-day SMA!
Mmmhhhhh.. macd has the look of a hungry alligator… 🙂
and the bottom indicator is the Stoch Ness monster
HA!!!! awesome… baddum bum.. ching… ;o)
Looks like a crazy open tomorrow morning! And we have a CNBC market meltdown special on. Could be like October 12th – washout AM and big reversal. I don’t think we have a big bull V-shape. Overall, we’re in trouble here. But just like gold doesn’t go straight up, this won’t go straight down (at least I sure hope not!).
Well sitting here in the Europe area on Monday morning I can tell you China is currently down almost another 8% and European markets have all opened 2%-4% lower. However, there are the first hints of some element of trying to stabilise..at least in the first hour of trade! I think you might be on the right track Cason. Maybe some spikes lower today/tomorrow and then an attempt to stabilise this week and if so then a bit of a bounce next week but no V shaped moon shot this time like last October. If/when we get a bit of a bounce my money’s on we then head a lot lower again after that and we won’t see a more sustainable low before late Sep/early Oct. But only my personal views.