Did you read my Tuesday report and the Wednesday report? Not much has changed in the way of expectations really. We could say that we are just seeing a slight variation of the same theme.
Wednesday morning I pointed out the resistance above at the close on Tuesday for the NASDAQ, SPX, IWM, etc. Even though the Futures were Green, I thought that we would drop later in the day.
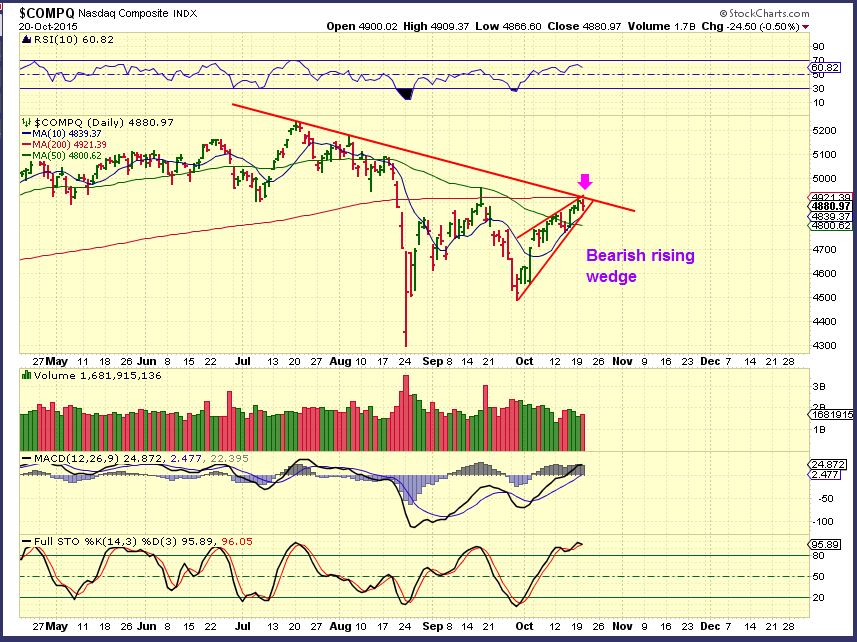
NASDAQ Tuesday OCT 20
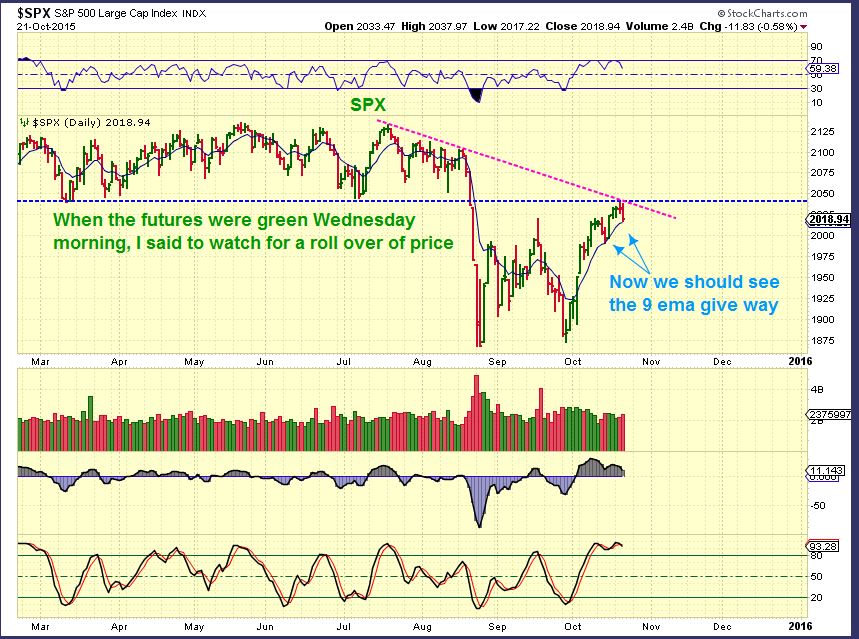
SPX OCT 21 – There was no follow through to the green futures, the SPX began selling off to the 9 EMA. Thursday will tell us if it will hold or continue selling down. Again, I think we will see more selling for now.
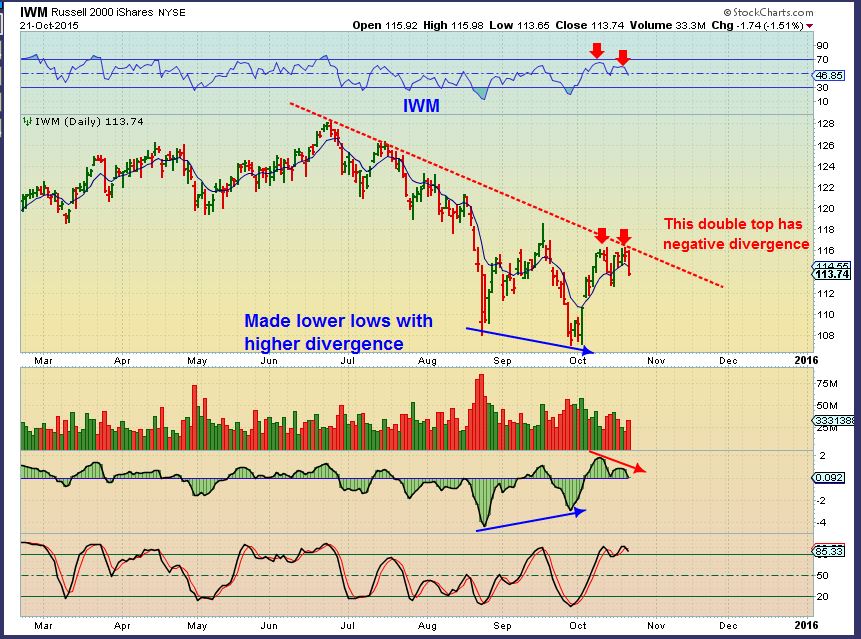
IWM – Notice the negative divergence.
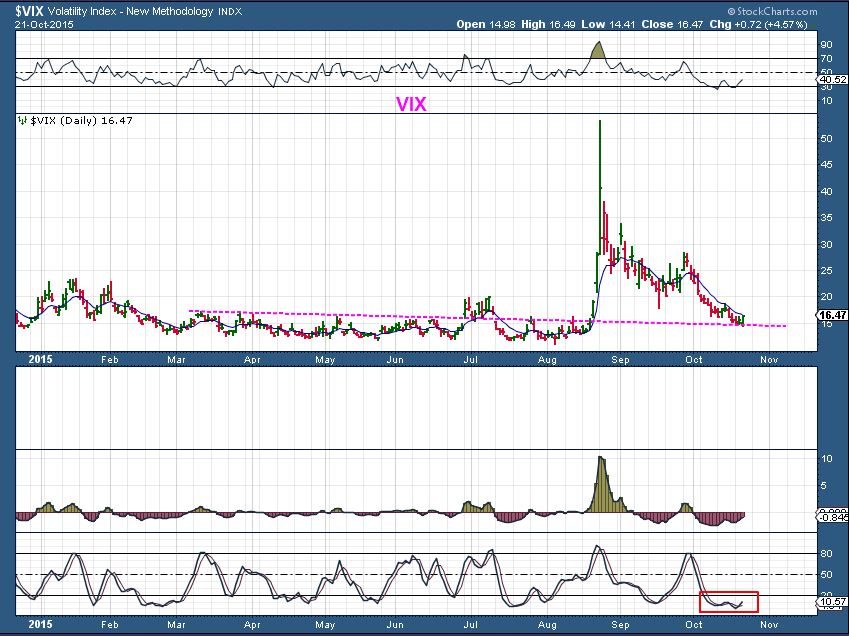
The VIX looks like it may have reached support in an oversold area.
TZA ( See also SQQQ, SDS, DXD, SOXS, etc)- these are vehicles to short the market and they look quite bullish.
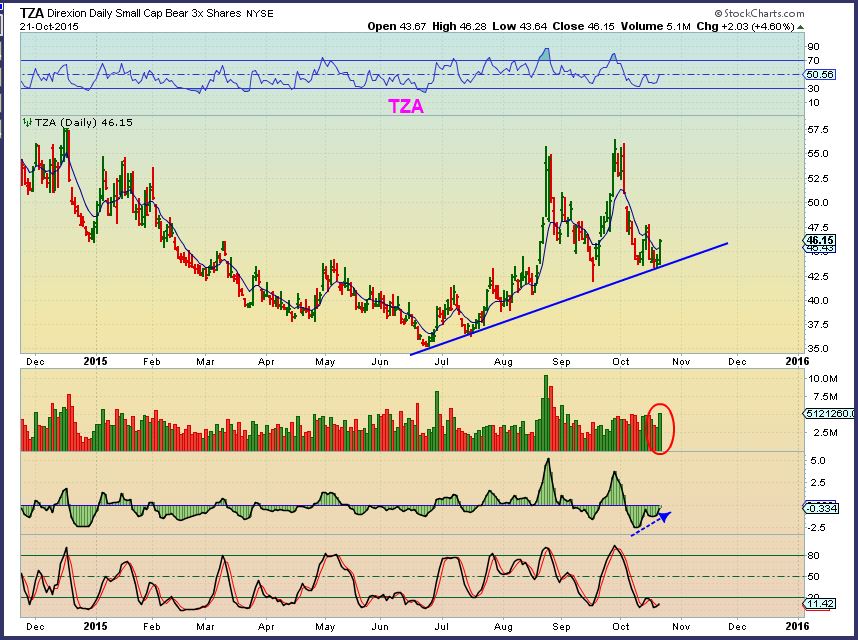
Based on what I pointed out in my last 2 reports, and then add todays reversal after opening up green and the Vix pop, I think the markets are going to start/ continue heading lower. At this point we cant tell if this will sell off deeply or just drop and re-charge for another attempt at the break higher.
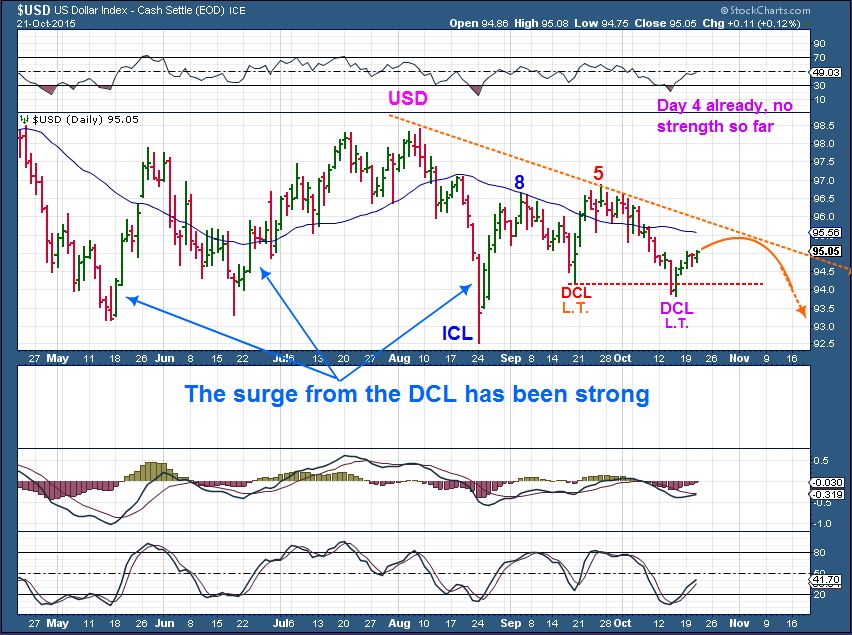
USD – The Dollar had some upside follow through today, but I do not expect this to amount to much. Notice that the 1st daily cycle peaked on day 8, then next on day 5. These are weaker left translated daily cycles and this next one should be weak too. As the dollar rises, Gold / Miners should drop to a dcl (Daily Cycle Low) .
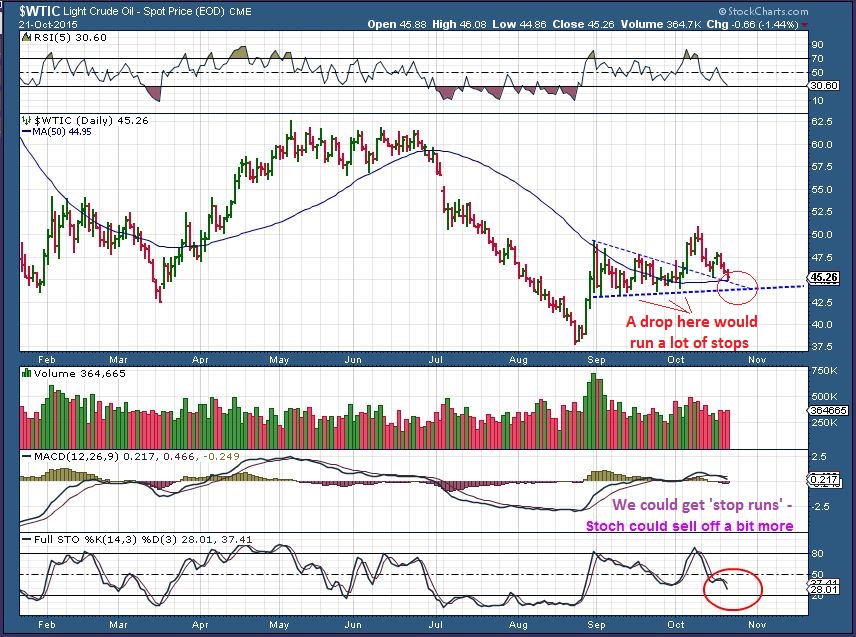
WTIC – not much change here. Oil daily cycles can last up to 50 days! We are close to making a low. If OIL drops below the blue line, it is probably a stop run ( I’d expect it to reverse higher).
.
I wanted to look at GOLD this way . With the dollar rising, it is likely dropping to find a daily cycle low too. As I have mentioned for weeks, this will be the real test. Will the next daily cycle make a higher high and a higher low too? If the Dollar looks weak ( it does) , there is a pretty good chance.
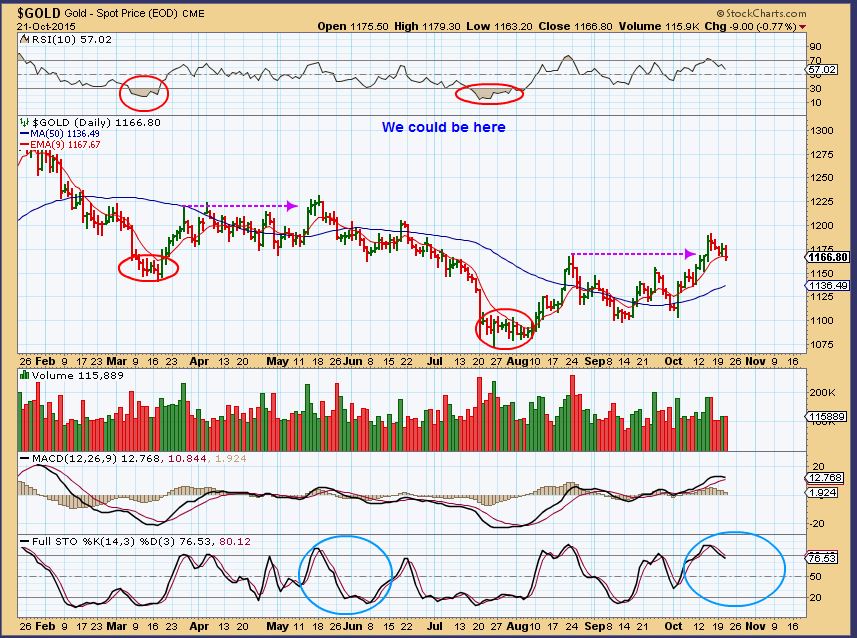
If Gold is dropping, I would expect GDX to drop too, but I wanted to point out something interesting that I found in my personal research.
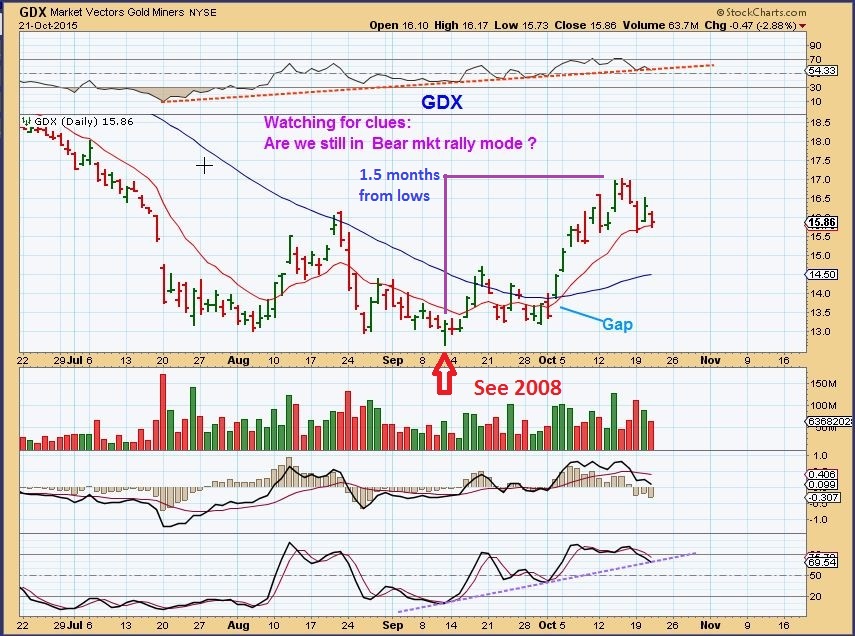
This is a chart of GDX CURRENTLY – I am pointing out…
1. THE lowest point on Sept 11 and then a run higher for 1.5 months to a peak.
2. Then we dropped to a supporting moving average , but most expect a break down next.
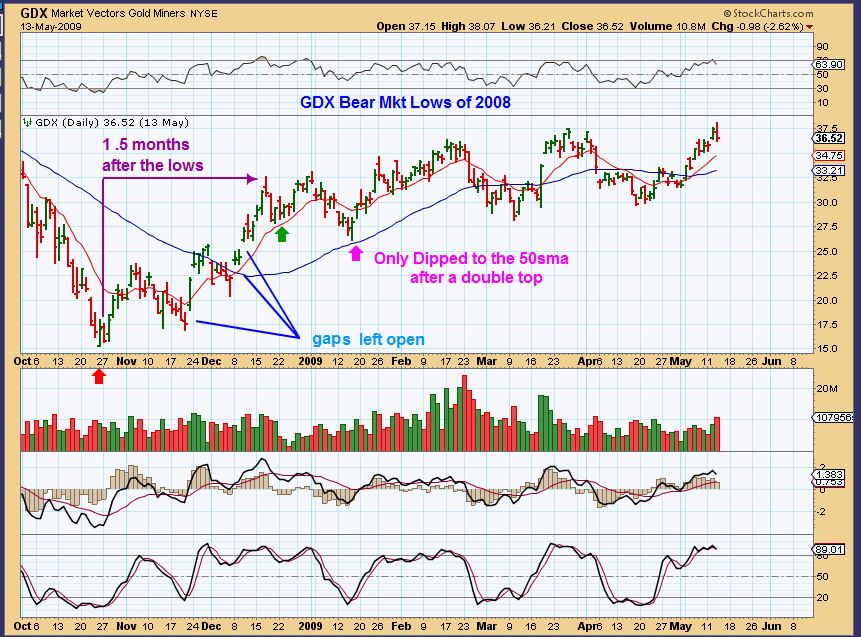
I looked at 2008 lows ( Because GDX was emerging from a bear market beating) and GDX actually did the same thing that GDX is doing now .
1. A run higher for 1.5 months out of OCT lows
2. Dropped to the supporting moving averages ( Green arrow) .
Then it did NOT break down here. It did a final jump higher from the moving average, and then only dropped to the 50sma for its dcl.
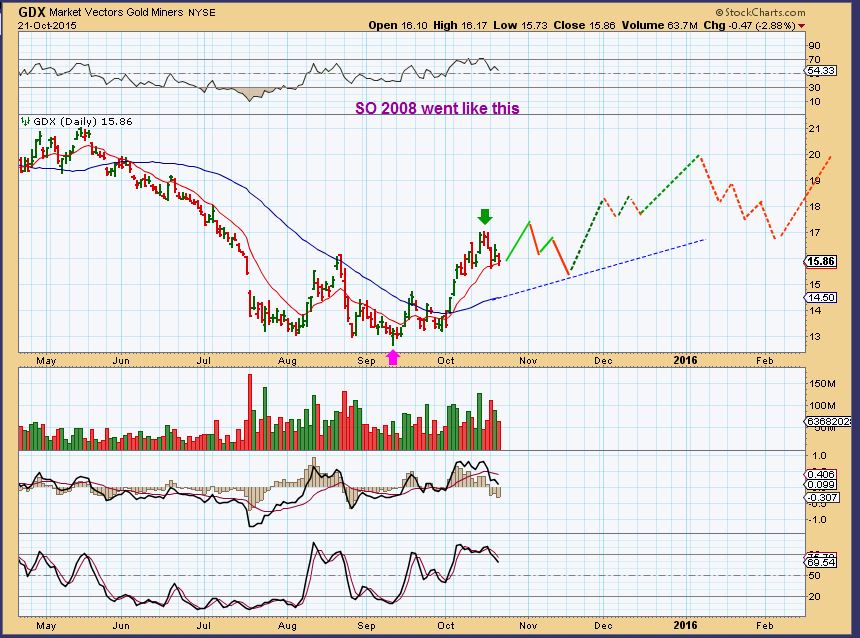
If we did something similar now, it could look like this. That still gives us the 1-2-3-4-5 wave that we were discussing, but if GDX breaks todays lows, we will probably just keep dropping into a dcl as the dollar finds its high.
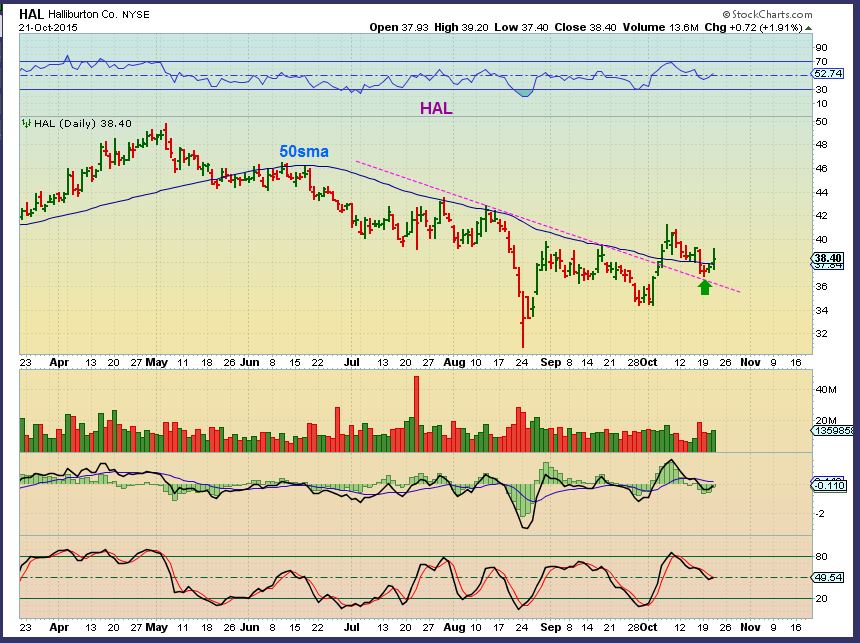
SO there are no new trade ideas in todays report. I’m watching to see if the markets roll over and then SQQQ, TZA, SDS, etc may be a buy. A stop would go below Wednesdays lows on SQQQ, TZA, SOXS, etc. I also listed a few energy charts in yesterdays report and Fridays, to point out some possible set ups to keep an eye on as OIL drops into its Daily Cycle low. I like CJES, CRK, and several others. Take a look at HAL, that looks bullish as OIL continues to drop. Keeping a watch-list in expectation of Oils lows is a good idea.
~ALEX
Public Post – Equity Markets at Resistance 
 Was That Smoke & Mirrors?
Scroll to top

Alex, with USD on day 5 we should see 3 more down days for GDX. My expectations anyway. Still holding DUST and DWTI looking to close out soon.
The dollar spiked quite a bit on more QE talk from the ECB. This could get interesting.
Do we have a possible price target on the dollar index?
Based on Alex’s chart above, maybe a few more days of upside, maybe sideways. I’m guessing just over $96
yes…but that’s right we’re we are now….
Yeah, $$ is up a dollar!! Surprising gold/silver didn’t crash here. Energy holding up, nothing exciting but it’s not down for once.
USD having a very strong run today ( up 1.22 as I write) at 96.22.
I honestly saw that slow start and did not think that it would break above the 200sma, but it is.
I’ll have to see how things play out into the close. If it sells off below the 200sma by the close, it could be a spinning top or hanging man topping candle and false break out, but we’ll just have to wait and see.
It is suspect with Commodities in the green
JOY, FCX, GDX, GDXJ, BOOM, NOR, AA, SHLO, AKS
SA! : )
USD up strong, Oil is now red, I’m thinking Gold will follow! If the miners don’t go red, then this may be the end of the USD cycle. 5 days only.
Its pretty unreal that the dollar is up 1.33 now and Gold is break even, GDX up $0.40.
As mentioned in my last post, many commodities are looking pretty good- its hard to reconcile.
We look for GDX to lead the way when we get a change. Maybe happening? Probably do to Europe.
industrials too…
at first i just thought they were moving in sympathy with ERII .. but mannnny are green and looking pretty darn good
Can you name a few please, thx
URI, HEES, SWK, MTW, ETC
glpw
Thx
sorry cant chart them now.. but just flew through a bunch in my template chart …..
I’ll look them up –
Look at THAT crazy chart. Wow
Maria, you following the POT stock?
as in weed, ganja? or POT.. ;o)
no.. why .. ags starting to move? havnt looked there in a while..
ps. nice trade in dwti btw..
oh boy.. serious pop&floppers mtw & MNTX .
.i see URI had earnings as well…
I am watching the same thing with JOY, FCX, AKS, AA, LGCY, etc
I didnt take positions so thats ok, but frustrating for any who jumped in on the rally mode this morning.
Dollar shooting higher, yet Commodities (GDX, GOLD, OIL) not buying it? Confusing.
ECB comments sent Euro reeling but likely into support.
Oil dropping like a rock, look for GOLD to follow suite!
Nat Gas rpt lightly bullish: +81bcf actual vs. +88bcf consensus.
If I may interject with a non financial:
I don’t know if CF meant this (suspect not) but today Ladies and Gents, in 1966, Good Vibrations was released.
http://www.thatericalper.com/2012/07/23/good-vibrations-the-lost-studio-footage/
http://www.thatericalper.com/2012/07/23/good-vibrations-the-lost-studio-footage/
LOL- Yes, that is exactly what I was eluding to.
P.S. – NBG & GREK
Indeed. Next stop 200DMA. Then on verra but does seem to me there is extraordinary long term value there
I did mention in prior reports that GOLD & SILVER actually looked like they put in a DCL on OCT 2.
With the dollar screaming up 1.33 and Gold at break even, SIlver up $.0.20, GDX up $0.40….it is possible that this is a 1/2 cycle low in Precious Metals in that scenario.
ALSO- I had that chart of the GDX compared to 2008 and the next move would be a slightly higher high and then a drop to the 50sma, if the Bear mkt was over.
Remember Oct 2nd, you said it was odd you didn’t get a sell signal on GDX. What’s your indicators saying about GDX now?
Not even close to a sell, but in sideways tops it takes a while to curl down.
I should add that that indicator is better at ‘buys’ at the lows. The sells at tops is lagging a bit.. The very last sell that it gave was on MAY 20 and the next buy was AUG 10.
Well then, is it getting close to a BUY?
It never went to a sell, so that means it was a buy & hold from August 10, even with the Sept 11 dip
GDX volume is a bit weak today though.
It’s higher than it was yesterday at this time. 20m so far. Not bad.
I was looking at the chart , but I forgot, they add about 20 million at the end of the day lately.
GOLD doesn’t even look close to a new cycle. The indicators are all crossing and headed lower. Not close to oversold and only on the 6th day of decline. Like you said the volume on GDX is very low. I’d be willing to bet we see a change of direction in OIL before GDX. OIL is on day 9 of its decline. Although, the last daily cycle in OIL only had 9 down days. IMHO. 😉
I didn’t like the gold chart last night. I’m with Bill now, I think we drop here.
Well, if I were going to short the general market, and I’m not, I would do it right about here.
I was thinking the same and I am not trying it either 🙂
The SPX is at the 200sma, but the SPY & QQQ look strong – really good volume for 1/2 a day .
$COMPQ looks strong at the 200sma
IWM looks weak – $TRAN could be ready to break higher. $VIX is neutra-lish
Idk. I’m fighting the trend playing PM/miners, we’re fighting the trend in oil. I’m not fighting the trend in markets also. Too many falling knives at this point. Today was the scene of the crime- SPY breakdown.
Check AH, MS, Amazon, Google/Alphabet – all blew out earnings!!
Weekly chart of SPX going back 5 years – kissing underside of long-term resistance:
http://tos.mx/WmD2xe
(clink on link and then click on chart)
…and yes, I am short stocks
1 hour view showing divergences:
http://tos.mx/QqmpRT
This will be in the report that I write tonight…it is the event that I’ve been pointing to for a long time now. The moment of truth.
,
Sold my DWTI position here. 10% profit, I’ll take it.
You promised you’d hold it until Oil went for the $42- $43 area : (
J/K’ding – Nice trade. Every 10 % helps
I was going to mention this – and it just burst higher
.
That burst higher looks so big short term ( seen here)
.
But its just a ripple in the pool ( refresh – it was the last red arrow)
.
hot
Really, thats pretty bold of you : )
I cracked myself up with that one
i was speaking of your chart … chartfreak .. not u (gross)
CRK just finished ‘5’ .. should be done correcting.
unless of course it .. extends…forrrEVVVVerrrrr
On a 5 minute chart….I bought the inverse H&S under $2.70 and am deciding whether to hold or just take it as a scalp to $2.80 if it makes it
nice… im holding.. 😉
well .. ishould always add .. *maybe ;o)
So Maria, What is your opinion of Bill?
well .. everyone knows i love his harmonicas …. 😉
XME EWZ see lots if inverse head and shoulders patterns
End of day – I am holding it as a daily bullflag at this point.
I’ve been following a similar chart pattern from last January. When I saw USOIL went down 8 days and then turned up I got out. I noticed we were on day 8 already. It was a good trade. I’ll take it.
Now I’m wondering when OIL does turn higher, is UWTI or an Energy stock the best bang for the buck?
Have you ever seen GASL –
Never used it
any of you cool cats watchin Rexx?
looks to be finished as well … ?
https://www.tradingview.com/x/LiJ97FPv/
hey M.. doya not think that could still be yet to wave out a 4? (ie. in the C of an ABC correction)
Hmmm.. ould be yes. Is that what u have for xle then? And oil.. and gold.. lol… they all have that either or look…
yeah.. a lot of them have that three wave appearance dont they? .. some flat,,, some zz downwards.
im watching the MACDs for triggers at moment
Sure, soon as I get tired and sell out. It has a good day. 😛
Ps. And id be super happy with just a C.. woohoo..scalp. 😉
I have Dec 2.5 calls on this sucker. I was in the money for 1-2 days and then bam…
On my watchlist, no position.
Wgere on earth is chris? Oh Chrisssss…??? Where are u? Its thirsty Thursday. .