
The Coin Toss
Many sectors of the market look ready to break one way or the other. Can we gain an edge as to which way they will go, or is it just a coin toss? Lets take a closer look.
.
This was the NASDAQ at the close on Monday. It was pushing against resistance in various forms.
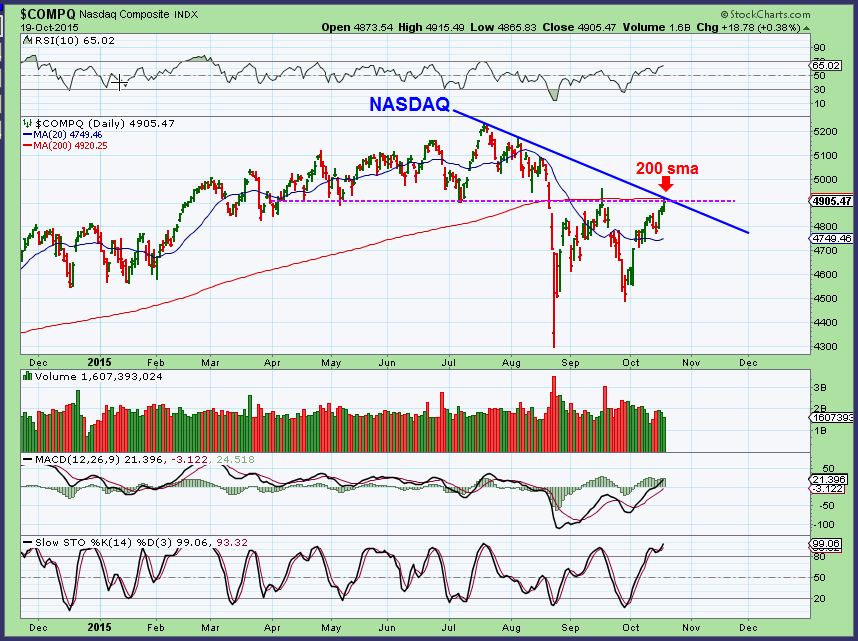
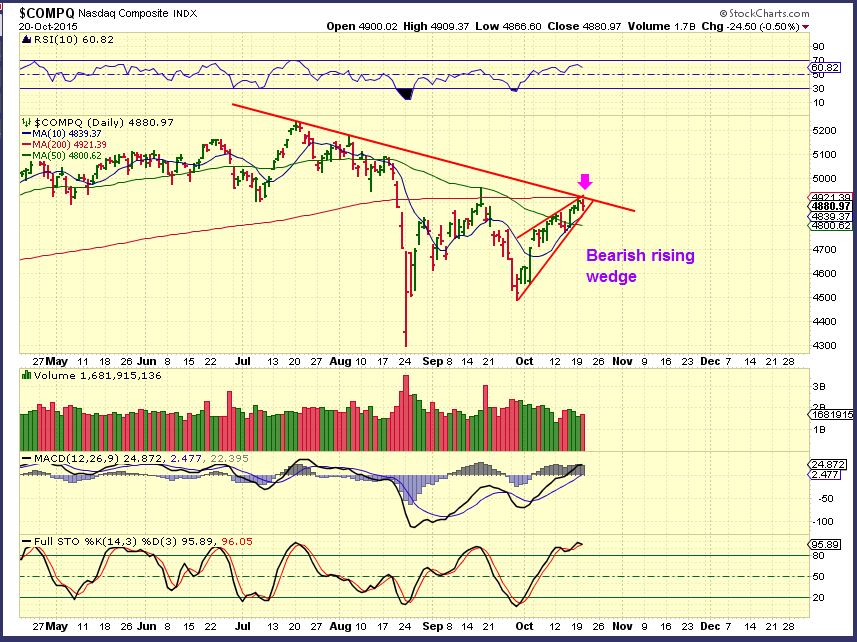
Notice what seems to have showed up by the close today…
A bearish rising wedge. The NASDAQ looks like it is going to drop lower now. Futures are currently higher, so I am going against what I see.
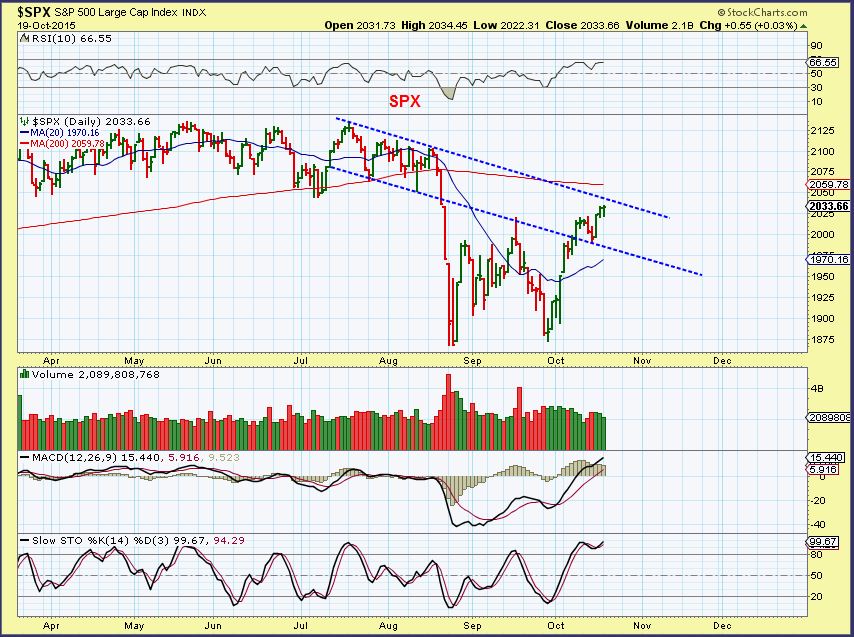
The SPX was approaching resistance too, shown here.
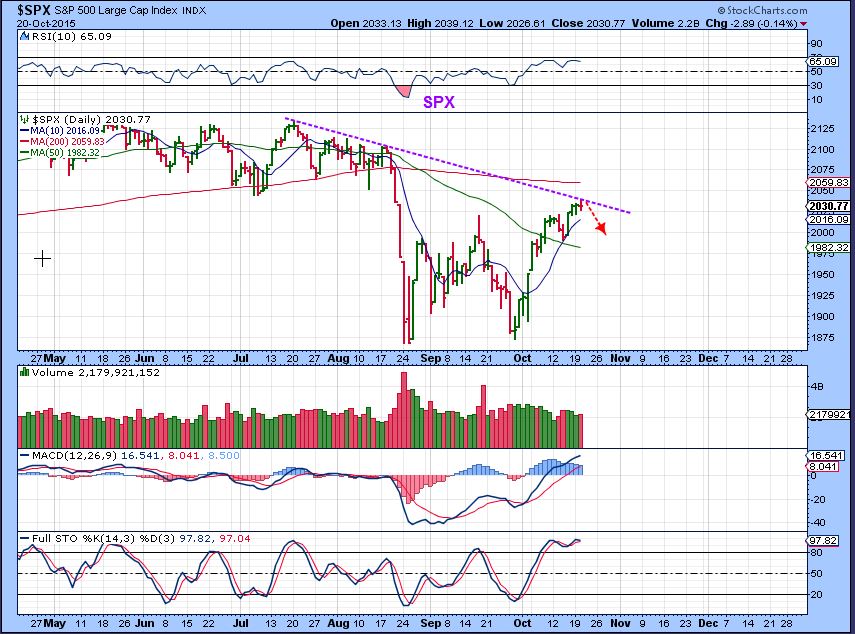
After a brief rally, the SPX hit resistance and gave up Tuesdays gains. The markets may be setting up to pull back here. Futures are higher as I write, so we’ll see if they give it up as the day goes on. Let me explain why I think that may happen.
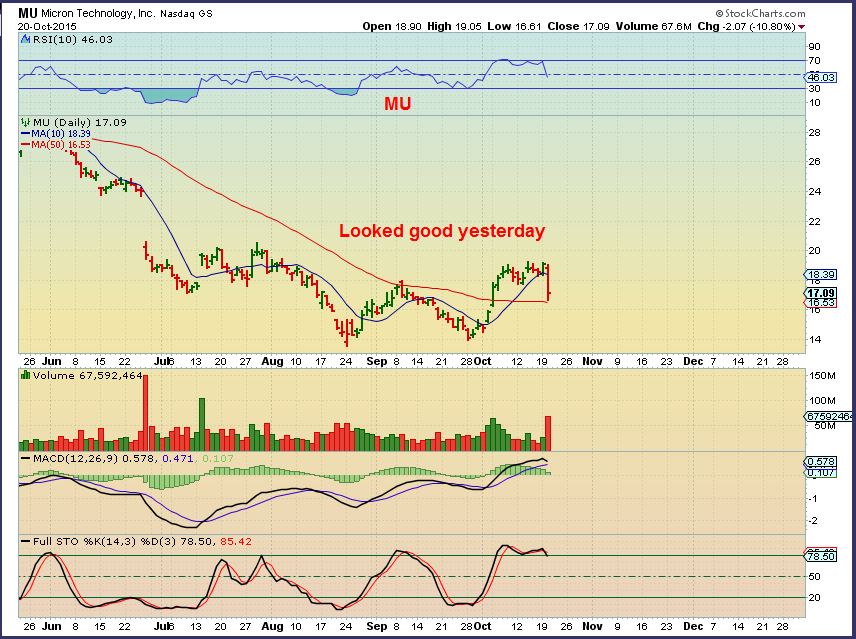
I had mentioned that I was finding a lot of charts that looked like a recovery, so that appeared bullish. I still think that the SOX and semiconductors look pretty good, and there are other stocks that have nice set ups too. I then mentioned that this would be a big week, because it was LOADED with earnings reports. Are the charts still holding up?
Look at that MACD as CMG approached the highs again. CMG was down another $64 after the markets closed ($50 when I drew this).
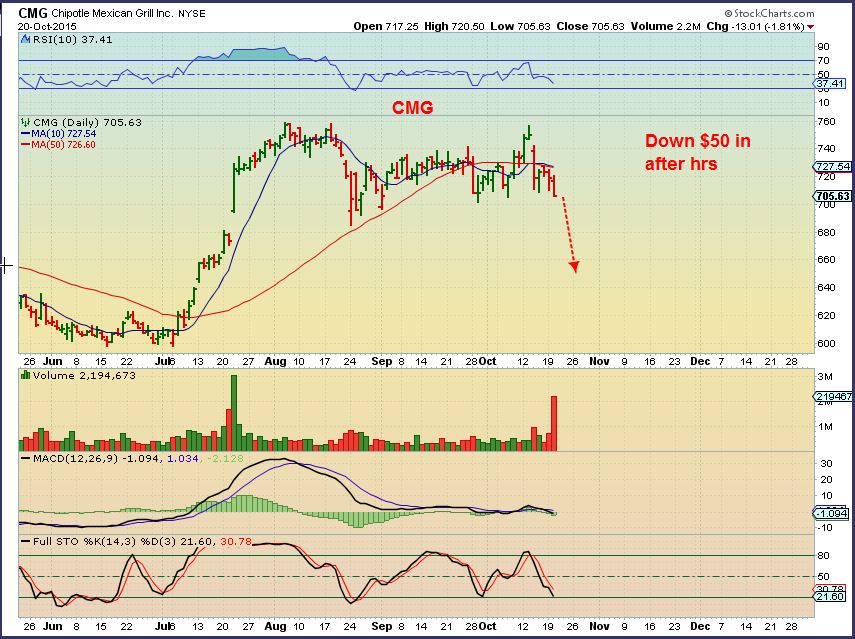
Signs are there that we may be ready to end this rally out of the lows, especially if the rest of the earnings this week disappoint.
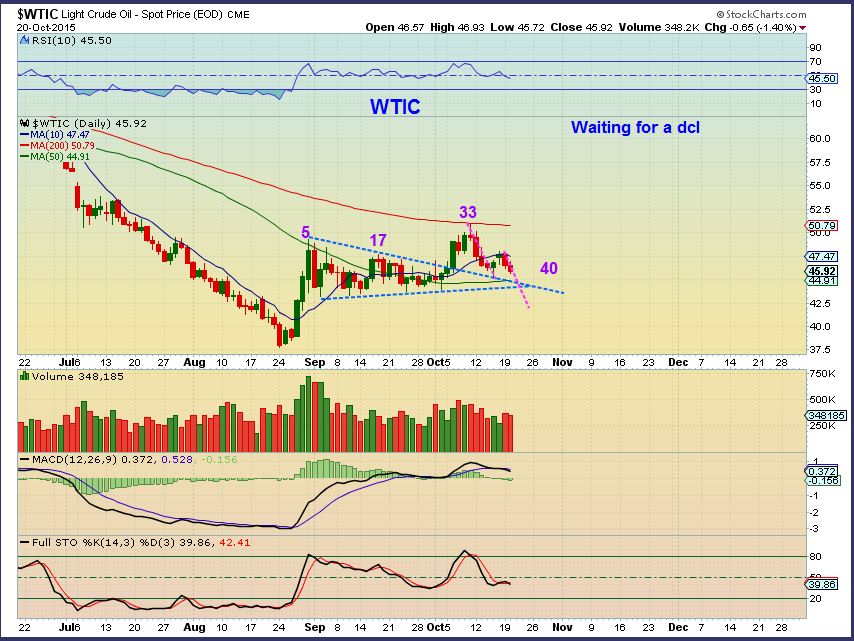
I’m still waiting to see if the DCL is in with OIL, or will we break the recent lows and drop a bit further? Timing on day 40 is prime for a dcl anytime now. ( I added on this chart a possible a-b-c-d target, dropping from the tag of the 200sma to the reversal off of the 50sma as a-b, with c-d possibly occurring now). It would act as a shake out, but…
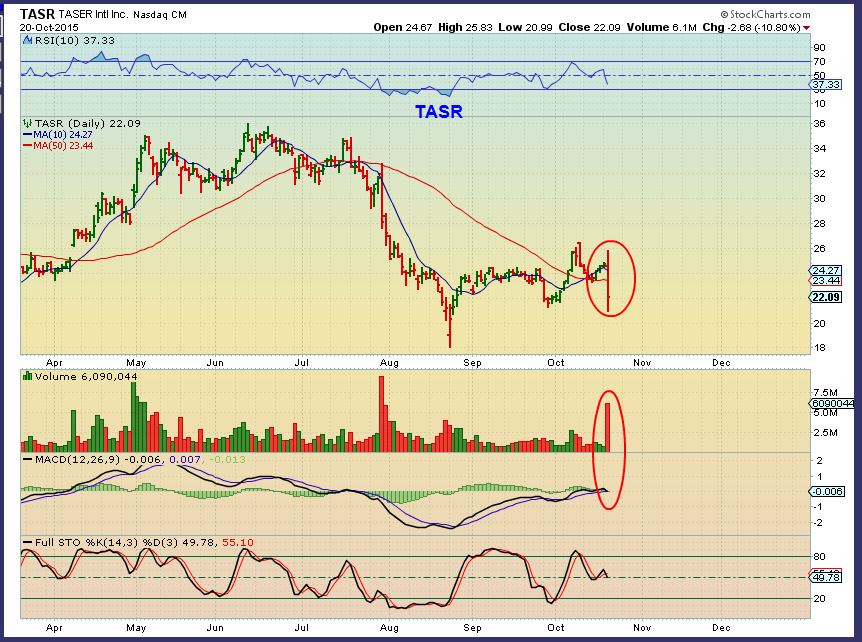
I do see plenty of Energy stocks acting rather bullishly when you consider that OIL has been dropping for the past 7 days. Some remain at recent highs . Lets take a look.
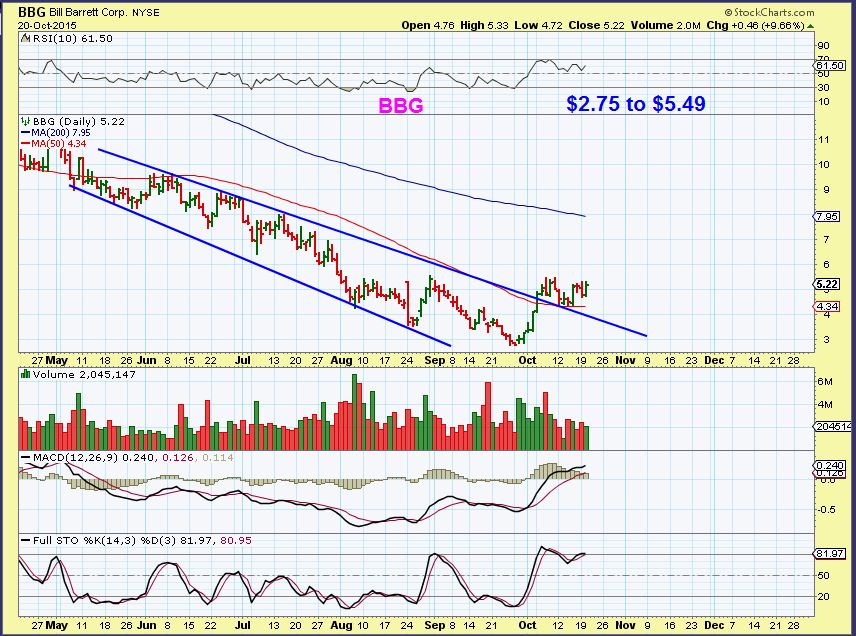
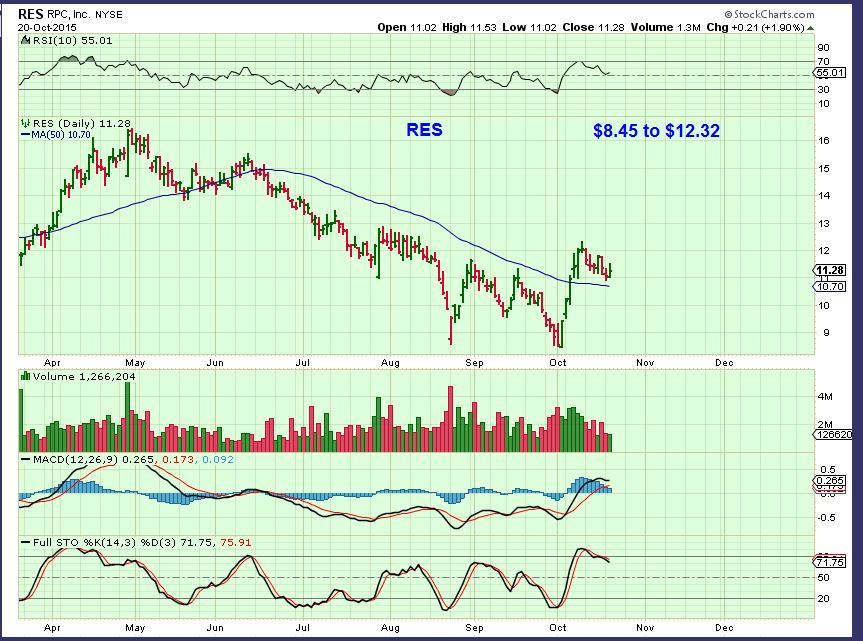
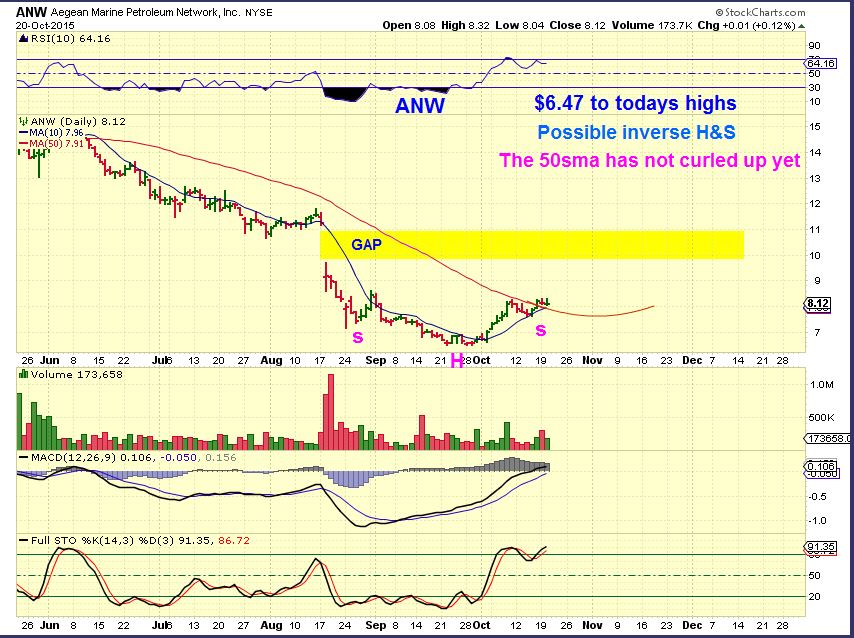
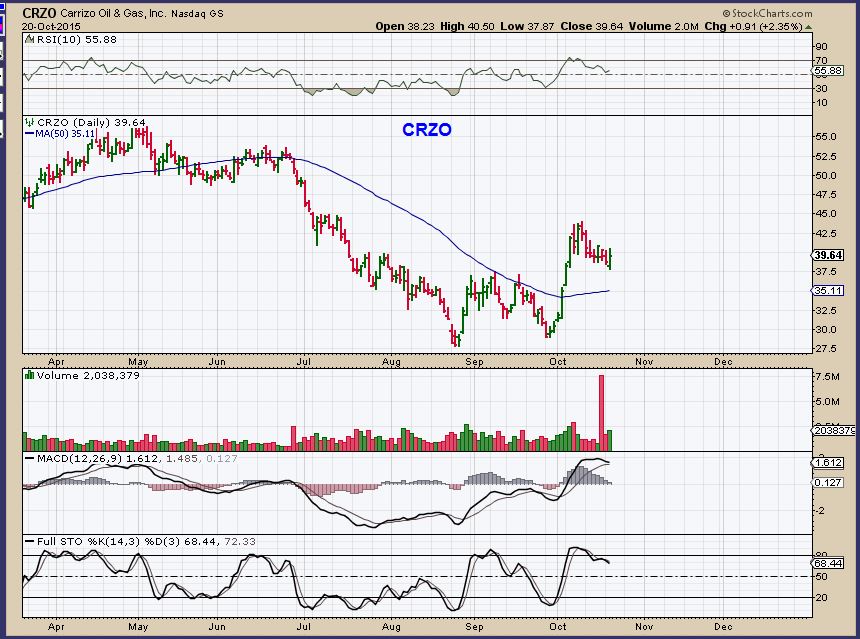
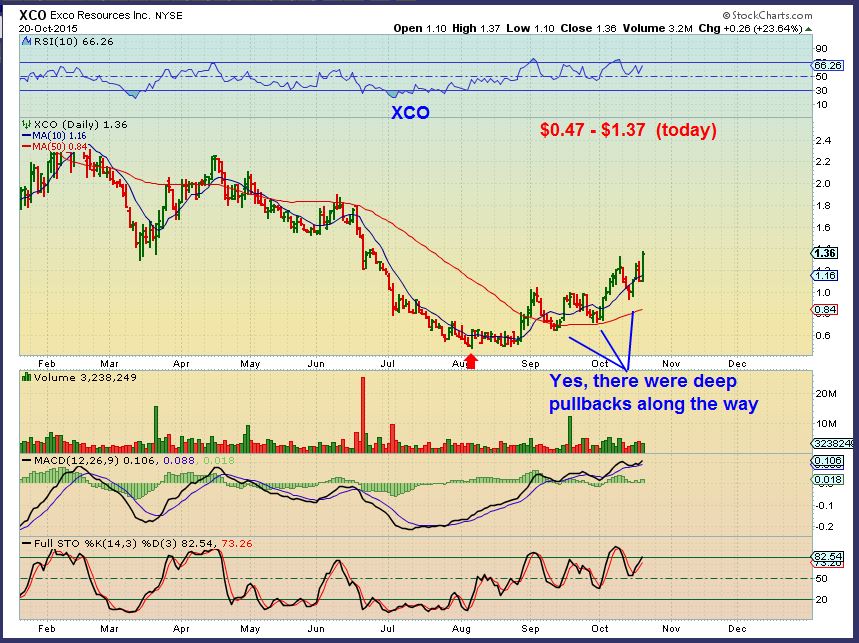
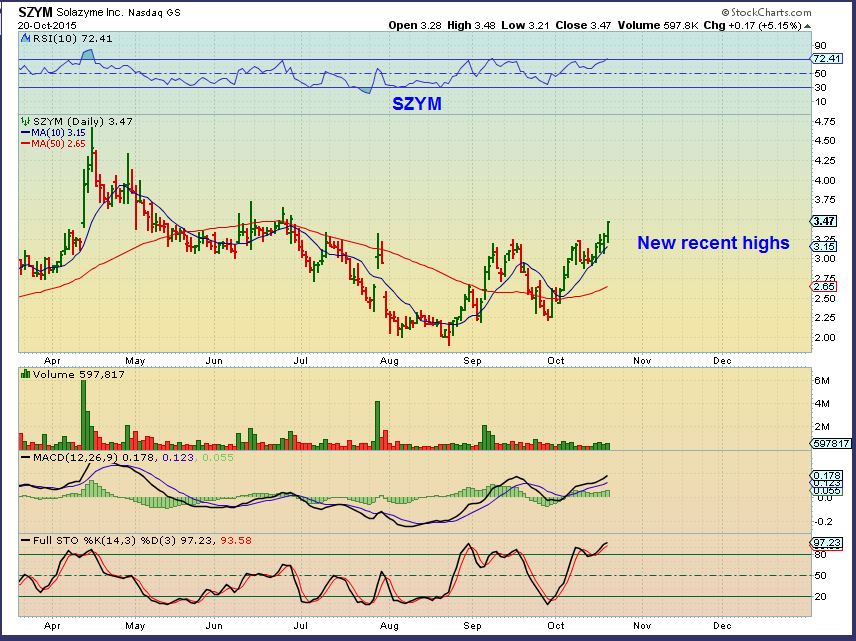
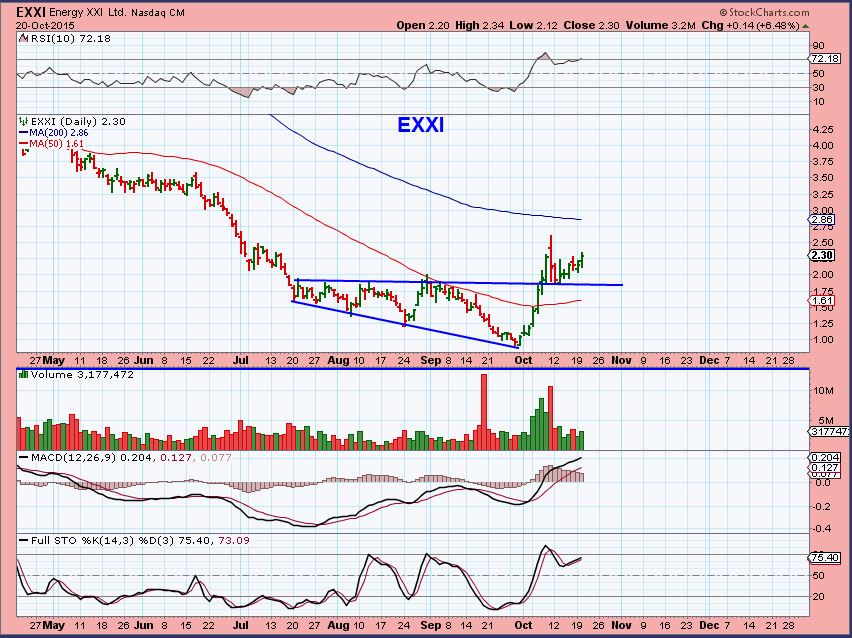
So as OIL dips into its Daily Cycle Low, many Oil Stocks still look good to me. You may want to start a shopping list if you haven’t yet, in anticipation of Energy making another run higher. These can still drop a little further, but they are holding up well with Oil down.
GOLD , SILVER, & MINERS
I almost want to send everyone back to yesterdays report and just read what I wrote there. The dollar hasnt changed much and my thoughts for the next move in Gold and Miners is about the same as yesterday. This one almost is a coin toss. I do have reasons for thinking that Miners will still run up & tag the 200sma , and I will point that out here, but I am not strongly convinced. As I mentioned yesterday, I would use a move higher to lighten up and anticipate trying to re-enter positions lower with a daily cycle low.
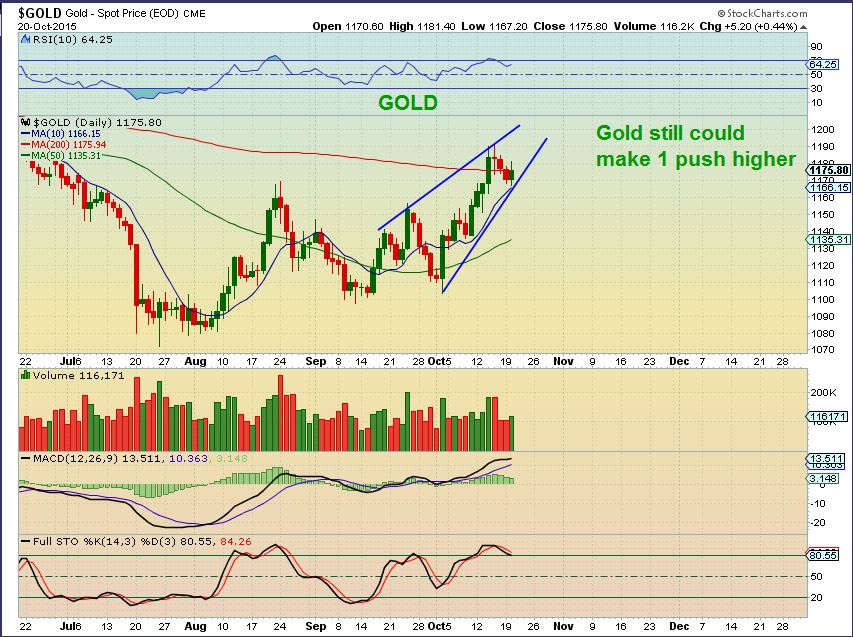
GOLD – This could still go either way.
GDX – Monday I pointed out this as a possibility. Instead of dropping to the 50%, we reversed higher Tuesday.
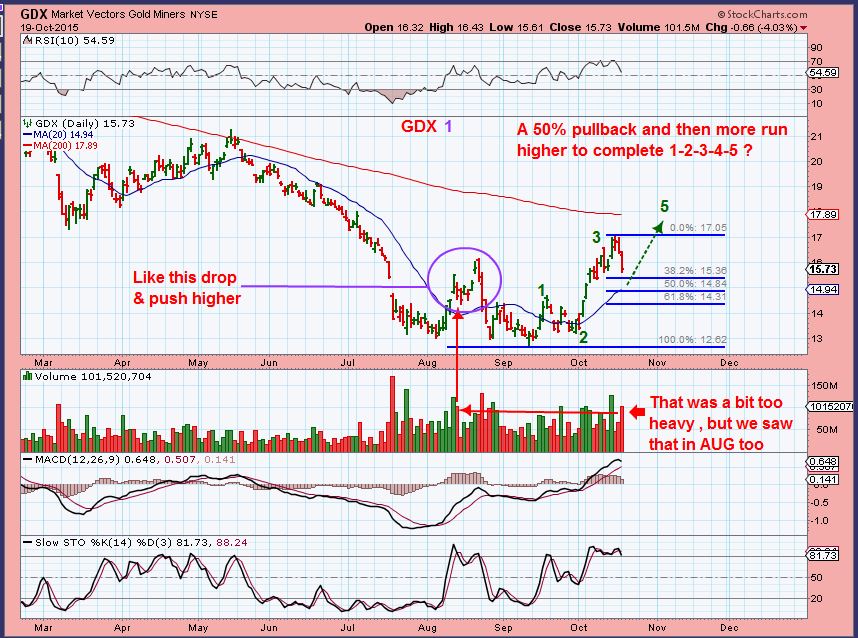
I can still see this playing out, especially with the reversal, but it really depends on Gold I.M.H.O.

I decided to look at some individual stocks and see if they looked tired or healthy enough to move a bit higher. I think it depends on what GOLD does, but lets look at those charts.
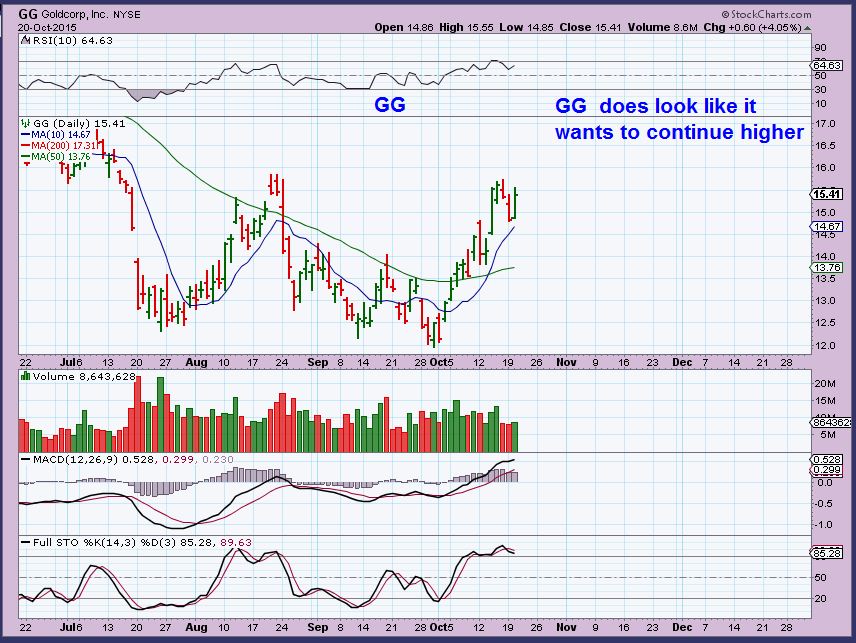
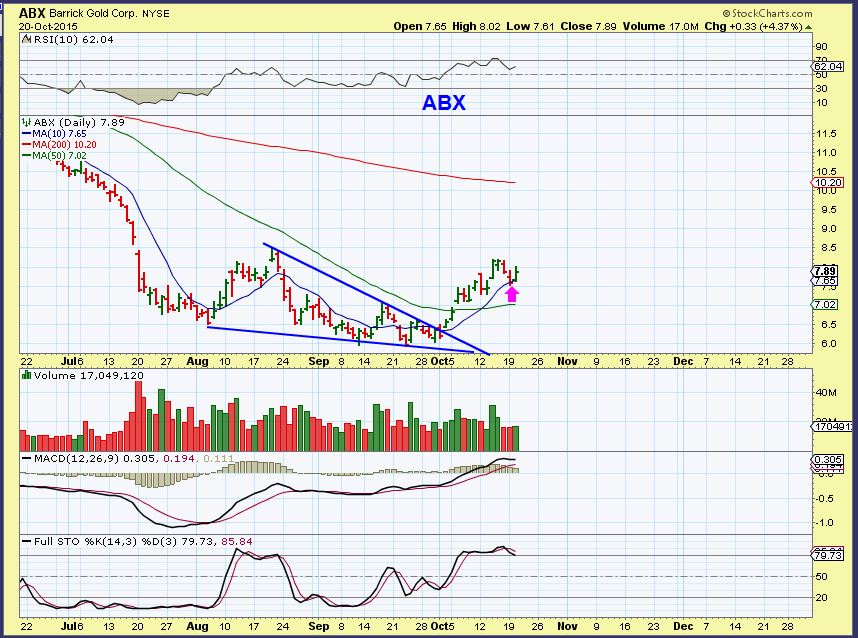
GG & ABX are larger components of GDX. They can go higher.
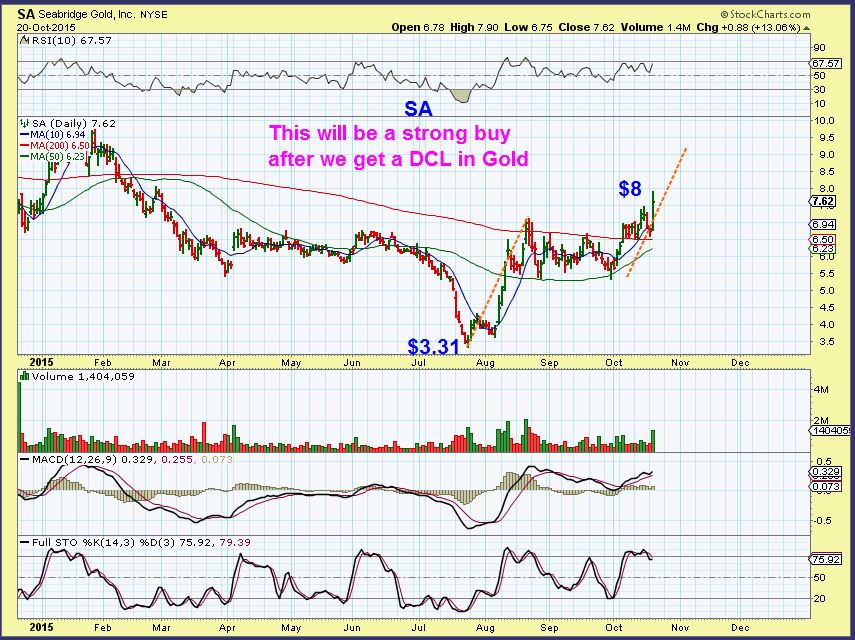
SA – Very nice move today, it wants to go to $9.
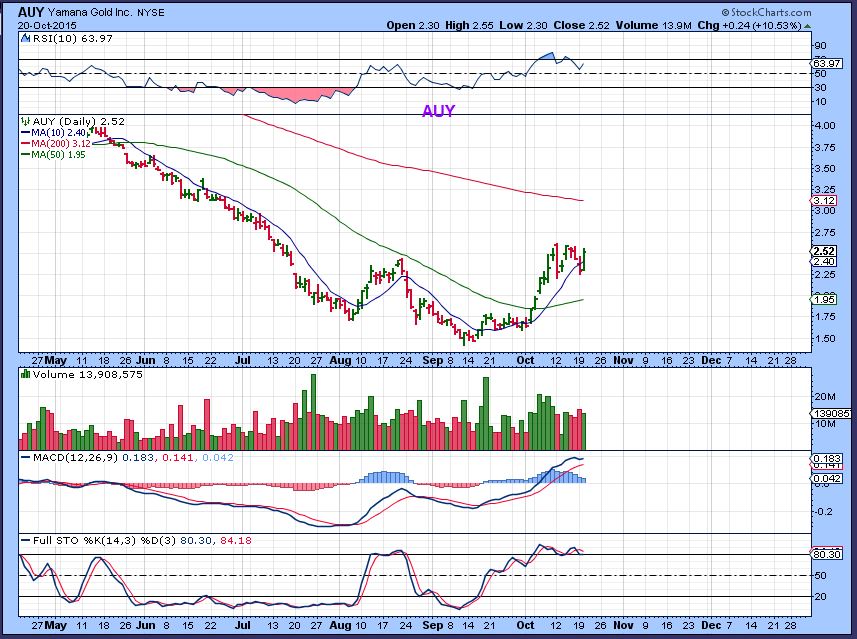
AUY – This also looks like it wants to go higher.
EGO, IAG, PAAS, MVG, and so on also have a bullish look to them. I will still call it a coin toss, because a bad day in Gold could easily send them breaking down.
I would actually like to see GOLD start dropping, heading into the FED MTG next week. If that happens, I think we stand a good chance of putting in a DCL on or after the FED DAY (Wednesday or Thursday). It seems that the bigger moves in Precious Metals have been happening right after the FED MTG. As for what exactly will happen with Gold & Miners in the next couple of days? Its somewhat of a coin toss.


CF, I’m not thinking straight. Would you please clarify for me?
“Signs are there that we may be ready to end this rally out
of the lows”
Sorry, sometimes I write something that makes sense in my head. I even proof read it and it makes sense, then when someone says , “What in the world does this mean,?” , It does look difficult to understand.
BY that I meant that the I am seeing signs or indications that the current rally out of the double bottom lows in the SPX for instance, may be about to end. Not forever necessarily, but just that this current bounce or rally may be ready to turn down.
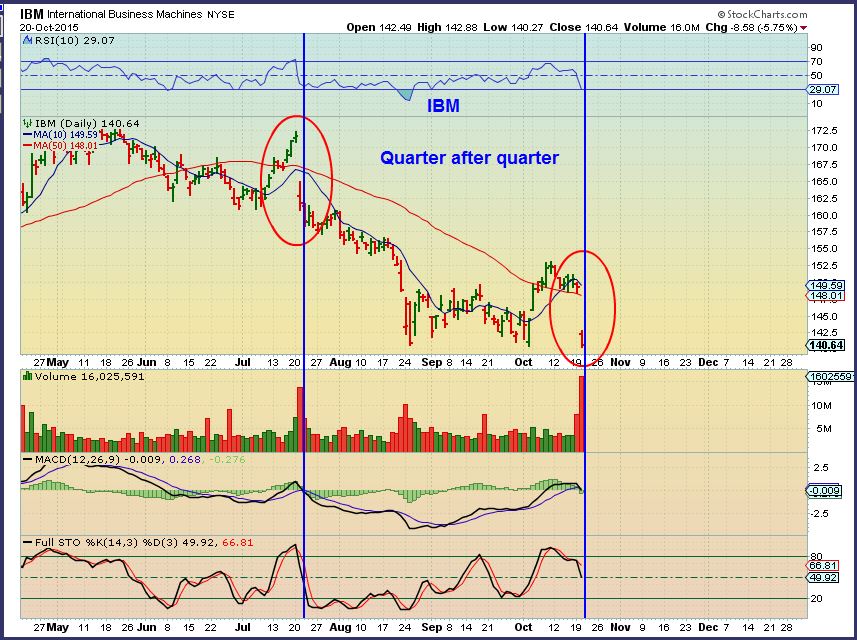
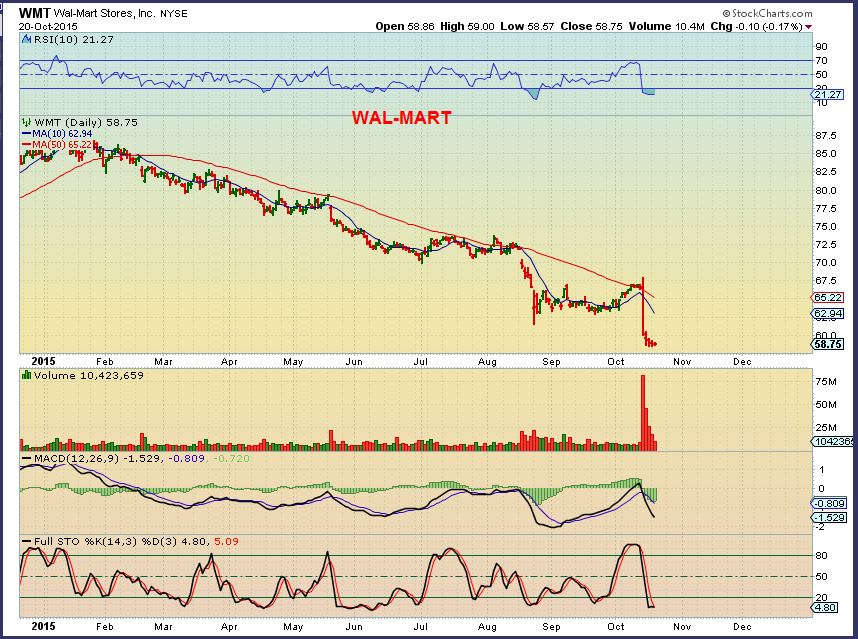
Many think that the markets will push to new highs now and a new rally will take things much higher, but I see many stocks like IBM, WMT, CMG, etc struggling at earnings. This may be a sign of a slow down.
Crystal. Many thanks.
Great Uncle Warren must be happy about IBM and WMT. (He has a third big holding not doing well but I can’t recall what it is.) Old economy investing…?
KO (Coca – Cola) just missed too, but not by much.
KLAC , BA, and GM green after earnings this a.m. … so it swings both ways at this point ( Coin toss?)
Reminder for all to check earnings dates for your little guys. Energy starts reporting end of this week through early Nov. Senior miners are ALL next week same time as Fed (wow, that’s crappy timing!).
Alex, we had discussed in the past potentially shorting top of the PM run. Based on recent reports doesn’t look like a good move yet. Is that still possible after DCL, and a LT 3rd daily cycle? I know we are talking potential commodity bottom. But if not, PM 3rd and 4th DCs can be EPIC fails.
Yes, but it may not drop the same way if i commodities and metals are bottoming. They may go sideways / down at times and be difficult to stomach for some . Please dont tell me you’re looking at a 3xETF to go short 🙂
No, that’s me with the 3x. Playing DUST and DWTI currently.
A heads-up here folks..
there is rumour of this being a potential 50-bagger, with a take-over in the offing.
Just starting to blast off the bottom as of yesterday.
Price dropped over 99% from the top, since 2011.
http://stockcharts.com/h-sc/ui?s=MNC.L&p=W&yr=5&mn=10&dy=0&id=p44810142823&a=428571401
for some background check out share-chat..
http://www.lse.co.uk/ShareChat.asp?ShareTicker=MNC&share=
some people are buying the bottom here with a view to paying off their mortgage 🙂
That’s funny, the managing director is William Howe? That’s my name! I wonder if I get a discount?
well there ya go Bill.. its a match made in heaven for you.
not sure you’ll get much more discount than 31p —> 0.26p as it currently stands..
i’m taking a low-risk punt on this one
Thoughts on GDX. See chart
Hmmm… looks like a bat signal. Trouble in Gotham? May be time to phase into selling covered calls on all GDX/J
Cal, I really don’t see a 1005 retrace. I expect 50% though. I’ll sell half there and set a close trailing stop on the rest. I’m looking to go long.
Thanks for your thoughts, Bill. Just to clarify, are you selling 1/2 your position at the 50% retracement? or are you looking to go long there?
Cal, it depends how long it takes to hit. We are on day 15 of a 20 day cycle, so I may sell it all there.
Yeah, I’m starting to think like this also, Bill. I thought we might have that run to 200-day but I no longer really see that happening. No doubt we’ll drop to a DCL shortly. I had hoped to maybe short this move, but haven’t seen a great entry (except for the one I missed this morning).
The real test is after the next low. Do you get a higher 3rd cycle for the first time in 4 years or does it rollover to new lows. Cause when it does rollover it gets ugly quick.
im seeing this pattern emerging in uwti/oil … #MariasBox
https://www.tradingview.com/x/SLLHhBGq/
gap up tomorrow? hmmm
FWIW:
Adding to my USO Calls.
wow… that is a lovely sight …
… and that is the same structure as my SA chart from yesterday then … hmmmmmmmmmm
https://www.tradingview.com/x/Li5aJZWA/
I got us on day 18, so its almost time for the low. I still think we break $44 a barrel. If we do I look for a big drop down to $43. All this in the next 2 days? No guarantees. I’m still in DWTI
My stop on the USO Calls are a 2 or 3 day close below the Red.
Added to my basket of junior oil stocks also today. WPX and PKD both have low debt.
I was tempted to add some Oil stocks too, but I decided to just hold what I have for now. I have been watching CRK, CJES, and a few others stricktly because I like the charts. I own GST and want to add too, but the gap at the 50sma has me waiting, just in case it wants to go there.
is it my imagination .. or do oil and gold take turns R/G …?
(red/green in case your massive brain couldn’t process that…)
It couldnt, so thanks for the definition.
I noticed that the last time (Not daily, but in runs higher).
It felt like we saw a run higher in OIL Stocks as Gold stocks pulled back, then Miners ran higher and energy dropped down. Now Energy looks like it may be ready for another run, and Gold Miners may (or may not still ) be ready to drop down to a DCL.
That should be easy enough to juggle if thats the case 🙂
hmmm … interessssting… thannnnks charrrtFREAK
No Problem MAAAAHHH WEEEEE AHHH!
Ken, thanks for posting. I was going to sit on my hands but after I saw your post earlier today, I decided to add to my calls. It can be hard with options – the difference btw averaging down and just losing more. They are getting cheap enough that I was able to add with little cash expenditure. However, I do need to start seeing a move up in the next week or so if we are going to hit my targets. Otherwise, I’ll start looking for the exit door.
When talking cycles, GDX=20 days GOLD=20 days? Is that right?
Hi Bill,
Actually cycles used to average about 18 – 25 for GOLD, but these days they have been stretching out in the 30 days too. Same for GDX, they have been 33 days too. It has been a little less reliable trying to guage things time -wise due to this . It may just be a bear market rally standard, maybe they will shorten again when they star step higher in a bull run.
btw CF … i thought i was in an EW forum for a minute there looking at your oil & GDX charts…
giggle…
LOL _ Its just a basic tool in the tool box for me. I dont do all of the sub waves and a-b-c-x-a-b-c- zig zag craziness – I’ll leave that to the experts.
My oil chart is actually for cycles. Cycles for OIL run over 30 days and often into the 40’s and even 50 days for one daily cycle. SO I have us on Day 41 – A DCL can occur at any time in this time period.
Hope it is soon; oil is KILLING me right now.
Anyone else wondering why today was the day that NatGas was randomly down 3% with inventories tomorrow. Finally found that answer. My good friends at Goldman Sucks were up to their old tricks again. I see natty trading some with oil here. It’s really the same story – there is just too damn much of it. I read that Saudi Arabia is pumping 2Mbpd more than is needed globally. PER DAY! That’s just crazy – not sure why they would just wash themselves out like that to ‘increase market share’. My gas tank loves them. My portfolio hates them.
NatGas article: http://www.naturalgasintel.com/articles/104096-goldman-cuts-us-natgas-price-forecast-again
Saudis have kept production up bcos they’re skint. They need the cash even if it hurts. Hurts them more not to have the revenue.