Week in review, lets see how things are growing…
SPX – Are we setting up for a back test and rejection? Or are we about to break through?
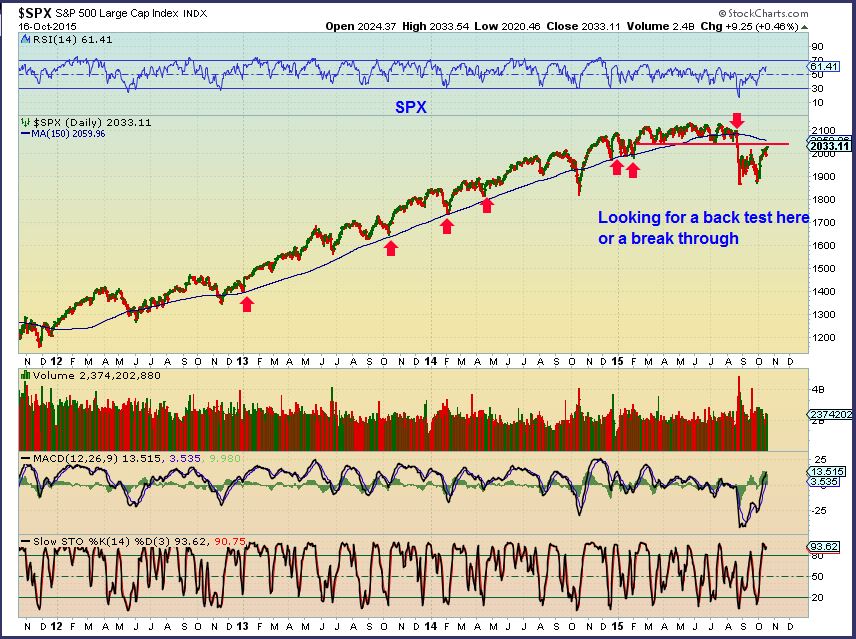
Lets look at some clues…
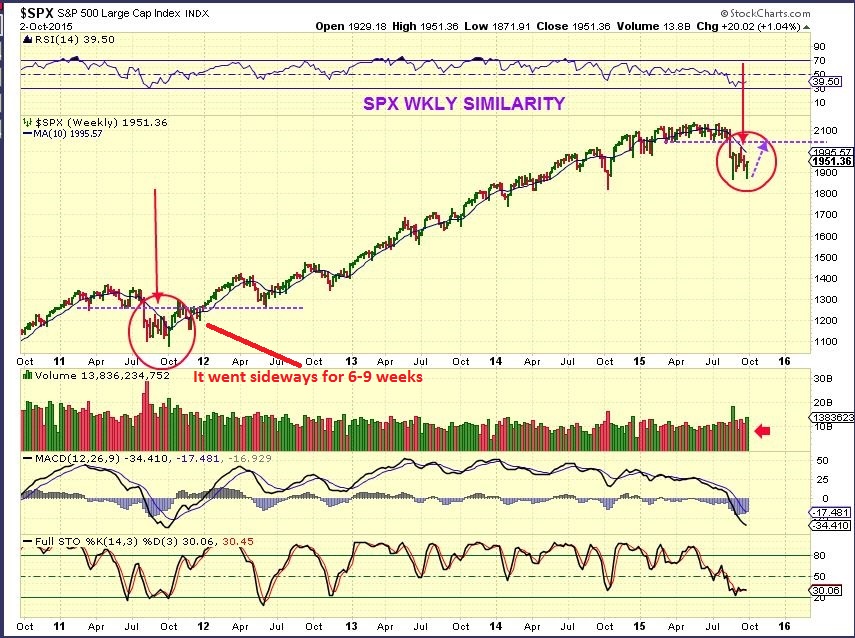
I posted this chart on Oct 2. I expected the SPX to rally up for a back test, but here I am showing the similarities of a break down in 2011 and then a back test that broke through and rallied. This chart shows that when the ‘test’ occurred, it still took a while ( 6-9 weeks of sideways action) to strengthen for the break out. SO this MIGHT take some time to play out if we are going to keep going higher.
We are at a significant point though. I have felt that these markets could rally and drop also. This week is Filled with earnings! That might affect the direction going forward. Did you see Walmart (WMT)? It was crushed, but I also pointed out other areas that looked good, like Semiconductor ( SOX). The SOX is still below its 50 & 200sma though. SO I am semi-neutral. Lets look further, to the charts!
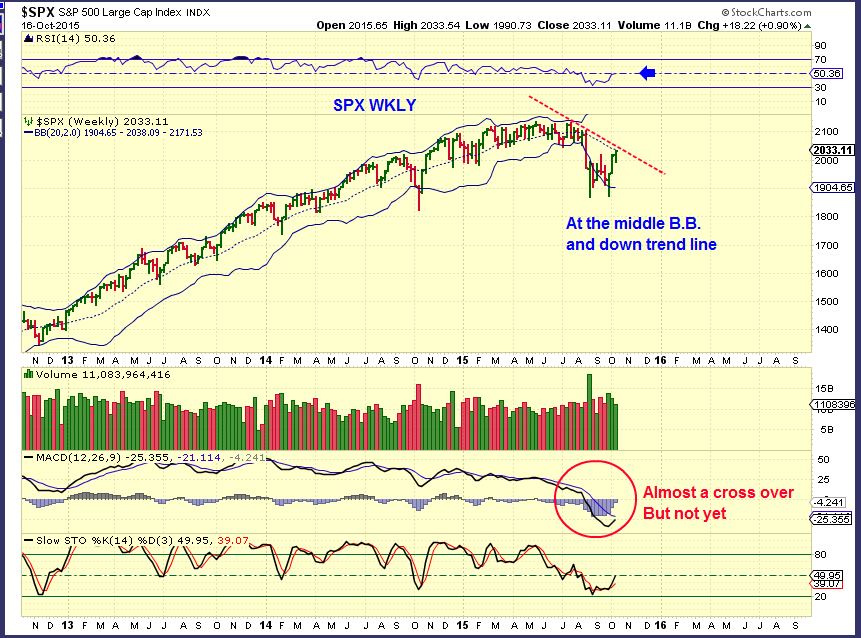
SPX WKLY – Can it power higher from resistance?
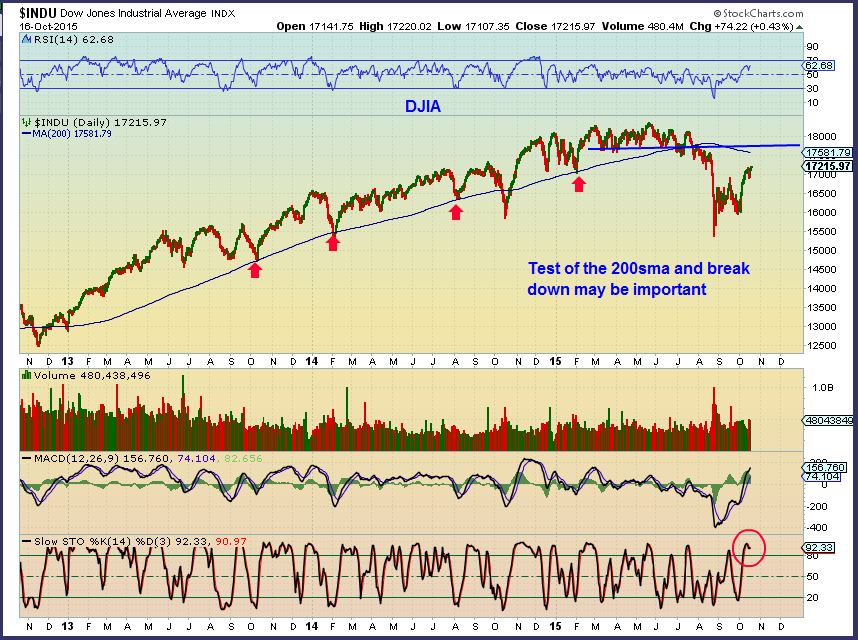
DJIA – The Dow is approaching resistance too.
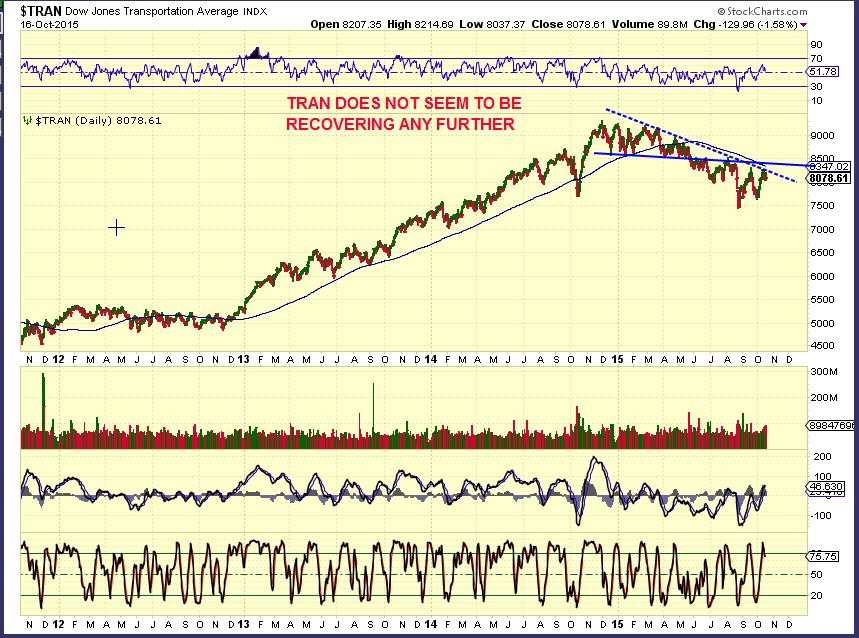
$TRAN – The transports are not out of the woods, and they did pave the way lower. Recall that I started pointing out the TRAN weakness in the spring. It has not recovered and still makes lower lows and lower highs. HMMM?
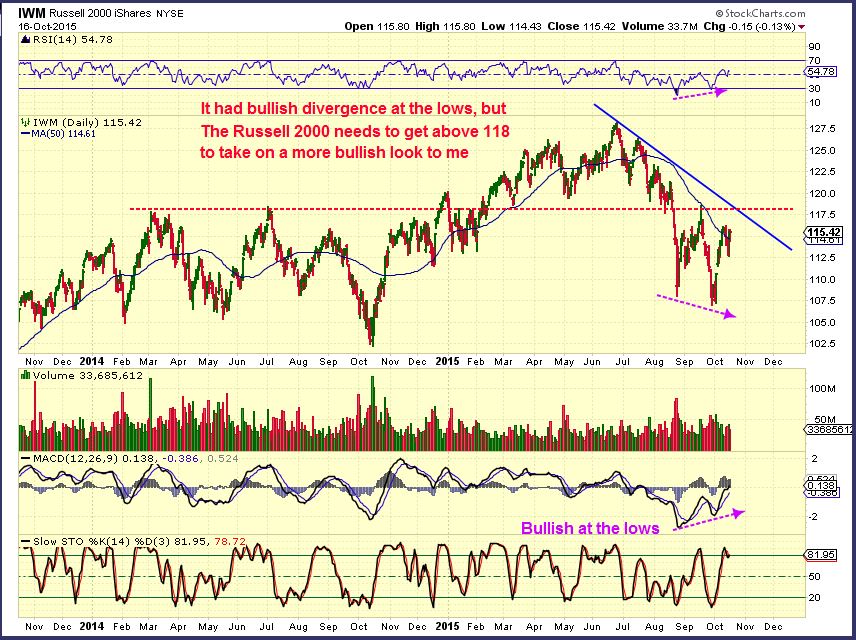
IWM – The Russell 2000 had strong bullish divergence at the lows, but it has more work to do, or this is just a bounce.
So let me leave you with this thought. The markets basically fell apart at the Fed Meeting and now they are bouncing higher. We have a Fed meeting at the end of the month. I’ll be watching to see if the markets now drop into that Fed Meeting and rally out of it as a result, or do they keep bumping resistance now and sell off after the Fed? Many scenarios could play out going forward, but we are basically in the middle of a move here.
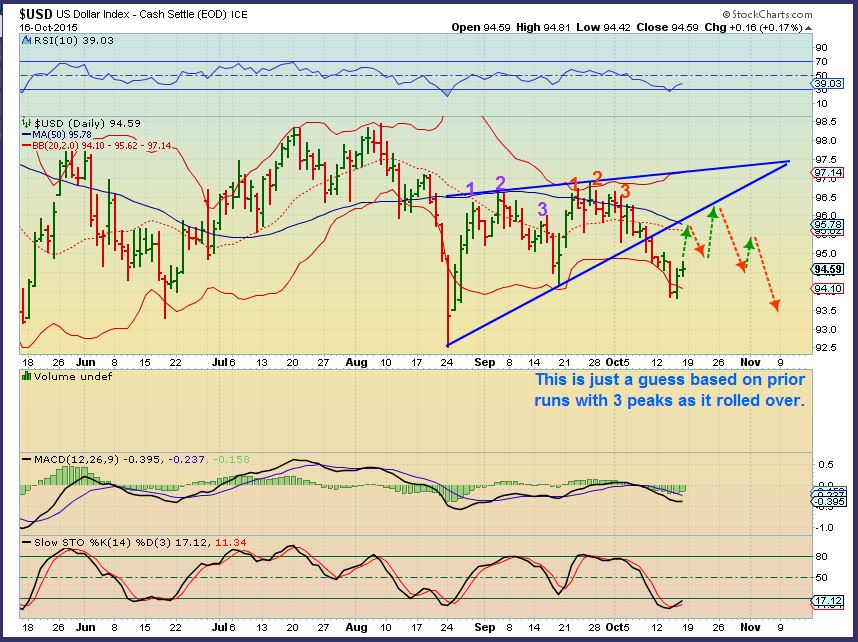
USD – I have been calling the Top on the Dollar and continued weakness since last spring too, and I do not see that changing here at all. The dollar is bouncing, but continues to show weakness. Below is a guess, simply based on how the dollar has bounced around in the last 2 daily cycles. The last daily cycle was left translated and notice that Sept lows were broken. This is Bullish for commodities.
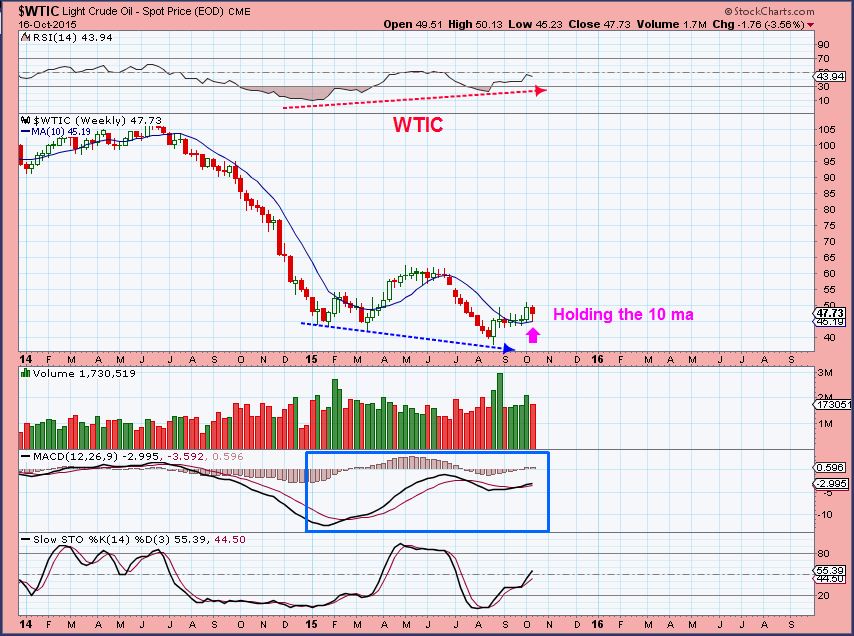
WTIC WKLY – Held the 10 ma last week. Excellent divergence at these lows.
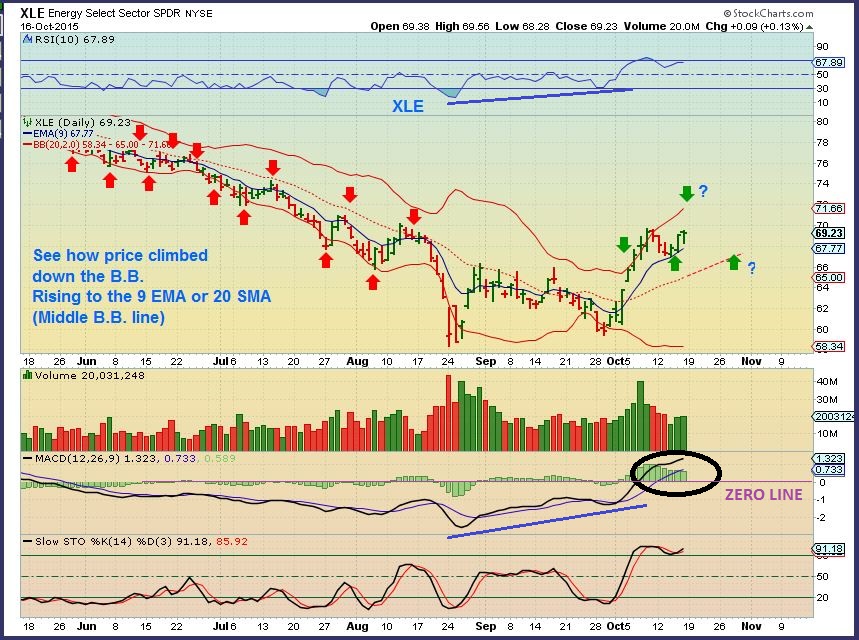
XLE – Just pointing out how the XLE moved on the way down (See lower left of the chart). Maybe it climbs in similar fashion.
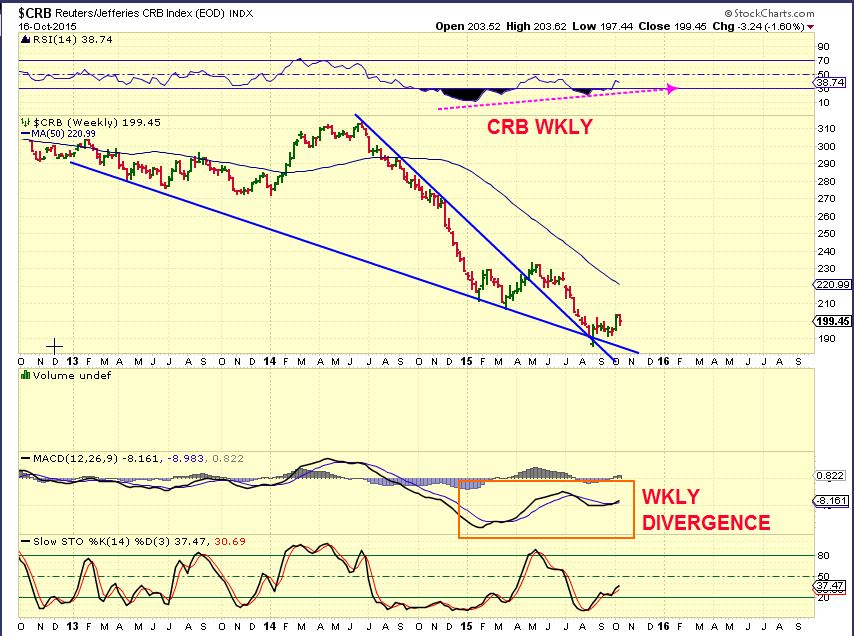
CRB –
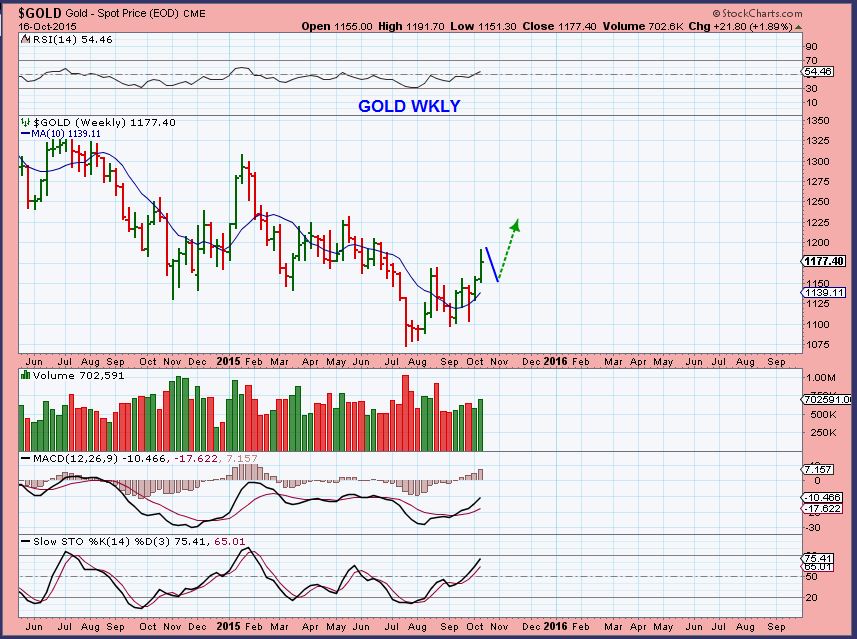
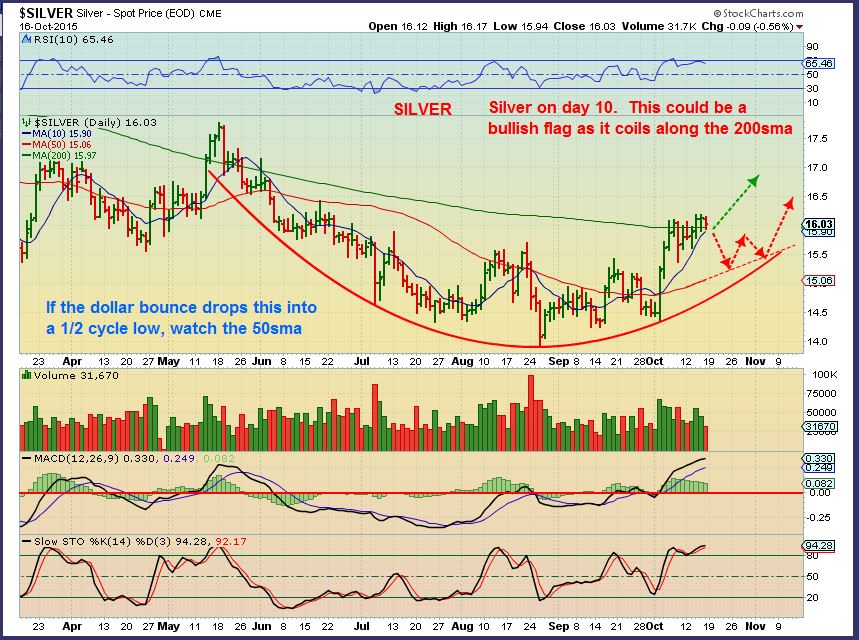
GOLD,SILVER, & MINERS
GOLD – I do NOT feel that Gold has to drop here, but I drew this because it is on day 10 and it could drop down and then go on to make new highs on lets say day 18,19,20,21 etc. So if we see if drop this week with the dollar bounce, I am not concerned at this point. Price may just keep climbing the way that it has the past few weeks.
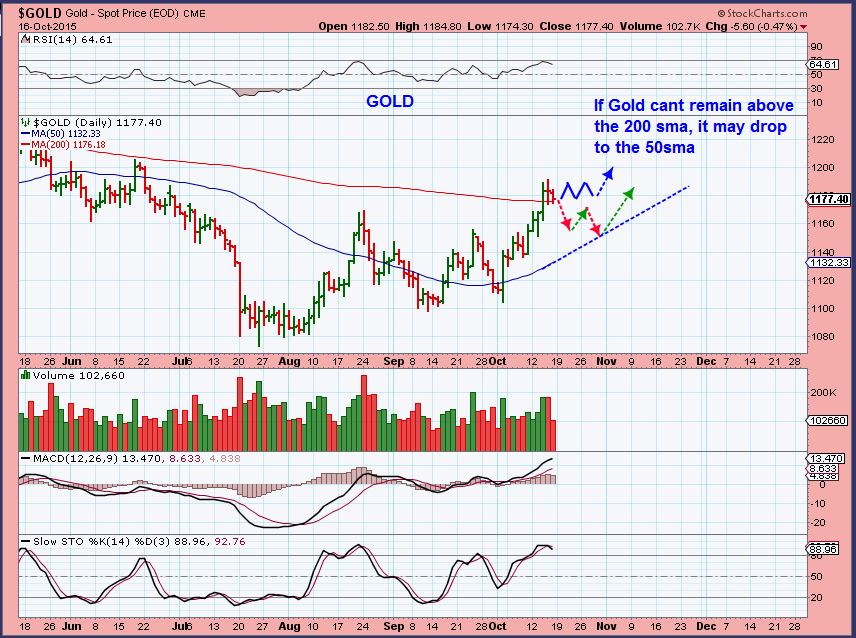
GOLD WKLY – I drew the drop, but again, it does not have to dip here. This is what I would watch for if it does ( $1140 area).
SILVER – Also on day 10, it has time to drop and run higher. Notice that it has been holding up nicely, so it may just coil at the 200sma, run higher and then fall into a dcl later.
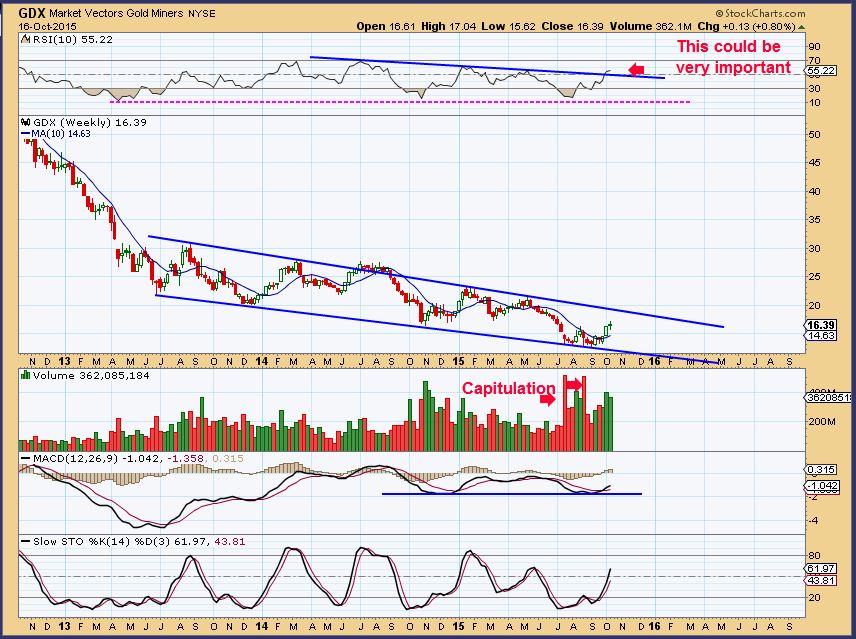
GDX WKLY – Off to a nice start
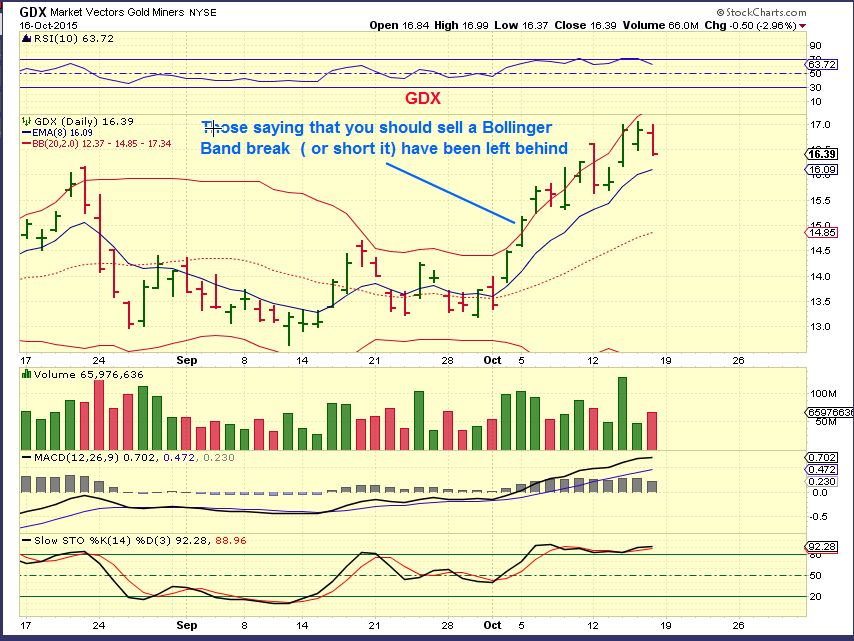
GDX DAILY – I’ve said this in the past, selling a B.B. break or shorting it is not a good idea when expecting a nice bullish run higher.
This may just drop to the 8/9 ema area, there is a gap down there. I believe this is day 12 and not day 25. I am following Golds cycle count, so this can move higher after this slight dip too.
Since I have mentioned in prior reports that Commodities and Precious Metals show signs of putting in a longer term bottom and the Dollar of having topped, this is a visual how the Miners could play out as time goes on. Not exactly like this, but you get the idea, daily cycle after daily cycle. Inverse H&S could form on a weekly chart.
We are at a point in various markets that we need more time to see how things will play out, but longer term I do like the set ups in Precious metals and Oil on the bullish side. This week is loaded with earnings and that may push markets one way or the other too, so we will keep an eye on things. I hope everyone had a great weekend, see you on Monday.
~ALEX
Whats Up? 
 Mixed Reviews
Scroll to top

Hi alex, expect you had a good weekend as well. Thanks for your early report.
Curious your sense of friday’s COT.?
Here’s my interpretation: gold confirms where Alex thinks we are in the ICL/DCL timeframe, imo. The silver one was nasty ugly. But it really hasn’t responded yet. However, COT by itself days caution for silver. I don’t think you can make longer term conclusions from either, though. But I’m not Alex, he may have something much better for you!
Hi Beek,
The commercial shorts are getting high, especially for Silver. In bear market rallies , this is a good indication that we’d be nearing a top (Temp daily cycle top or the entire cycles top). Are we in a bear market rally? Remains to be seen.
Also I do take note of the COT , but they are not really good timing tools for top. They can get extreme. They are better at pointing out lows, because the short positions get drastically low and match other ICL readings. If I was long, I’d use a trailing stop, but I wouldnt be adding to positions, unless I saw individual Miners that looked good for a quick trade.
My bigger picture thinking is that we may possibly be seeing THE LOWS in commodities and Precious metals, and the high COT may indicate nearing a daily cycle top for now, but we may not even be at the top of the daily cycle yet. Are we at THE GOLD TOP based on the COT? I dont reach that conclusion.
What does B B mean??
Bollinger Band/s
Thanks JD –
Yes, it is quick way of writing Bollinger Band. Sorry about any confusion EJ.
Alex, in looking at your charts above, you show an expected bounce in the USD to retest the bottom of the lower trend line. You also show that GOLD could drop to 1140, although it doesn’t have to. My confusion is with the XLE. You show a chart where you expect a move higher. Up to the green arrow at the upper BB. As you know I took positions in KEG last week and already I’m treading water. Your USD chart makes me think I should get out of KEG but the XLE chart thinks I should hold. What are your thoughts on Energy stocks this week.
Good question! I have XLE/ERX just about breakeven, thinking I should just eject and walk away. But some of the small caps lead oil to the downside this time, like BAS. Which crapped this morning and recovered. Some are still down but some are green with oil getting taken back out to its usual woodshed. GDP having lots of problems moving up recently def a bad pick on my part there.
I’m shorting oil with DWTI. Sold everything else for a loss. I posted a week ago I thought OIL was going to $42. Don’t know why I didn’t follow it. I will stay short until at least $43
Ah-ha. The old contrarian in the contrarian chat room scenario. Well played.
I remember USO post, the weekly above for WTI looks sweet. I was expecting less pullback, oil had big pop but just cannot find footing right now.
I’m dropping ERX, that means should rebound tomorrow. But I’m not waiting around in leverage during a crapfest. Sorry, probably my fault for jumping in energy and tanking it for everyone.
Its hard to stay out of the markets. I have to remember that cash IS a position.
No kidding! We see all of these great setups but by the time I jump in, it’s over and we start the next leg down. But the good news, I’m making somebody else really rich, hope they are happy!
Cason, I feel your pain!
Yeah, but I’m kinda done with this. Need some winners!
I need some winner, cash getting low
Here is what I posted on Crude on 10-16-15.
very nice harmonica…..Bill
But does your wave count agree with the harmonica?
GDX pullback should put it nicely inside the box now, right?
Maria’s box? Finally I get to see it!
I know. I’ve been waiting weeks!
.. the few … the proud …
o wait.. that might be the marines slogan…
yes… it’s a magnet 😉
i dont think oil goes that low… it’s just about finished correction imVho … 😉
Bill, you taking your shot at miners here? Finally down in that support area. I posted an unoriginal chart last night but either this is wave4 pull back support or its going to chop and put it intermediate top here.
I’m staying away from Gold and miners for now.
I just saw your post below, that you sold and went to DWTI, so you may not need this question answered. I will explain anyway.
In the weekend report, I am pointing out what I see in the chart of the Dollar and separately the chart of OIl and separately in Gold, etc . Do they correlate at all times daily? No, but they do correlate over time, so we are aware of that. Oil looked to have bottomed for a DCL and as I mentioned in the Thursday or Friday report….it MIGHT bounce around here because the timing is so tricky with OIL & CYCLES. ( I will attach the chart that I used in that report below…and edit it with some additional notes). Oil can be 30+ days or we’ve seen 50 day cycles, so I wrote in that report that OIL may drop down to the 50sma and put in a DCL later this week too, but the set ups looked proper.
XLE looked good Thursday and Friday, I would have expected a run to the 200sma overhead ( we still may) . Many energy stocks looked good too, thus the report Friday . Many of those set ups still look fine ( EXXI, ANW, AREX is ok, etc) , XLE has not even done a 38% pullback yet. Is this a double top short term for XLE or just a red Monday after many green? Time will tell.
The dollar bounce here looks weak to me, more time is needed. I just keep my stops in place.
I think the weekly WTI chart in report looks sweet. I still have my individual energy names. Even though they move up and down very fast, it’s unlevered so at least I don’t have slippage. If they move against me some, I can wait for better exit and entries. Not so with 3x – I didn’t get the pattern I wanted out of ERX so time to drop it and move on.
I actually added to USO today, but only 1/2 of what I would have b/c it has been so weak last few days. I’m still with you, Alex. I went much further out on the calls this time – 2x what I thought I needed to account for weeks of bouncing to nowhere. But I would appreciate a big move eventually. 🙂
Alex, GDX just dove through EMA9, J did it earlier today. Still think likely intact for a continued move up or best to wait to see support act as support (instead of jumping bc my # hit)?
Glad I sold my NUGT last week. But I do think we will still get a strong move to the end of the month after this reaction.
I’m not trading it , because it is unclear to me.
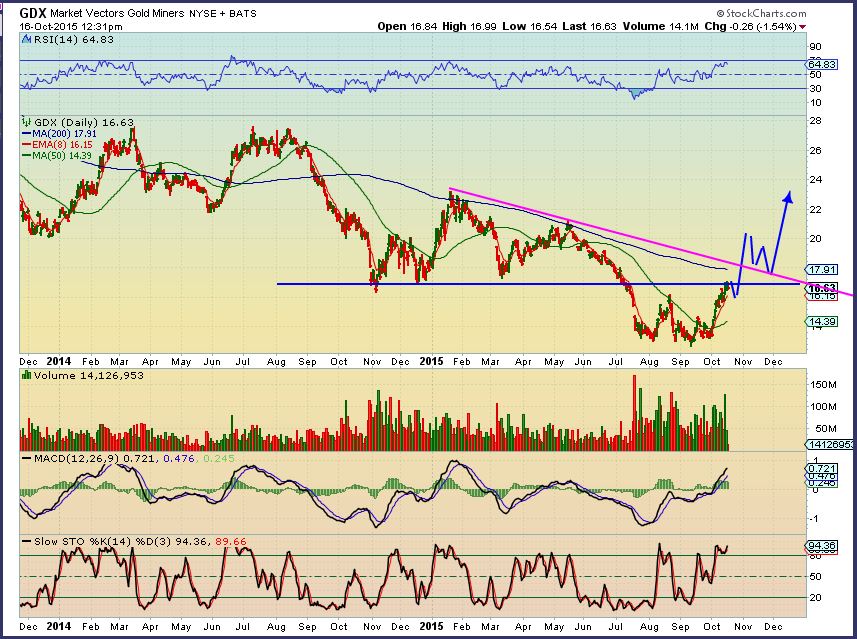
I would have expected a 1-2-3-4-5 move in GDX to the 200sma. Right now there is a chance that GDX put in a DCL on SEPT 30, and this would be a 1/2 cycle low and then a run higher for the daily cycle top. Gold & Silver really looks like they put in a dcl on Oct 2
IF that is not the case and Sept 11 is the DCL/ICL for GDX, then we would be late in a daily cycle and ready to drop further.
It is unclear , so I wont trade it at this point. I still own some Miners and will see what happens with those.
Well, I kept saying I’d buy if we ever got a pullback. We got a pullback. I jumped in just before close. 1/4 position so it’s so small and with a very tight stop – basically playing for either an immediate reaction higher off of 2 down days or final move up to DCL. If we gap lower and head down tomorrow, I’ll stop out pretty much instantly and wait for confirmation of next low. (Last time I waited for confirmation you couldn’t get it 🙂
wow.. natty looks to have turned today… hmm
Triple bottom on DUST chart. RSI and MACD turning up, and VERY large volume. I wouldn’t be going long GOLD or miners right now.
Looked at DUST and JDST – That is huge volume starting last Wednesday. JDST Wednesday record volume.
Triple bottom by itself means nothing, but it seems like a lot of people betting against the miners lately.
Weird, I was watching the GDX volume a bit before the close and it was 45 million, now it has over 100 million.
And WTIC volume is huge too, where UCO, USO, OIL do not. HHMMM?
recka frezza…..
???????
(that’s ladylike swearing)
HA!
some miners & energy stocks look like they are in “4” correcting right now/still …hard to tell
I agree, but if things pick up to the downside, we’ll see it as an A-B-C corrective wave up, right?
GDX looks like 1-2-3-4 now from the Sept 11 lows. I was looking for 5 at the 200sma
EDIT: Sept 11 was the lows, so maybe not an a-b-c bounce
it.. do u mean gold or gdx? but either i guess is a yes..
i actually have 2 counts for oil as well … well actually 3 😡
2 different short term bear .. 1 bull.
GDX
That cannot be the correct volume on WTIC chart. Maybe they’lll update it later.
https://www.tradingview.com/x/wG2H6O9z/ like this …
how FREAKY is it that both ‘corrections’** are EXACTLY 11 bars???
what the ….
**(if this is a correction and not an impulse)
Completed H&S pattern on DUST as well.
As far as SPY and friends are concerned – look at the next few front month contracts for VIX. It’s really dropping and VIX is back in contango. Bullish for market.
NEW REPORT WAS POSTED….for some reason, my email alert system isnt working again, but you can see from the twitter feed at the top of the page that it was sent out at about 10:50 P.M. Eastern,.
We will look into that with DISQUS and try to get that fixed soon.