
Just A Little Change
The markets didn’t move in quantum leaps yesterday, but there was a little change in how we may want to view things. Lets discuss what stayed the same and what may have changed.
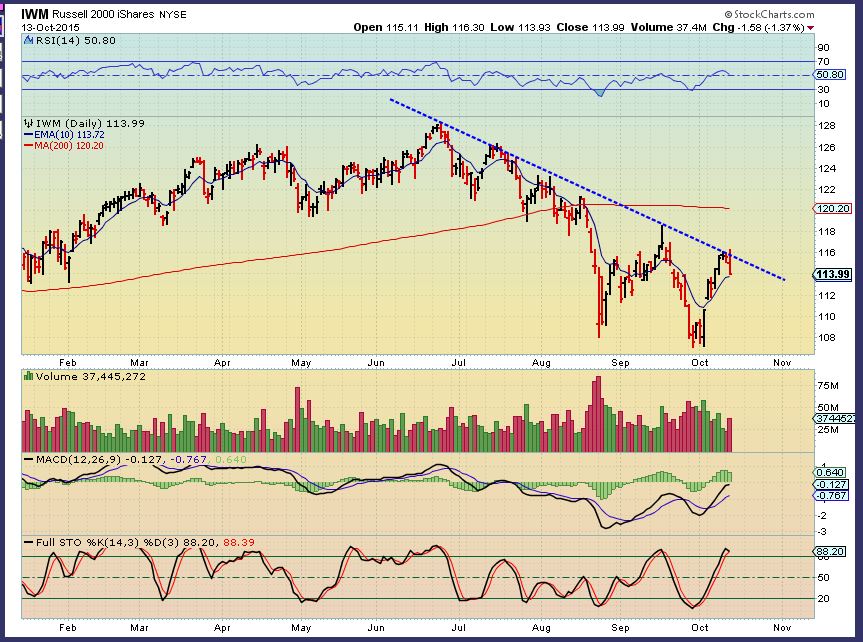
IWM – We saw a reversal at a point of resistance
The NASDAQ also reversed at a point of resistance
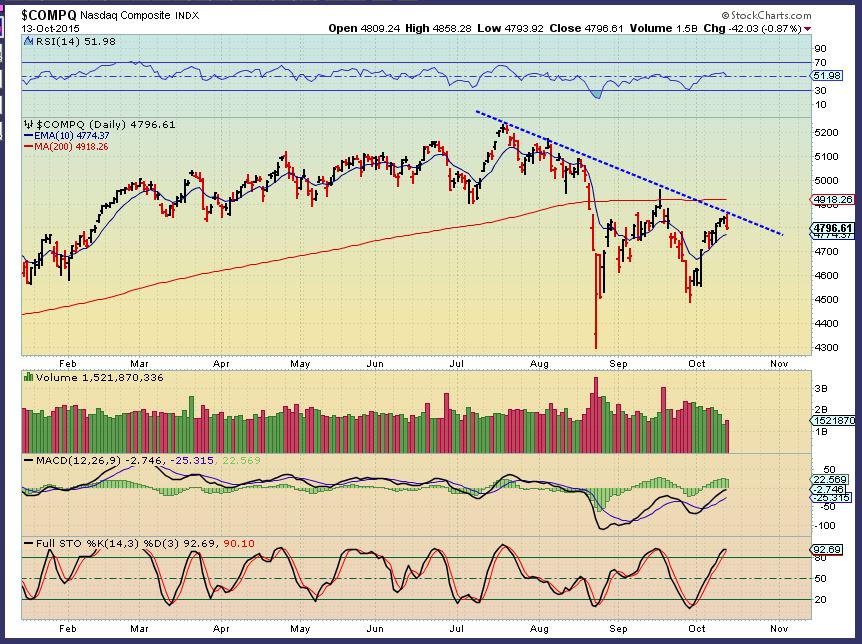
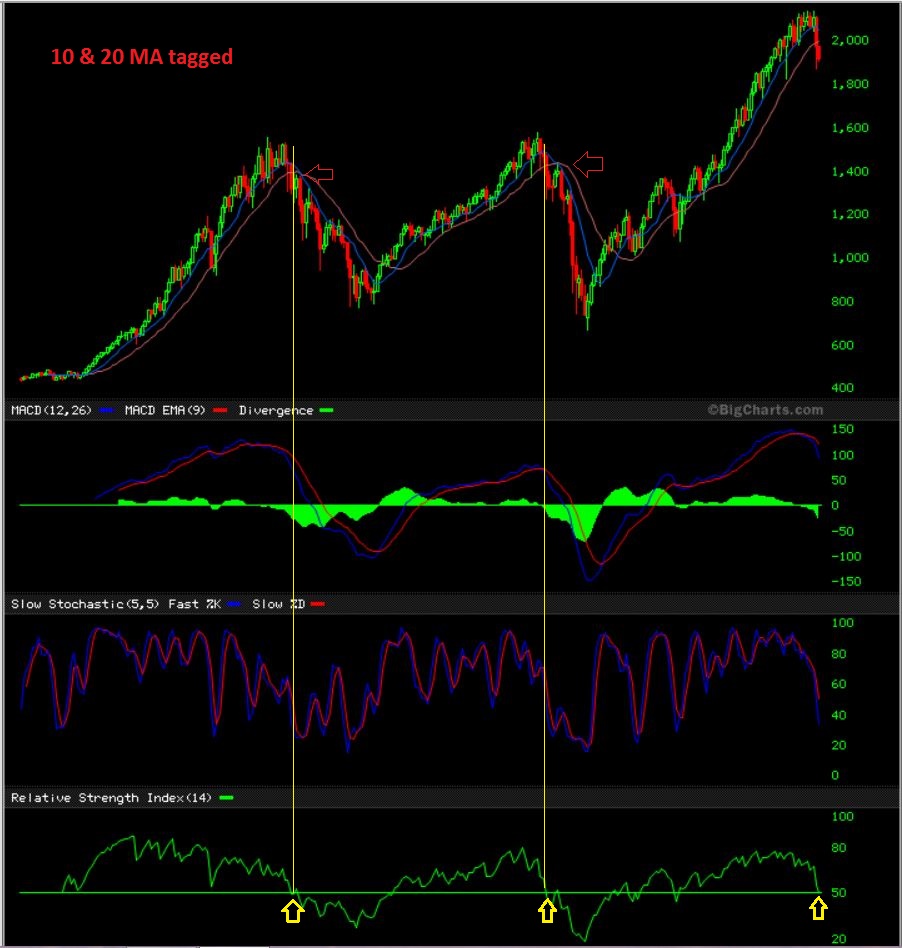
The stochastic has entered overbought, so a pullback may be in the works. DO I think we are going to get a steep crash-type drop? Not at this point. The markets have bounced and the short term indicators like the MACD still look bullish. Also the Monthly chart that I pointed out has not reached the tipping point that it did in the past. Lets review.
.
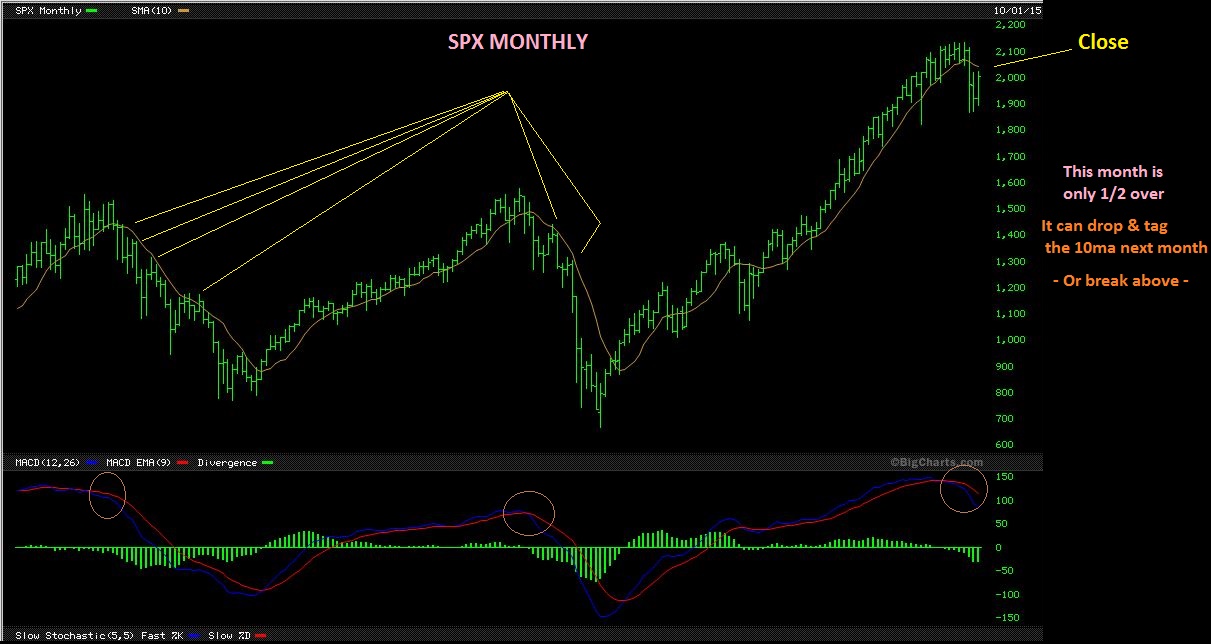
SPX MONTHLY _ I posted this chart Sept 1st and showed that a couple of months following the initial drop, we should be watching for a rally back to tag the 10 &20sma. THEN we’ll see if it can break above it or not.
SPX MONTHLY NOW – We did rally back, but we are just shy of tagging the 10sma. We could drop & rally again , breaking higher or tagging and dropping. Basically I’m thinking that we get the same old whip saw type action that we have been seeing over the past few weeks.
.
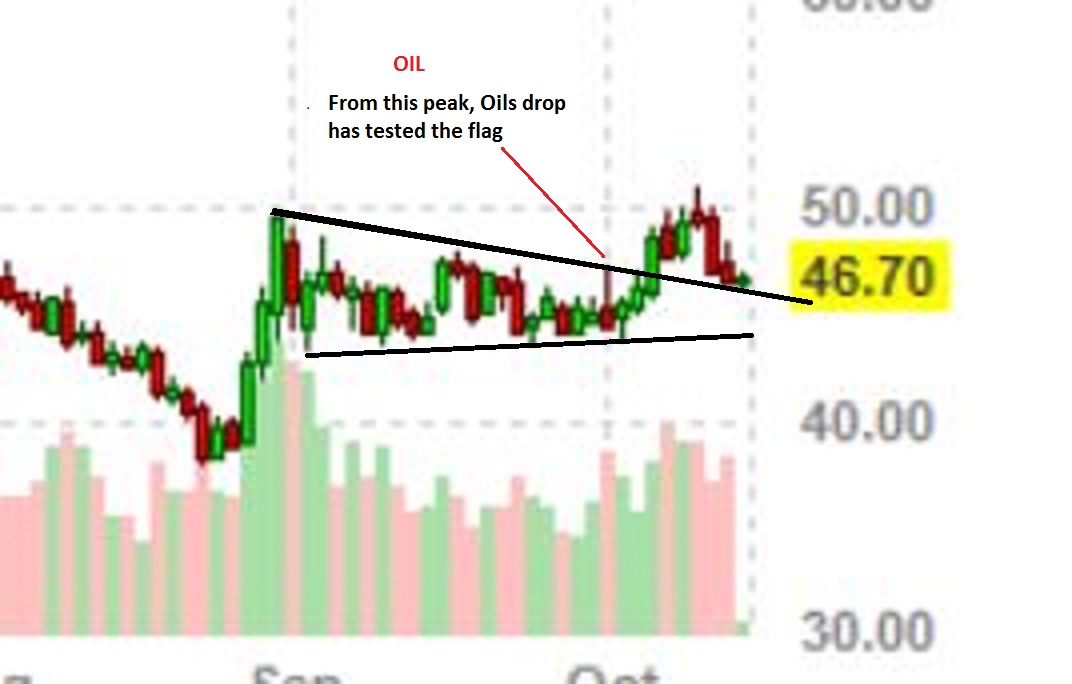
OIL – Playing out as expected. This was Mondays chart.
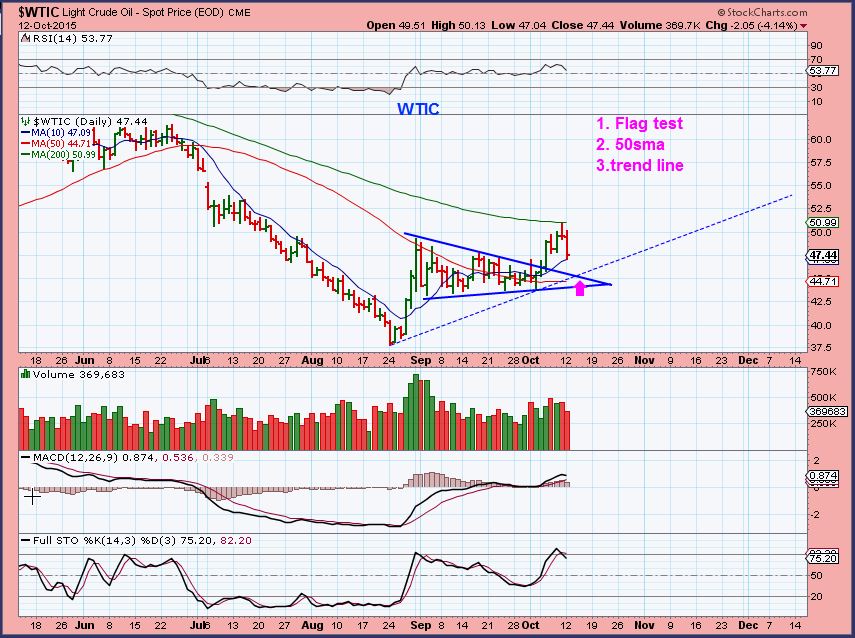
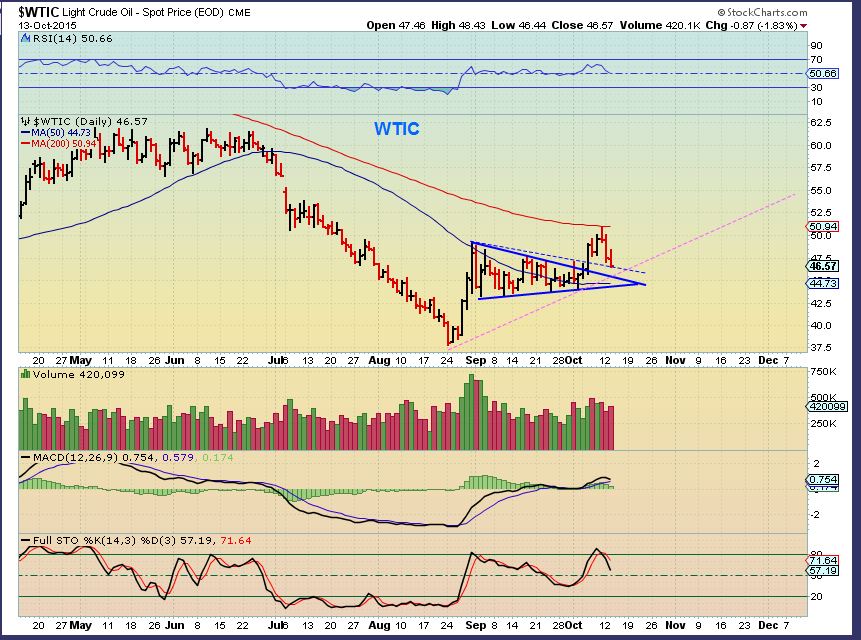
Tuesday – as expected so far. I expect price to drop a bit more, but I’m watching for support to hold in the $45 area.
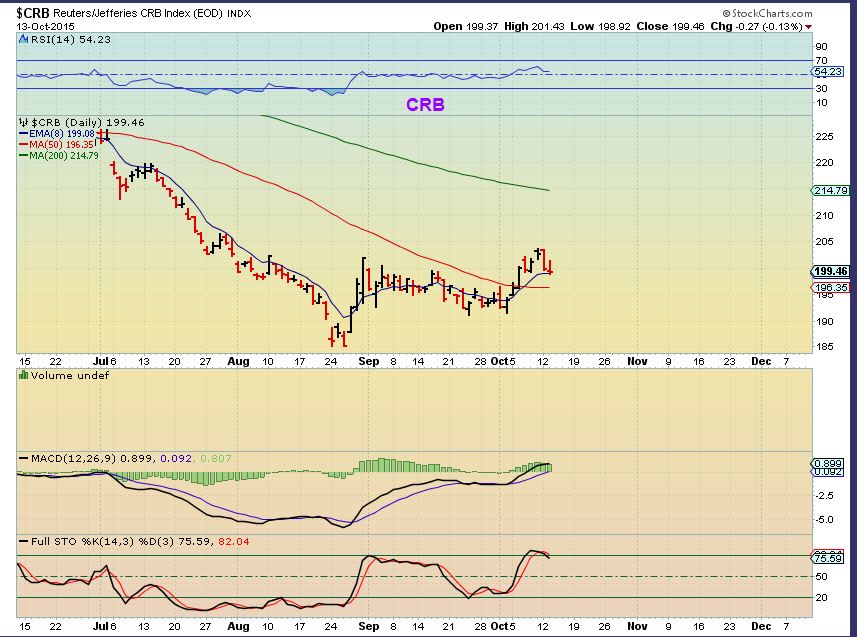
CRB – As expected so far.
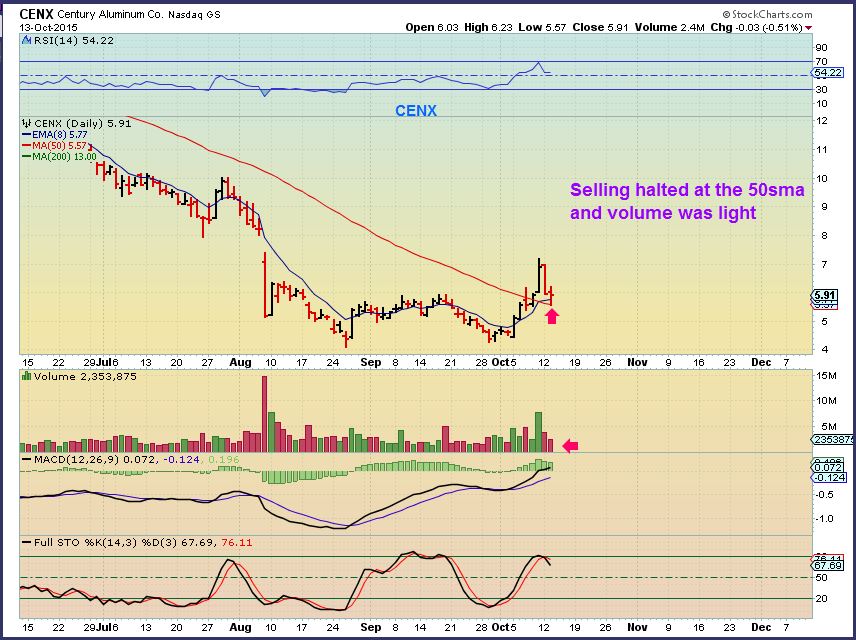
CENX, X, AKS, & FCX pulled back nicely and looked like this so far.
.
GOLD – Mondays chart I expected a tag of the 200sma, and maybe a drop or a sideways pause.
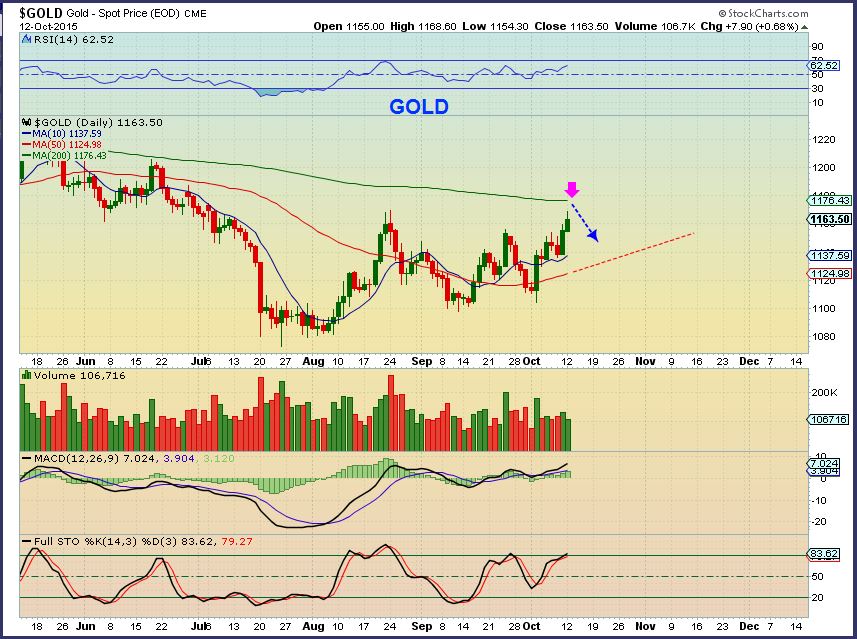
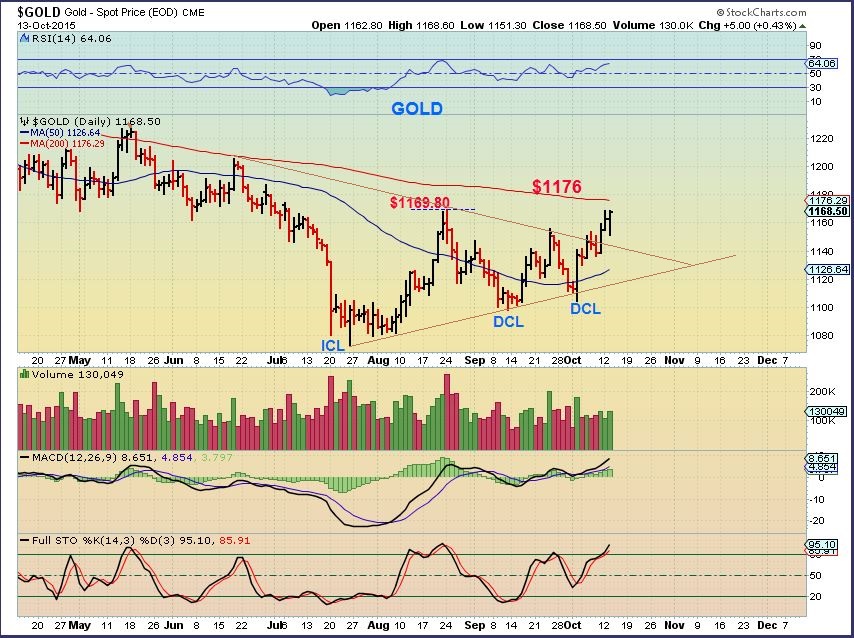
Tuesdays Gold – It is still headed for the $1176 / 200sma. (Edit: Actually it has tagged it overnight).
THIS IS WHERE A LITTLE CHANGE IN THINKING COMES IN, AND IT IS BULLISH.
The Gold Chart above : Recall in a prior report that I mentioned when Gold has been in Triangle formations, Cycle counts can get obscure. Gold is emerging from a triangle consolidation and I am thinking that the strong reversal day on Oct 2 was a ‘Shake out and recovery’. That became a shortened 2nd daily cycle leading to an early DCL. I also use other indicators that were pointing out that that was DCL type action. It happened in Gold on Oct 2 , so lets look at SILVER on Oct 2.
.
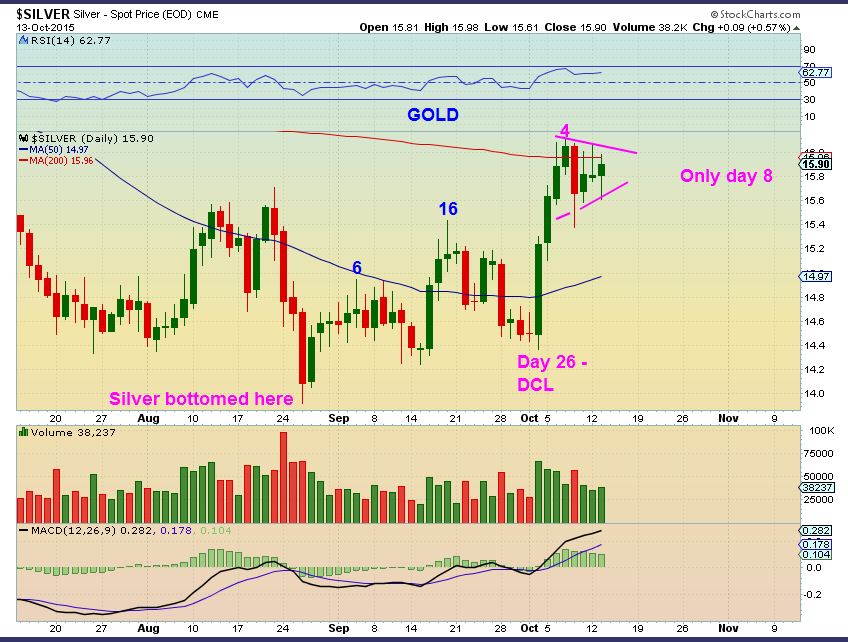
SILVER – Silver had a normal looking daily cycle out of its lows and now would be on day 8, with a bull flag coiling under the 200sma. This cycle looks normal to me.
 .
.
.
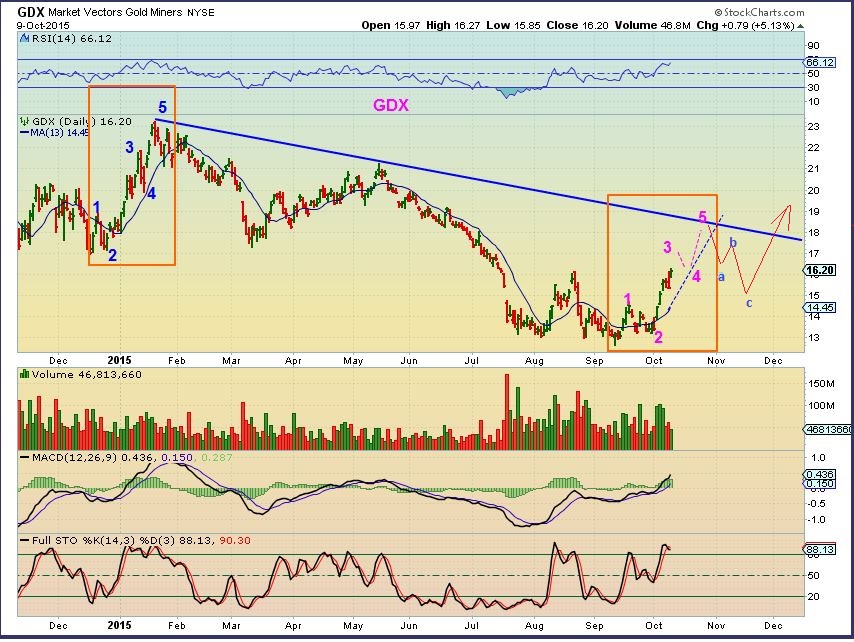
GDX – GDX bottomed 2 days before Silver & Gold on Sept 30 and went straight up – so Miners may have put in a 13 day cycle. This means that Miners were leading the surge higher by 2 days. IF I am wrong on the Miners count, today would actually be day 23 and a drop into a daily cycle low would be due. If I am correct, we could get a 1/2 cycle low (Just a dip to the 9ema or maybe the 13sma) and then another surge higher.
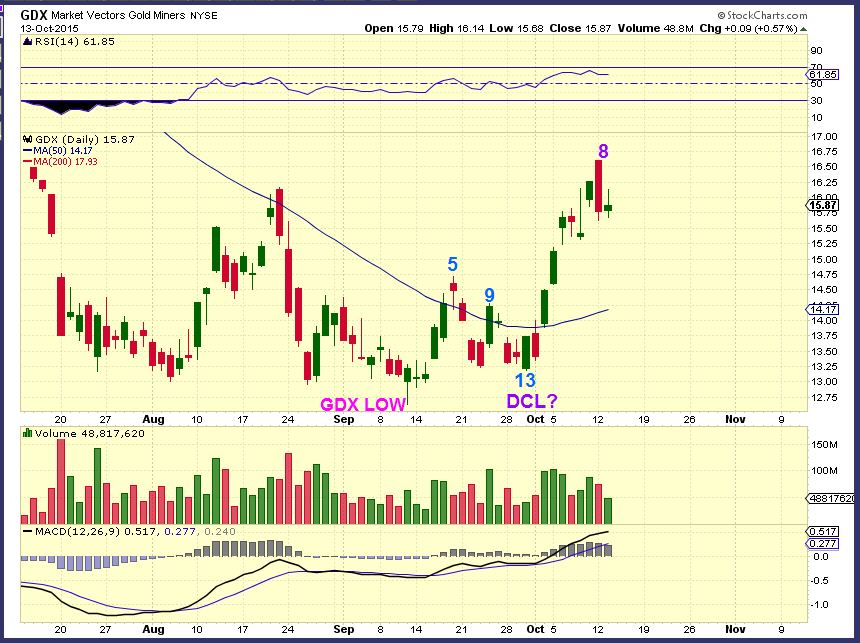
THAT cycle count allows time for a run higher and then a drop, which fits my original 1-2-3-4-5 count shown here.
Its may be very hard to believe this idea of a shortened daily cycle, because it means that a 15 day cycle occurred in Gold. In the past I’ve seen GOLD move in triangle formation, and cycle counts get hazy until we look back in hindsight. Also very short daily cycles have happened in the past. They used to be more common in the bull market 🙂
Mondays Bearish engulfing in GDX kept me from mentioning this Tuesday. A bearish engulfing is a stand out ‘caution’ , so I wanted to see how things played out on Tuesday. I still expected Miners to drop to the 9ema, and they may still do that. THAT would be a buy for a trade, expecting a push higher i.m.o.
I remain patient during pull backs and I do still own some Energy & Miners.
~ALEX
OIL pre-market


ALEX,
great work on the miners and oil. I think you are on to something about gold bullishness. There is something different hence all these attempts to buck people from its rise. The best thing is to keep some skin in the game and be at least invested in it. Some of the juniors have actually moved 100% plus.
I own a few that have gone up and just moved sideways, then upward agin. It is bullish action when they cant sell it down.
See AG, EGO, NG for example.
There will be pullbacks, there always are consolidations and selling, but this can be the start of a trending higher. Higher lows, higher highs.
GDXJ seems to following Gold and Silver. One to watch.
GLD AND GOLD just tagged the 200sma and may pause / go sideways before breaking through. I am hoping that the Miners continue to make a move toward their 200sma , which is still overhead.
Looked properly now. It seems GDXJ is indeed leading GLD. Refresh
Or blast through in complete craziness. I did NOT see that happening. IDK, 1200 still seems like a logical short, if at least for a couple of days, if we get there.
A lots of Calls buying on XOM and CVX.
nice, flags on both charts too, and sideways move to the 10 sma
Timing? Getting overbought, no?
hi frenchie :o)
hope all is well..
this is for your little sweetie …
my daughter loves Twinkle! thank you!!! NGD all the way!!!!
and BAA which finally picked up some steam…. phew….
..this i remember… ;o)
Haven’t been able to get into the miners since I got stopped out. No pullbacks!
coming Bill.
If GDX breaks thru this upper trend line there will be a lot of volume, might sell off right after?
LeChiffre, What are you thinking?
currently looks like an ending diagonal of some degree in GDX/J Bill.
hopefully this is the 5.v wave so we get an nice ABC back to base
SOG. Do you have a chart to post? I don’t follow. I could see GDXJ going to 23.60 without a pullback. That would complete a harmonic pattern right at the 200ma on the daily timescale. I’d love to see what you anticipate.
not sure what degree this diagonal/wedge is.. GDs could just carry on rising until they don’t
(btw ..thats 15min chart, since beginning october)
SOG, I see it. Thanks
that melt-up may have finally popped!
well spoke too soon Bill…that ran for a good while!
is that the end of 5th now?
we’re outside the BBs now… and at the top of a 5th wave channel (may yet throwover) .
but no way am i chasing this.
would be more inclined to daytrade DUST here for a correction
I posted this on TradingView.com makes me sick that I couldn’t stay on the horse.
https://www.tradingview.com/chart/GDX/eIYmQhbR-GDX-target/
https://www.tradingview.com/chart/XAUUSD/CjsS9LEy-XAUUSD/
UGAZ perking up, nice divergence and MACD
ohhh myyy goooodnes.. woohoo..
how come everyone is so quiet today?? busy counting $$$ …?
Hows your box working out?
hmm … still have my box on your mind …
im not trading gdx – but it appears price just slid against my box & went straight up…. from there …
i am in individual miners.. which are doing jussst lovely…
go mux… cde .. ng..etc etc
woop
also in some energy/oils … waiting patiently for oil to pop…
I still see oil going to $42 before poping.
b4 pooping?
BOO!!!
API report was CRAP tonight – +9.3M barrels. We’ll have to see EIA at 1030 tomorrow. Not feeling good about this at all.
Fundamentals for natgas should start turning around shortly. Also remember rig counts down for 6 straight weeks, will be 7 on Friday. This is a lagging indicator.
You have a way with words!
… so I’m told …
Many of the Silver stocks look sweet too, after dipping to the 9ema (As mentioned what to watch for with many Miners)..
AG, EXK, SSRI, AKG, PAAS, GPL, HL
mmmhmmmm ……………. vrooom vrooooom …
not gonna lie though … i do miss/wish i was in the 3xers right now… wow…. such is life.. someday soon… :o) meanwhile .. it’s good discipline for me. (rolling stones are screaming in my ear right now… you can’t always get what u want …:you get what you neeed”
Those 3XETFs rip people apart in sideways and bottoms, then they double on the run higher. Wash – Risnse _ Repeat.
They are tough on the downside, great on the upside.
Oh my!! I wanted to buy the box slide – didn’t see it. Still watching 9 EMA for a hit. Will likely try a trade then, and if it doesn’t happen (drop into DCL) I can stop out with little damage (then watch it reverse without me. Again).
This looks like one of those candy corn treats, no?
… indeed .. give that man a prize ;o)
i luv that little happy guy…
What is that? Candy Corn?
Busy counting what I should have made if I had bought GDX. Boo!!!
Yeah, why so quiet with NUGT up 20%???
Alex do you see an opportunity of a pullback? I have missed this run, annoying after being stopped out a few times.
I dont think that can be known. We are in the middle of a solid bullish run.
The recent pullbacks have only been to the 9 ema or so…more of a sideways move and thats how these runs usually go.
GDX didnt even touch the 9ema, but many stocks did.
If you look at my GDX 1-2-3-4-5 chart in this report and yesterdays , there is the possibility of a 3-4 move in the future, but no guarantees.
Sandy, you, Bill, and I can start a club for people who prepared for months for this trade and then completely missed the whole move. It will be fun! But not profitable.
EGI is getting slapped today. No news out.
Looks like do-or-die for GDXJ.
breakout of the ‘ending diagonal’, or continue for a final 5th wave down
WALMART killed
NFLX seems to have died and been resurrected. Each day will continue to be interesting as heart of earnings season is here. I see SPY/DOW as jumpy/choppy next two weeks, will be stock pickers market but playing indexes will like not get you anywhere in the near term.
Oh, man!! I wish I had chased GDX/J etc. Alex, I should have chased in the beginning! I still can’t figure it out. Why all of the false starts and then now it won’t pullback. I keep trying to rationalize and I just cannot – cannot figure out what/why – I think that will always be a mystery to me. Can’t always explain why an investment gets hot at some time or why it fails when it ‘shouldn’t’. But the reversals on 26 Aug, 7 Sep, 15 Sep, 25 Sep (based on GDX chart in this report, I didn’t go look exact dates up b/c it really just doesn’t matter) – none of them were viable and then Boom! NUGT is up 100%
I just missed with my GLD calls. If I had them expire one week later, I’d be seen in something like the below (refresh); so close…
BAS. 20-day plunge below, hold, and recover. But stoch now bending down, MACD still in ‘ok’ range.