
The Ups And Downs…
The saying , “What goes up must come down” is true within Bull and Bear markets. Lets take a look at what is going up and what is likely to come back down, keeping in mind that the FED MINUTES are to be released later today.
.
I drew this last week to show that I expected the SPX to move up to the purple line
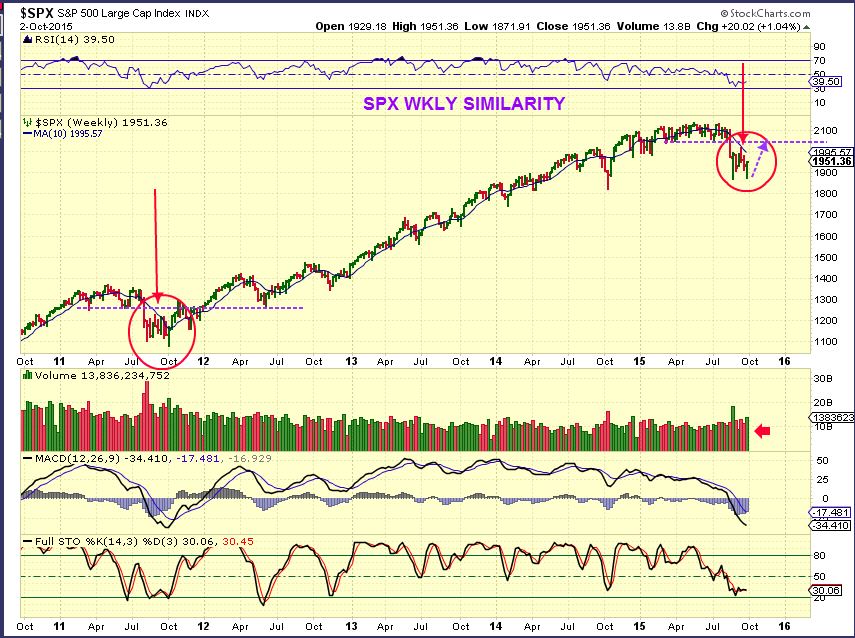
SPX can still move higher to the blue resistance, but…
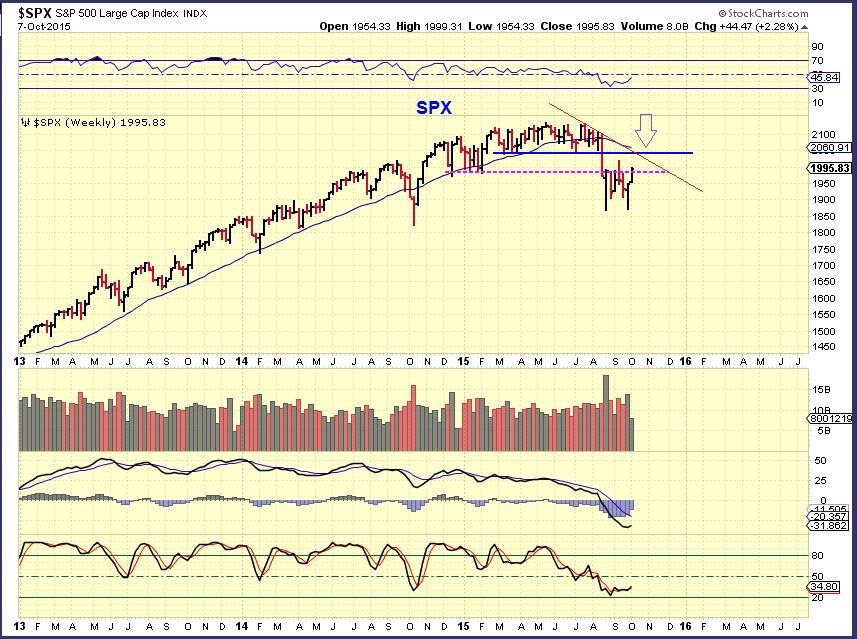
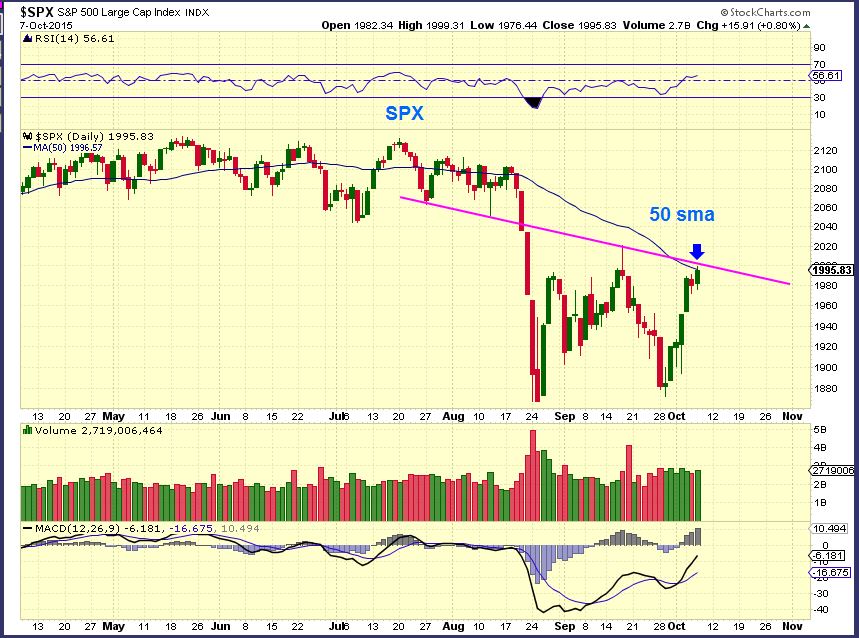
SPX – We are at resistance in various ways. This may stall or stop the move. Also at 2 p.m. the Fed Minutes may push it higher or drop it down.
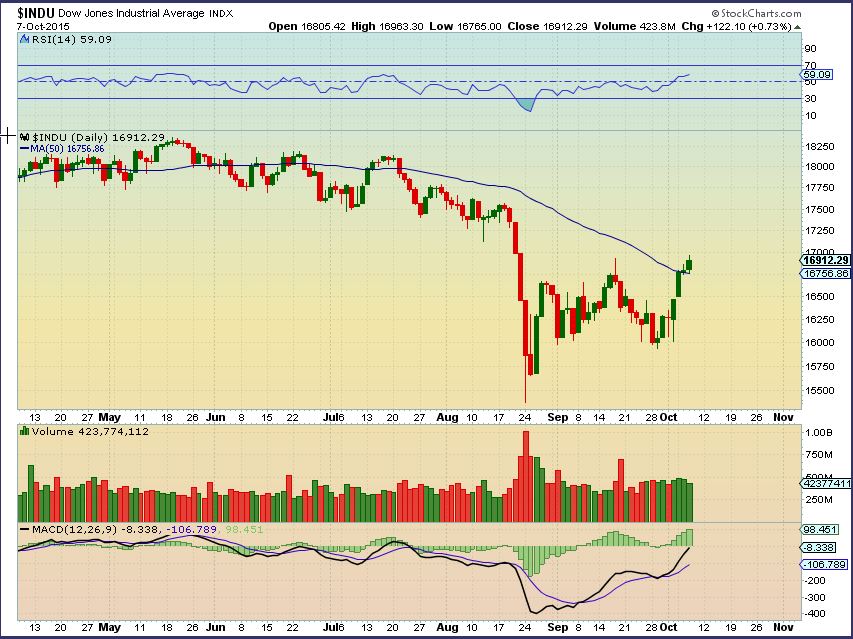
Note: The DOW chart was in a similar position yesterday , and it actually broke higher.
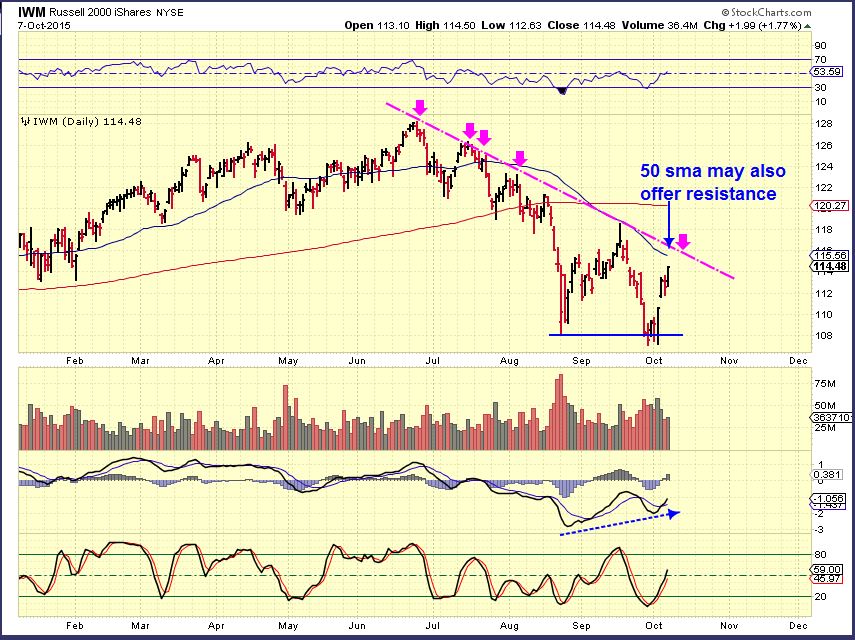
IWM – Resistance is just overhead and the volume weakened a bit, so the Russell 2000 may stall here, but the MACD does look good. I think todays Fed Minutes will be an important time to watch the markets.
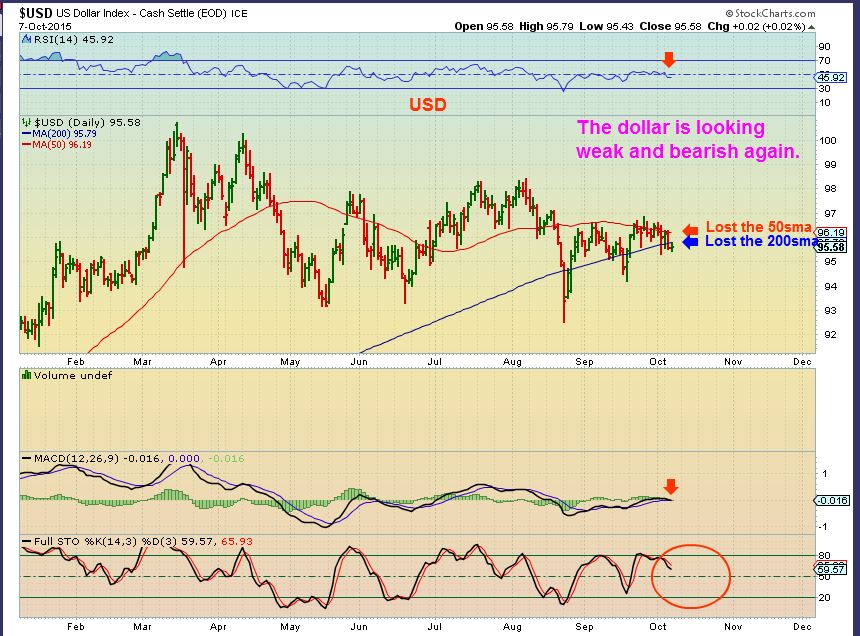
USD – This consolidation has been going on for many months now. Yesterday the dollar lost the 200sma again, and it barley offers support now. Repeatedly breaking below the 200sma shows weakness and the MACD is curling down.
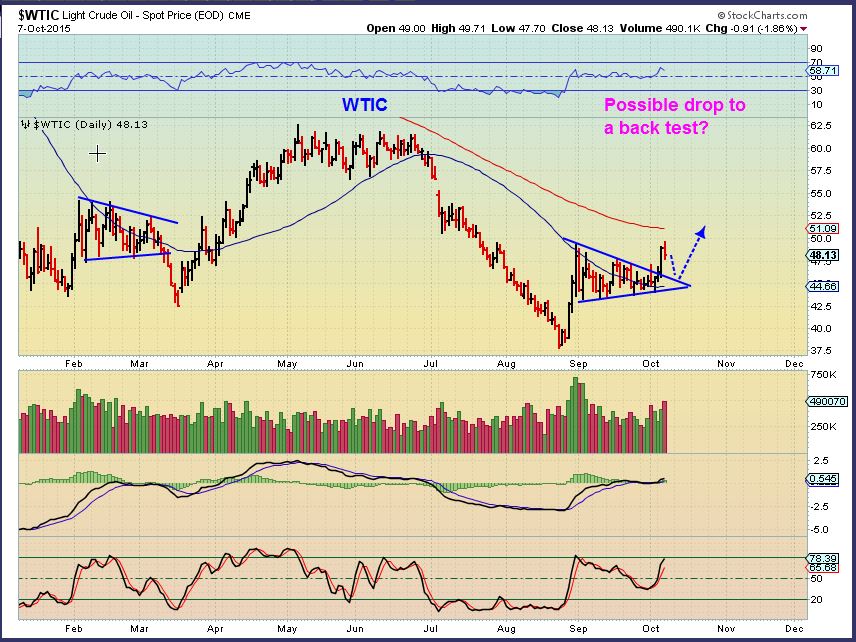
WTIC – Oil dropped yesterday with an inventory report. Oil may be just doing a back test, so I will look to see if the bull flag / 50 sma offers solid support. If it drops that far. I added the left side of the chart just to point out the springtime fail, but I think we put in an ICL in August and expect higher prices this time. I do not expect that type of drop this time.
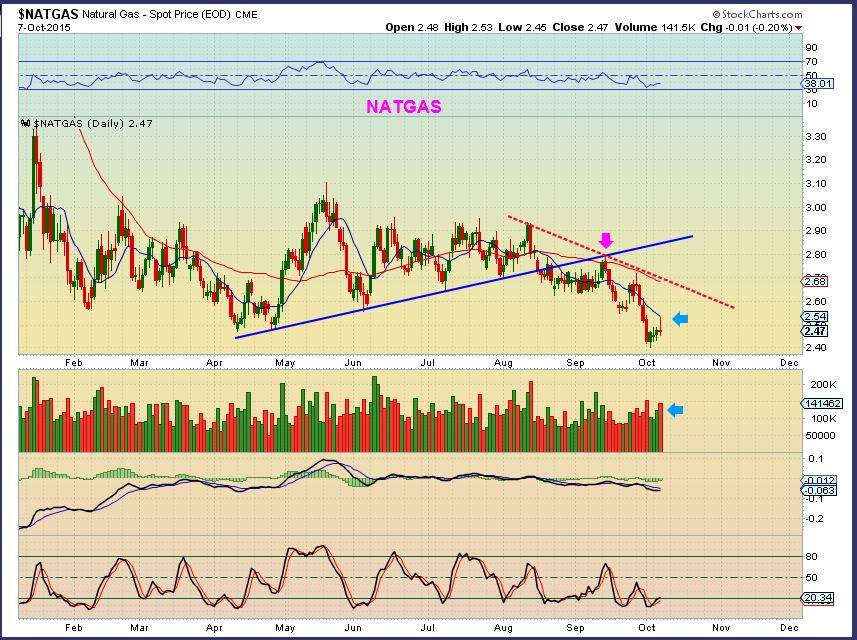
NATGAS – Thursday NATGAS reports come out and often affect the price. SO far you can see the continuing weakness and NATGAS continues to break down.
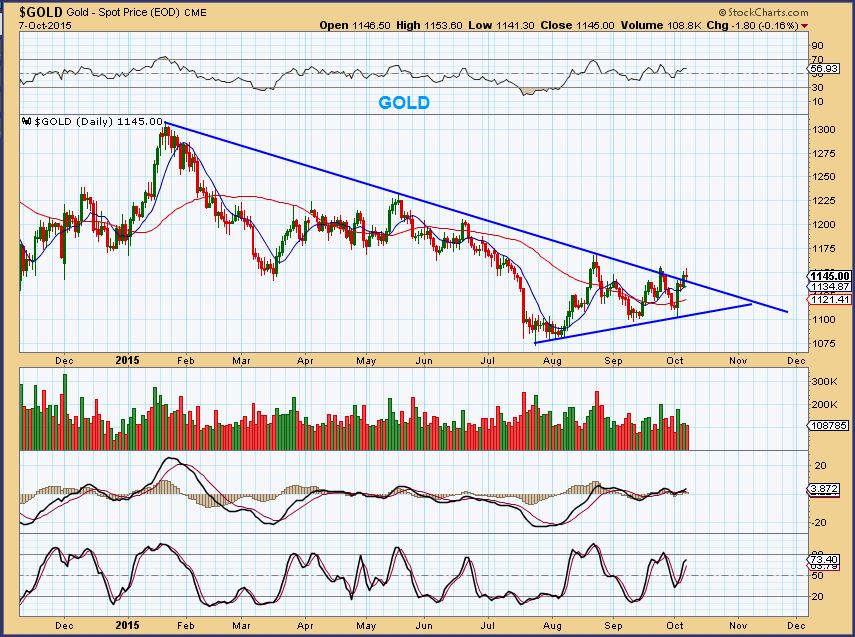
GOLD – Can the Fed Minutes break this resistance line, or will it drop it back down? We want Gold to break recent highs to make this a right translated daily cycle. The Miners and Silver have lead the way.
Before I go on to SILVER & MINERS, I want to point out something about pullbacks. At times when these markets get overdone, they need to pullback and we look for a light pullback to support areas/moving averages, etc as a sign of bullishness. We can also just keep dropping down intra-day and watch it get bought back, giving us a sideways move, We just saw a sideways move like that in Oil, it refuses to sell off . I just wanted to mention this because we are (timing-wise) getting due for a pullback, but it could be a sideways type move too.
.
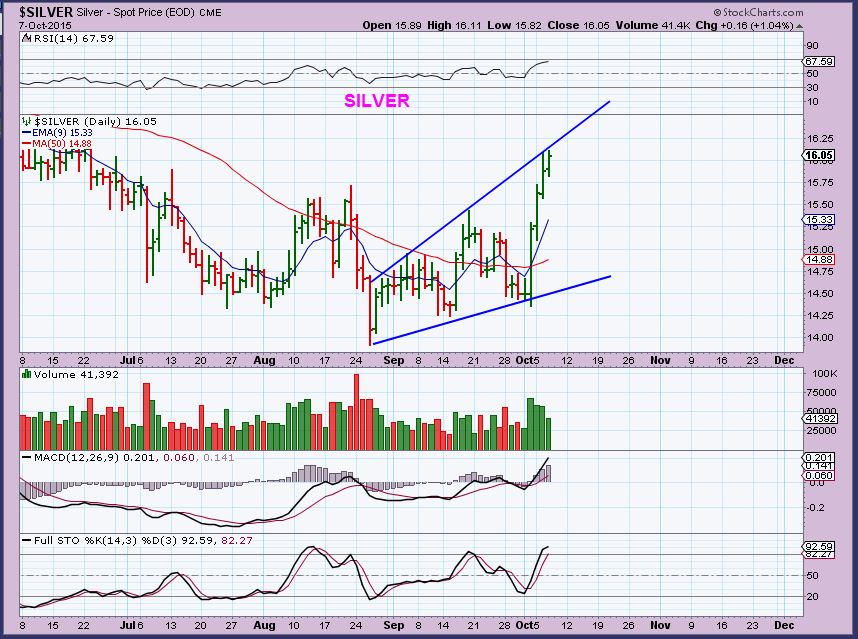
SILVER – Silver is extended and has had a strong push higher. Is this day 28? It would be due to drop down into a daily cycle low if it is. Maybe the 50sma will hold as support if this is to remain bullish. Silver dropping toward the 50sma is normal. If Oct 2 was a dcl, we are early in that daily cycle and we may simply start to go sideways or down a little to the 10 sma.
GDX – This appears to be a topping candle, so we should expect a pullback. Many sell when they see this candle and look to re-enter at important moving averages below. If this is day 18, this will likely be a right translated daily cycle (bullish). We could fall to the 9EMA and bounce ( For a 1-2-3-4-5 type move) .
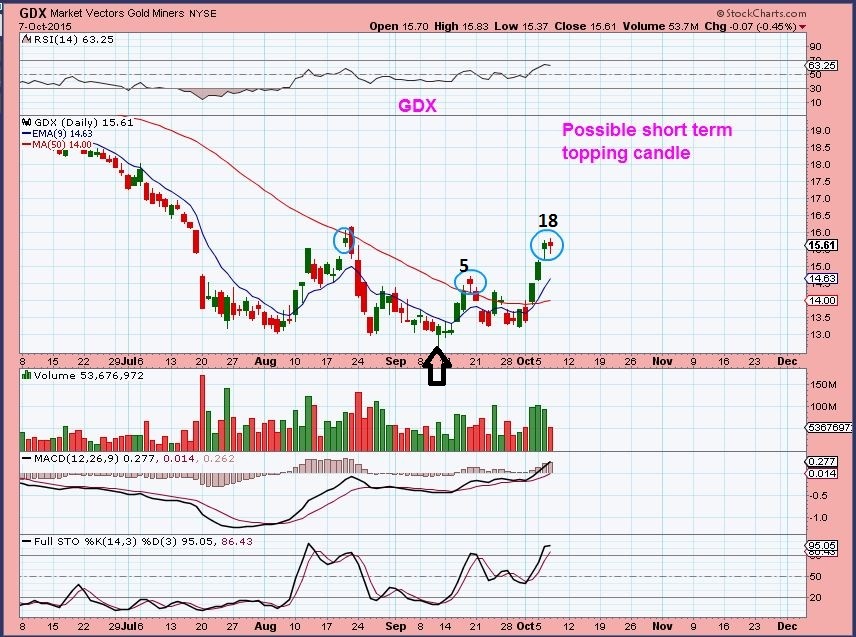
We have been focused on the Bullish Moves in the Oil / Energy and Miners recently. The key is always knowing that what goes up will have a pullback. WHAT TYPE OF PULLBACK is key to future movement. Recently OIL & Mining stocks have been basing, so they have bounced and dropped and bounced and dropped. Look at that chart above of the GDX and you see that that often constructs a base. This can be bullish longer term, and the next pullback could clarify whether these remain Bullish or break down again.
.
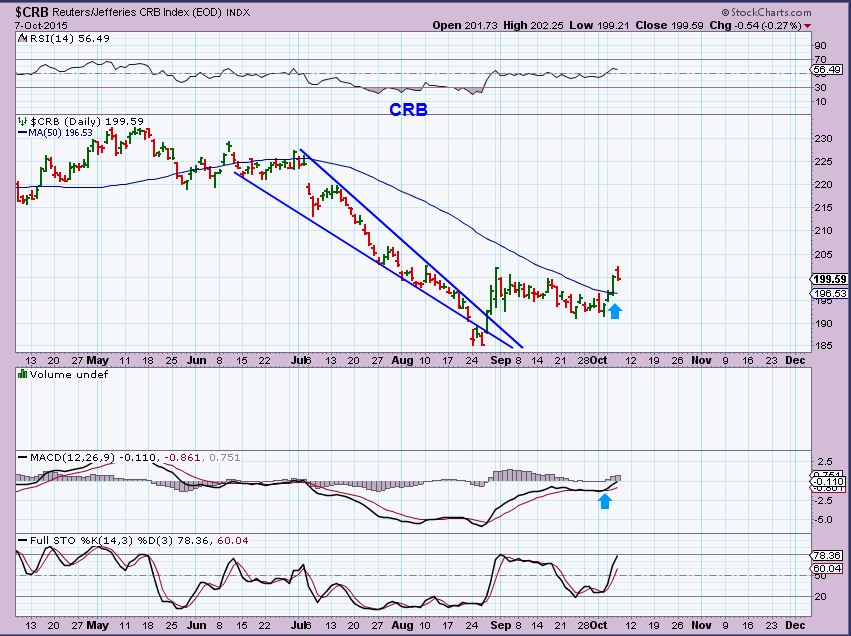
With that in mind,I wanted to go back to the CRB.
CRB– This also has spiked up out of the lows and consolidated those gains in a bullish manner. The CRB may be dropping to the 50sma / consolidation trend line (not shown). I’m watching to see if this is solid support , setting up another run higher.
Look at these encouraging charts-
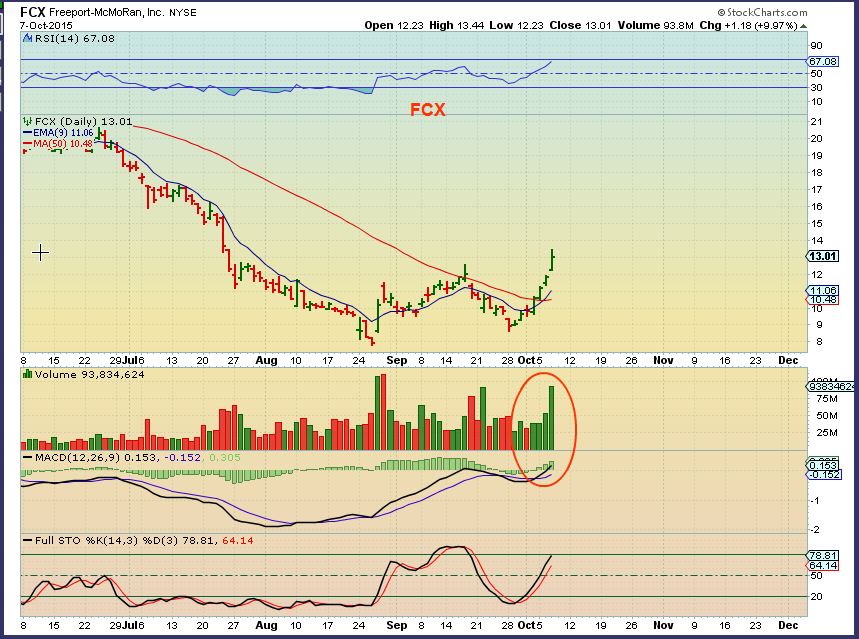
FCX – A higher low formed and then the FCX took off higher. This consolidation since August was bullish, FCX is up over 60% from those Aug lows.
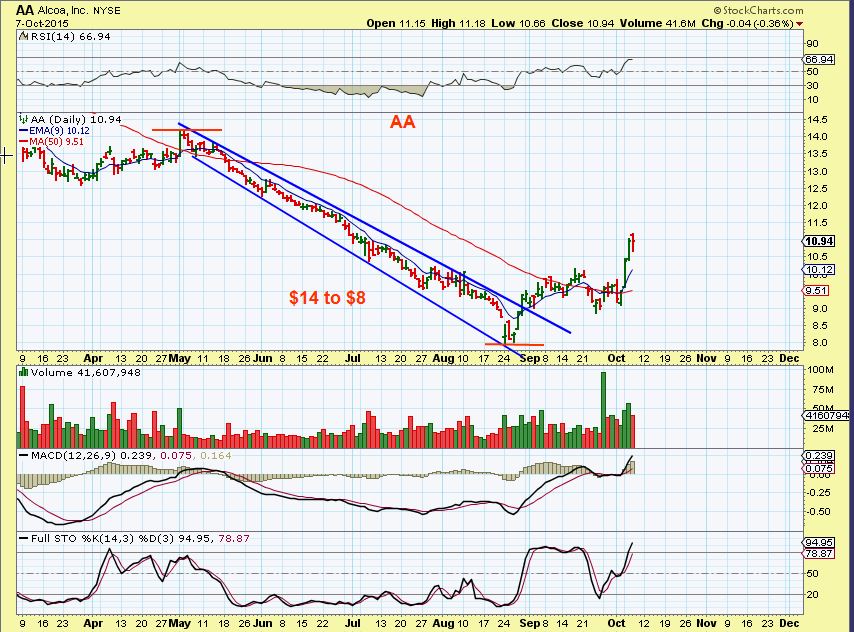
AA – Up 40% from the August lows.
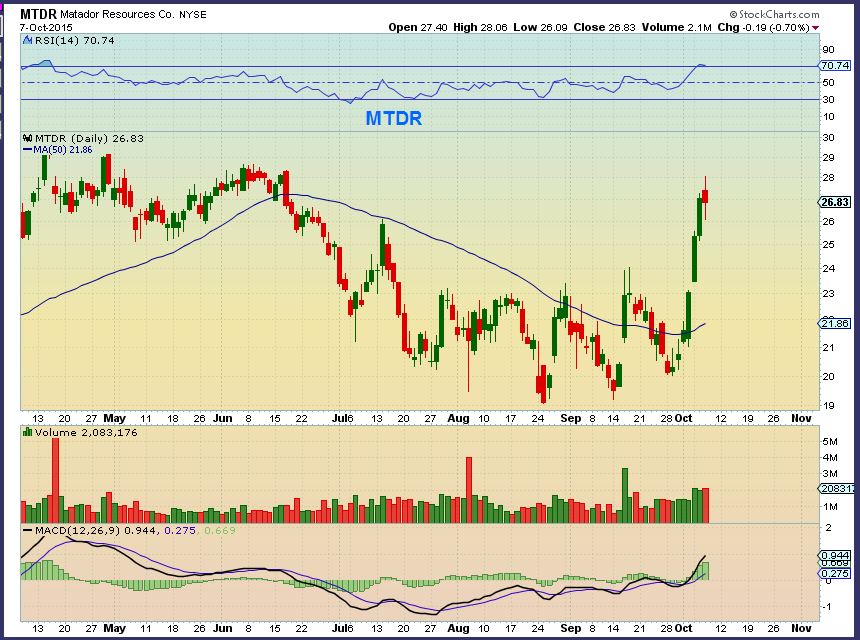
MTDR – With this very constructive base ( That would have shook us out several times, right?) it burst higher with a fast run up over 40% since the Aug lows.
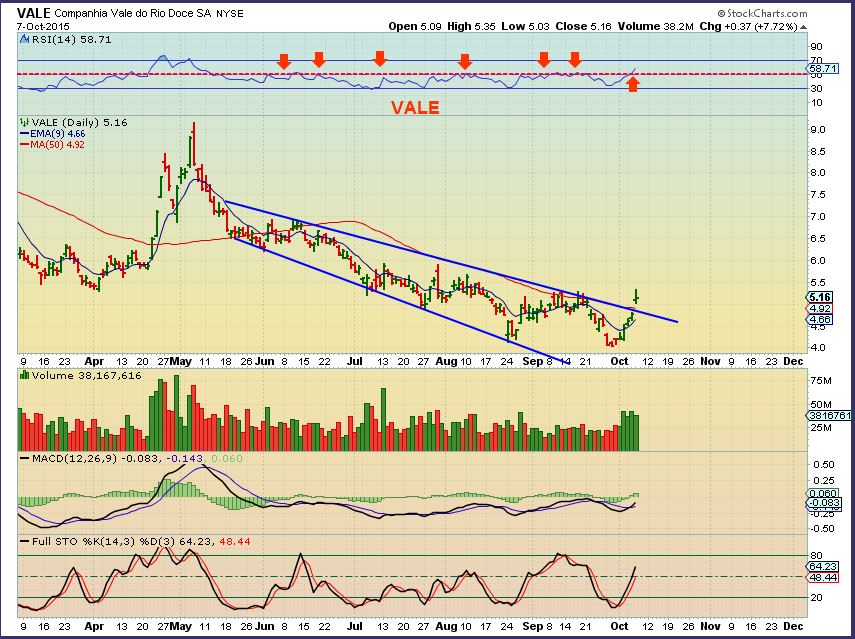
VALE – looks to be breaking out with nice volume.
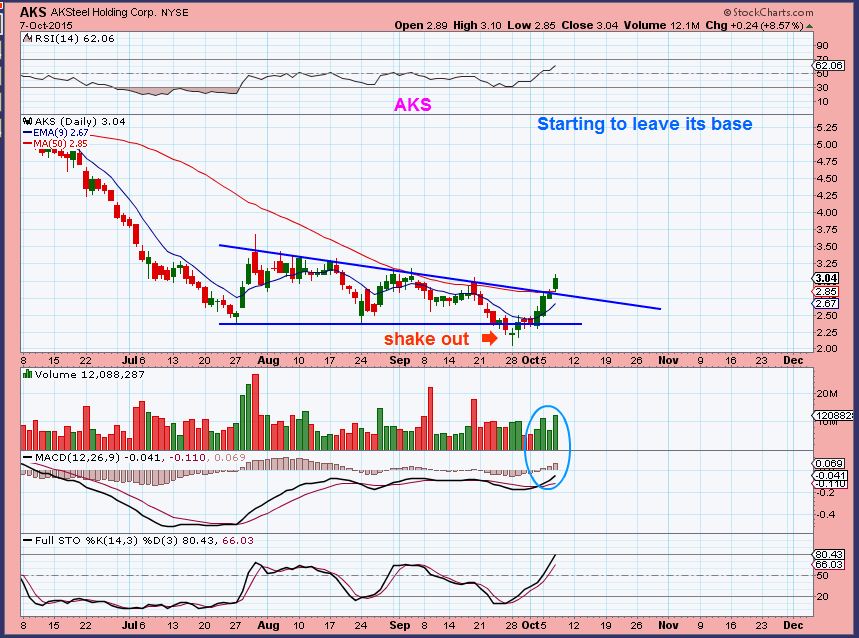
AKS – Also breaking out from a base. Closing above the 50sma, this could be a low risk buy with a stop at the trend line & 50sma ( I give it a little wiggle room – maybe the 10sma)
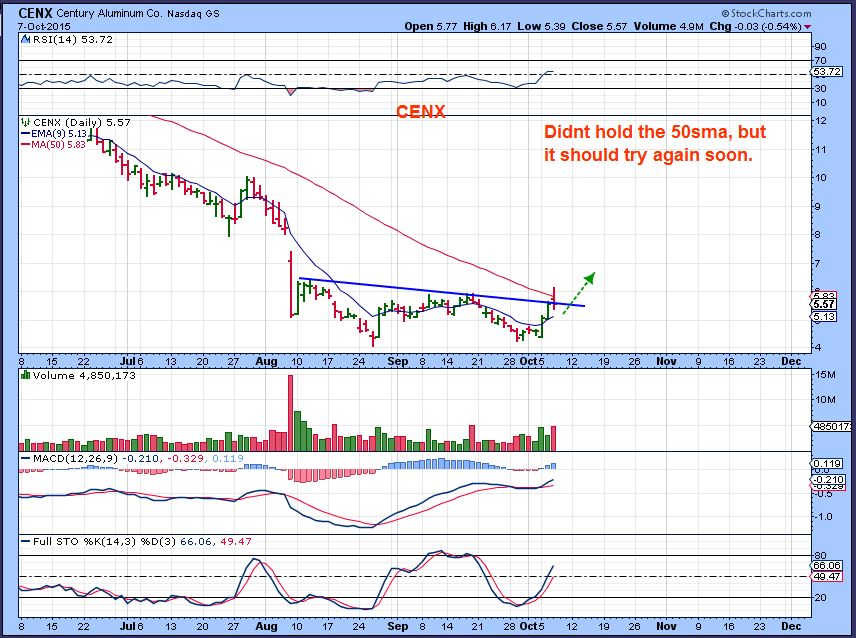
CENX – this looks like a double bottom base and a buy. It reversed and couldn’t break out, but when it closes above the 50sma, it may run like we saw AA (Above ) did.
We’ve seen bullish bases and moves higher in the commodities sector. We expected that here, and I have mentioned that we may even be seeing commodities bottoming for the longer term. The timing is right for that when you take into consideration 3 year cycles, etc. IF these are the final lows, there will be a lot of profitable trades ahead as these sectors run up and pullback, allowing us to buy & hold or enter and exit trades at key points. Until we know for sure, it also may be a bumpy ride, locking in profits should not be viewed as a bad thing, there will always be anther trade for the patient ones. Bottoming often is bumpy.
There will probably not be a Friday report. This report was written as a lengthy report trying to cover all of the possibilities that can happen today and into tomorrow. Friday is the last day of trading before the weekend.You may want to start considering whether you want to lighten up before the weekend? Hold some positions in Miners or Energy stocks just to have some skin in the game? Some may want to just go to cash by Fridays close. It is something to consider since all markets, bullish and bearish go Up and Down.
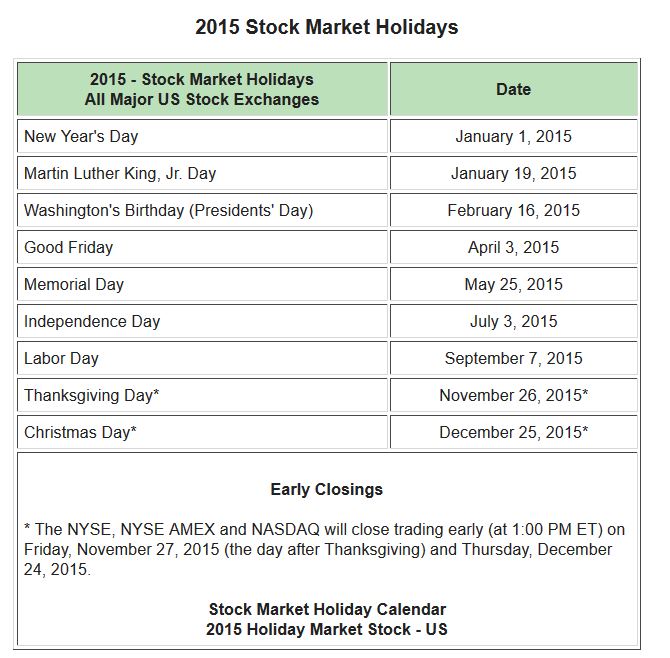
NOTE: Markets are open on the US holiday Monday. Banks are closed.
~ALEX
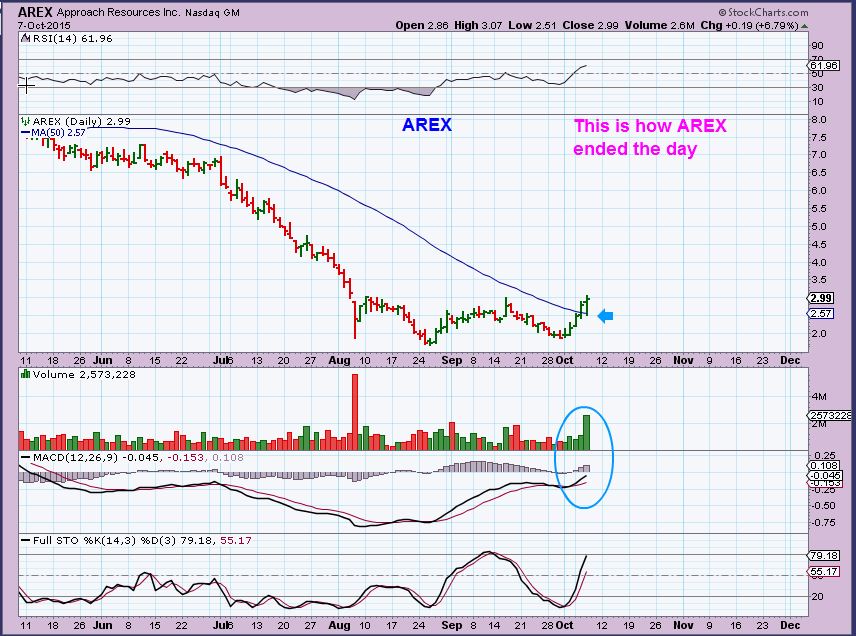
I wanted to show a rather bullish pullback that happened yesterday in AREX. I mentioned above that sometimes we get a pullback intra-day and then buyers push it higher by the close. That is what happened in AREX.
AREX at 11:30 A.M. Eastern time. I would have stopped out below the moving averages. I also thought of adding to my position if we reversed higher from there, because energy stocks have been so explosive . The price stayed down about 9 % all day. I did not add.
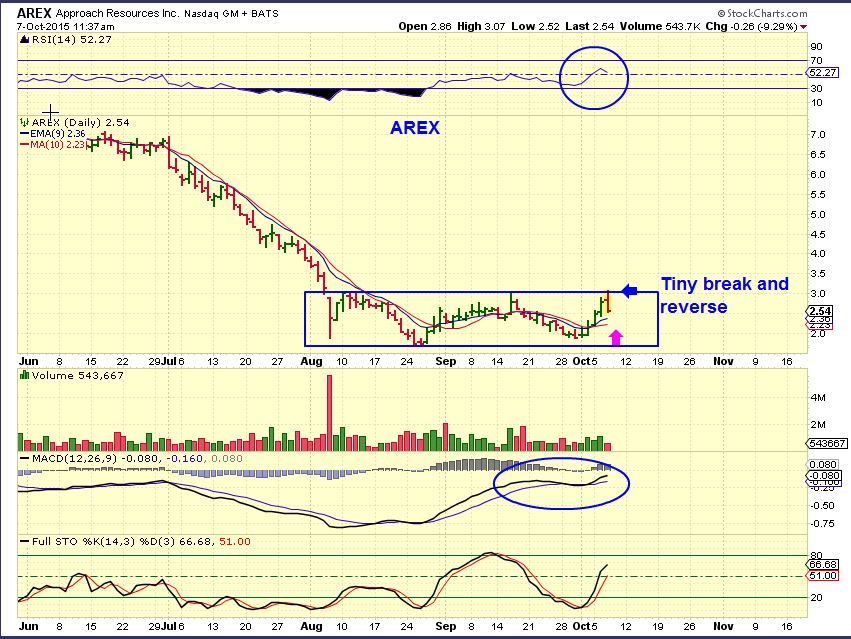
AREX – It’s hard to believe this is how AREX closed. At the end of the day a large buy order came in and also over 1.2 million was added to the total. It held the 50sma and this remains a bullish set up. Picture that happening again today , tomorrow, and next week and you would get that sideways consolidation that I was talking about. It shows buyers accumulating on the dips and causes a sideways move like we saw in Oil.


According to Schwab, Mon is a trading day ( market open) but not a settlement day.
Really? I should have looked that up myself. I went by an email that I received. REFRESH & I WILL CHANGE IT IN THE REPORT
THANKS!!
giggle
u just wanted a lonnnnnnng weekend away from us… teehee
Hey, You probably have the day off, and mkts are open. Your dreams came true.
Anything specifically you can tell me to help me CF? I really want to get some GDP but you know about buying under a falling 200DMA. I’ve been burnt so often.
Its above it on the hourly chart! 😉
I’m using the 9 ema or 10sma refresh- But I am supposed to remind you NEVER EVER EVER…You know the drill 🙂
Many thanks CF
Placed the buy to buy at the open. On verra.
Very informative report as always Alex. Thanks. And enjoy YOUR long weekend. Sounds like you are preparing to take Monday off!! Lol I read the report before the refresh!! Clearly wishful thinking on your part!! Very much in line with your thoughts on oil and if nothing else because I promised Cason, I’ve updated my 1 hour chart following the recent price action. I’m far from convinced about my EW labeling after what looks like the wave (2) or B wave low on 2 Oct so relying more on pure TA. But a few notes on the chart which may be of intrerest to those watching things very closely and trading off the back of the short term moves.
Thanks for sharing Chris
Cheers Bill. Definitely watching this closely amongst other things. I might even have a little upside ‘punt’ myself once I’m convinced that possible next low is in place. Even with the MACD starting to bullishly cross again it would still allow for another short term spike lower possibly to that 38% retracement level or even as low as the 50% level. Not quite convinced this minor correction is complete yet!
Thanks, I like it. And action supportive again today. For now, I add USO on each dip. Rig count tomorrow should drop, which will be supportive of price into the weekend.
I am seeing a possible 5 waves up now at 50.26 with some bearish divergence on my 1 hour chart. This might be just wave 1 of a much larger 5 wave move but either way it may well be vulnerable to some profit taking in the near term. So worth keeping a close eye on.
Thanks, Alex – you always give good and balanced observations
Maybe you should change your name from Chart Freak to Sherlock Holmes !
I have a question about your SPX chart – the 50 MA is labeled as “SMA” – could it be an Exponential MA instead?
Nice catch…Yes it is. : )
thx CF
this still ticks me off.. but .. thanks to EW theory, I now know to expect this movement & I’m not shaken out of a very good wave …
https://www.tradingview.com/x/78yGnRTy/
Thanks for your EW chart on GDX yesterday, Maria. That the 3rd wave popped out of the up channel gives credence to your count – uh oh, did I just have an opinion on EW? Keep up the great work, it helps!
http://tos.mx/hc8u4x
:o) Yessssssssss
Should’nt you be working?
lol.. shouldnt u?
giggle… 😉
You watching CDE or do you own CDE?
dannng…. u writing a book?
own it in my swing act.. but also trade around it
This stuff is getting funny – glad I came back in time to review it.
Hi, great chart – THX : ) Alex is giving us great reviews you’re adding additonal free value to it – you asked me a few days for some EW charts – however i m novel into EWave – it would be a joke compared to your masterpieces
Insert another GIF here!
LOL .. bill … go play your harmonica…
ray… please.. i am not kidding or playing coy when i say i am just a novice.. honestly I just began my studies into EW Theory this past april/may I am truly a novice & have been & would be still spanked hard by “real” Elliotticians.. believe me. I post MOSTLY as a learning exercise for feedback (ie. homework assignment) from those more experienced in market moves – ie. CF can look at his charts & from experience tell me whether my ‘attempt’ at a wave count is ‘feasible’ … or not — in which case i head back to the drawing board to study more….it’s been G R E A T!!
i have not study EW – the charts I draw are just with the little knowledge I pick up here and there – such as from people like you or charts I come across – so again I’m impressed with your work
Yes, TXT BK Throw over, but also when I get this, I draw an additional trendline from the new low back – to see if it is breaking down . The next bounce will let you know. USUALLY, it was a throw over ( Shake out ) and recovers well, but occasionally it cant recover.
REFRESH
ahhhh.. hmmm .. yessss grasshopper… thanku
The daily chart looks like a nice reversal on CDE. Right at the moving averages. If it decides to play catch up with the rest of them, I am jumping on board 🙂
Wait a minute! ISnt CDE already above that upper red trend line?
can i just add CF .. that I particularly love it when you add your experience tidbits on the ‘psychology of the move’ … ie. what is actually happening between the bulls/bears that is reflected in – or underlying price. Yesterday you had one too.. can’t exactly recall but it was regarding maybe TGD? or something — where you pointed out the high volume candle & how bears were not able to push down price any further.. something like that… #GoodStuff ;o)
Buying Energy here (KEG, AREX) starting to turn. Some are moving up already PACD, GURE, EXXI . Wave 2 over?
It could well be Bill. One other twist I had on the ‘back burner’ but didn’t put on my chart below is that what I have labeled as wave 1 (never truly happy with this) is in fact wave 3 and we have just seen a wave 4 bottom out. Where this does fit is that the pullback we have just seen was an exact 50% retracement of the prior wave (possibly a wave 3) which would be a classic retracement. Bottom line is that the MACD is hooking up nicely now and on a buy signal and the ma’s are in a bullish configuration, so continues to look bullish for now. 🙂
yes! on many are already in wave 3 now… yehaw
i should add: also — many are not!! lol .. need to chart chart by chart…
ie. look at CLNE.. yip yip … im expecting a shallow retrace for 4 and then another pop for 5. to complete a larger wave 1… then .. LOOK OUT BELOW for a big ‘2’ down… (if my count is correct) lol
https://www.tradingview.com/x/J8o4DEMq/
Interesting that you have 2 at a higher high than the unmarked low directly before it? Why?
2 was a zigzag .. abc
https://www.tradingview.com/x/yYhn180H/
EXXI surprised me lately. I thought that it would run, but its better than REXX.
wow.. AUY..
hmmm … apparently GDX is steering clear of my box afterall… 3 waves and out??? though we might get a wave 5 down in that triangle (infamous throw-over to shake out everyone) to pierce it ?? like this…?
https://www.tradingview.com/x/GatG4cPQ/
In your minor wave, wouldn’t you expect 1 to be lower than 5?
My guess is we are starting a new wave 1. Refresh
well yes since waves are fractal in nature… 1 of 3 ….
I think there is an EW rule of alternation – wave 4 could be a sideways consolidation since wave 2 was not. I just told you more than I know about that rule
LOL.. ha ha ha
yes… it is a ‘guide’ not a definitive rule..
GO MAN GOOO…
I’m not convinced that larger wave 4 is complete yet. On my hourly chart the MACD is on a short term sell signal and still correcting from overbought levels. Doesn’t mean GDX has to drop but odds would favour it. A test nearer 15.20 would look better to me and JUST possibly nearer 15.0 before the next leg higher.
14.50 would be nice.. to fill that bloody gap…
just get it out of the way!
That would be an almost exact 50% retracement of the possible minor wave 3 so that would be a neat fit as well. 🙂
hmm.. so you like my box.. idea?
even if C doesnt.. i like it 🙂
Trust me SOG I LOVE the idea of Maria’s box!! 😉 Hahahaha
give M a ‘like’ too then.. show her you care
It’s done. 🙂 Lol
sweet as
yeah.. he probably fell off while trying to do a wheelie (like i can) and fell off…
that …or he’s pretending to cut wood again…
I’m pretending to help my parents with fall yard work before the Fed. 🙂
L O L …. daddy’s gonna come on here and yell at us for being naughty while he was away … ha ha ha
You could be right. He’s ominously quiet at the moment! Out for a bike ride maybe!!? 😉
RUT ROE … daddys home .. QUICK..run&hide
Being serious…but just for a moment!!…although my current labeling is very similar to yours, it appears that you have labeled the current wave 3 as the same degree waves as your large 1 and 2. I have it as one degree lower and hence the wave 4 we are talking about, if correct, will then see a wave 5 to follow and those five subwaves will make the larger wave 3 (or the dreaded wave C!). Does that make sense!?
sorrry..my eyes are watering from laughing so hard and I cannot see…
lol
i will have to look later chris… im sorry.. playtime is OVER for me.. :-/ boo hooo
No problem. Let me know later and I’ll post my own chart if need be to try and show you what I mean. I need to go and cook some tea for myself now as well. Don’t work too hard!! 😉
yes..please do
At your command! Lol 🙂
OMG
MAybe it’ll get the Fed Minutes slam into the box?
ahh.. perhaps.. my box is like a magnet…
Rejected again… GDX moving straight up after the FED MINUTES
silver isnt buying it.. is this not a false breakout, for reversal?
Possible head fake or…
Because Silver did lead the way ( And really is a bit extended) it could just be that Silver is due for a rest or sideways move. GOLD needs to break out here. ( See the GOLD & SILVER daily charts in the report).
Possibly Gold now follows what Silver had already done.
i never trust these moves made on the basis of Fed-speak
That alone …No, me either. But look at all of the set ups in Miners and Energy and CRB, etc & there is a good deal of evidence that these sectors are getting some loving at this time.
To your point, GDX on a daily chart looks like a 1-2-3 Move right now from Sept 11 lows. A pullback will give it 4, and a move to 5 is either a double top or a higher high. Could it be an A-B-C instead of 1-2-3-4-5? I dont know. Many stocks look really nice however.
just look at DUST tho’… capitulation volume?… MACD now giving nice diverge on hourly
For the 1-2-3-4-5 in GDX that I mentioned above…Look at Dust on the end of April (vol) and then again in mid May.
It looked like that would be the 3 & 5 on GDX.
It wouldnt hurt to sell here and see if we get the 3-4 pullback and re-enter for a final wave 5 higher. Esp if someone was in leverage.
Dust would bounce like in April, and drop to a final low as it did in May.
yeah, im not suggesting PMs are gonna collapse.. just that a deeper ABC is at hand now
Maria’s BOX!!
GDX went up past consolidation, now coming back into the flag, is that your throw over? Headed lower. That gap is still out there waiting to get filled.
I won’t buy it unless in the box!
Think around 33 would be the next profit taking area for TWTR Alex? TIA.
Yes, I expect $33 to get hit. It looks like a good set up as long as the markets dont get whacked. I get price target roughly a bit higher , these are measured moves and can extend too. (refresh).
Not sure how big of a position, but I would use a trailing stop if you keep any of it.
I only got a half position filled -my bad 🙁 I was hoping to take a full position but..hmm..Anyway so far so good..
It really was a nice set up.
If I owned it, I’d like to say that I would sell a little at $33, but then I might use a trailing stop, and watch that open gap up near $34 from July 29. That could get filled.
Just dont give it back 🙂 Thats the goal.
wow… go oil…
$54 or bust! Think of we just barely get back to $62 we had this summer, superimpose that over charts above. Boom!
GDX H&S pattern still in play. Should be moving higher shortly
CBAK has been on a tear (Among others)
is that part of that 3some trade…?
The battery Pack? FCEL, CBAK, BLDP, PLUG – I have it as a 4pack 🙂
nice.. but no the other 3 that run 2gether..ren?
Oh, that was RENN, MOBI, DANG
Only specualtion at this time but that looks like a thrust out of a minor wave 4 traingle on GDX which would mean we are in the process of putting in that wave 5 of a larger degree wave 3. That wouuld mean another correction for a larger wave 4 may be quite close. Not necessairly today or tomorrow but quite soon. Just something to bear in mind for all you traders out there. Trailing stops maybe?
Hi Chris….. is it a lot of work to put this in a chart?
Hi Geurt. Its a 20m delayed price feed so won’t be up to the minute but you should hopefully see what a few of us have been discussing. It is possible the minor wave v (of larger wave 3) is complete with that spike but not necessarily and there could be a bit more work to do on the upside first. However, once complete we were discussing a less bullish scenario where it only completes a larger ABC correction pattern within an ongoing bear market. That is not my favoured interpretation though. I anticipate this will actually complete a larger wave 3 and then after a larger wave 4 correction in the coming days, I would be expecting (hoping!) for a larger wave 5, potentially to the 17/18 area later in October, to complete the first leg up in a new major bull market. So the next couple of weeks should be a ‘big tell’. I hope!! Hope that makes sense?
Gday Chris, great info you’re giving.- is it possible to have this in a daily chart with EW counting with and if possible time frame? so only the major counting and not the minor waves ? thanx in advance
Hi Ray. That sounds like an Australian hello!? If so, what a coincidence as I will have a cousin visiting from Australia next week. I live the other side of the world! I’m delighted if anyone finds my TA efforts useful but I’m certainly no expert, least of all in EW. I know a few basics but from a long time ago! I can definitely have a stab at putting a much bigger count together on a daily chart. It will take me a bit of time but will get it back here as soon as I can. All I will say is that I know without doing it it will have some fantastic longer term bullish potential, not least if we are making the first move now from major bear market lows. That would be a dream come true!! I’ll get it back here asap.
Chris, no, I’m not from Australia, actually I’m only a few hours away from you – Belgium
had a few OZie friends, and that’s how I got their slang
hope that’s not disapointing : ) Greetz
LOL. No not at all Ray. Bad guess on my part but you have picked up the accent!! Lol Almost there with the chart!
Chart now posted above so hopefully you can see it OK?
OK Ray. No promises about how accurate this proves to be but here is my best guess at the bigger wave patterns. Hope you enjoy it. As I think you might appreciate this is what makes the current situation that is unfolding potentially so important and whether it develops into a proper 5 wave impulse wave off those Sep lows. If it does it would be a strong indication we have just seen the first minor bull subwave up in the huge final MAJOR wave 5. From a long term investing point of view the ideal place to try and laod up would be at the wave 2 correction lows that would follow that first wave up. But that would be weeks if not mnoths away yet. So patience still required for that bigger picture ‘sweet spot’. 🙂
THANX A LOT
LOOKS INDEED IMPRESSIVE – ALMOST HARD TO BELIEVE
If you want a fundamental reason I’m a great believer that the current ‘fiat’ money sytstem is on borrowed time and we are facing some form of global monetary reset. So at some point there will be a general loss of faith and confidence in ‘paper’ money and a potential rush to gold/silver and quite possibly hard assets in general. If that were to even remotely happen, the amount of physical bullion on this planet and the total market caps of ALL PM mining stocks would not even remotely be enough to satisfy even a modest amount of attention by global investors. Therefore, VERY limited supply and increasing demand could potentially result in dramatically higher prices and hence your multi-year ‘blow off’ wave 5 to all time new highs. Just a possibility and ultimately we are in very deep and unchartered waters, so ultimately time will tell. But for me it is at least a rational explanation as to why the ‘hard to believe’ could actually happen. Just think something like ‘dot.com’ bubble but in PM mining stocks!!
I also like to consider the paper vs. physical issue. If future contract owners took actual delivery, very small numbers could wipe out COMEX. The paper market greatly dwarfs the physical, a small wrinkle could have a big outcome.
I’m totally with you on that one Cason. Even if we get the ‘big picture’ correct there are going to be many twists and truns along the way and most definitely unintended consequences. The paper derivatives makret is almsot certainly a ‘ticking time bomb’ and goodness knows what happens when that goes off!! One possibbility is that you have what in thoery is a winnning trade but it still blows up in your face. I have no doubt this will not be easy going forward!!
Agree agree agree!
Sweet spot…. wait, r talking about my… lol
Thta’s good to hear! 🙂 Naughty!!! Lol 😉 😉
Chris.. did you see that urban dictionary post? lol
I did!!! Hahahaha. Unbelievably accurate from what I have seen. You MUST have written that yourself!! Lol 😉
So, as I follow this, if we are in v of 3 then we have 1 more buy in a few days which will then top out in 5 with Intermediate 2 leading us through DCL and into next ICL.
English- quick buy next week, sell top. Stay away (long) until next low. Back up truck. Drive off with the gold!
Lol. That’s the broad plan Cason..or at least the one I’m working to! For various reasons ..IF…the current bull leg does develop into a full 5 waves from the 11 Sep lows that will potentially be the first minor impulse wave of what could be that prospective MAJOR wave 5 and mutli-year bear market. I would stress when I say ‘minor’ it would just be the first very small step of much, much larger five wave sequences, which should eventually evolve into a huge multi year MAJOR 5 wave sequence of a much, much larger degree. These are known as fractals. But in the here and now, there are various reasons why I would expect/hope for that first 5 wave sequence to fully develop over the next couple of weeks. That would make the next larger wave 1 (the next fractal). This would then create an intermediate top and I would expect a multi-week correction to unfold to form wave 2…the ‘sweet spot’ for potentially long term investment. It doesn’t have to but wave 2’s are permitted to retrace up to 100% of wave 1, so it;s not impossible for the correction that follows in wave 2 could return virtually all the way to the Sep 8th lows. I’m not saying it will but under EW rules it is allowed to. From there a far more dynamic wave 3 should unfold to the upside then the next larger wave 4 correction and finally another wave 5 to create the next even larger wave 1 up (the next larger fractal). And so it goes on until we complete the 5 really large waves up to complete the multi-year MAJOR wave 5. That probably sounds all very confusing but it should make sense as it all gradually unfolds in the weeks, months and years ahead. IF…IF…of course it does. At the moment this is still speculation as to what MIGHT happen. We need price action to prove it!
Right. Minor 1 of Intermediate of Primary (or Major) 5. Perhaps.
Something along those lines. Judging the degree of waves in real time is always tricky and impulse waves can extend so what looks like for instance a completed wave 3 actually morps into another five wave move all of it’s own. But hopefully if we can ‘nail’ this first wave correctly we will have another important layer of confirmation we have a major bear low in place in which case the main long term direction should be up and dips should be bought. BUT not there yet, so the next few weeks or so are VERY important for that bigger picture. But you are definitely thinking along the right lines. At least according to what I believe!
Now thats a story with a happy ending!
I am actually leaning this way too…Bear Market just about done, if not already done. Woo Hoo
..and who doesn’t like a happy ending. …. 😉
How do we solve a problem like maria?????
So far, we haven’t figured that one out yet…
🙂
😀
I just happened to see this..lol lol
http://www.urbandictionary.com/define.php?term=Maria
I swear i didnt write that..ha! Pretty much nails me… (wink)
http://www.urbandictionary.com/define.php?term=Robert
Wow.. u wrote that fast! Although. ..
I did see 2 words that i agreed with in the “words” section…
https://www.youtube.com/watch?v=VoOG7LEyUJ0
Tee Hee.. 🙂
did you post all those enties at UD?
LOL .. I gotta say .. it’s pretty dead on… ;o) ha!!
It would be a VERY happy ending..at least in some ways…and hopefully help fund my ‘retirement pot’!! IF..it does happen though, the bad news on the other side might be WHY!! Some of my thinking involves HUGE amounts of pain in other areas and what the longer term consequencs of that could be can make for pretty worrying specualtion to say the least. I have an ever growing belief that we are heading towards events that will be remembered for generations…and not just in financial markets!!
Chris… I got it. Thank-you very, very much !!!!
GNE – Boom!
So many good moves SGY, ECA, OAS, EXXI, QEP, etc etc
So many good set ups , even now. AREX, KEG, BAS , ANW, – Look at those with the 50sma and 10sma.on a 3 month chart.
TPLM right up against its dTL… ready to break out?
Creeping right along a little each day.
It could POP above it and then it would probably run to the 50sma.
I should add that I’ve been sitting in AREX for 3 days and its just crawling higher too . Every day it looks ready to just go, but it’s stalling. I hate that when I see other nice set ups running, but I also know that as soon as I sell it, it’ll POP : )
I bought some this morning. Feel free to sell! 😉
hey tell me bout it LoL.
least ive stopped buying tops now.
next evolution for me is to stop selling bottoms
I stopped buying tops when I swore off miners. But I’m still awesome at selling bottoms. Trying to trademark that one.
When you want to buy- go short. When you want to sell, buy 🙂
I am way bullish energy right now. Alex, had my limit but on BAS just above 9EMA, missed adding by 5 cents (darn!), would have been a great add on the intraday reversal.
Had trouble deciding on others so am in ERX currently, smaller position.
Does anyone know what happened to SVLC. It was a Silver miner that I liked. Was it bought out?
First Majestic (AG) bought them out. I think in late July.
WOW – 2 good companies right there! Thanks. I will ride that a core position in AG when we re enter the Bull run.
I like that GST set up too.
Bought it with a tight stop Well, below the 9 EMA somewhere
Alex, if GDX/J pull back to 9 EMA in next few days, still safe to buy or too close to settling down into next DCL? Guess we can always re-assess on Mon.
Your thoughts on AREX – I always have that issue, do I stop out or double down at support! As long as oil gets it going should be ok for a few as long as charts don’t change.
TOUGH ONE.
I think cycle-wise it is too late to trust it , but E.W. – it could be that we tag the 9EMA as a drop to 4, then one more bounce to ‘5’ and THEN a corrective a-b-c to the 50sma for a drop the dcl .