Tuesday March 24th – Will This Be A Strong Bounce?
I doubt that this will be a strong bounce, so let’s go to the charts and discuss that bounce.
.
THOUGHTS FROM THE WEEKEND REPORT: Expecting a dcl / bounce, but not to new highs.
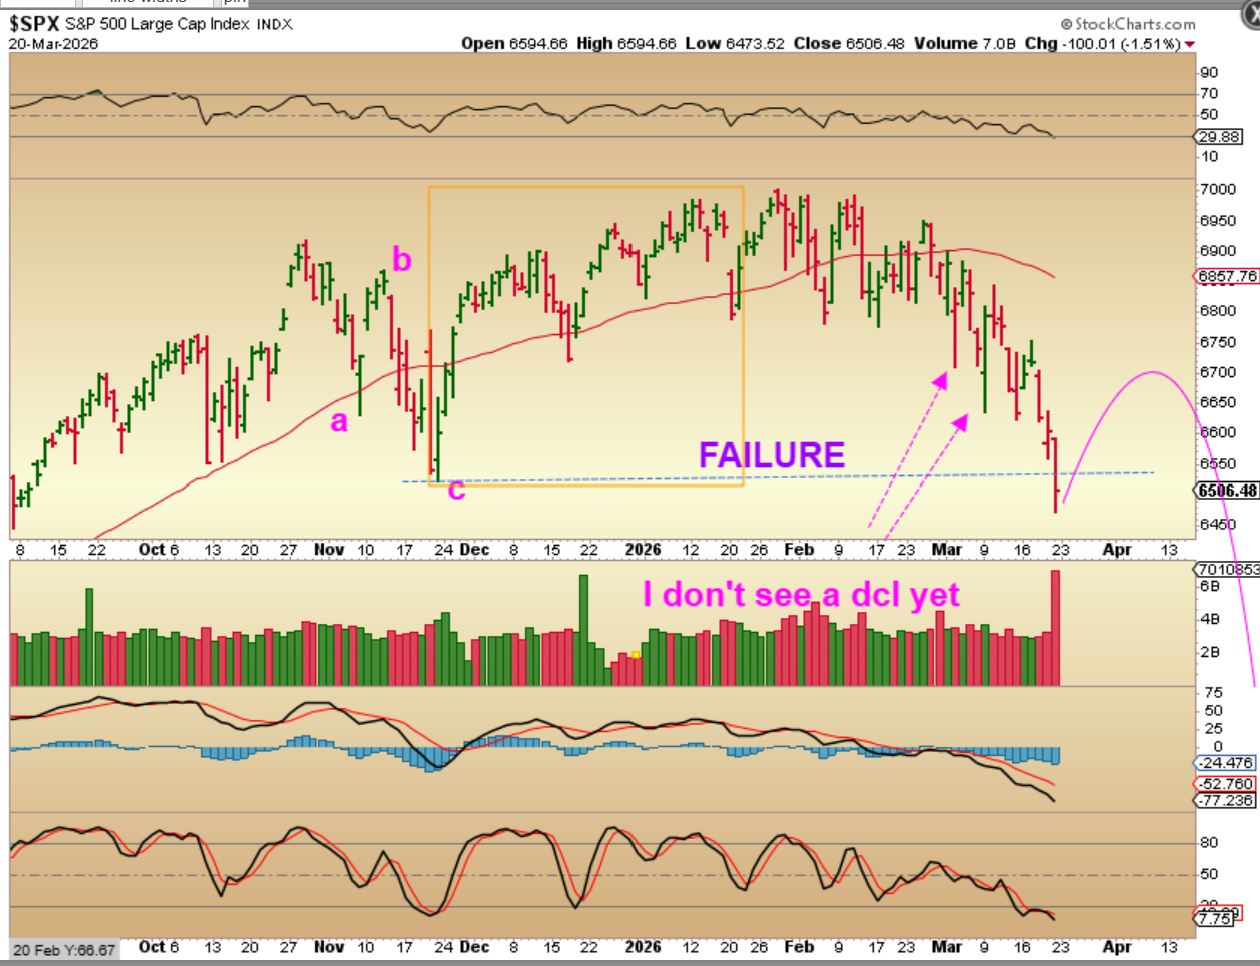
SPX – We have a low that broke the ICL. That is a failed intermediate cycle and that calls for a drop into an ICL over time. That drop doesn’t come immediately, because we can bounce out of the dcl. I really don’t see a second daily cycles dcl yet, so we could bounce out of a dcl this week, but it is now confirmed that these markets do not want to run to new highs at this time.
.
ALSO IN THE WEEKEND REPORT:
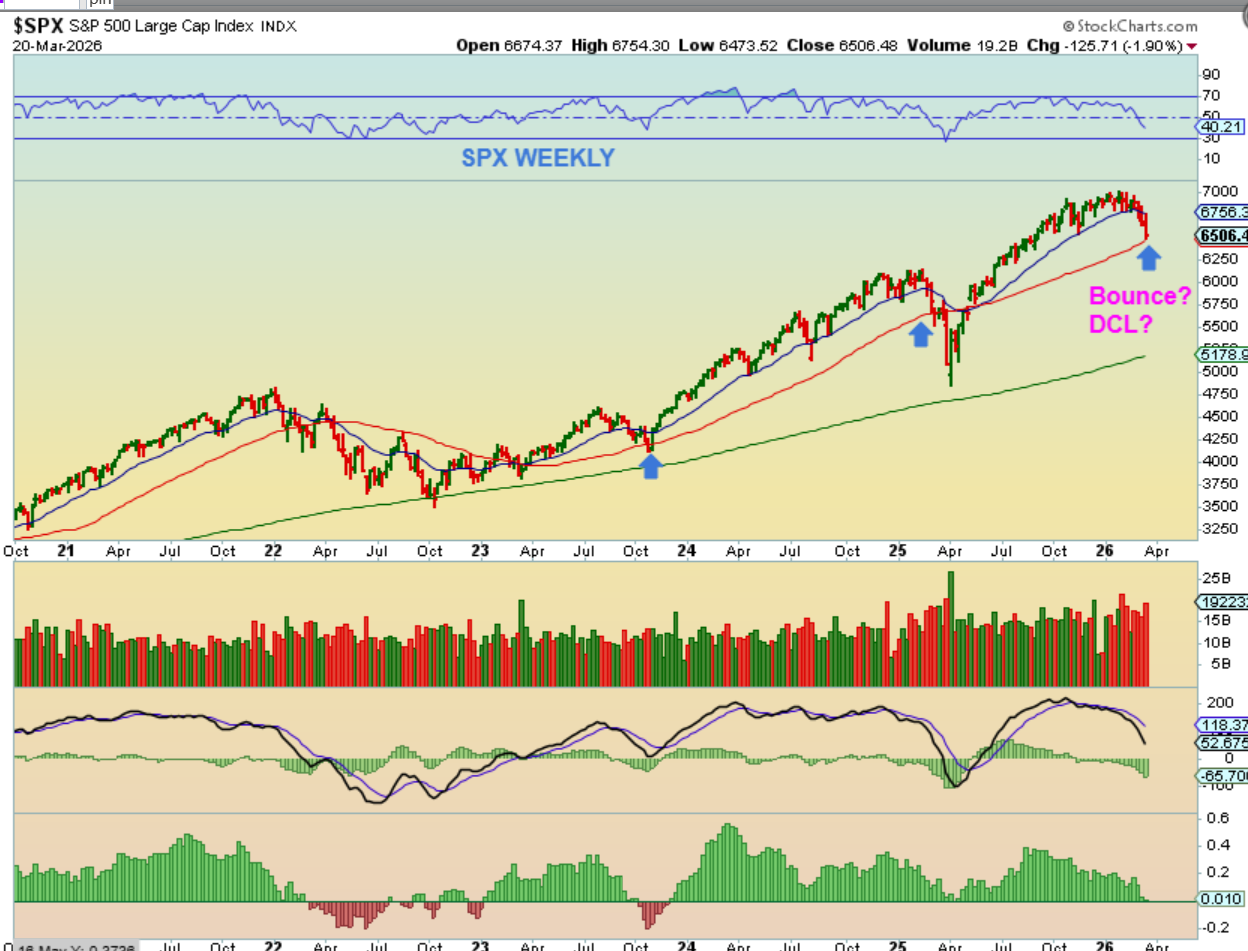
THE SPX WEEKLY is actually sitting on support, so that dcl & bounce may come next week. A quick break & recovery is possible as a shake out too.
.
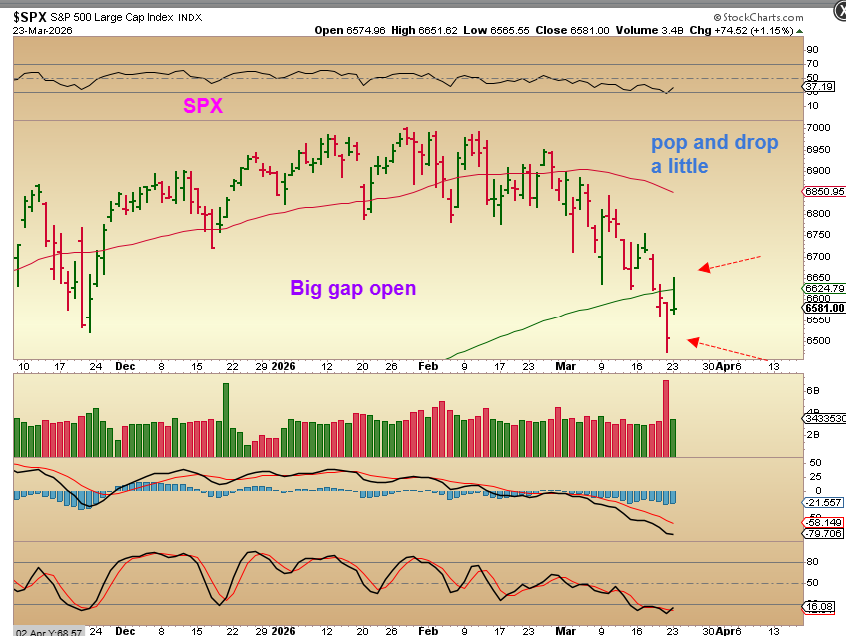
The SPX (& General Markets) Gapped open in a big way on Monday, supposedly when Trump mentioned postponing strikes on Iran’s energy for 5 days because of talks that were progressive with Iran. Iran denied that those talks ever took place. You can see that the markets gapped open, ran even higher, and then sold off to that gap again. The last few times this happened, the selling continued.
.
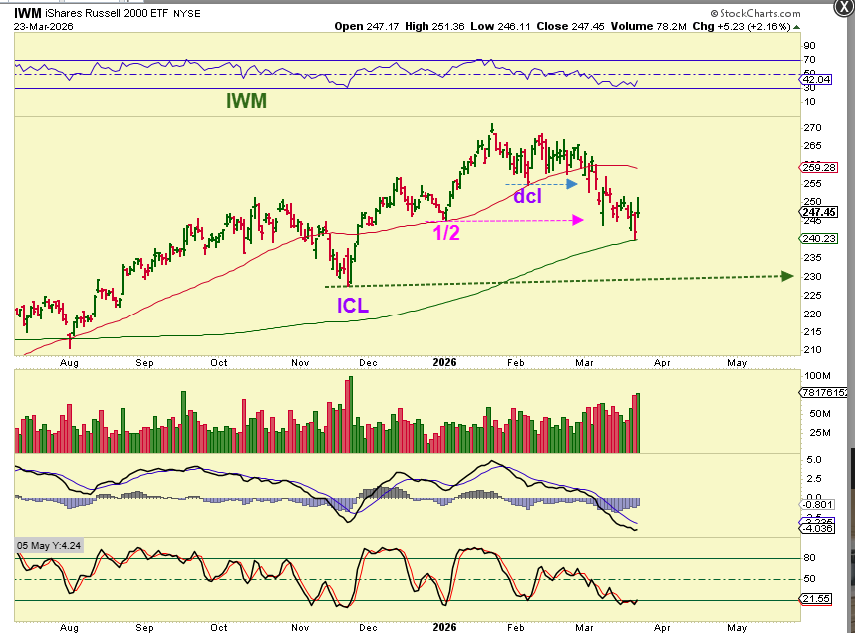
THE IWM bounced off of the red 50 sma at the last dcl, and now it has bounced off of the green 200sma. This chart doesn’t look at bad as the SPX & NASDAQ, since they broke below their November ICLs, but we have to expect the markets to roll over. A bounce for the IWM should be short lived too. It may just involve a choppy bounce back to the 50sma.
.
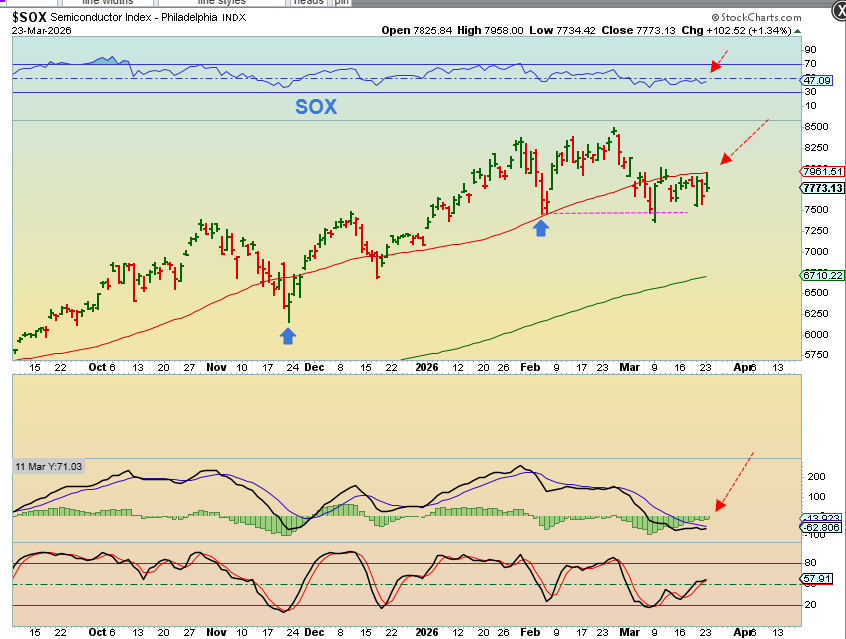
THE SOX also held up much better than the SPX & NAZ, remaining Well Above the Nov lows, but it tagged the 50sma and dropped on Monday. The MACD has weakened, so I would expect a weak bounce here too.
.
As the markets crashed down and broke the ICL / Nov Lows, some stocks did continue to hold up nicely.
.
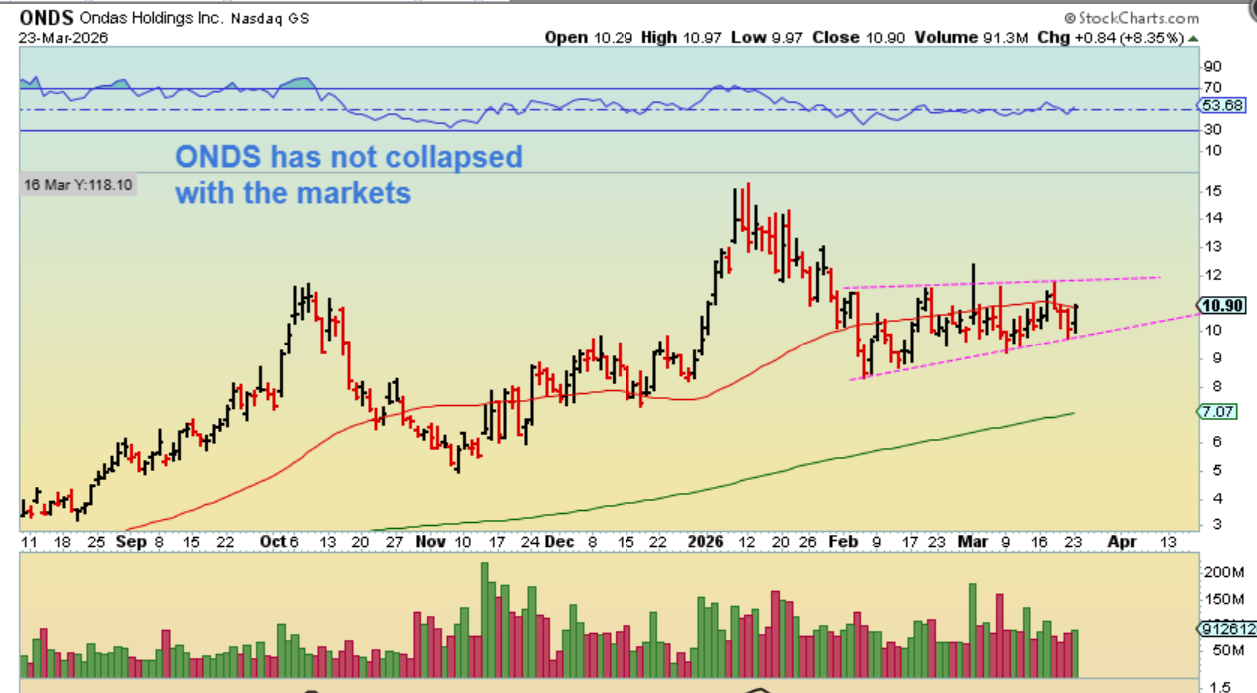
ONDS (Drones) has chopped sideways and was up 8% on Monday.
.
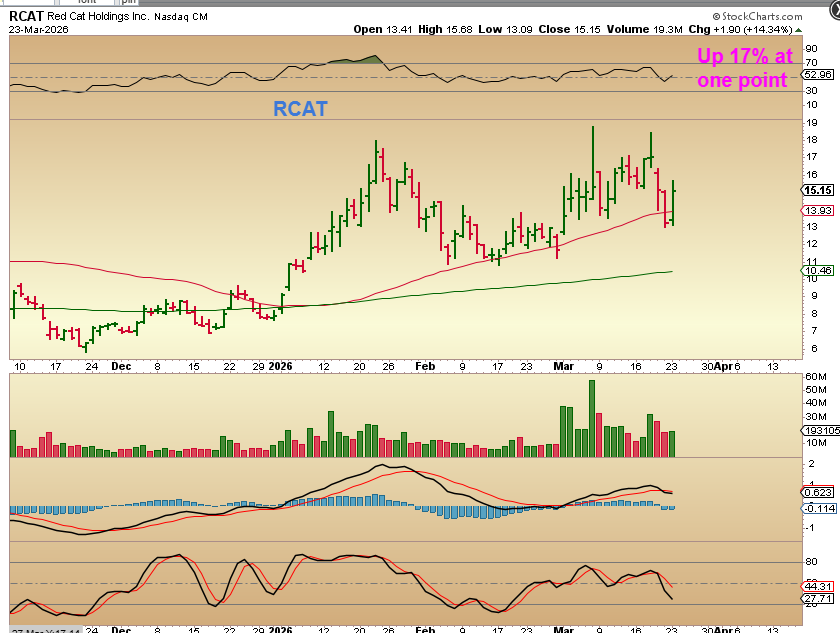
RCAT also held up well around the 50sma, and was up 14% at the close on Monday.
.
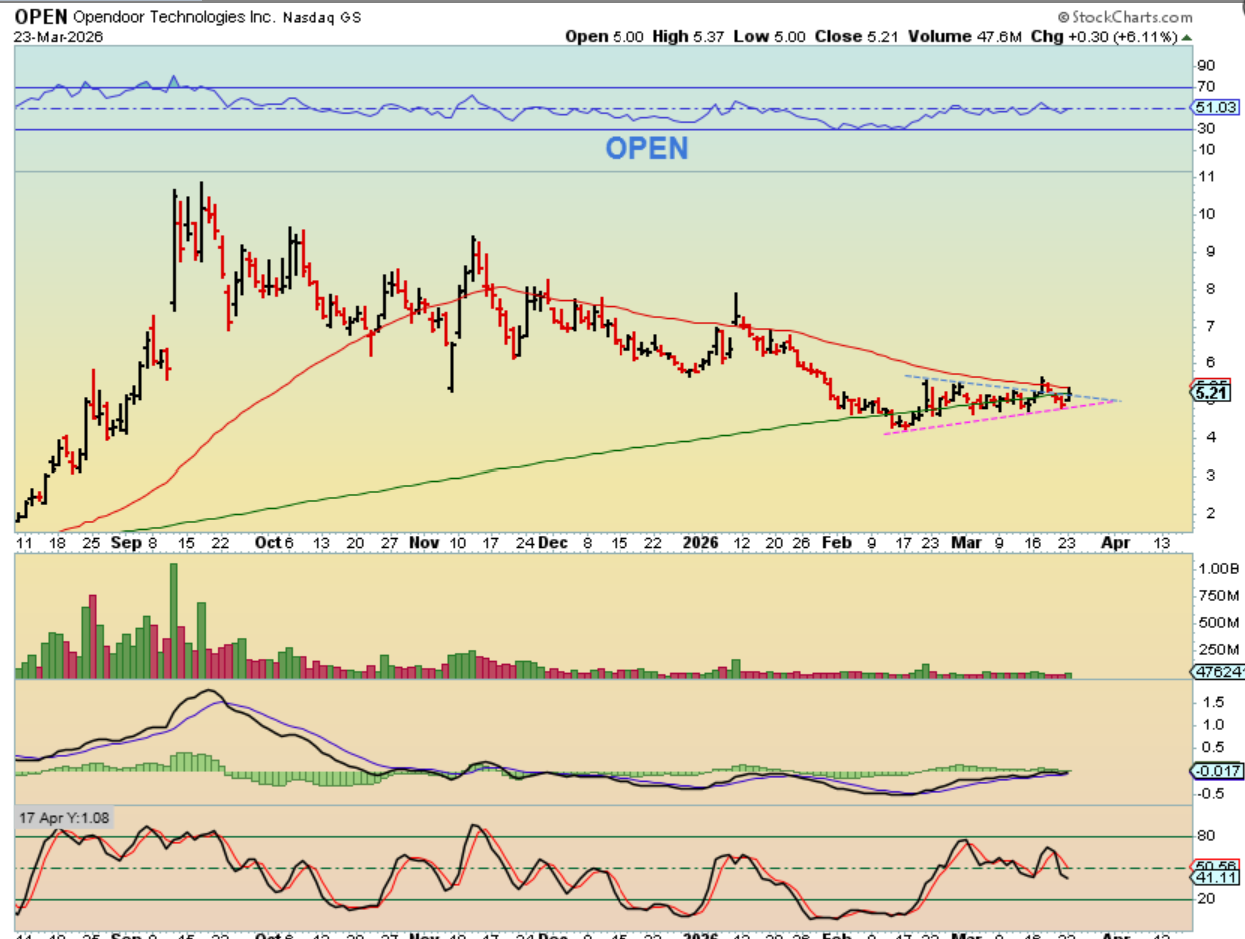
OPEN has been choppy, chopping along the 200sma for weeks actually, and the triangle may give it the energy to break out higher above the 50sma, if we have a dcl / lows in place.
.
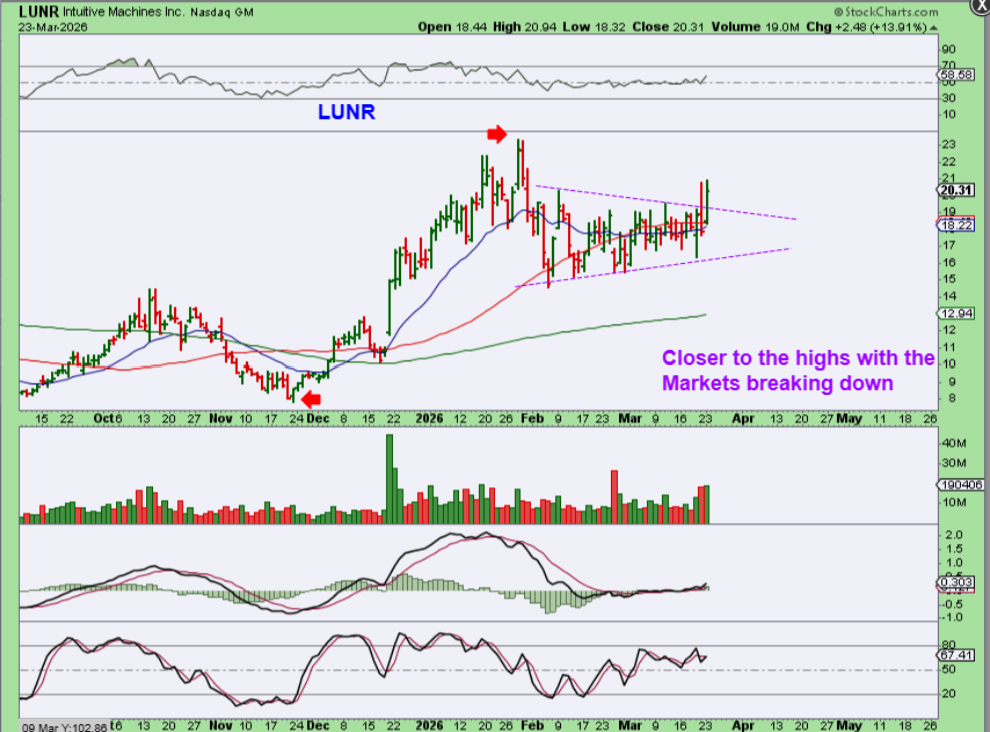
LUNR is one that I also really like, and it is closer to the highs than Nov lows too (so far).
.
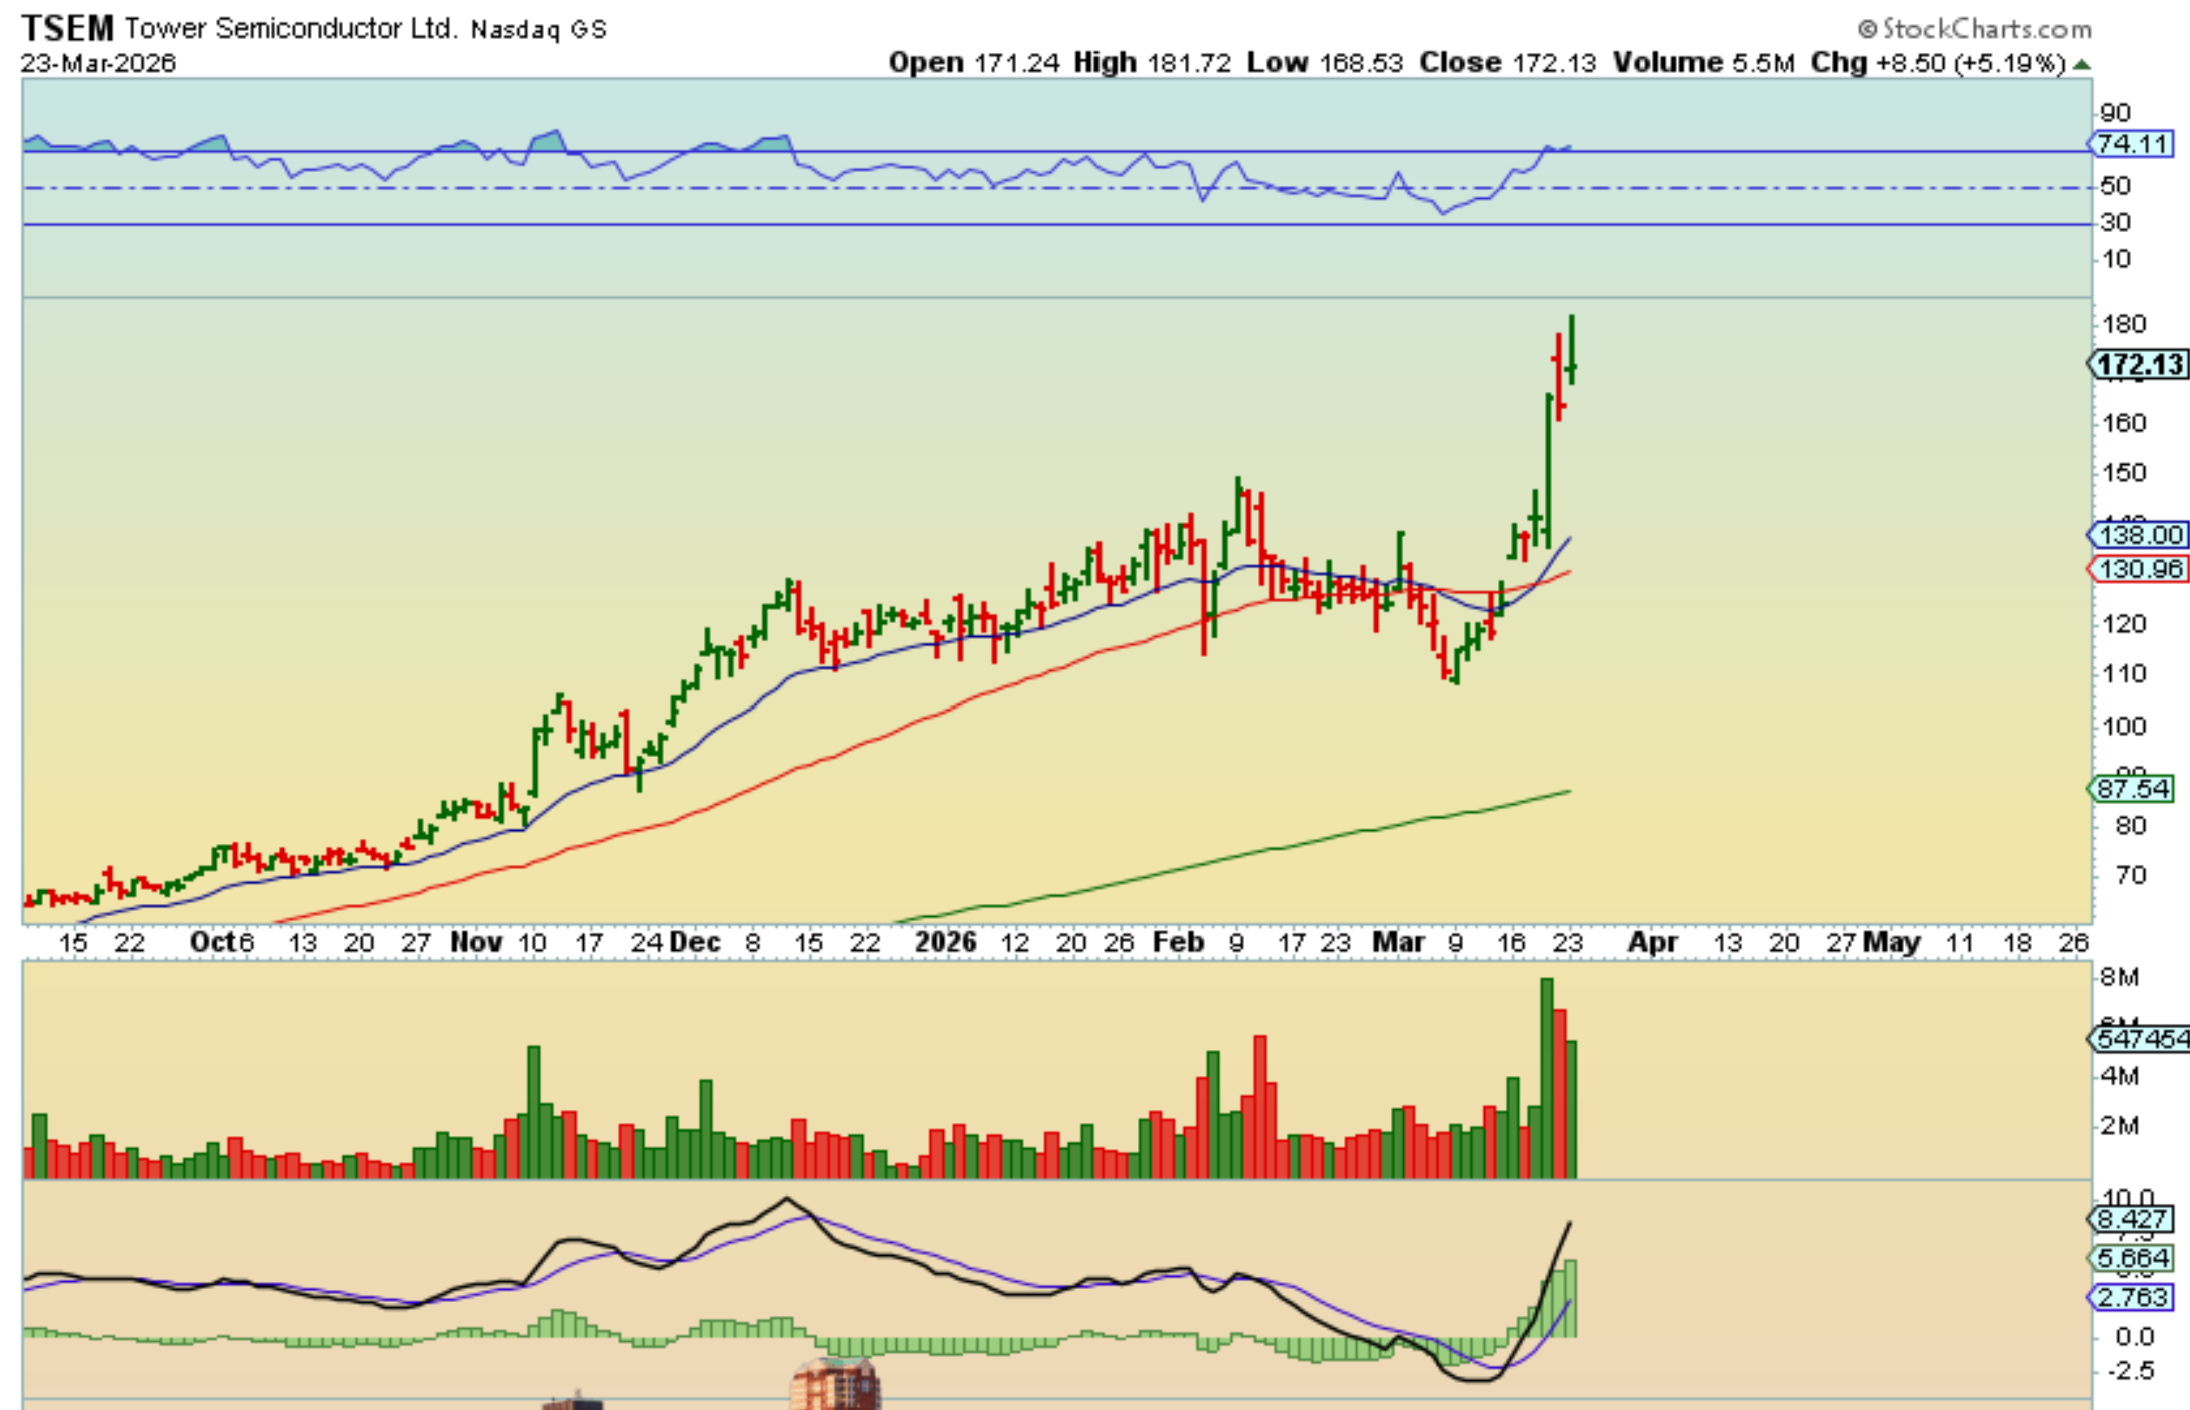
TSEM – So I have mentioned TSEM as a real leader in semis for over a year now, and I did NOT Buy it in November or on the recent dip. Guess what? Not only did it make new highs on Monday, but it could also possibly DOUBLE In March alone ($110 to $220)!
.
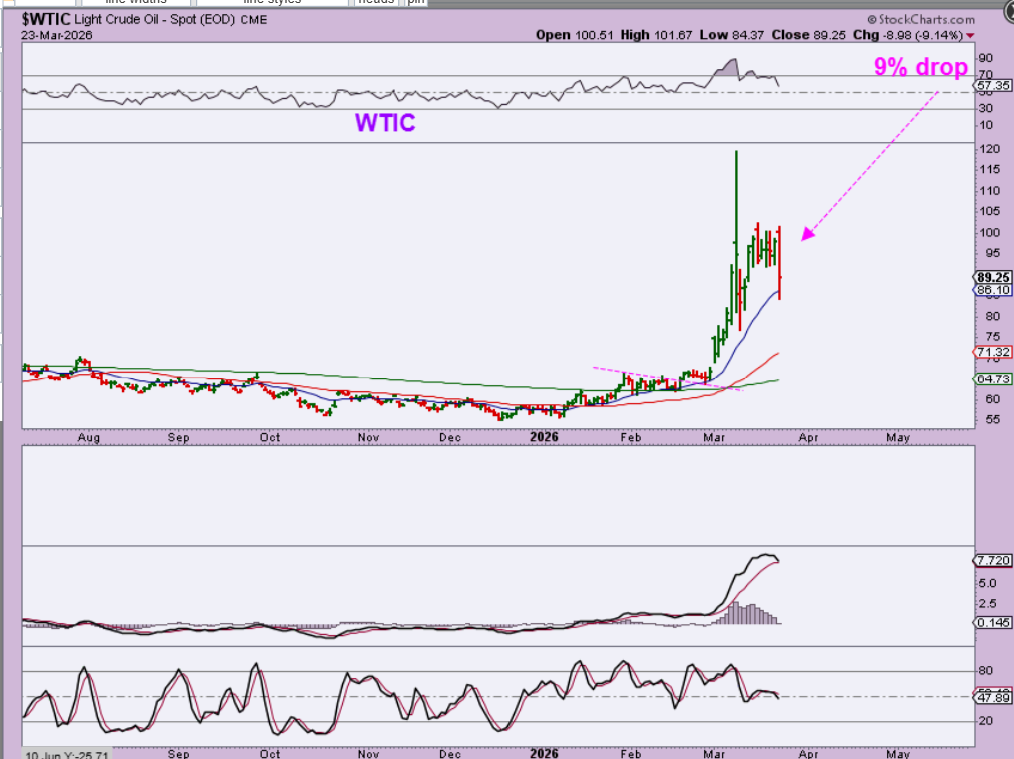
WTIC crashed down 9% with the ‘talks’ about Iran possibly agreeing to allow Oil through The Strait of Hormuz. Again, Iran has denied that these talks exist, so we’ll just have to wait and see what happens with oil on a day-by-day basis, as war propaganda flows from both sides.
.
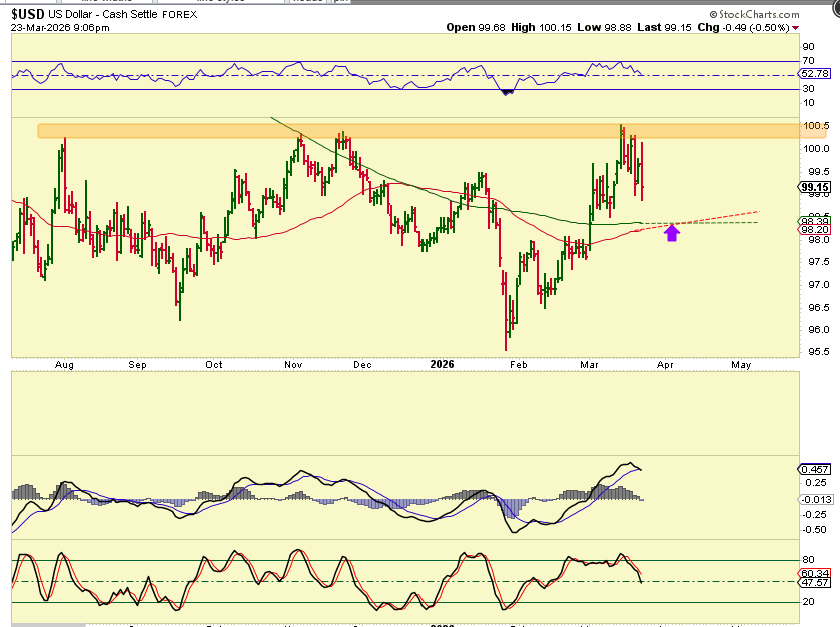
THE USD dropped on Monday too and still looks to be dropping into a dcl.
.
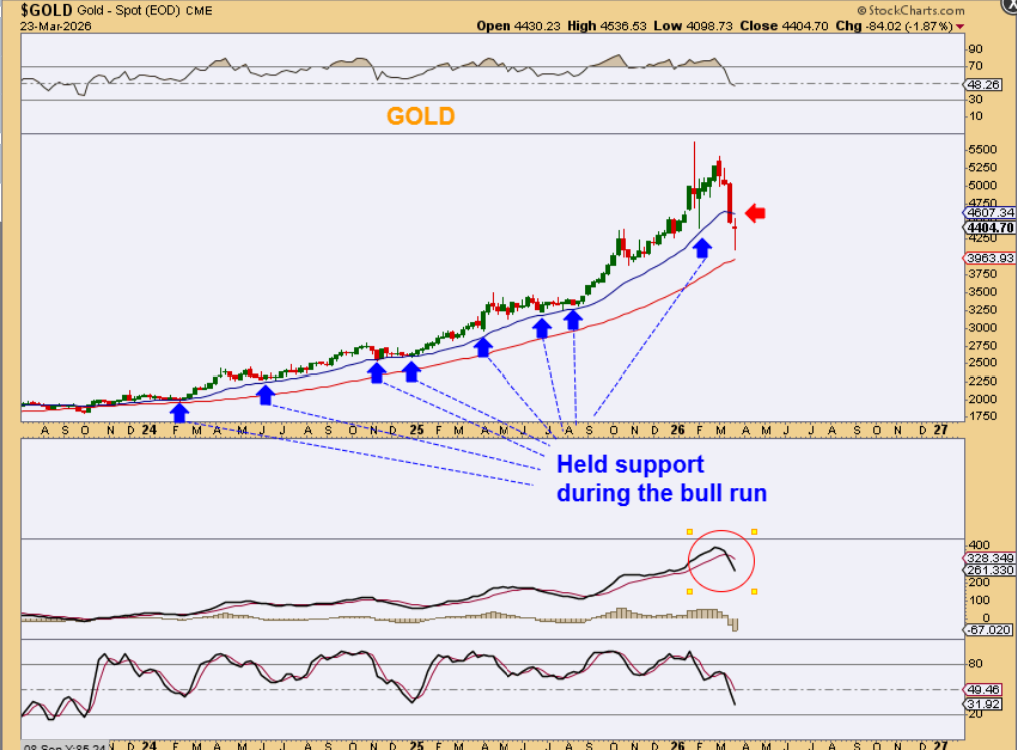
GOLD WEEKLY- Gold dropped Sunday night and bounced back as the day went on. This selling has broken the bull run pattern of finding support at the blue line.
.
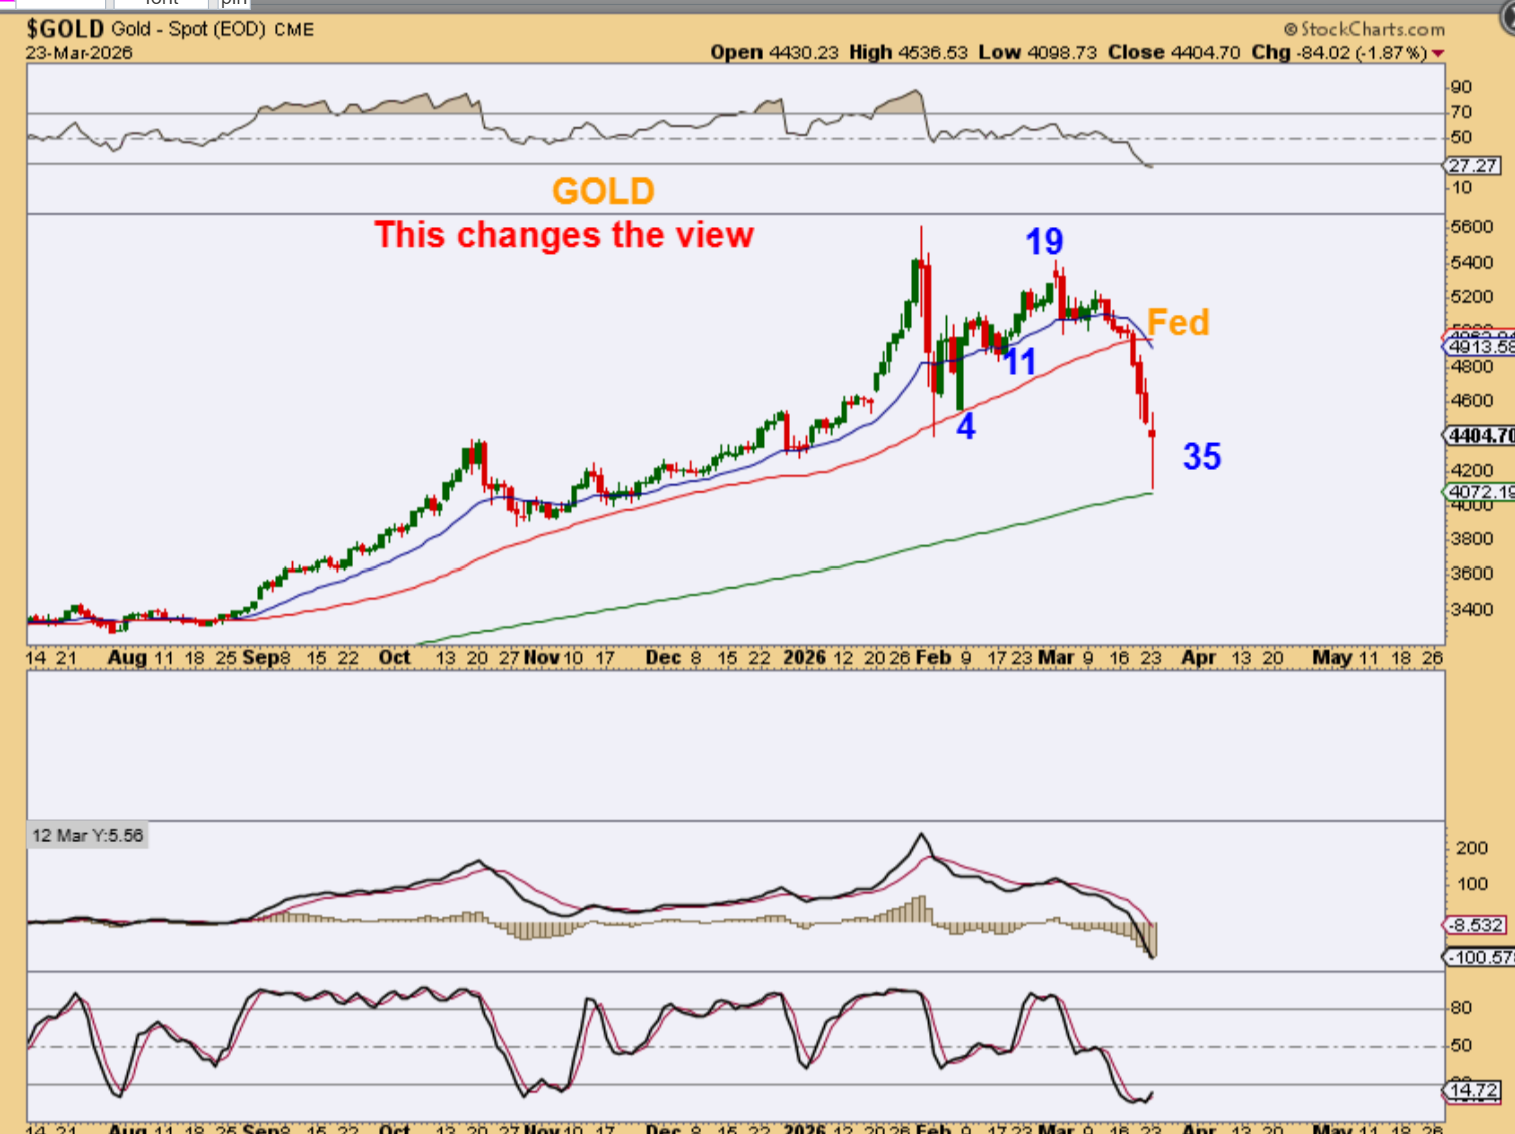
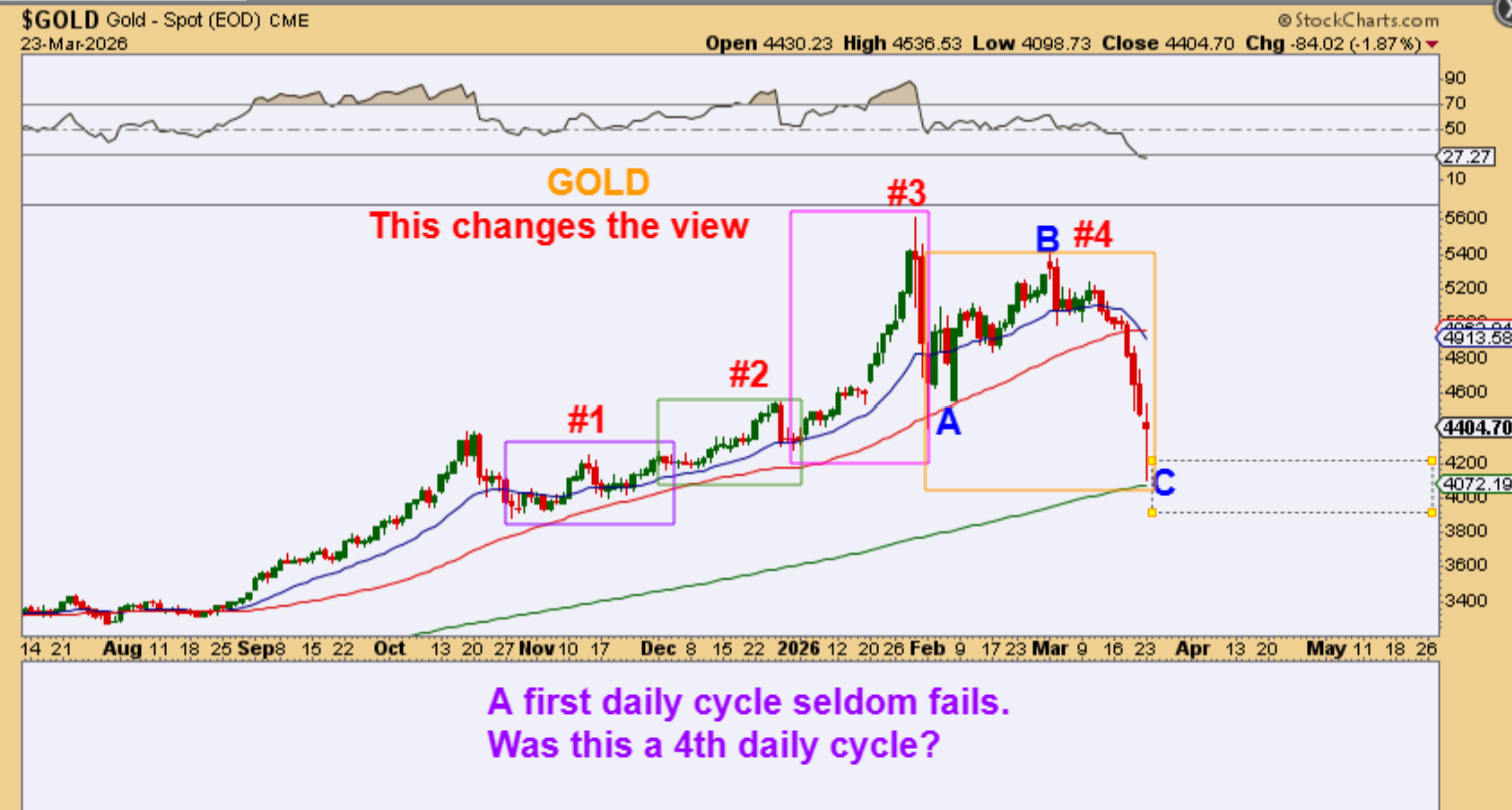
GOLD broke down below our prior Feb low, and that usually will NOT happen in a first daily cycle out of an ICL. THAT MEANS…that this might now become a final daily cycle, not a first daily cycle. Let me show you what I mean…
.
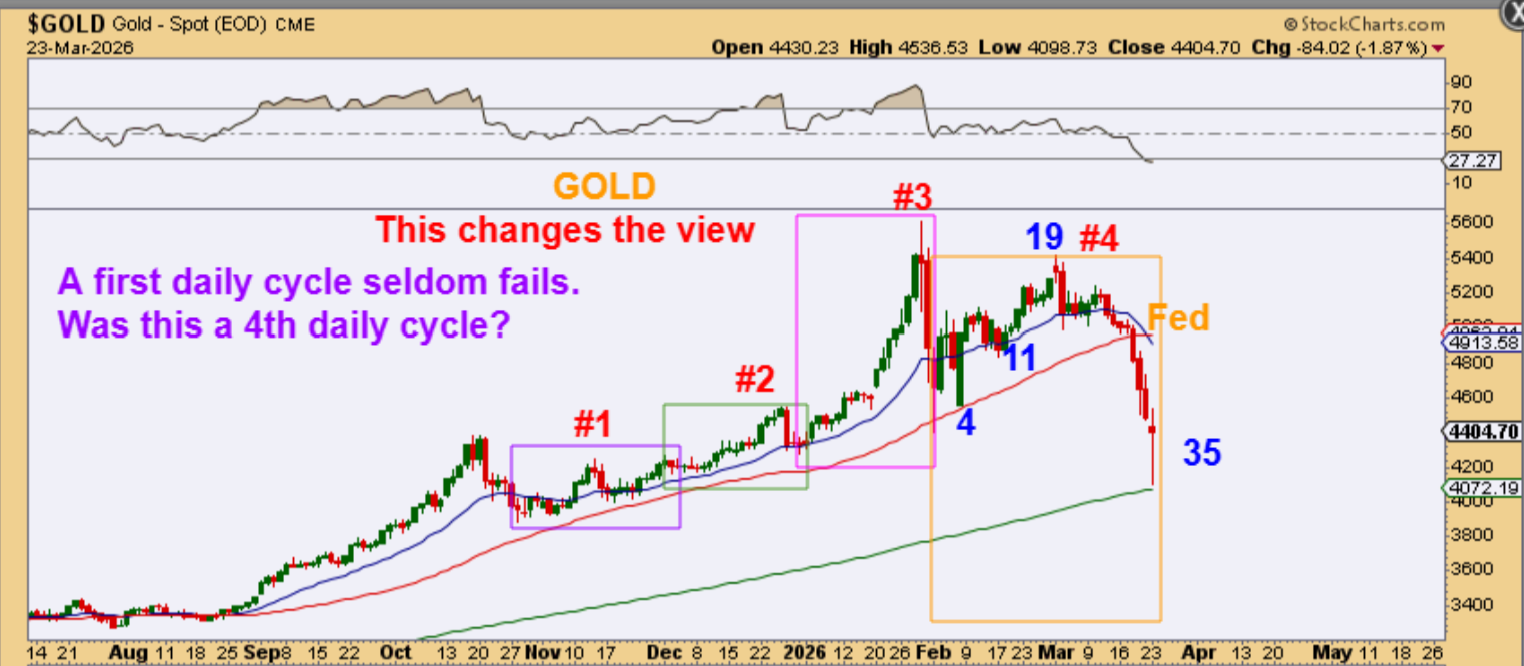
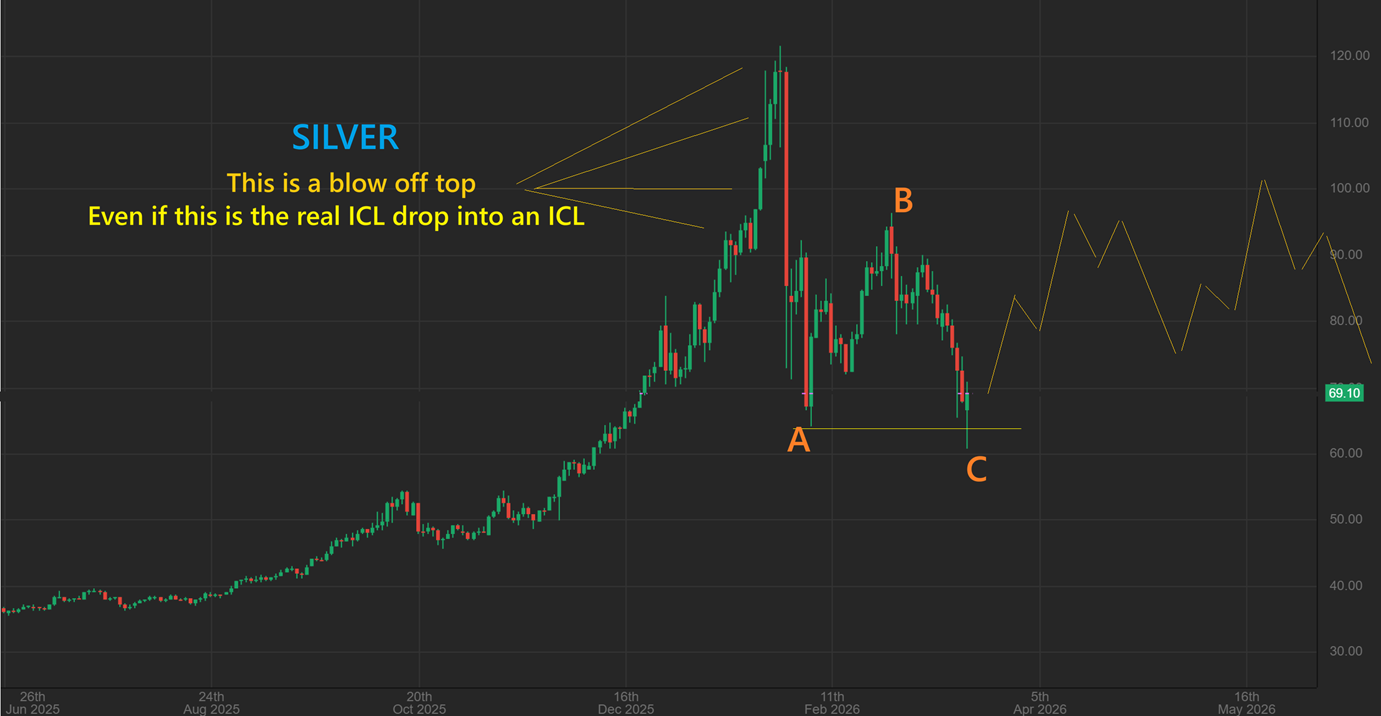
GOLD – If Gold broke to new highs, we would report that Gold was in a first daily cycle out of that slam down low (ICL), but with this price action and continuous weakness lately, it changes the view to possibly a 4th daily cycle that just put in the real ICL. Gold is on day 35 reversing at the 200sma. NOTE & WARNING: Gold may also be forming this 4th daily cycle and a 5th could follow. That would be REAL CRASH MODE, and that is what blow off tops can do. That is good to keep in mind, So…
.
GOLD: Again, Gold could have this as the A-B-C move into an ICL. That does not mean that this will now race up into new highs, but it will be interesting to see what it does do. It may just consolidate recent gains with wide fluctuations, but we’ll just have to wait and see. NOTE: It could also give us a bounce and crash like the Nasdaq Tech Bubble did, into a 5th daily cycle. The Naz bubble also double topped like Gold with a double top, and then crashed. Let’s take a look…
.
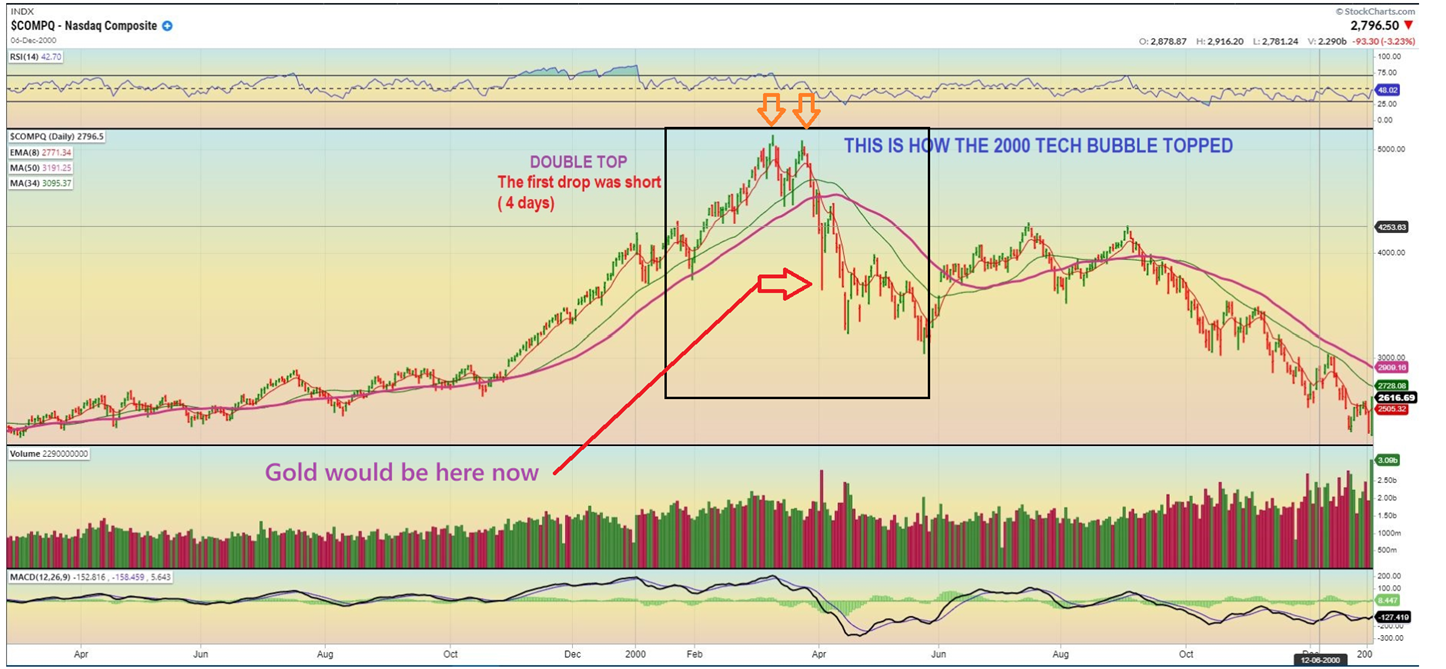
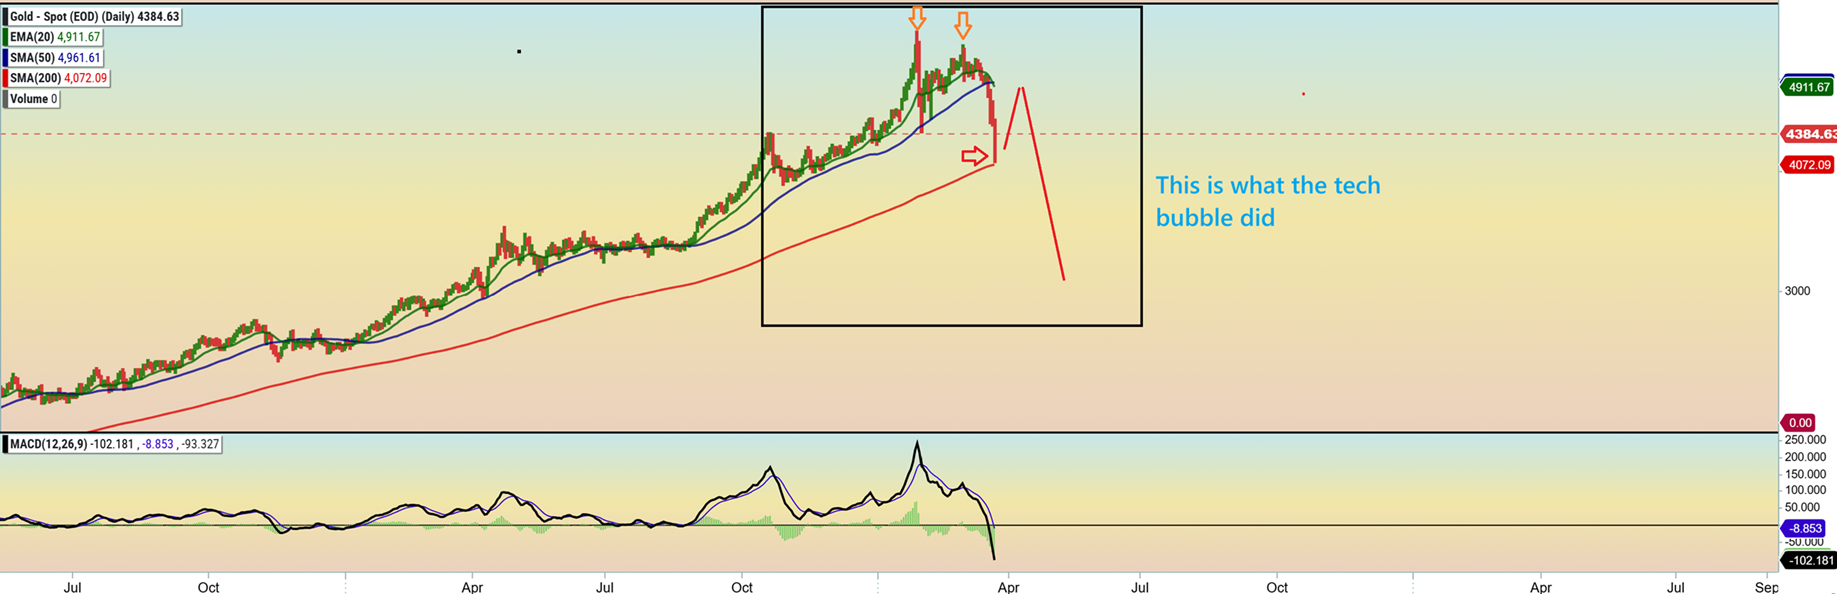
THE NASDAQ 2000 tech bubble also did a double top like what Gold just did. So I will stack the 2 charts on each other below and focus on THE BLACK SQUARE in both charts.
1. After the NASDAQ ‘peaked’ it dropped sharply, then bounced to a double top…
2. That Double top had a slightly lower high. See the Gold chart below the Nasdaq chart, it has that now too.
3. It then Crashed like Gold just did to the red arrow. What happened next? It bounced to the 50sma and crashed again in a 5th daily cycle. So even though Gold COULD run to new highs under the right conditions, like if we suddenly got a rate cut, but it could also crash again. So far Gold and Silver are dropping sharply from that peak, similar to the Nasdaq blow off top. If Gold and Silver have topped, we need to be very cautious, and some may even sell the bounce.
.
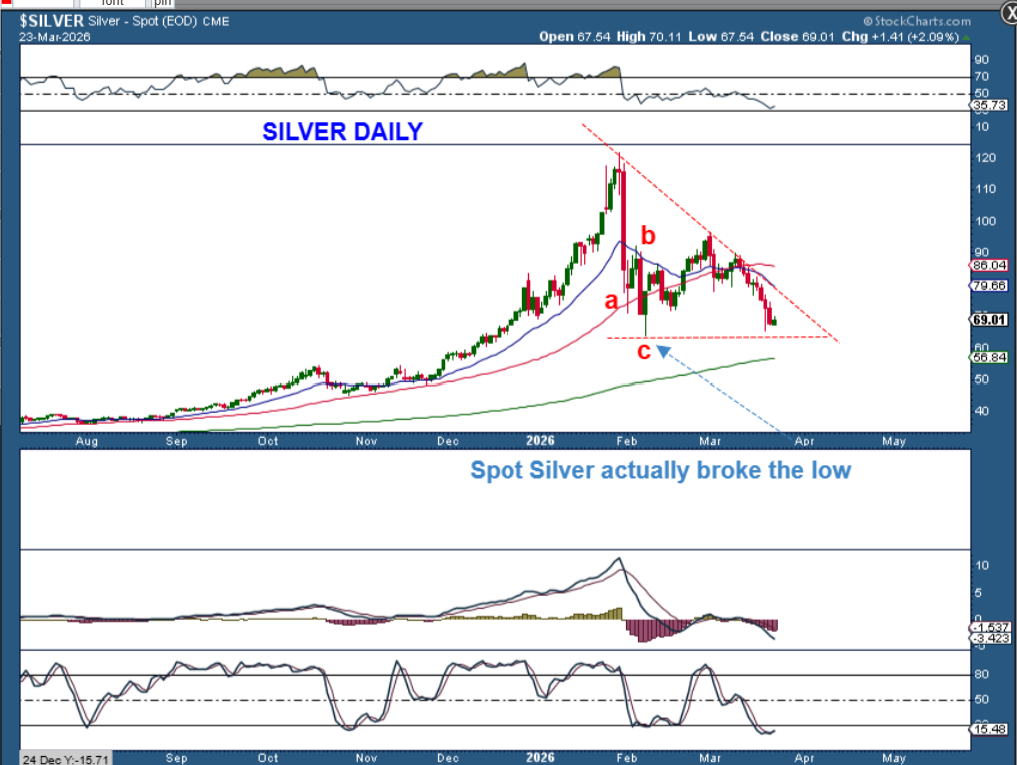
SILVER has also looked like an a-b-c drop into an ICL, but the lows were broken on spot silver Sunday night too. I’ll show you…
.
SILVER broke the recent January lows Sunday night/Monday morning, so it too may be in a final daily cycle that leads to an ICL. That said, Silver may just chop around sideways or it may even crash again too. If we are in crash mode, like the tech bubble of 2000, then we may see a 5th daily cycle that crashes even lower. That is what blow off tops can do.
.
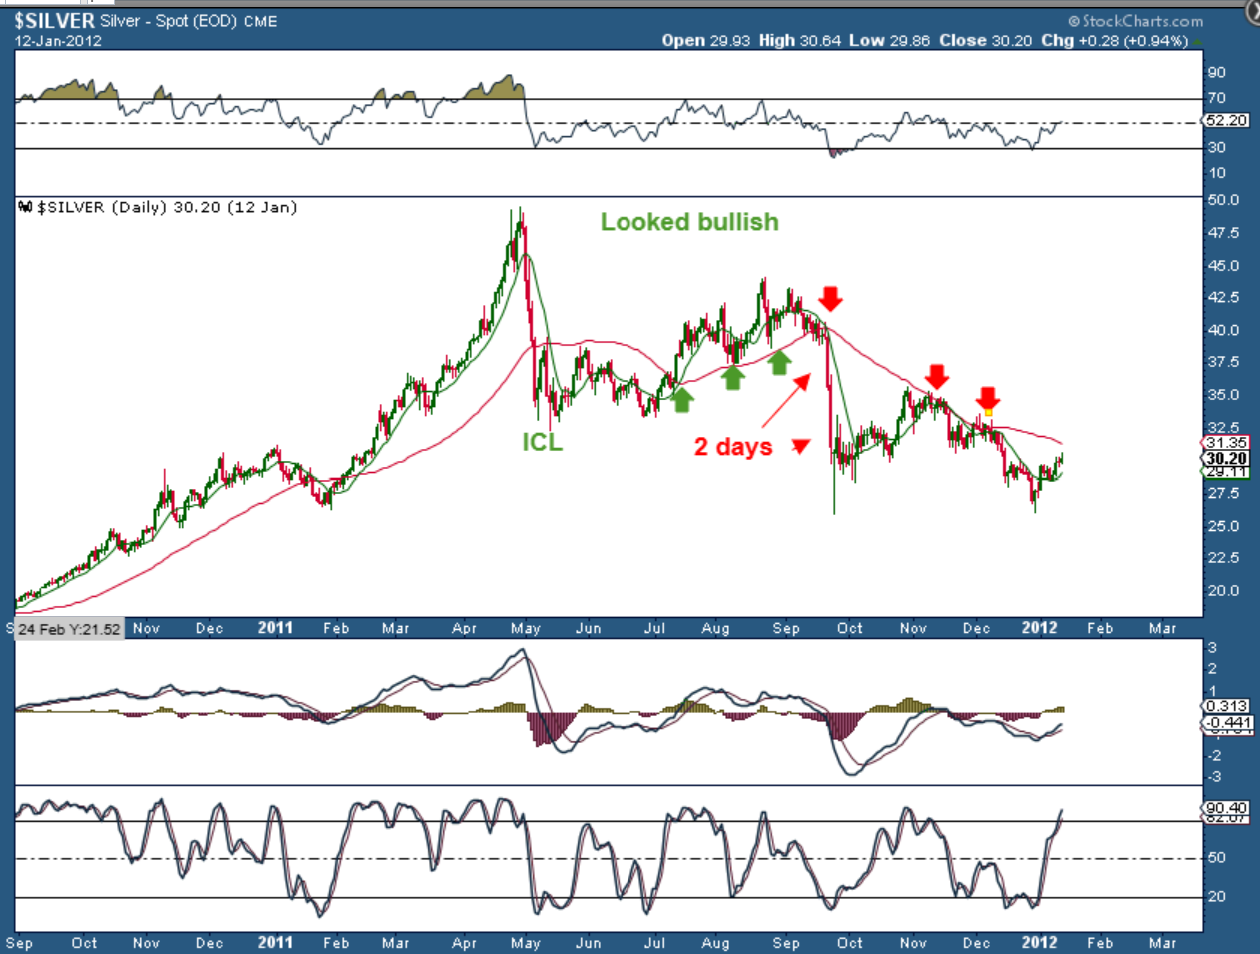
SILVER 2011: We are already at the place where Silver rolled over and crashed to new lows for the second time. So you can see that after that 2nd SLAM DOWN to new lows, Silver only chopped around and never reached former highs for years. It chopped and stammered along sideways & higher and remained weak after it peaked. SO WE WILL WATCH PRICE GOING FORWARD AND SEE IF THIS HAPPENS AGAIN. I have already mentioned that I believe Silver has already topped and now we are seeing the gradual breakdown over time.
.
GDX # 1 – So when I take a step back and look at the miners, I feel that they may be telling the real story. They are oversold and ready to bounce, and also due for a dcl, but how high will they go? They will bounce with Gold and Silver, but they really look to have peaked.
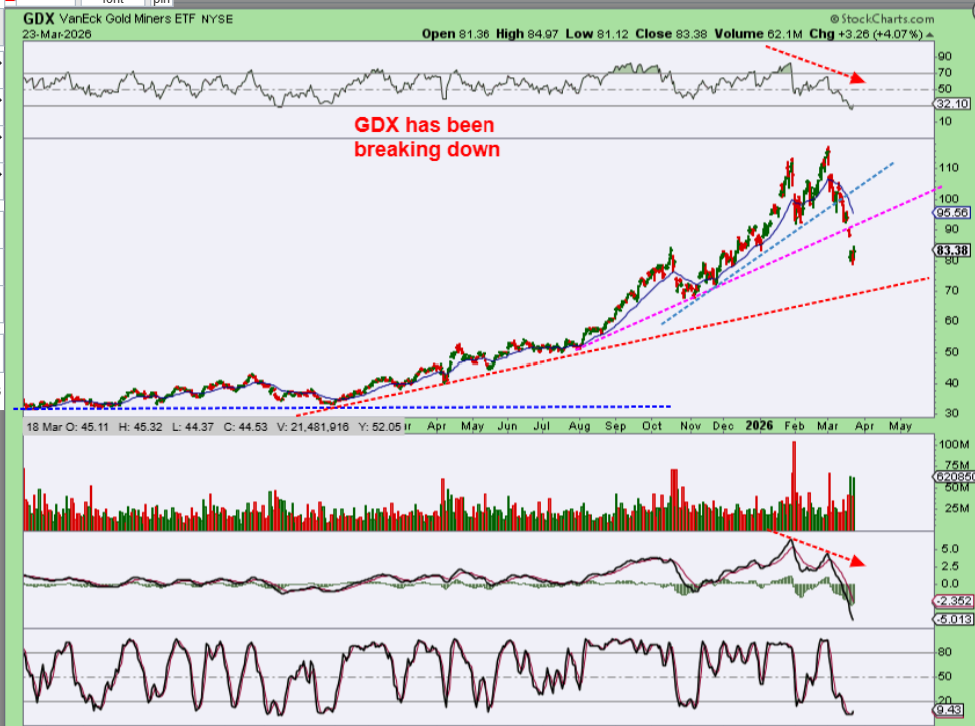
GDX #2 (Same chart): That double top had strong negative divergence. The RSI didn’t drop to 50%, it is at the lows and the MACD also had divergence and then crashed. This looks like it would be a ‘sell the bounce’ if you still own miners, or raise stops along the way higher to get stopped out on a drop. This set up could also be a ‘short the bounce’ (DUST/JDST). We’ll watch how it unfolds.
.
With our recent set up, we were expecting a possible bounce for roughly 7 days or so, and it would become a L.T. bounce and then it should roll over. Guess what? Coincidentally, Trump said that he was not going to bomb Iran Energy plants for the next 5 days as the Iranians talks have turned positive. Iran says that these talks did not happen, so in my opinion, we may only have a 5 day bounce and then if the U.S. or Israel begins bombing Irans Energy Plants, the selling could resume. We want to remain aware of that possibility if you are trading. Enjoy your Tuesday markets.
.
~ALEX
.
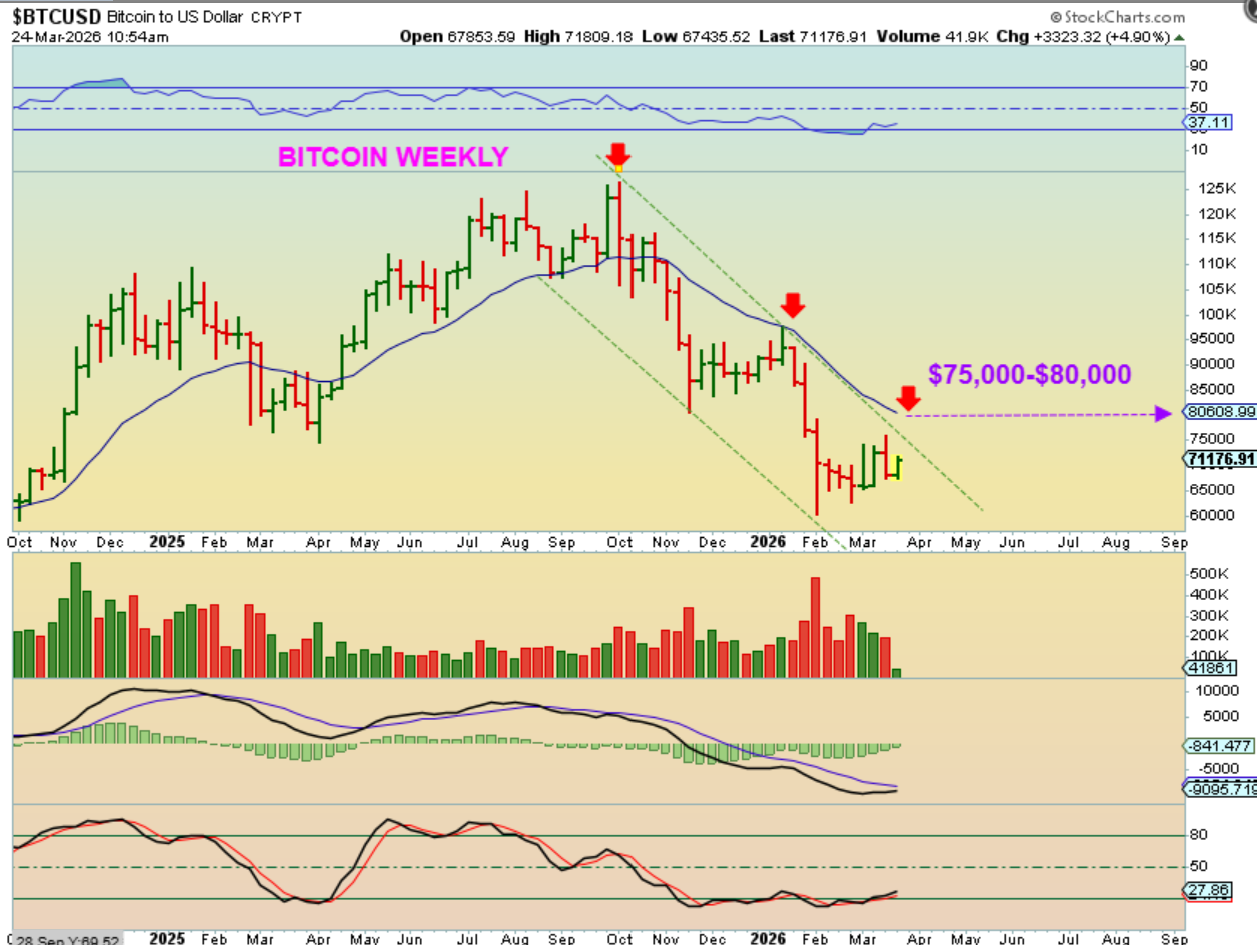
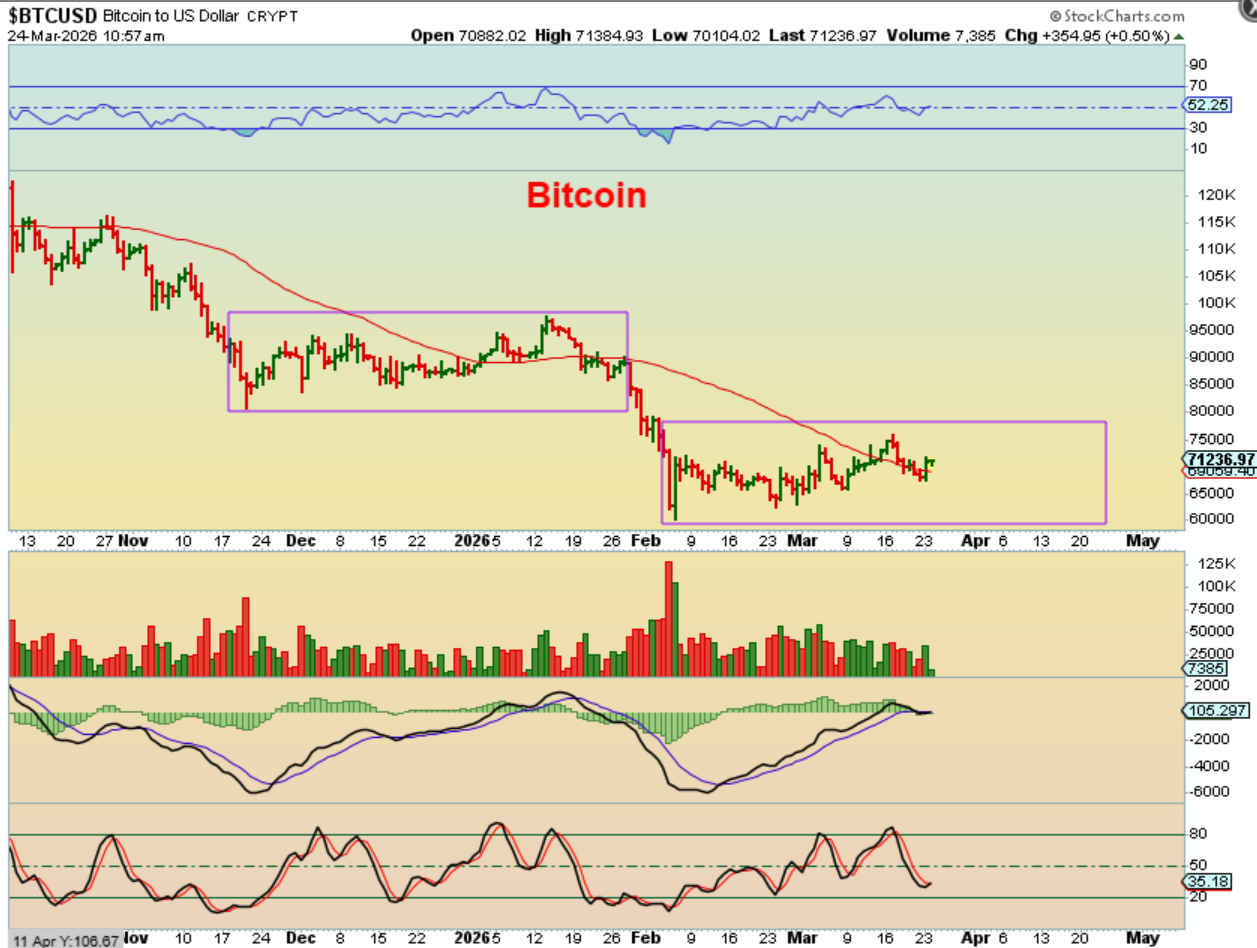
BITCOIN – We have another bounce with Bitcoin, and this was expected. Bitcoin is acting very much like it did on the last consolidation before it dropped. I do not see a strong rally coming due to cycle count, and the Weekly chart also helps us to see that this bounce may end near $80,000. How?
.
BITCOIN WEEKLY – We do have a trendline and the last rally tagged the blue 50 week ma. Both targets are between $75,000 and $80,000. We’ll see what the next 5 days brings our way.