We do not have a lot of change taking place, but as time moves forward any areas that are unclear may begin to clear up. I do think that is what we are seeing with the General Markets, so this report is bit of a review or update to what we have been seeing. Comparing the DJIA, SOX, IWM, SPX, and NASDAQ is helping me to get a clearer picture of what may be happening, so let’s start with that Idea!
.
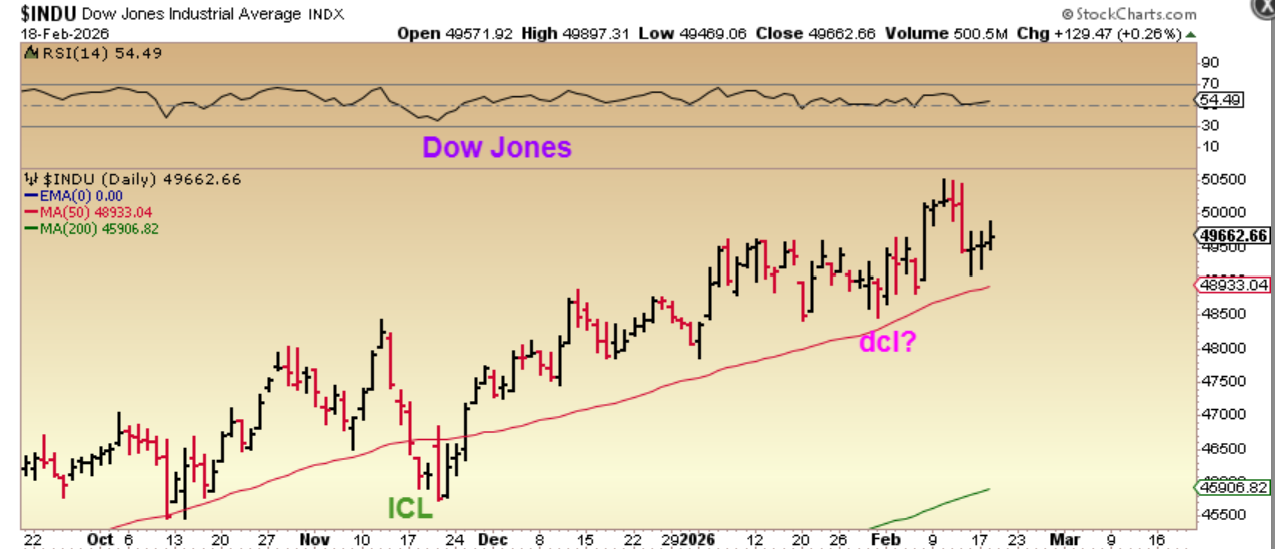
I already mentioned that THE DOW JONES looks normal. Dow Jones INDUSTRIAL average, so there are 30 companies in the DOW and I plan on looking up each stock chart today, to see if any look to be at a buy point.
.
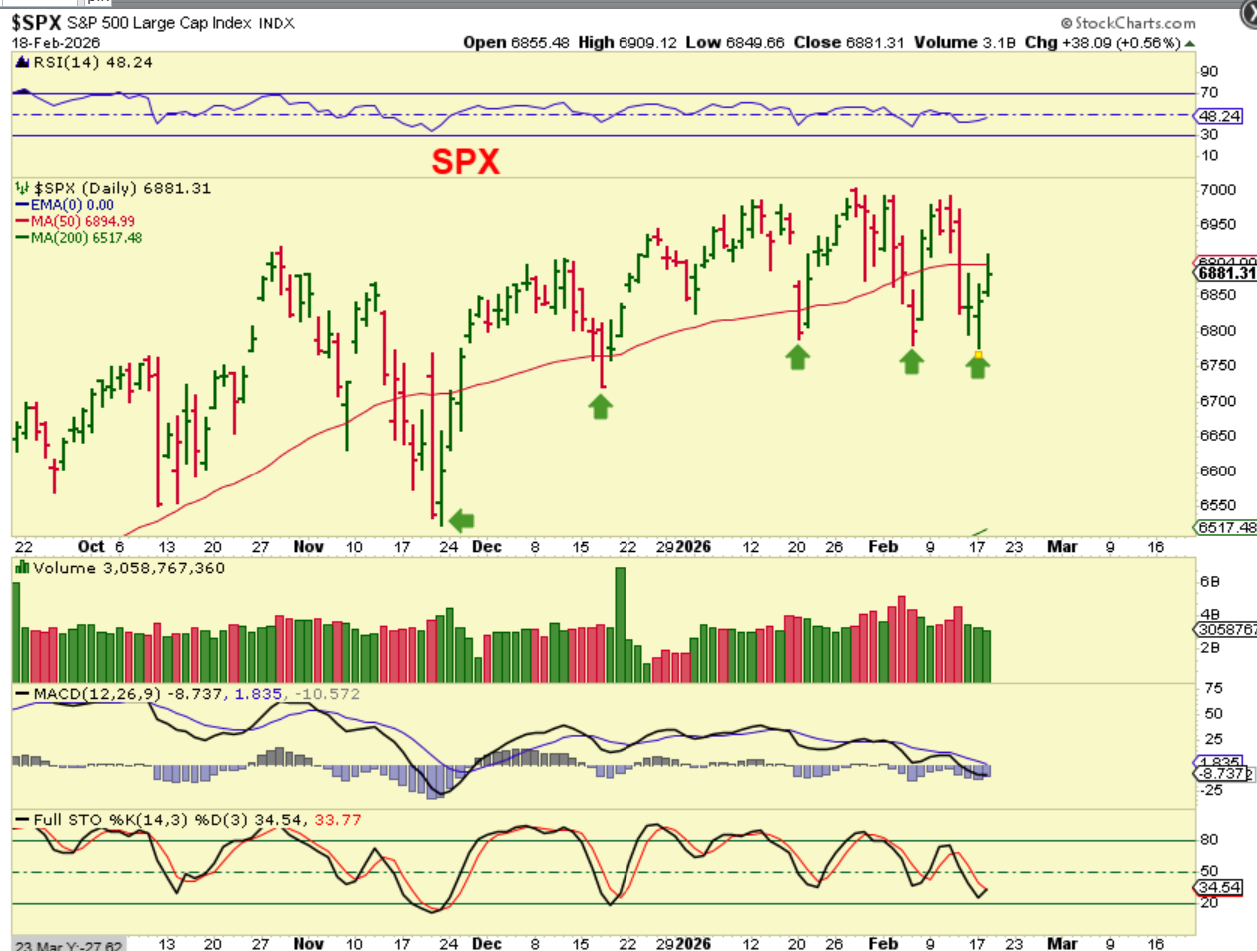
THE SPX continued to put in a slightly lower low and then bounce. This gives me the idea that 1 of 2 things could be happening.
1. We are trying to find a dcl to a long first daily cycle at day 50plus with 1 long choppy first daily cycle? That now seems likely, but could it be…
2. We have an odd set up, with a R.T. first daily cycle and a failed 2nd daily cycle. That does now seem less likely, but the Nasdaq resembles it, so we’ll look at that next.
.
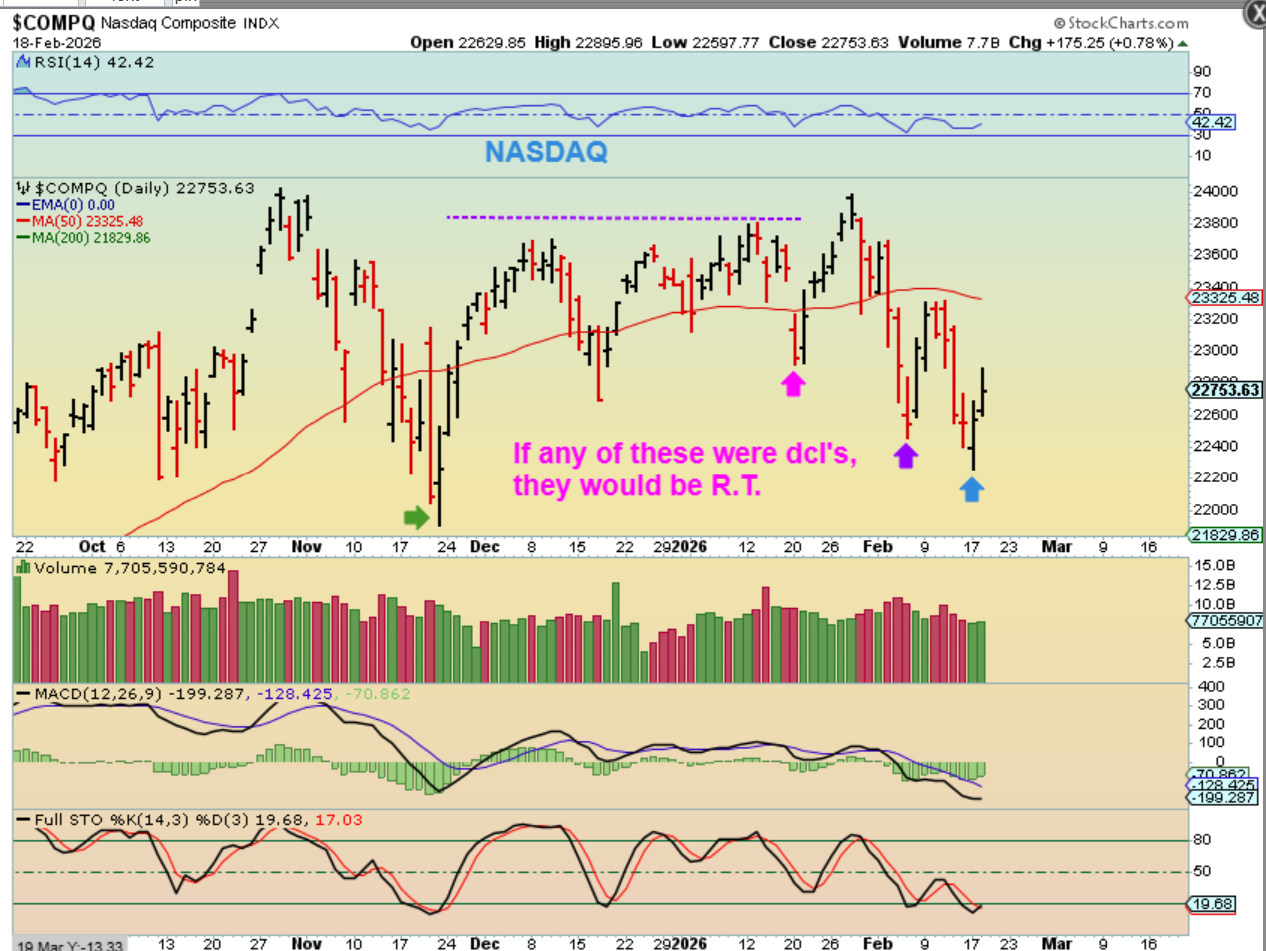
THE NASDAQ does look like we had a dcl and then it was broken and developed into a failed daily cycle. The reason that this seems ‘Less likely’ is because the SPX looks ok and the DOW, IWM, and SOX look fine. With the Dow Jones, IWM, SOX, and SPX looking ok, I guess we need to lean toward one long daily cycle. So…
.
.
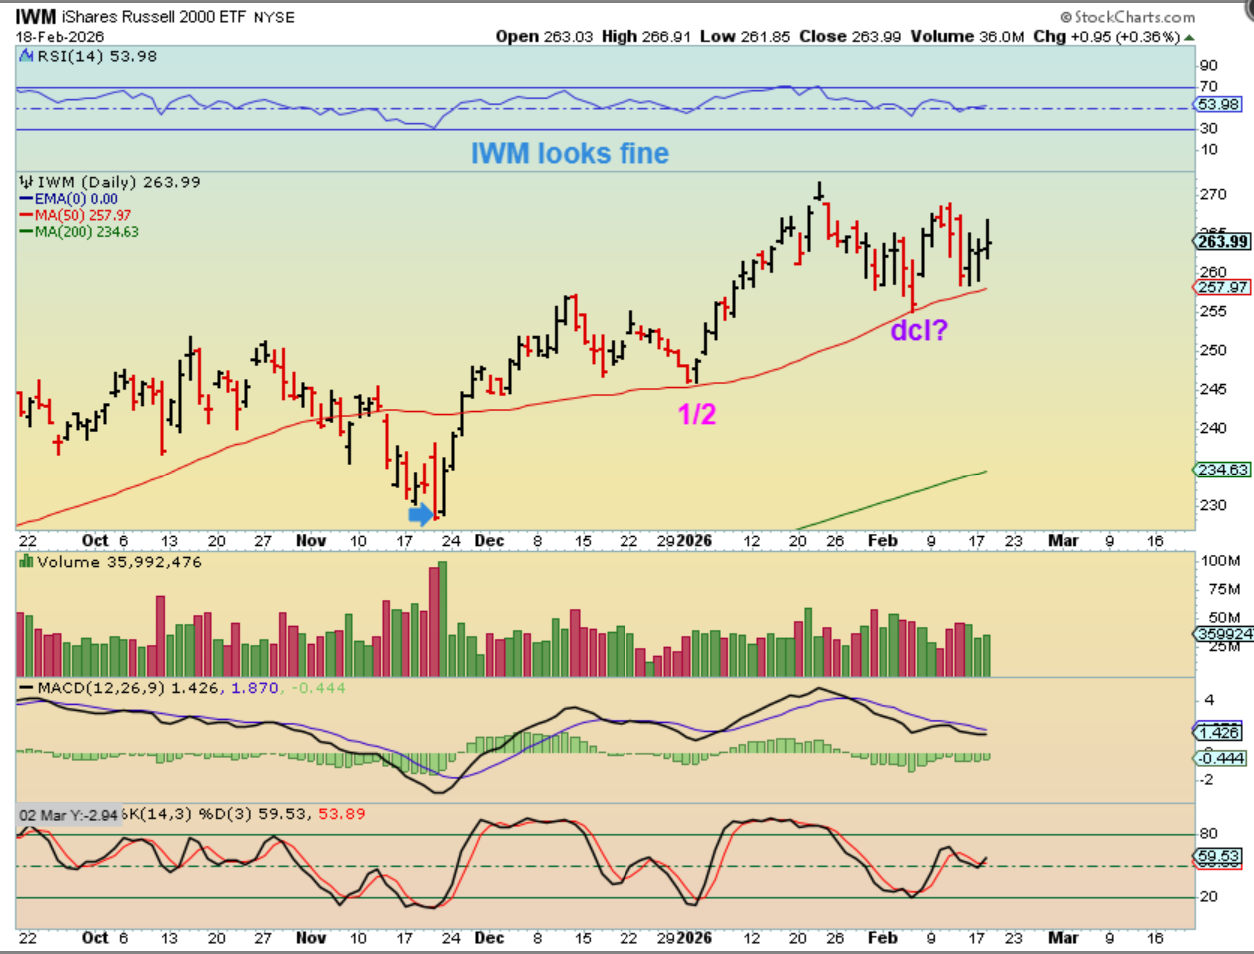
THE IWM certainly does NOT look like a failed daily cycle, right? This looks like a long first daily cycle that has a dcl.
.
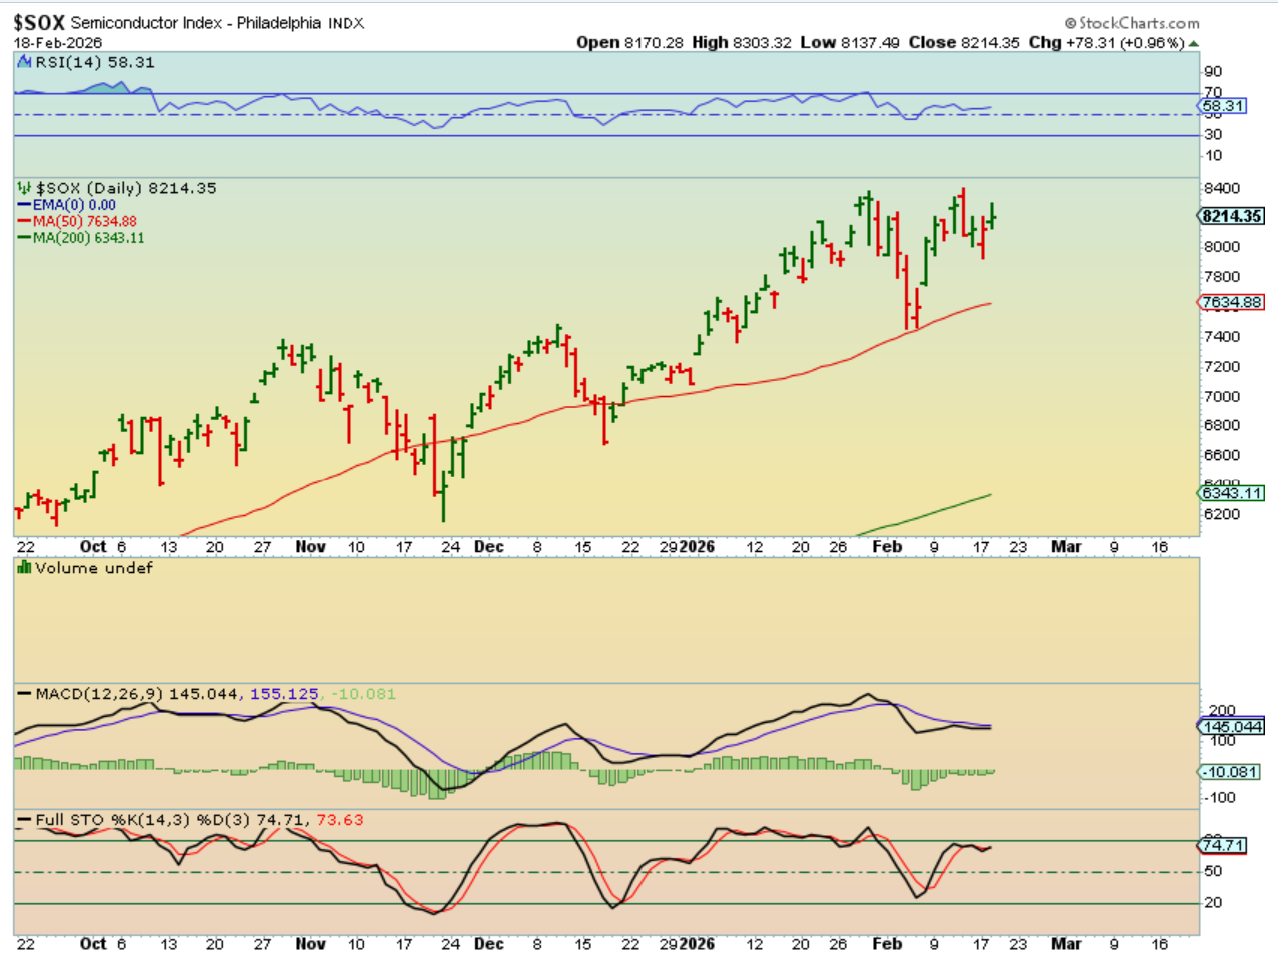
THE SOX also looks like a normal first daily cycle with a dcl developing 9 days ago. This would also back the idea that we had 1 long first daily cycle.
.
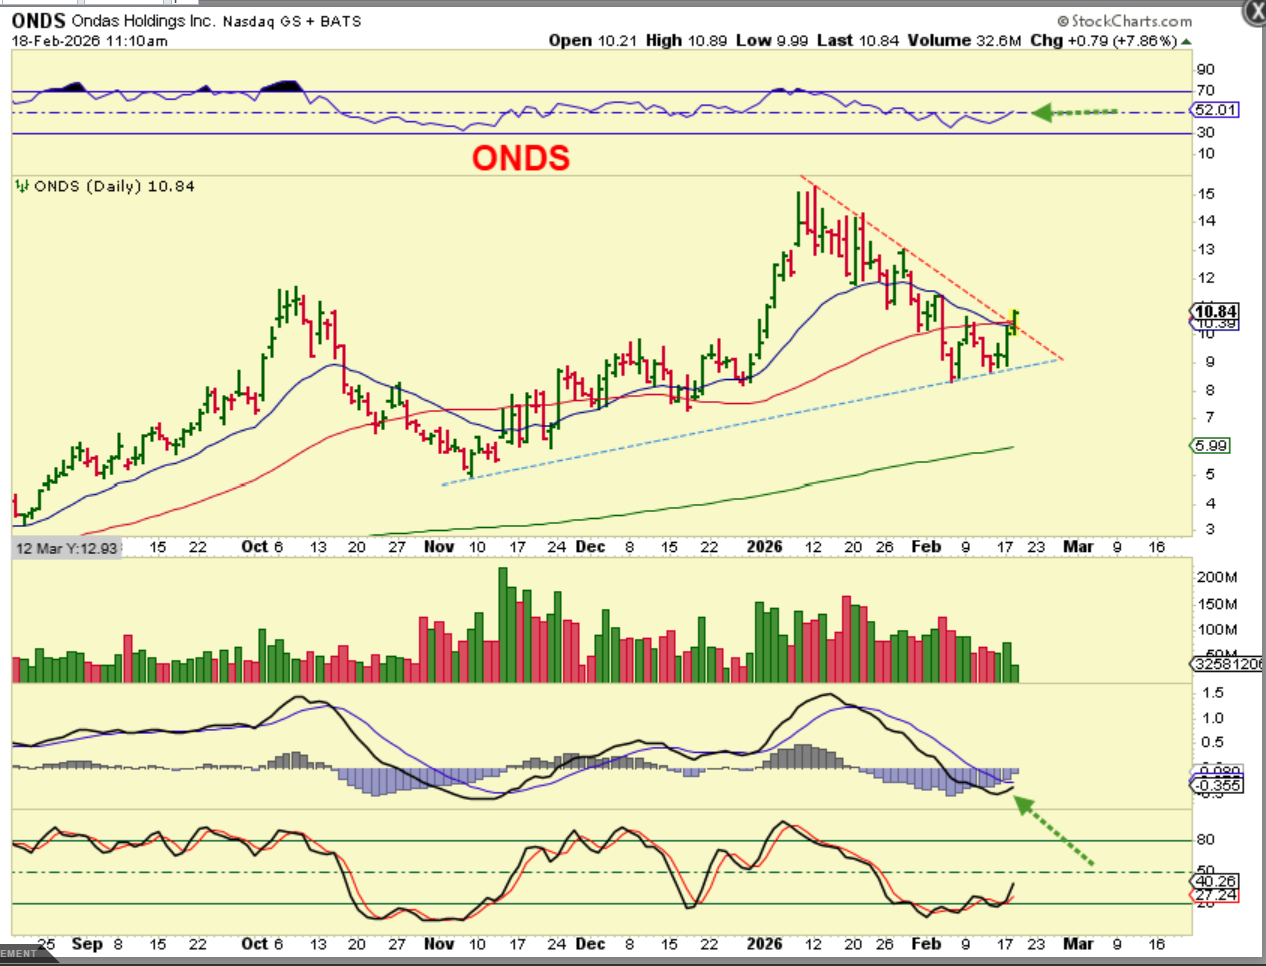
ONDS tried to break the downtrend yesterday, so it is possible that we are starting a 2nd daily cycle.
.
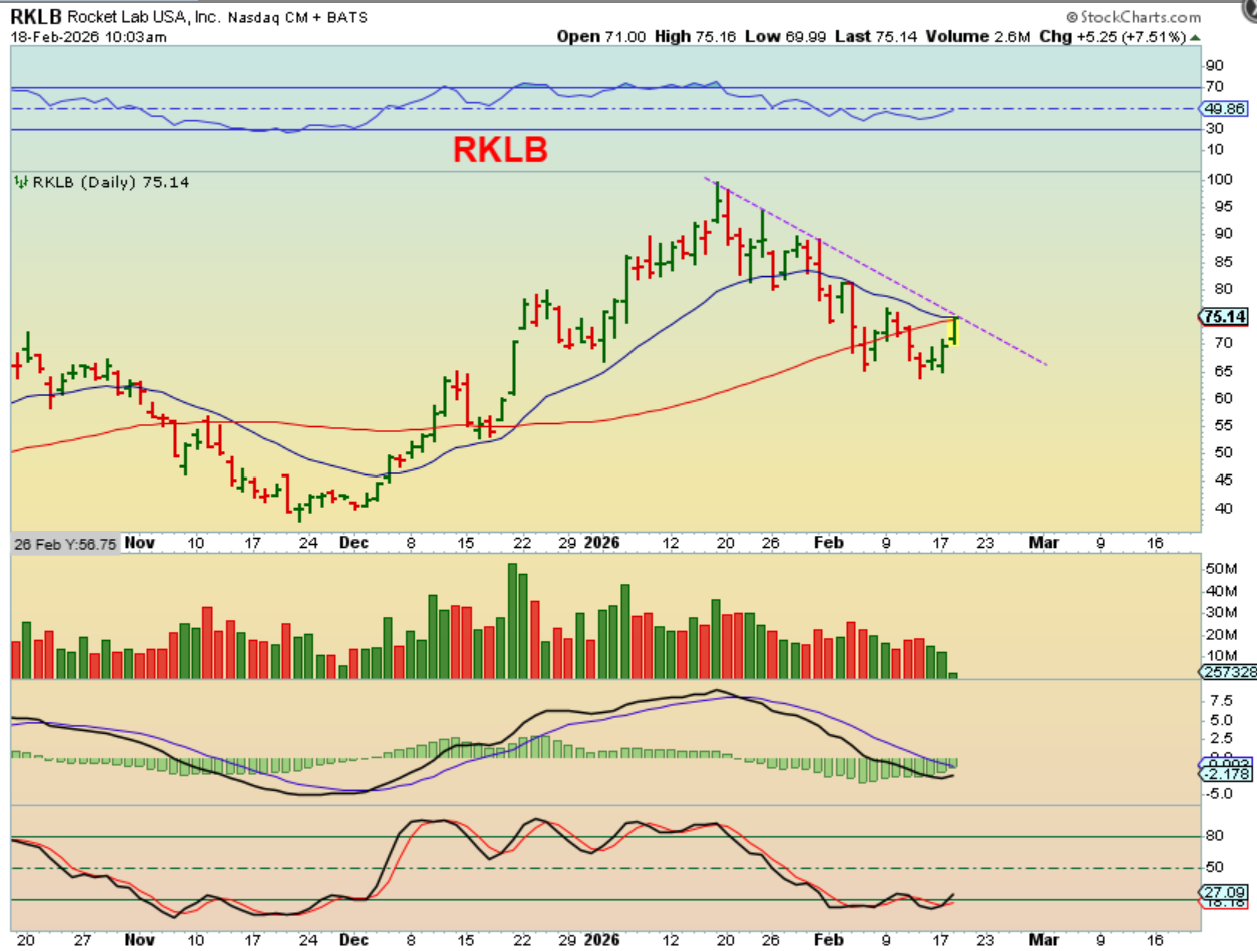
RKLB is pushing on the 50sma and 20 ema after selling off with that dcl drop. It may recover today.
.
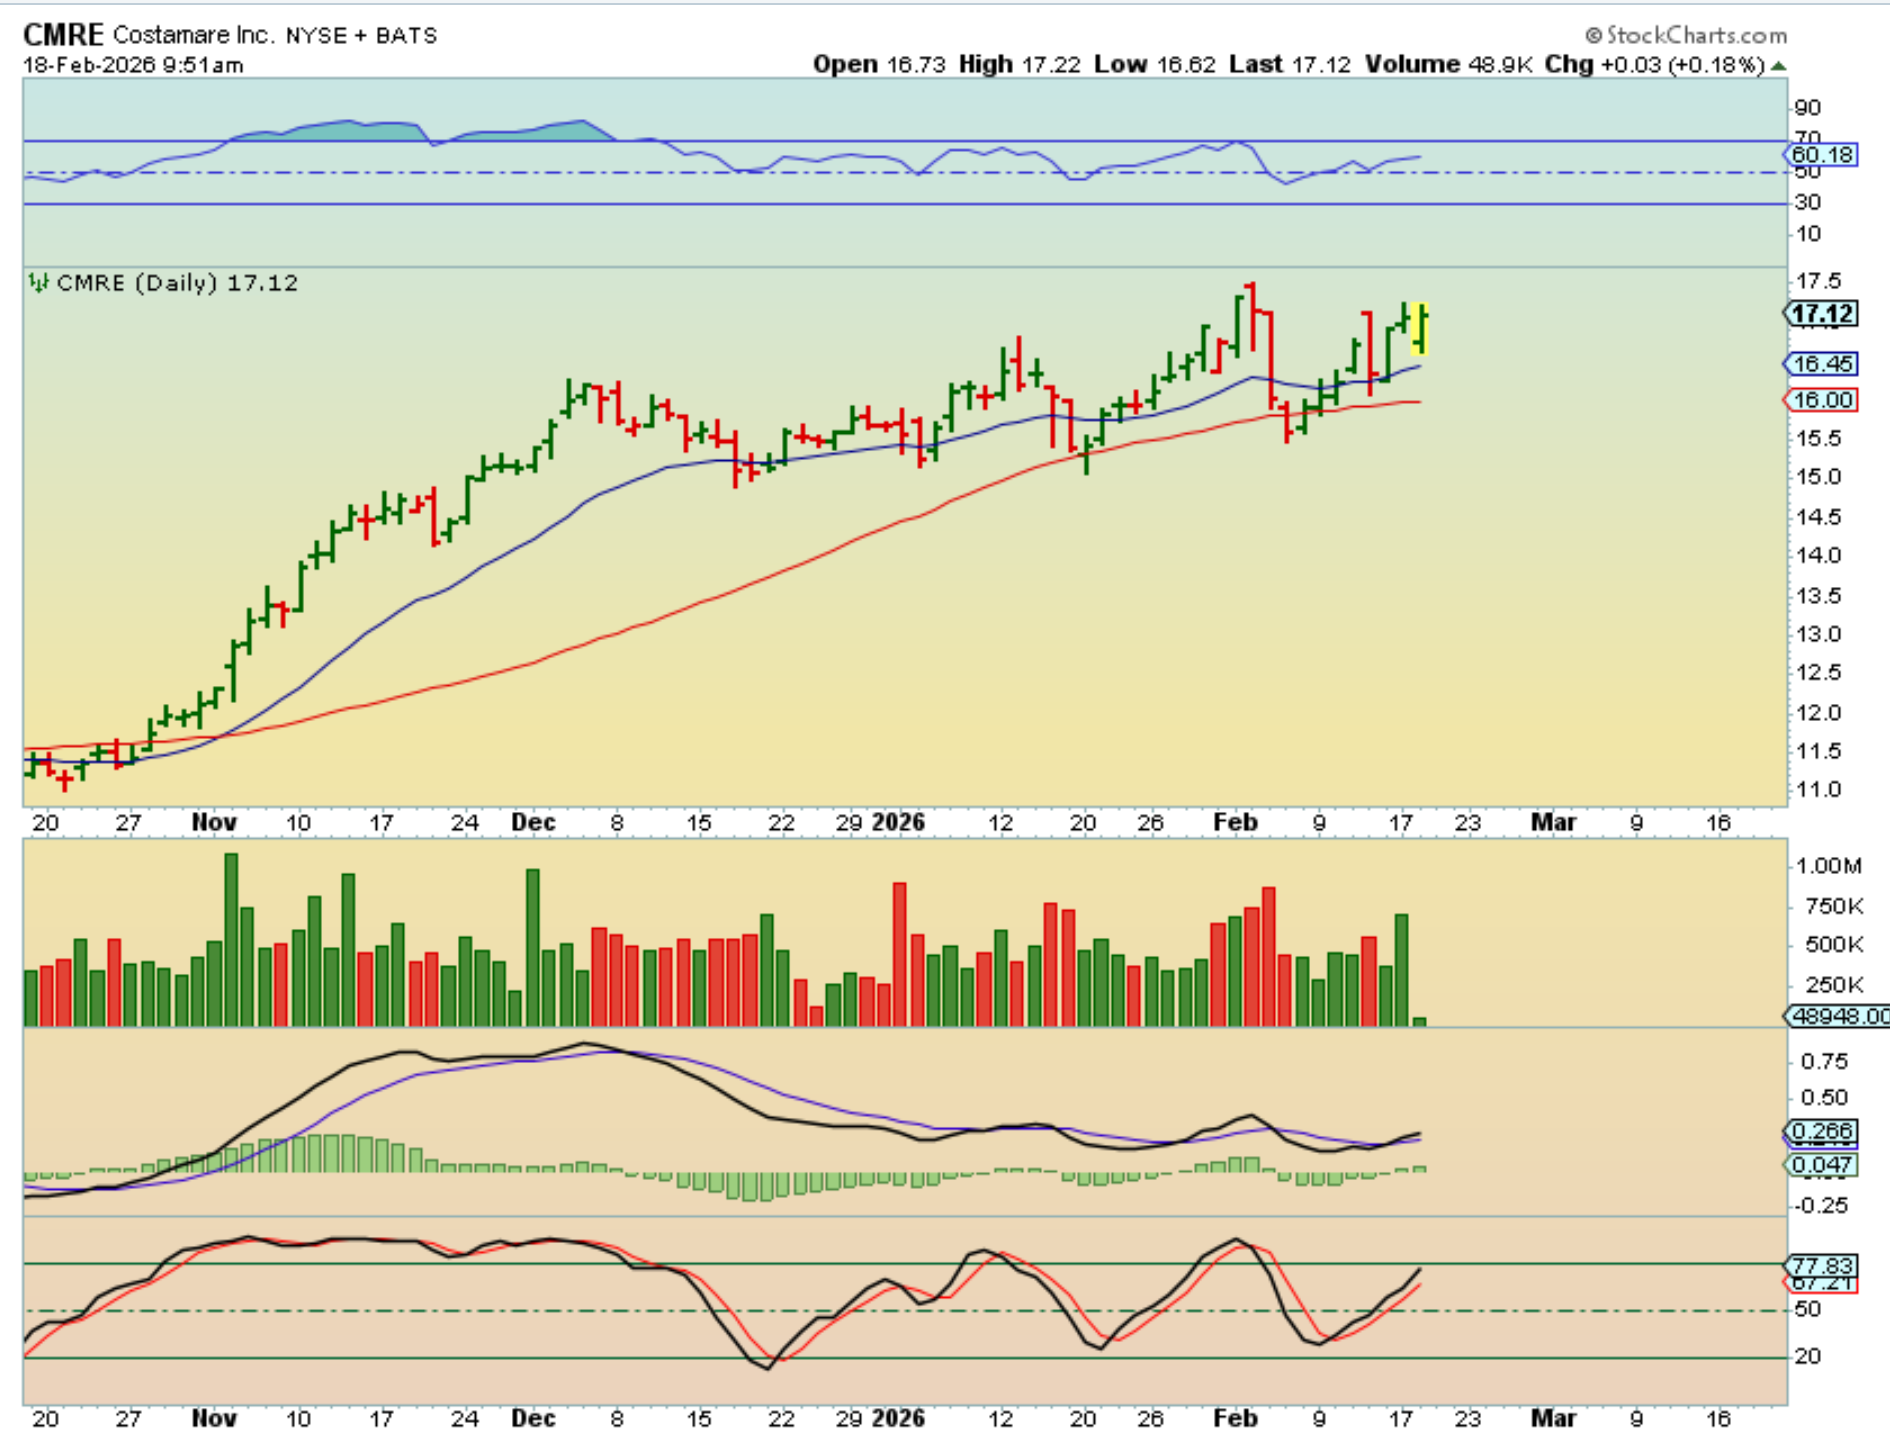
CMRE is a shipping company that released earnings yesterday. I pointed it out as it went Red to Green. Shippers have been bullish with Oils strength. See NAT, SB, SBLK, TK, TNK, etc. Some are extended, so they become ‘buy the dip’.
.
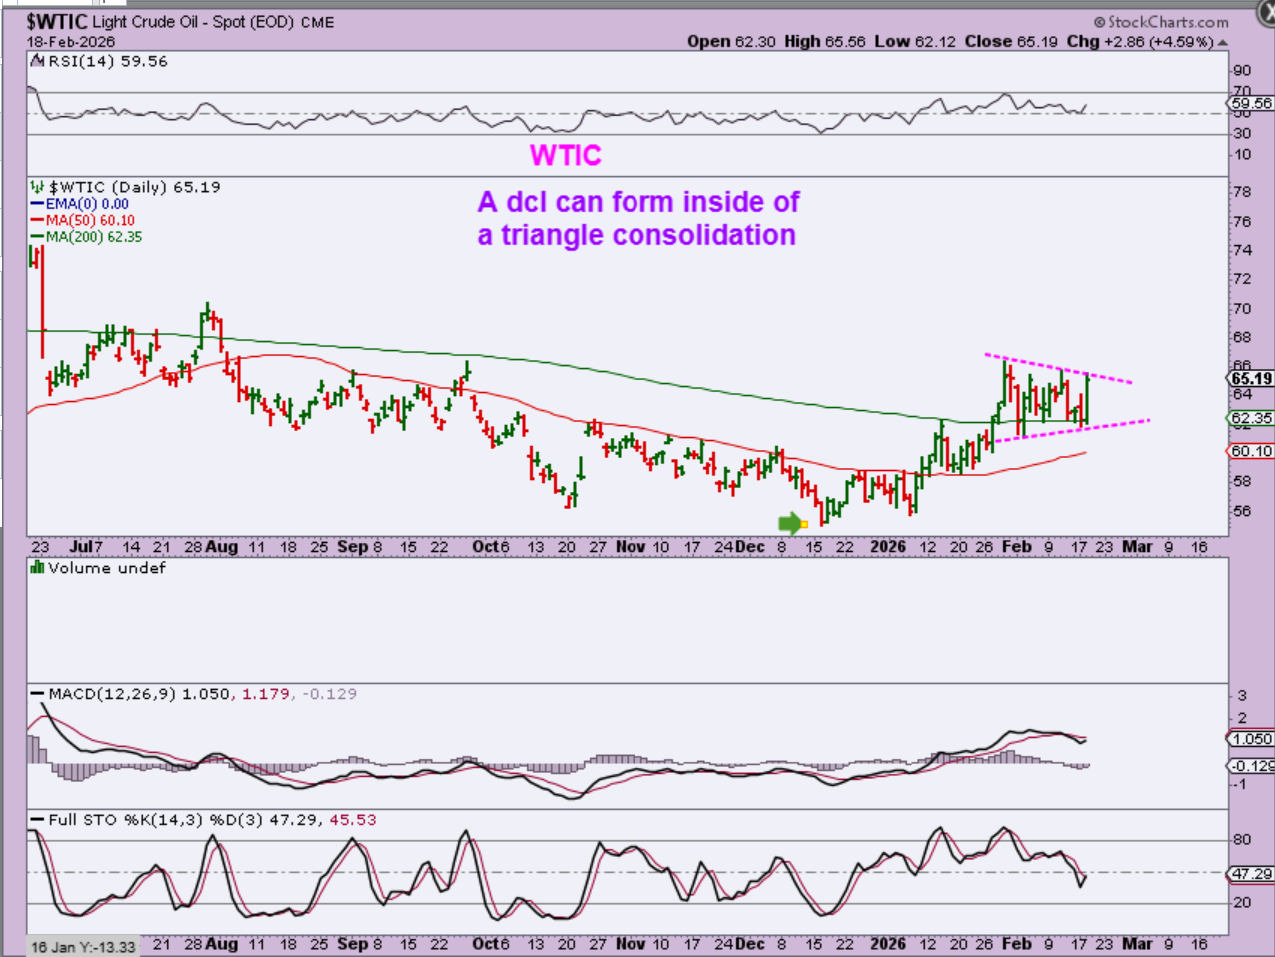
WTIC – Please read the chart, Oil is bullish and above the 50 & 200 sma.
.
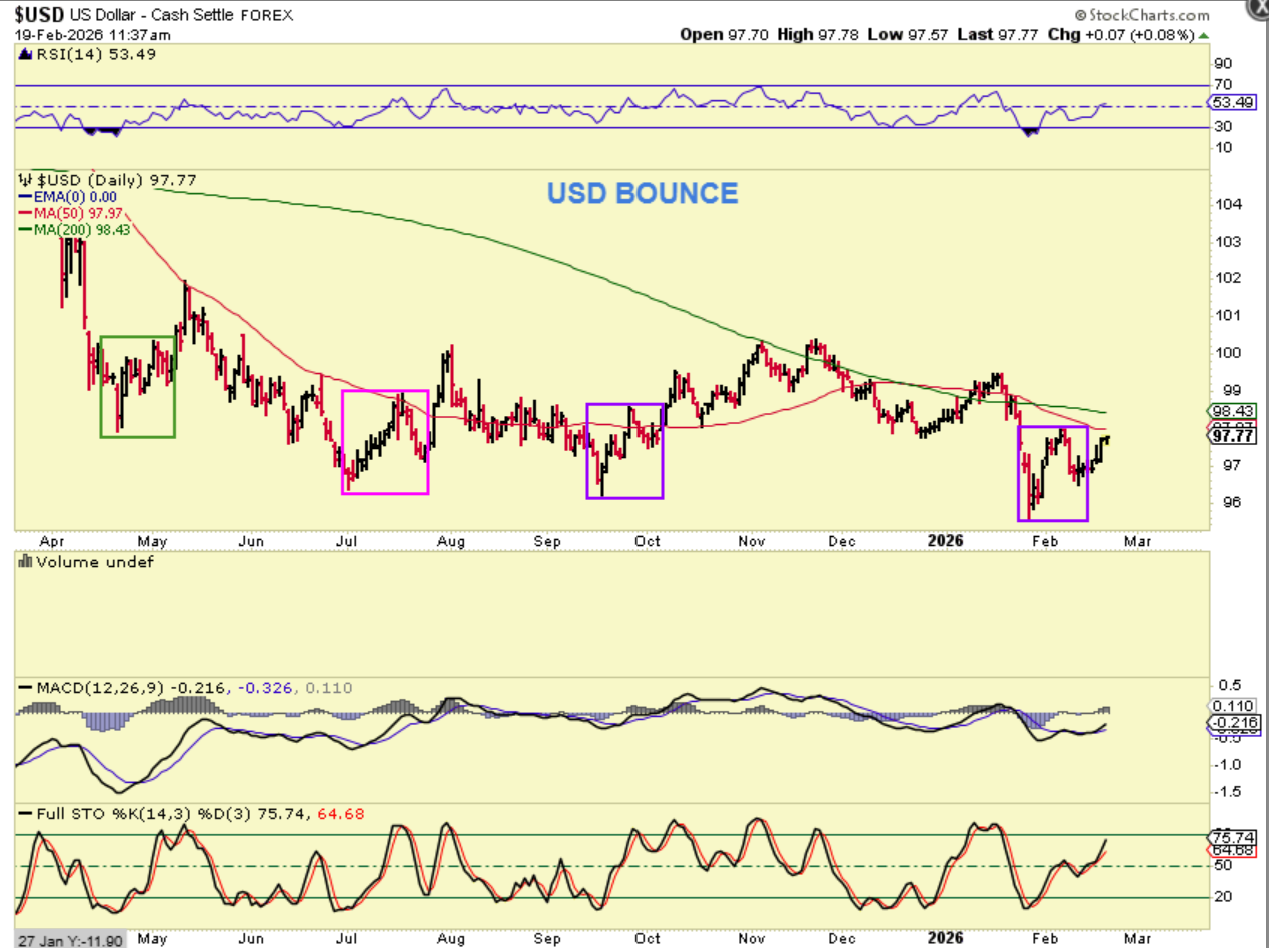
THE USD has started to bounce after a higher low was put in place. This is what I expected, as seen with the ‘boxes’ of prior similar set ups. This bounce has not caused Gold or Silver to sell off.
.
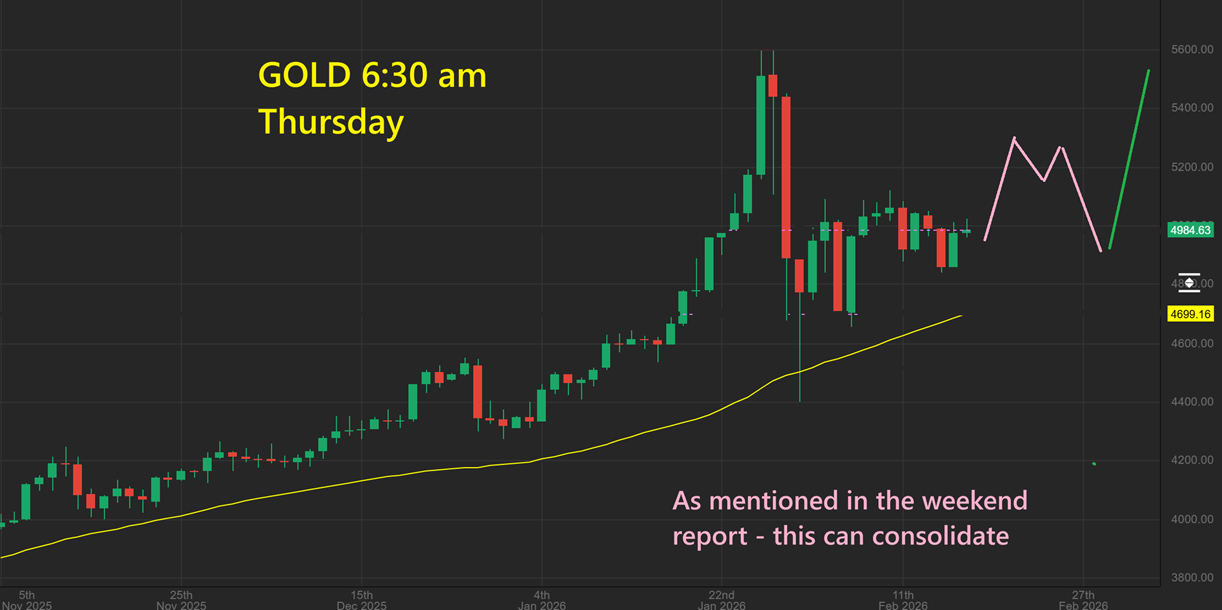
GOLD moved higher on Wednesday and Gold could be in a consolidation after the recent slam down. I mentioned that Gold in 2011 consolidated for a while and then actually made new highs while Silver did not (2011). See the weekend report if you need a refresher on that time period.
.
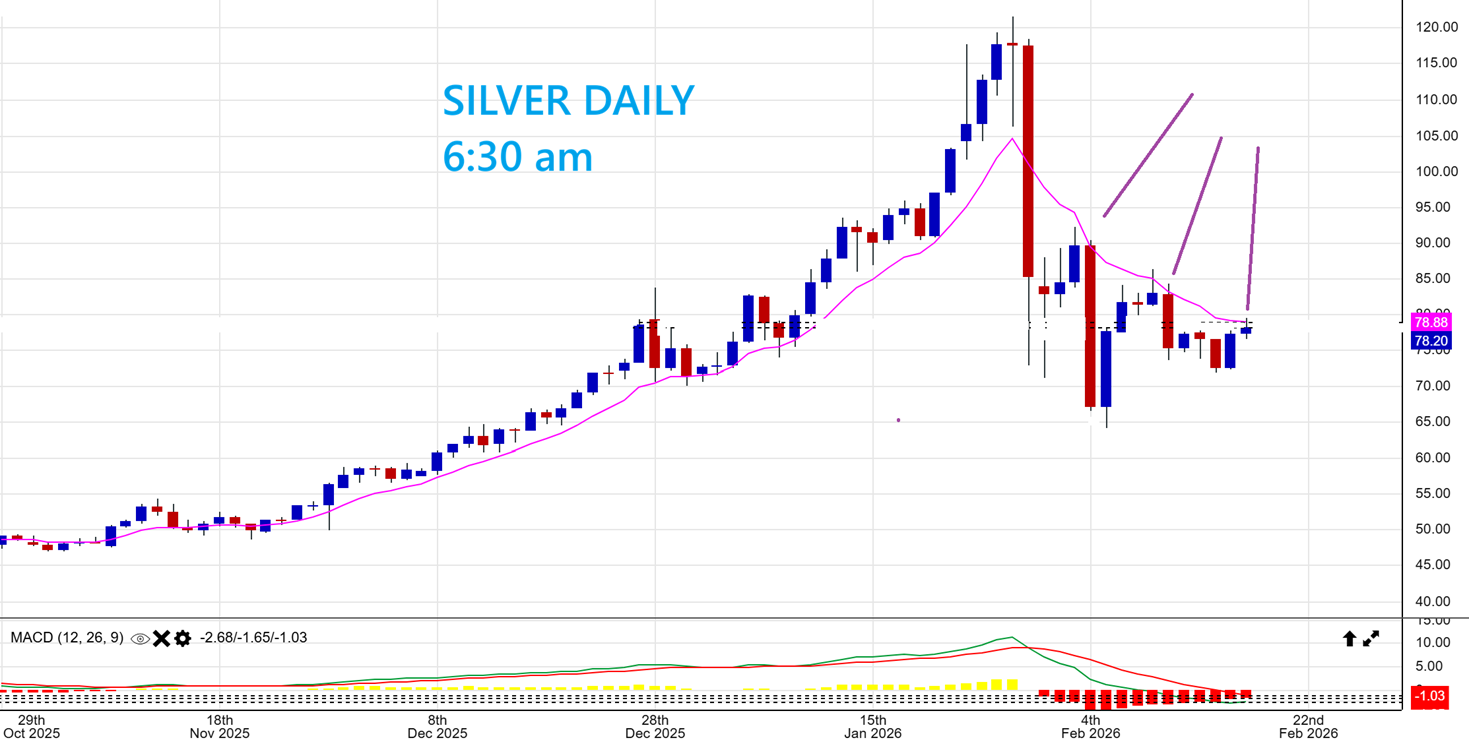
SILVER also moved higher yesterday, but it is still under the 10sma. This is a live chart of Silver this morning.
.
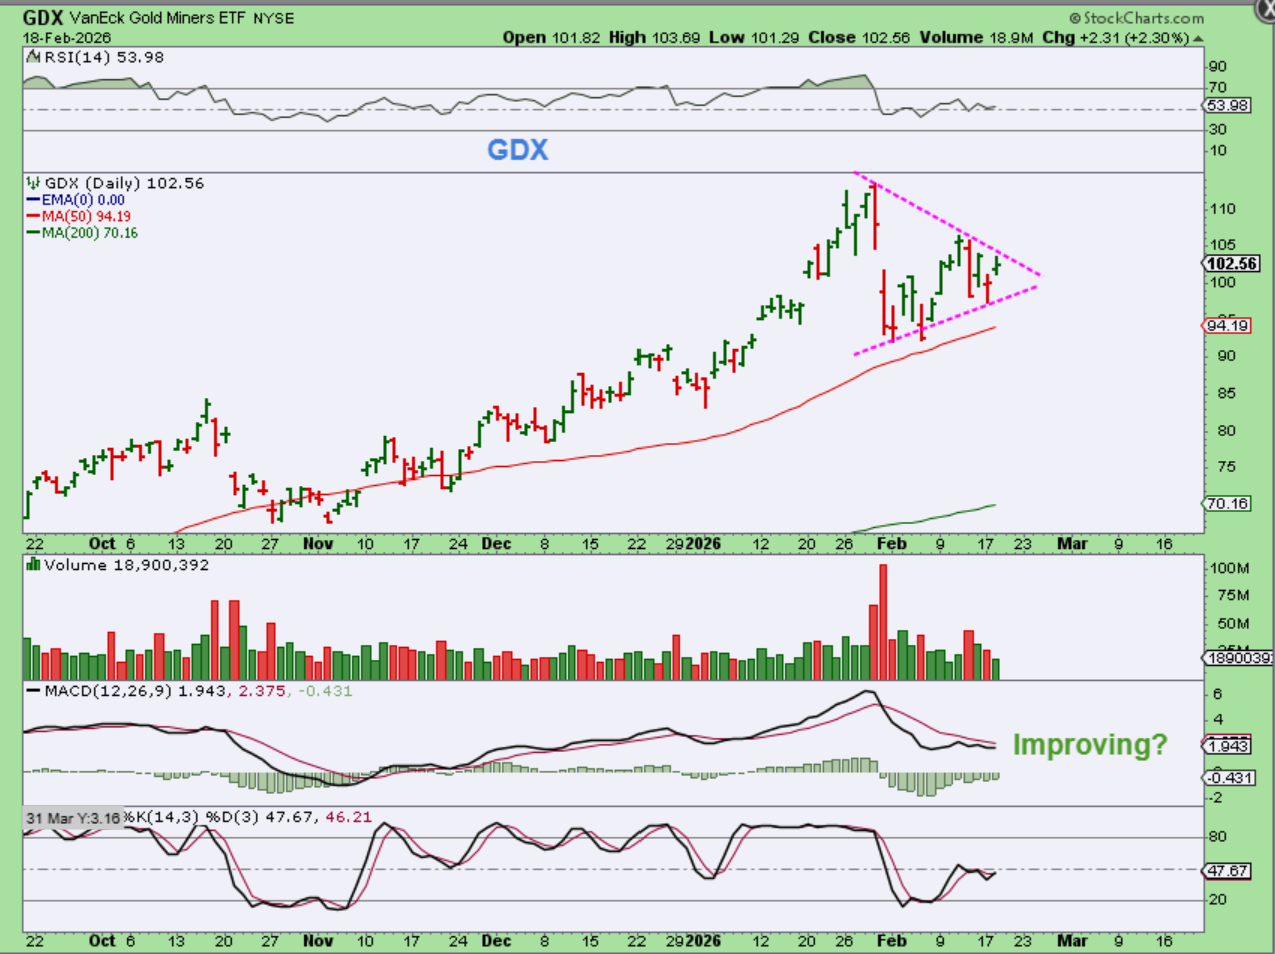
THE GDX follows Gold more than it does Silver, and a triangle consolidation seems to be developing. If Gold and Silver continue higher, then Miners would also.
.
So the chop has been constant in the General Markets were a few days up, then a few days down, over and over and over. I’m hopeful that the markets will stabilize and start a move higher in the 2nd daily cycle. We’ll see.
Oil is bullishly consolidating ABOVE the 50sma. It may be forming a dcl inside of a triangle too.
Precious Metals are in a consolidation after the recent slam down. Gold looks better than Silver, since Silver has not even been able to gain the 10sma. Bitcoin is covered below, enjoy your Thursday trading!
.
~ALEX
.
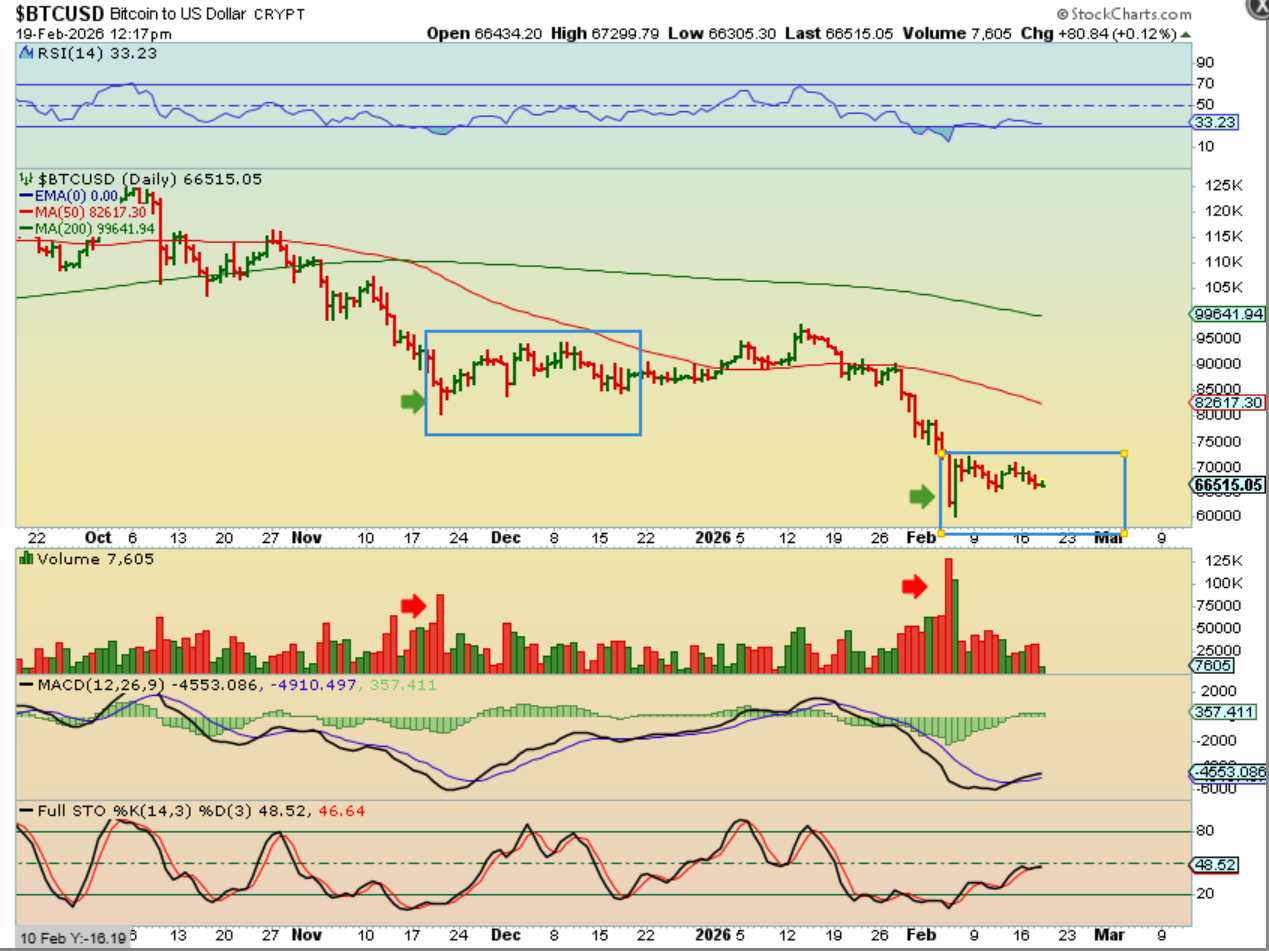
BITCOIN seems to be following a similar (weak) path that it formed at the last capitulation low. So far it is weak and the Crypto stocks are choppy.
Wednesday February 18th – More Choppiness 
 Friday February 20th – Can We Get Some Follow-Through?
Scroll to top