
January 3rd Weekend Report
Important opening statement, please do not skip this opening thought: I have noticed some ‘changes’ recently, but especially on Friday, that will be mentioned again in this report. It could mean a few different things are taking place, and it will take time to see how things develop, but on Friday the NASDAQ and SPX were down for most of the day, but the stocks that I trade were racing higher 10-15%. You will see a difference between The SPX, and The NASDAQ Vs IWM, and SOXX in todays report. Some of our small caps look to have bullish set ups after consolidations of that ICL drop. I also see some of the stronger former ‘leaders’ in large caps looking weak.
So the question is: WILL 2026 be a year to focus on small cap stocks and will big money start pushing these much higher (AI, Aviation, Quants, Software, Robotics, Rare Earth, etc), or is everything going to get choppy while the large caps consolidate and ull back? We’ll see, but on Friday, I made very good gains trading the stocks that we have focused on in 2025, with the SPX & NASDAQ down all morning. Let’s take a look at the charts and you’ll see exactly what I am talking about.
.
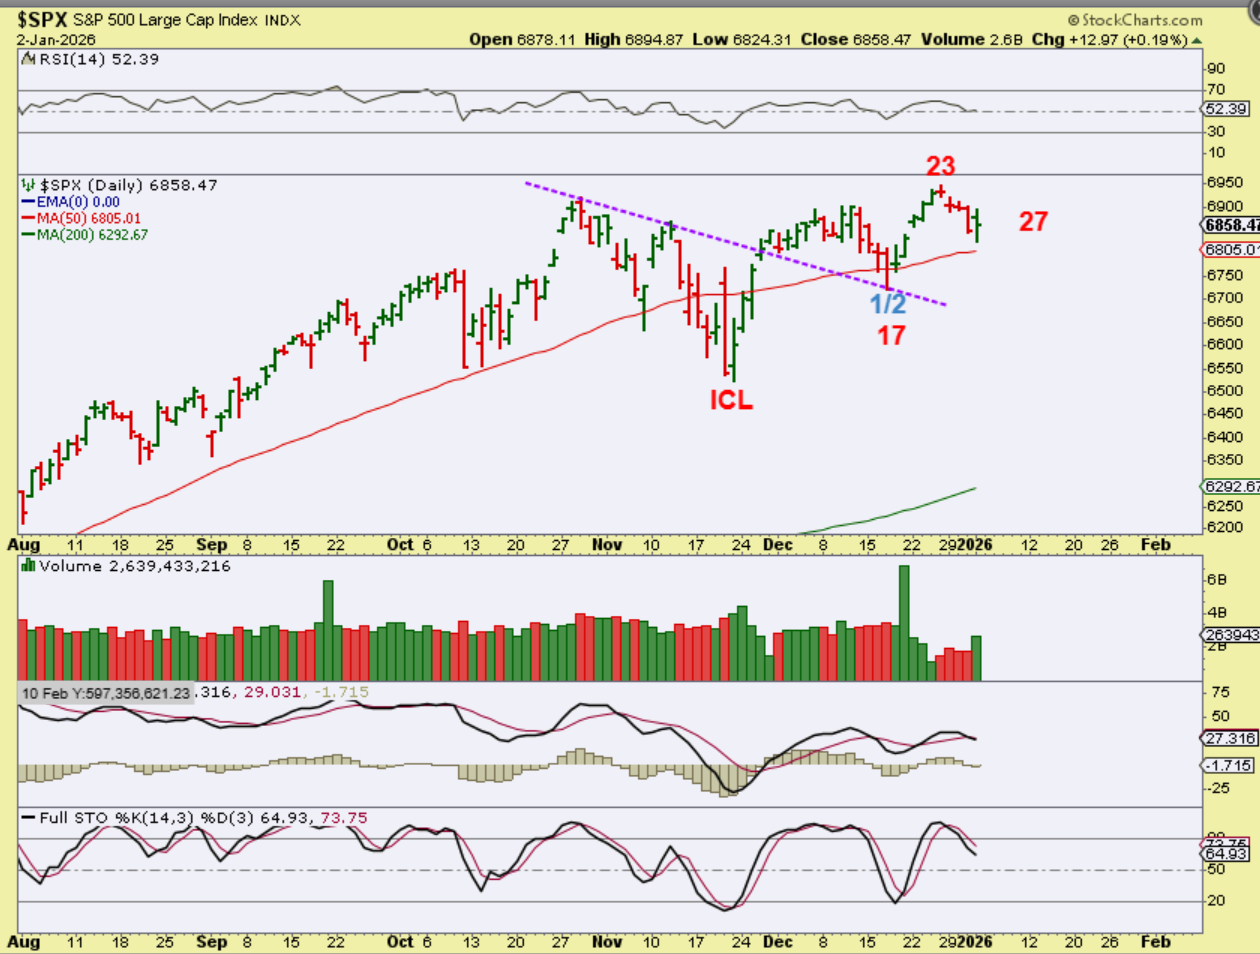
I start by saying that THE SPX looks just fine. It did gap open and sold off immediately to red, being red all morning, but then it bounced into the close. This looks fine and remains bullish.
.
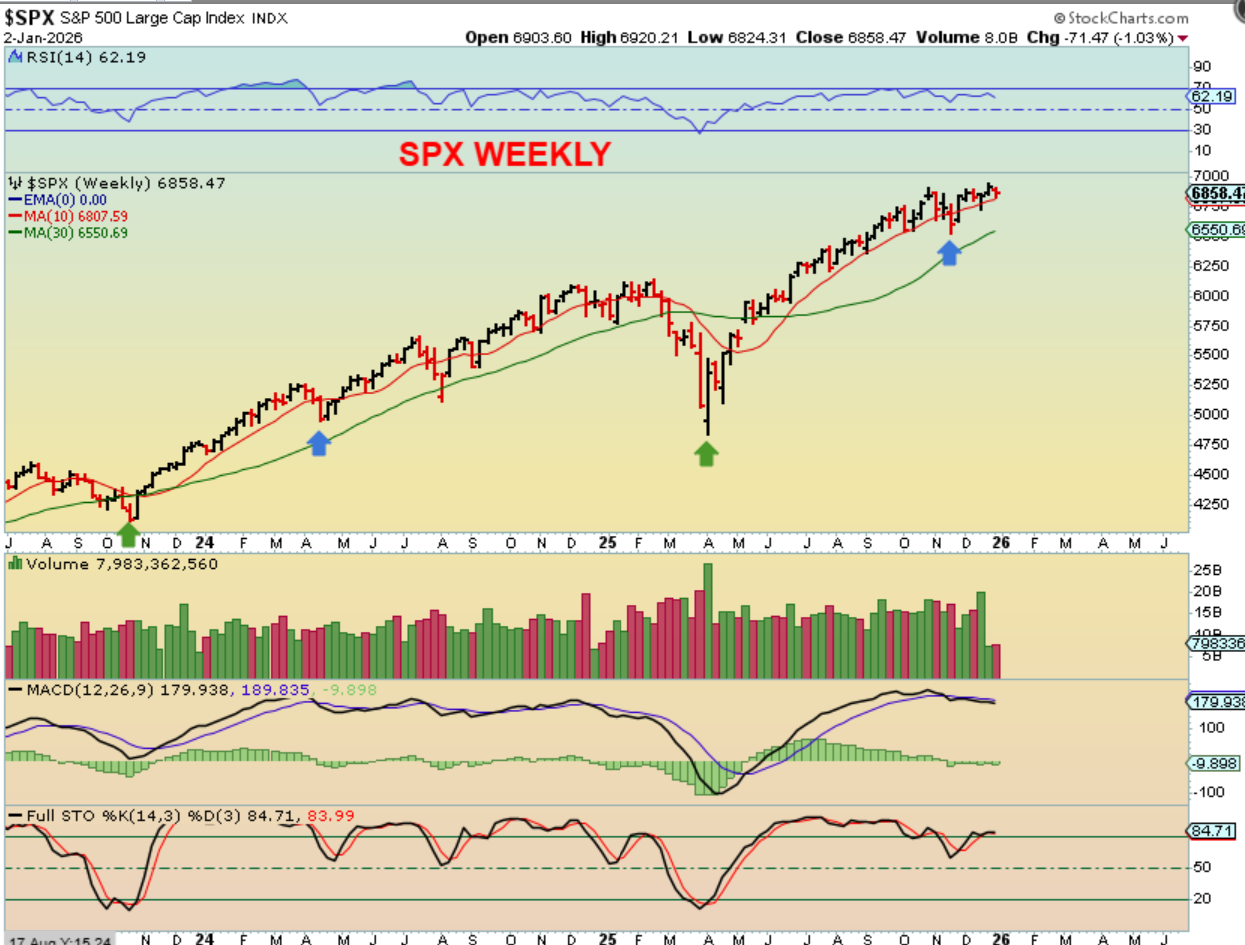
THE SPX WEEKLY held the 10-week ma this week after breaking it and recovering it at the ICL and half cycle low. Again, the SPX is fine at this point.
.
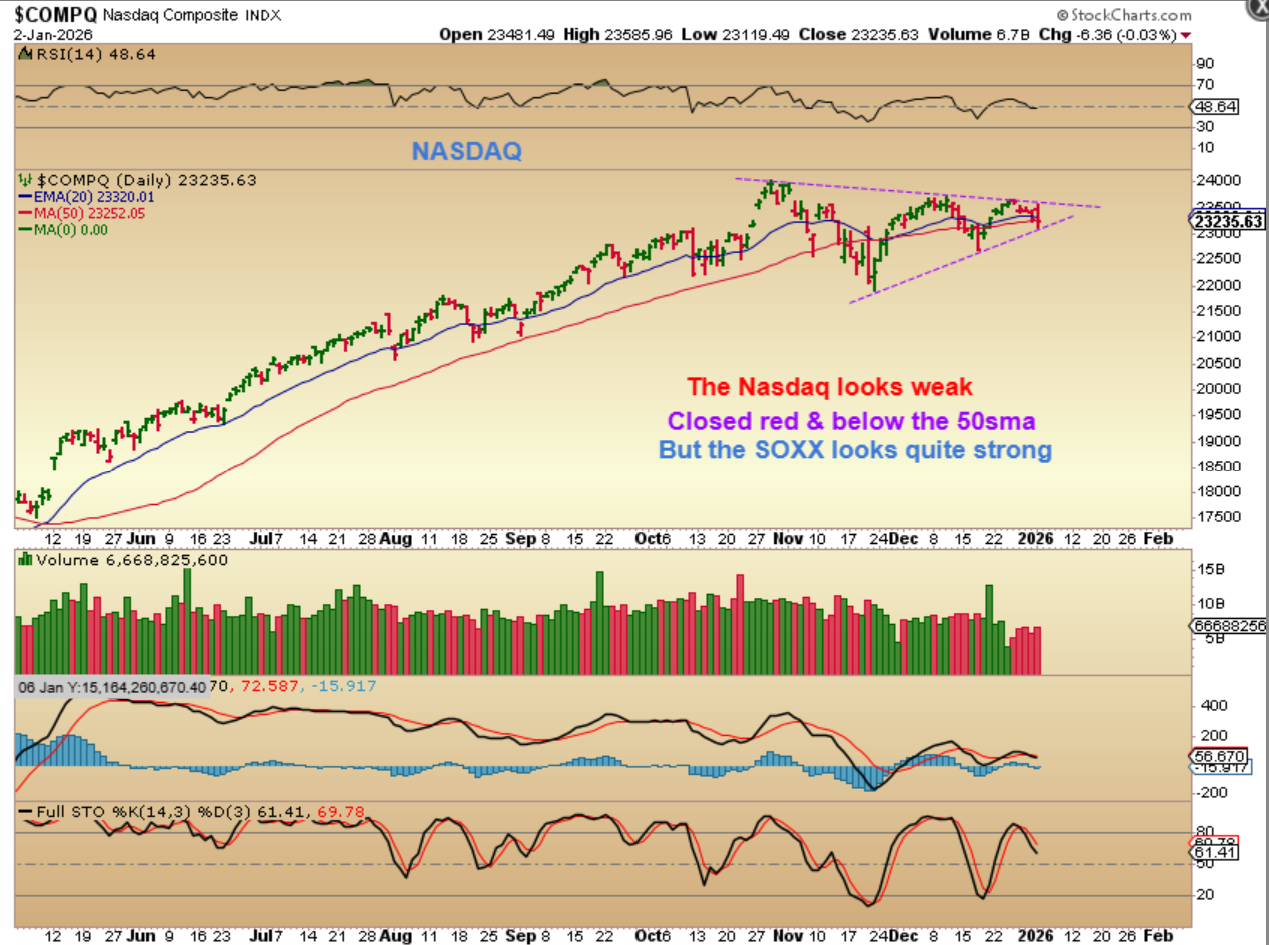
Now we look at The NASDAQ DAILY and you’ll see a bullish triangle if it breaks out higher, but it looks a bit weak. It closed below the 50sma and at the triangles lower line , so it needs to recover that 50 sma next week. If it drops further, the RSI 50% will be lost, the 50sma is lost, the triangle breaks lower, and the MACD is crossing lower. Along with this let me show you more…
.
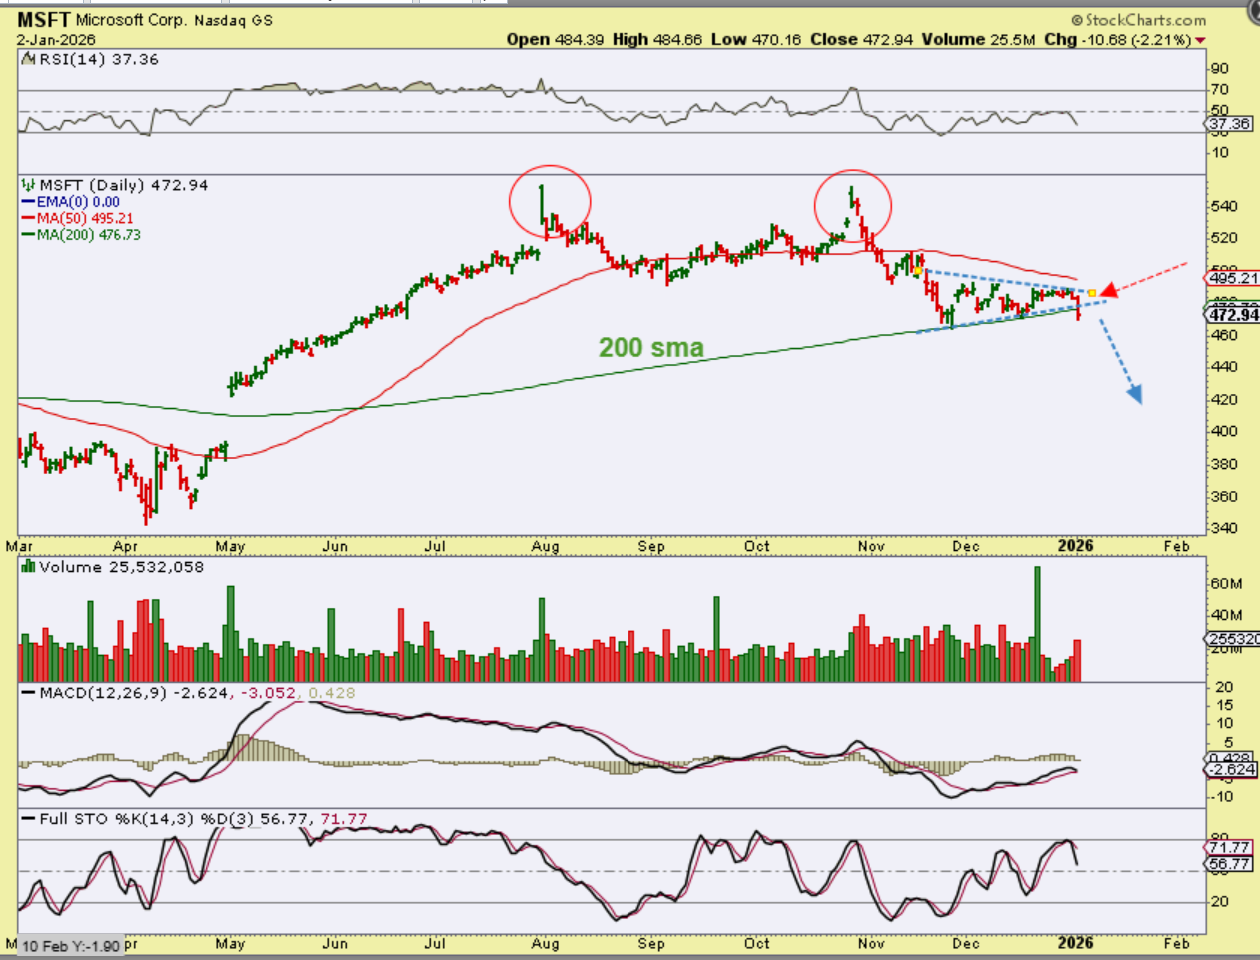
MSFT was a leader out of the ICL in April, but it has a double top and then it lost the 50sma in November. Friday it closed below the 200sma. That also looks like a continuation pattern after the drop from the second top, so I would expect more downside here. And…
.
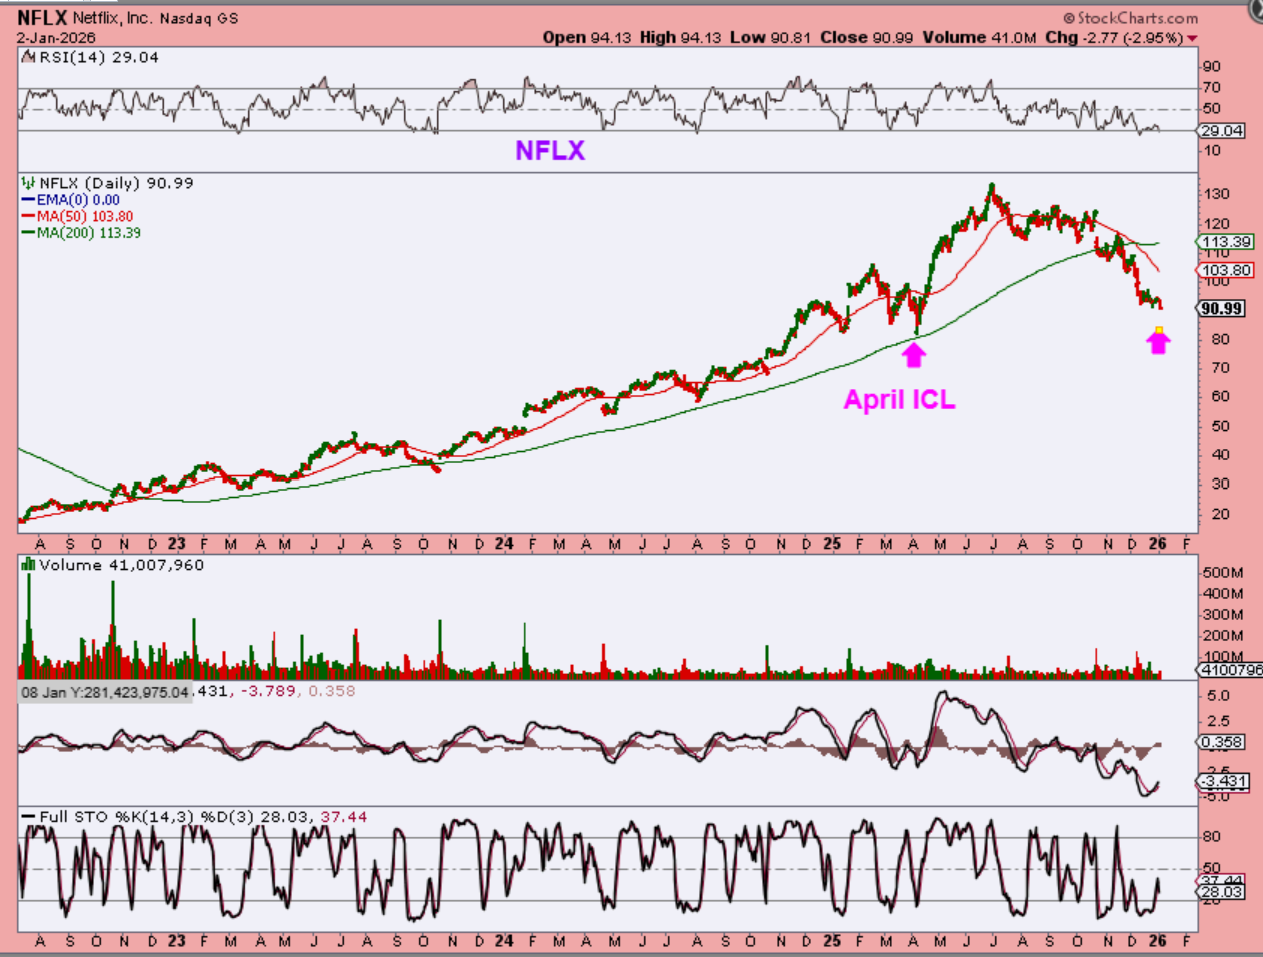
NFLX is even worse. It lost the 50sma and then also lost the 200sma. If you look at NFLX in 2025 alone, It is almost back to the April ICL. So…
.
One more for now:
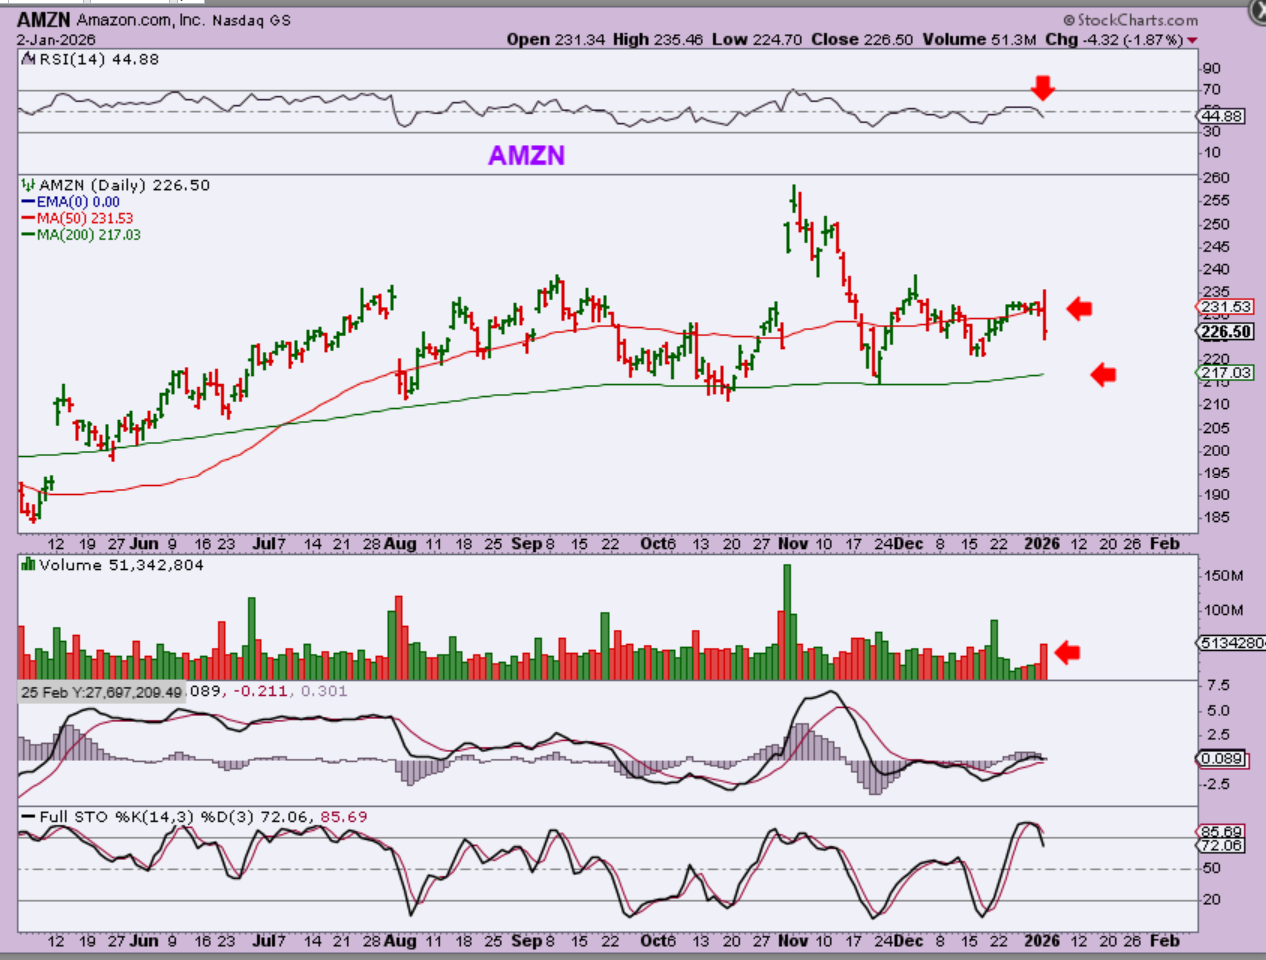
AMZN is a company that just about everyone uses now. Very popular, it was very strong, but in 2025 it has become choppy and consolidating gains, but is it about to sell off too? After a strong October rally it sold off just as quickly. Friday it lost the 50sma and will head down to the 200sma again. So some of these Big leaders are not good buy and hold any more, and sellers are showing up. WILL THESE BUYERS HEAD OVER TO OTHER AREAS? Well…
.
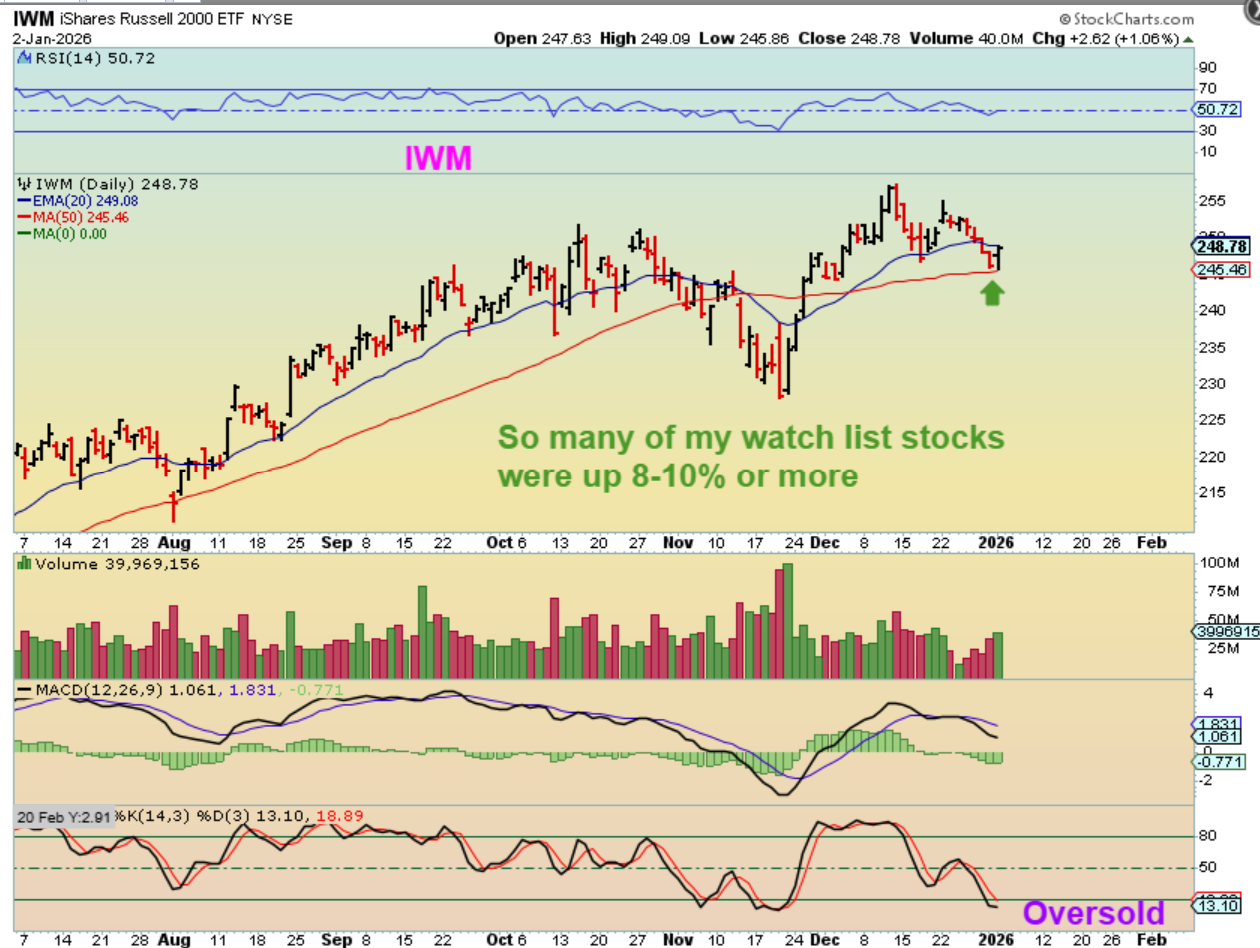
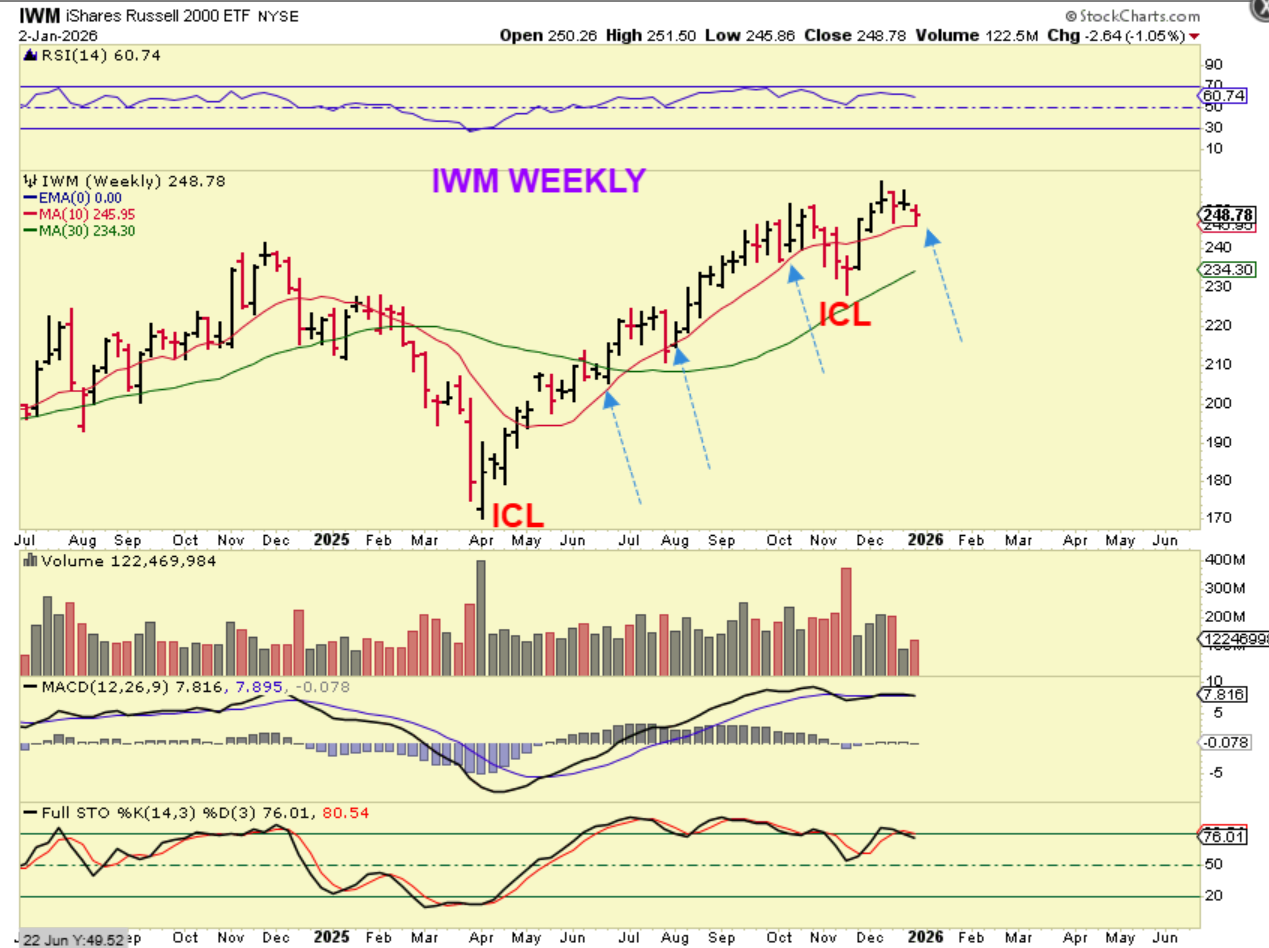
Take a look at what The IWM did on Friday. It reversed at the 50sma and closed up nicely, and many small cap stocks did the same. As mentioned on this chart, many of the stocks that we have been trading here at Chartfreak did very well on Friday. Let me show you just a couple of the ones that I have liked and pointed out at our ICL.
.
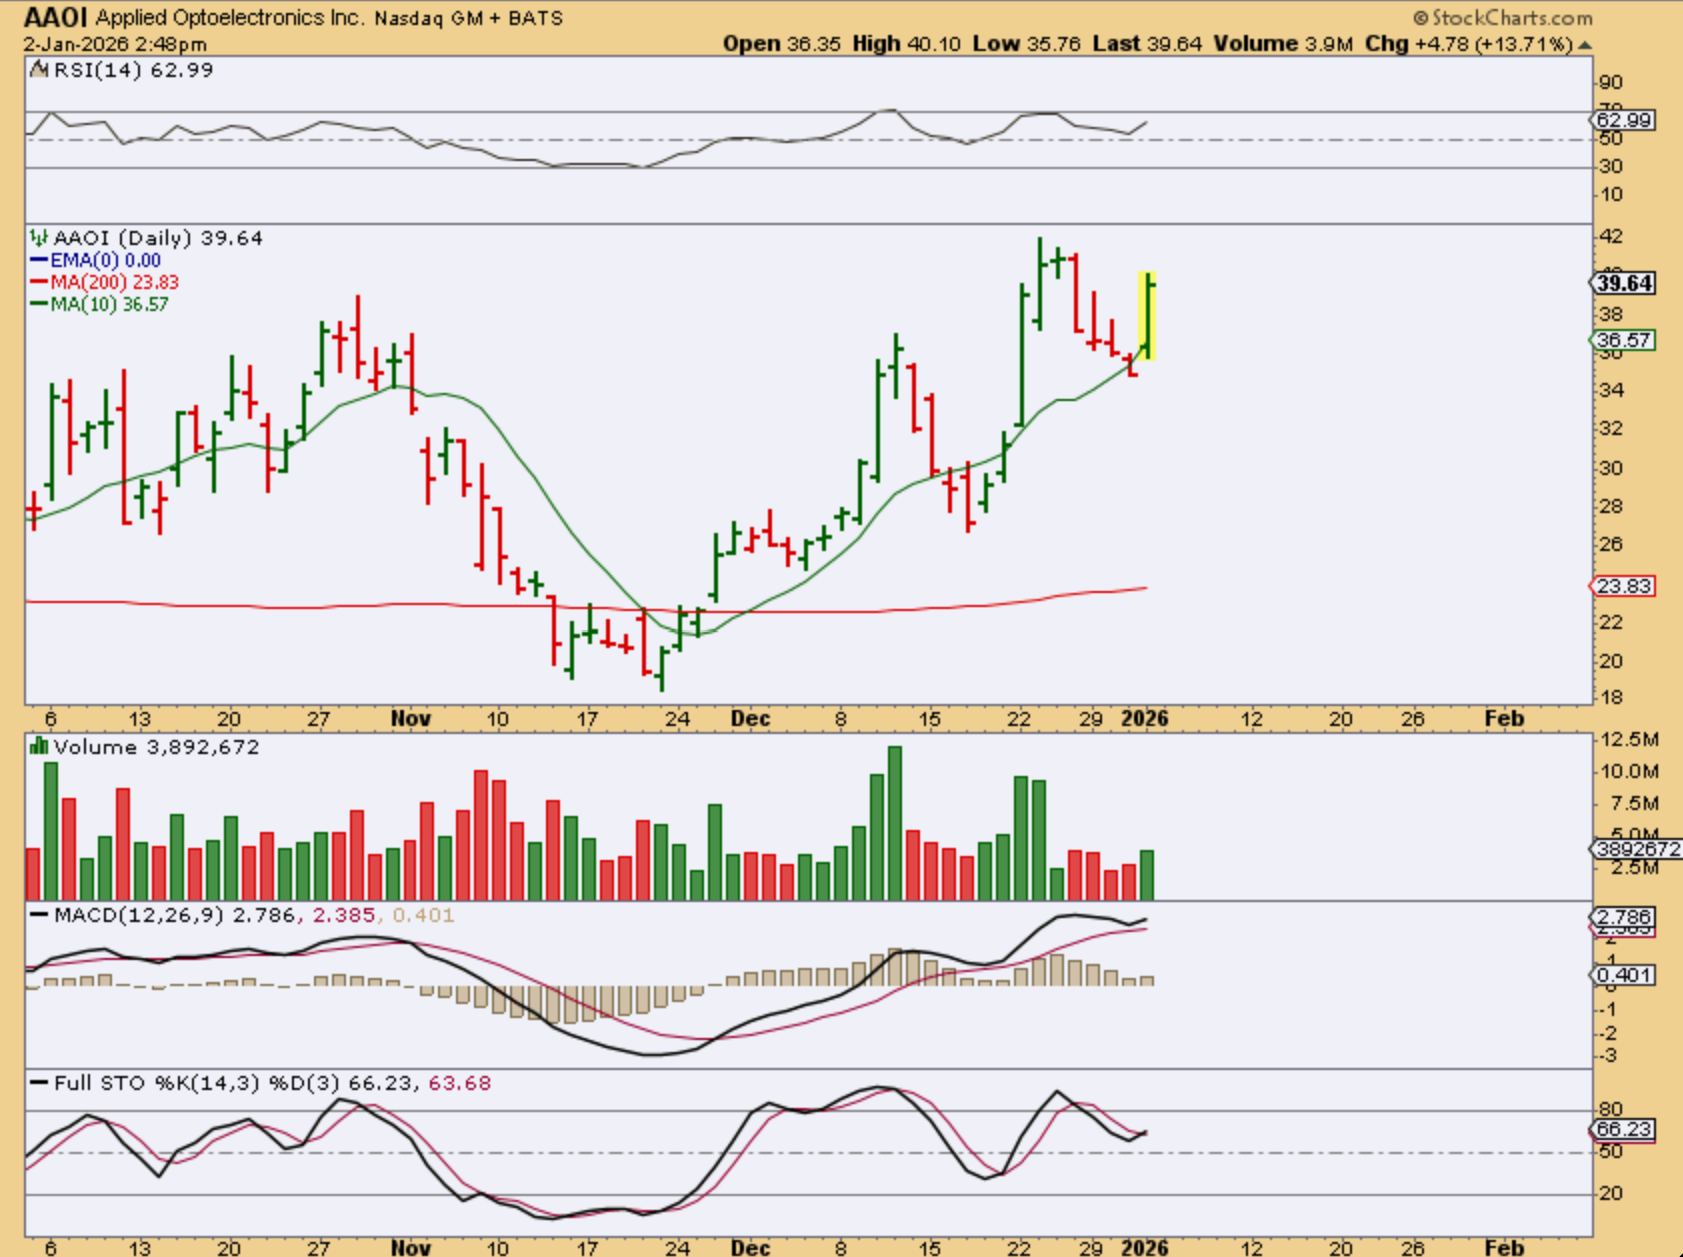
AAOI – Not an easy ride, since it does make very large swings, but AAOI has already doubled out of that November ICL low. And again, it was up 14% on Friday, when the Nasdaq was Red.

.
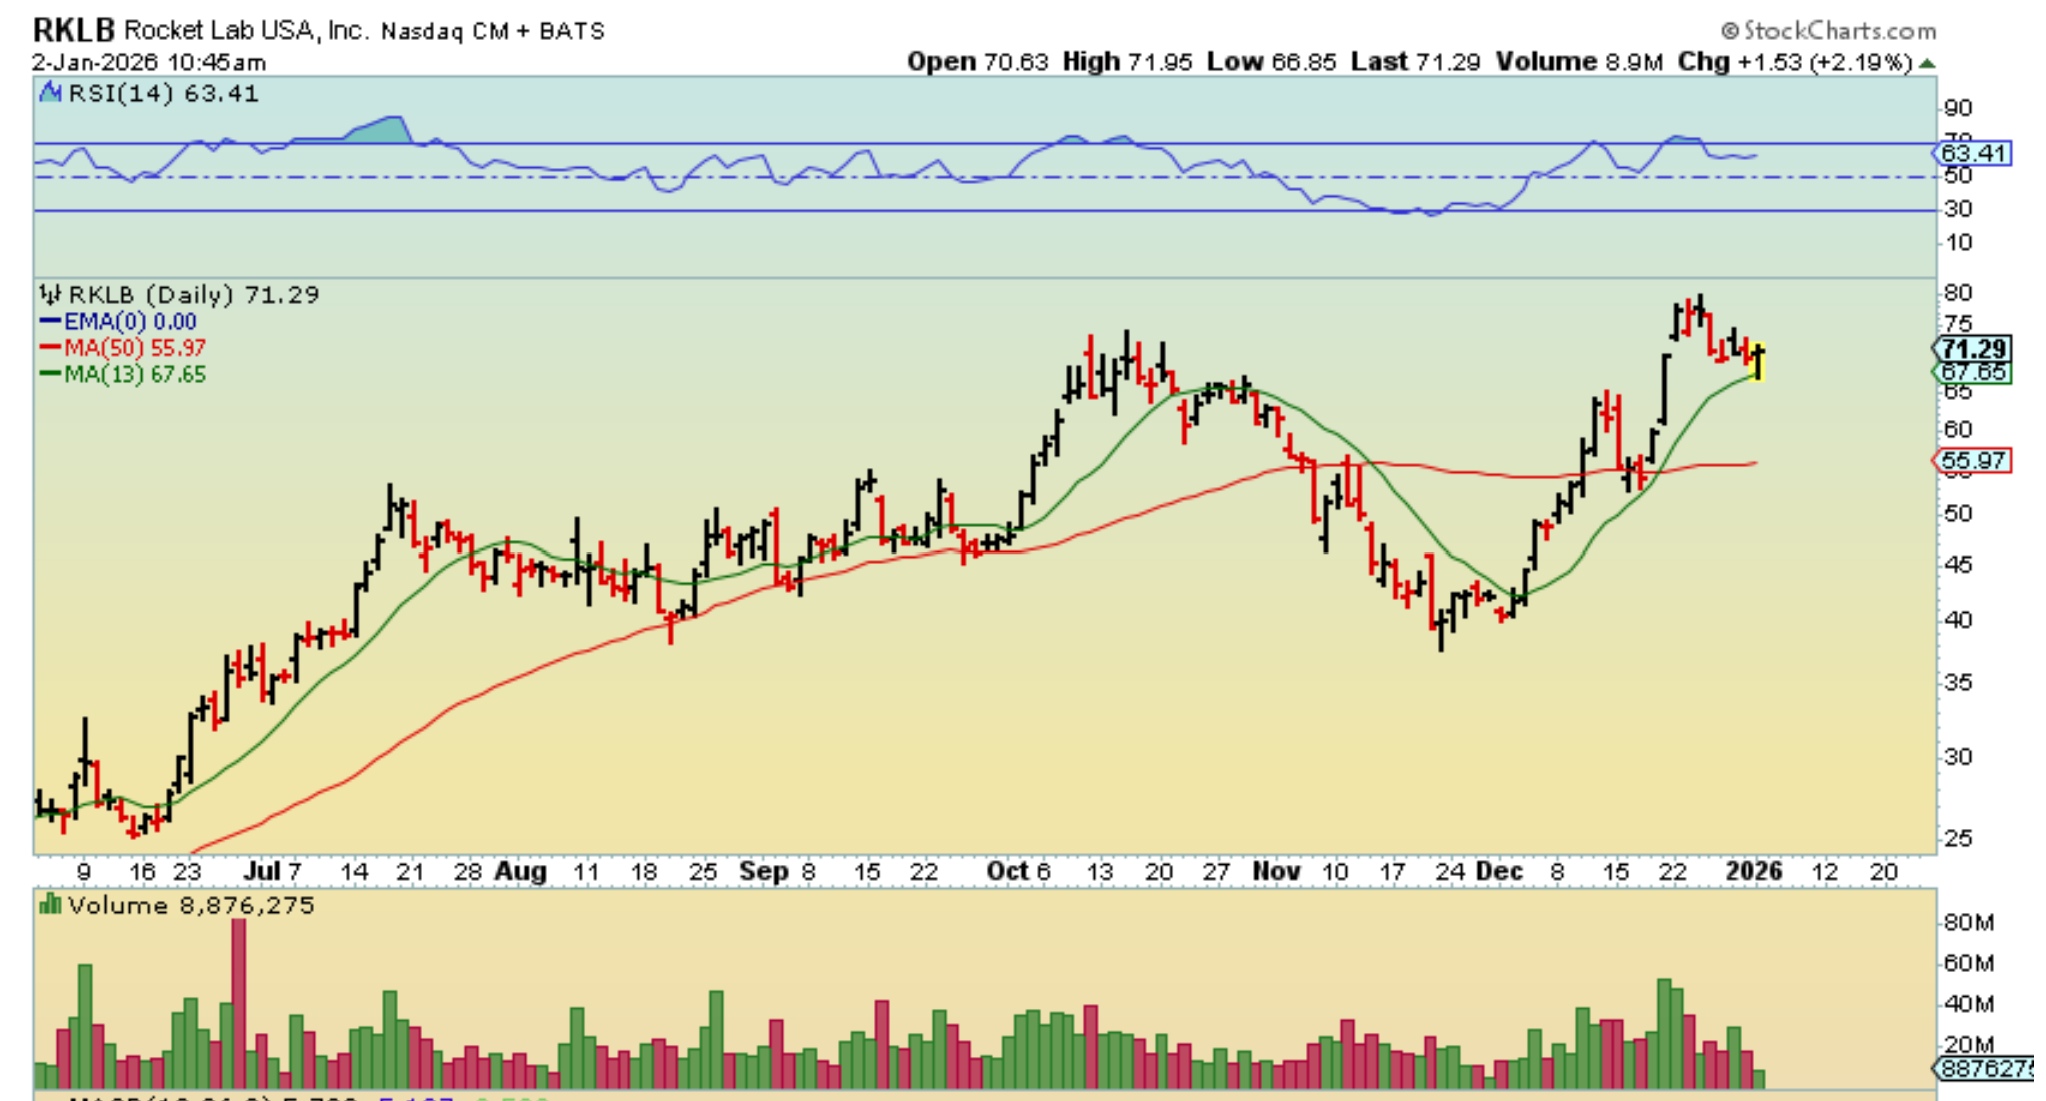
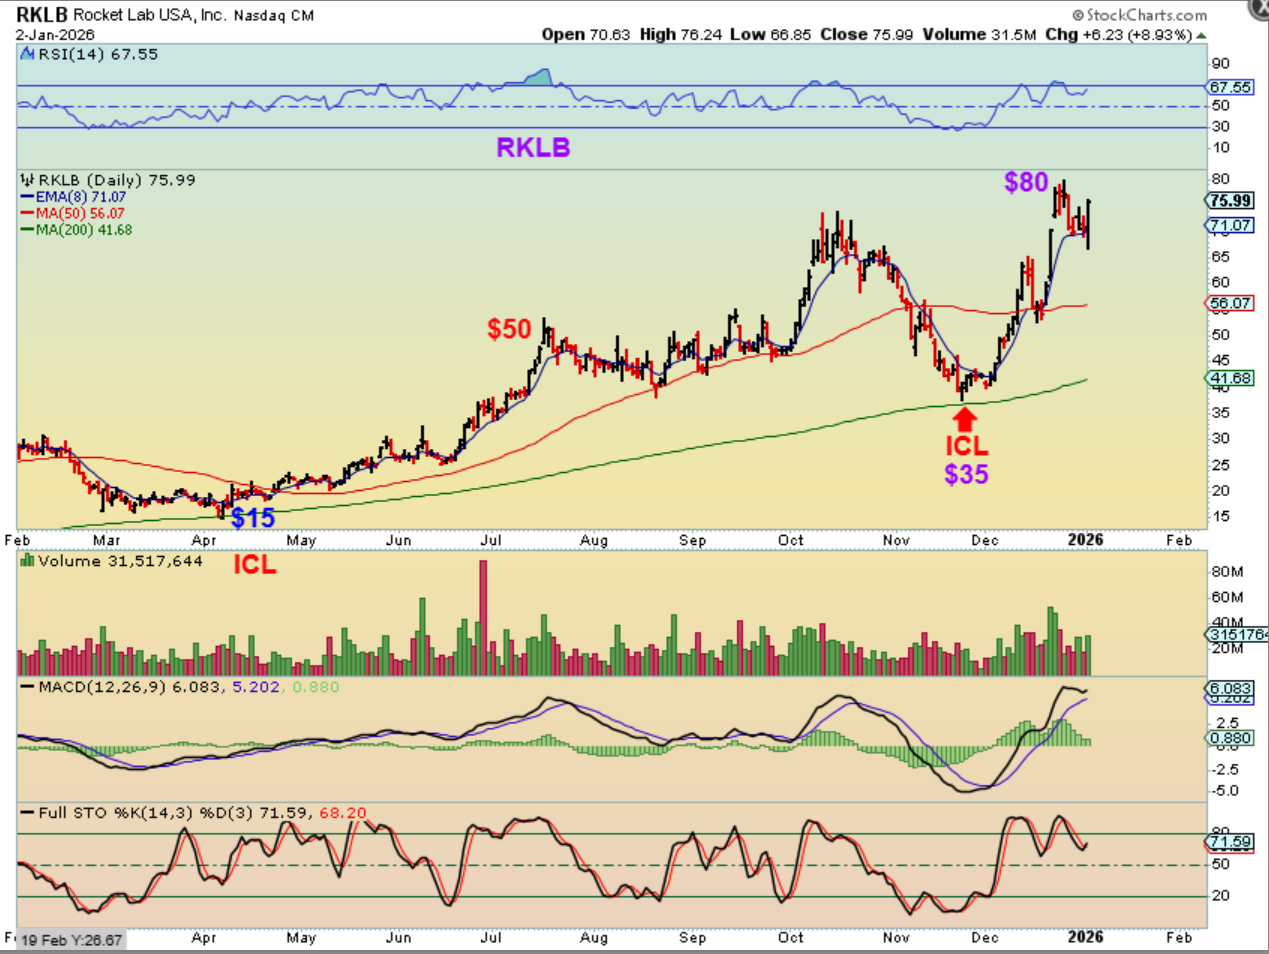
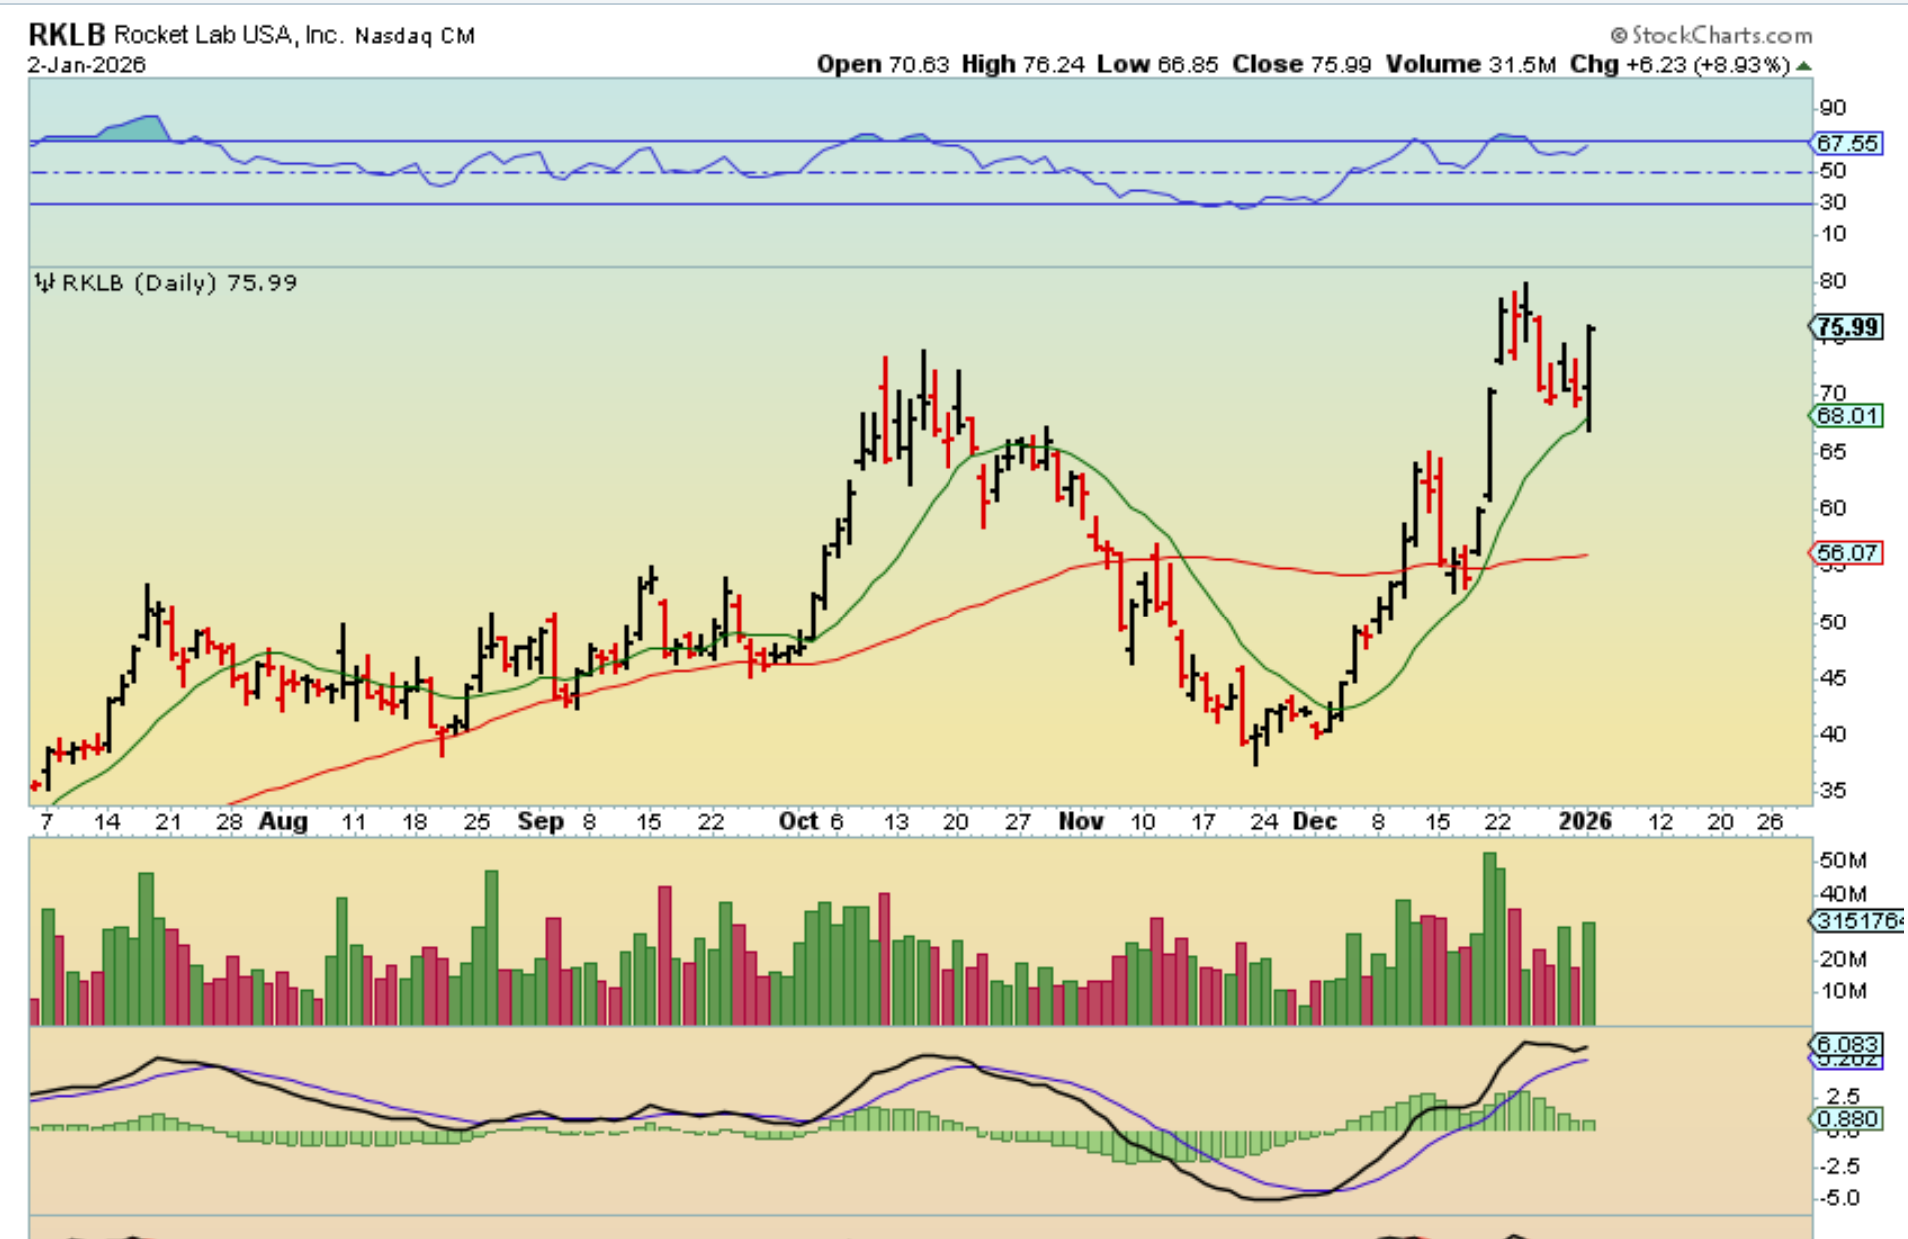
I personally have both ‘traded’ and did a ‘buy & hold’ on RKLB. It also came out of the ICL at $35 and doubled to $80. It started to move higher Friday, so I grabbed this chart to point it out as a lagger red to green. It was up 2% here, but it closed up 9%.
.
RKLB big picture: RKLB was $15 when I first started to mention it after the April ICL, and it is now near $80 (400% gain – to be honest, I traded in & out and I did not buy and hold and make those gains). If it was buy and hold, you may have been stopped out for the last ICL drop (which we knew was coming) and you may have rebought the reversal at the 200sma. It doubled since then. RKLB was up 9% on Friday when the Nasdaq was red and looks ready to break out to new all-time highs again.
.
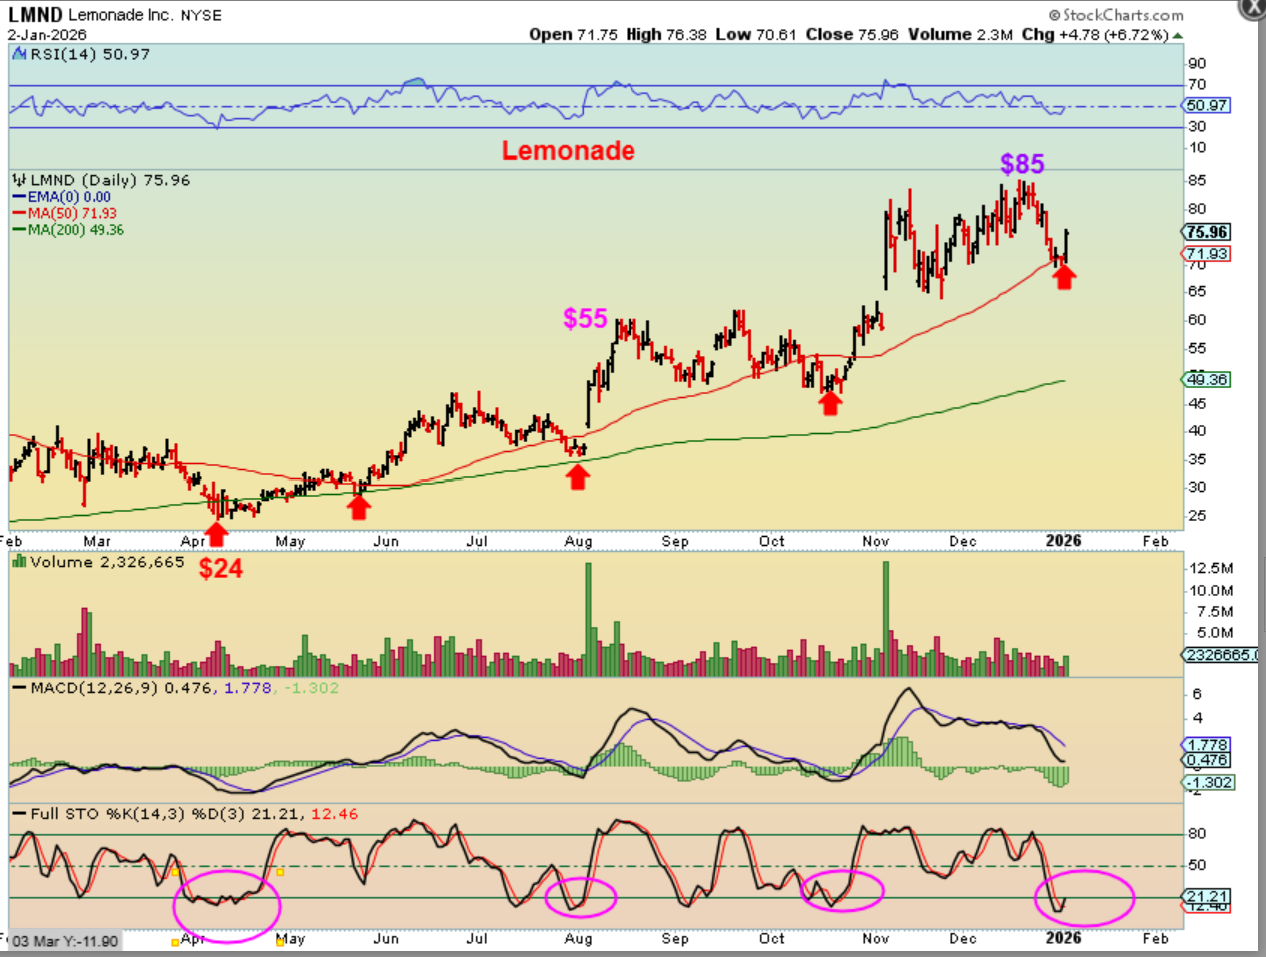
LMND is acting bullishly and correctly, but I have not mentioned LMND anymore in recent reports, because it was too choppy for me (As a trader, 3 months sideways is tricky). That said, it is a valid bullish stock that ran from $24 to $85 ICL to peak! …and notice how it closed up on Friday too, after reversing at the 50sma.
.
So, with all of that discussed above, The IWM WEEKLY Chart bounced off of the 10-week ma, and that is bullish.
.
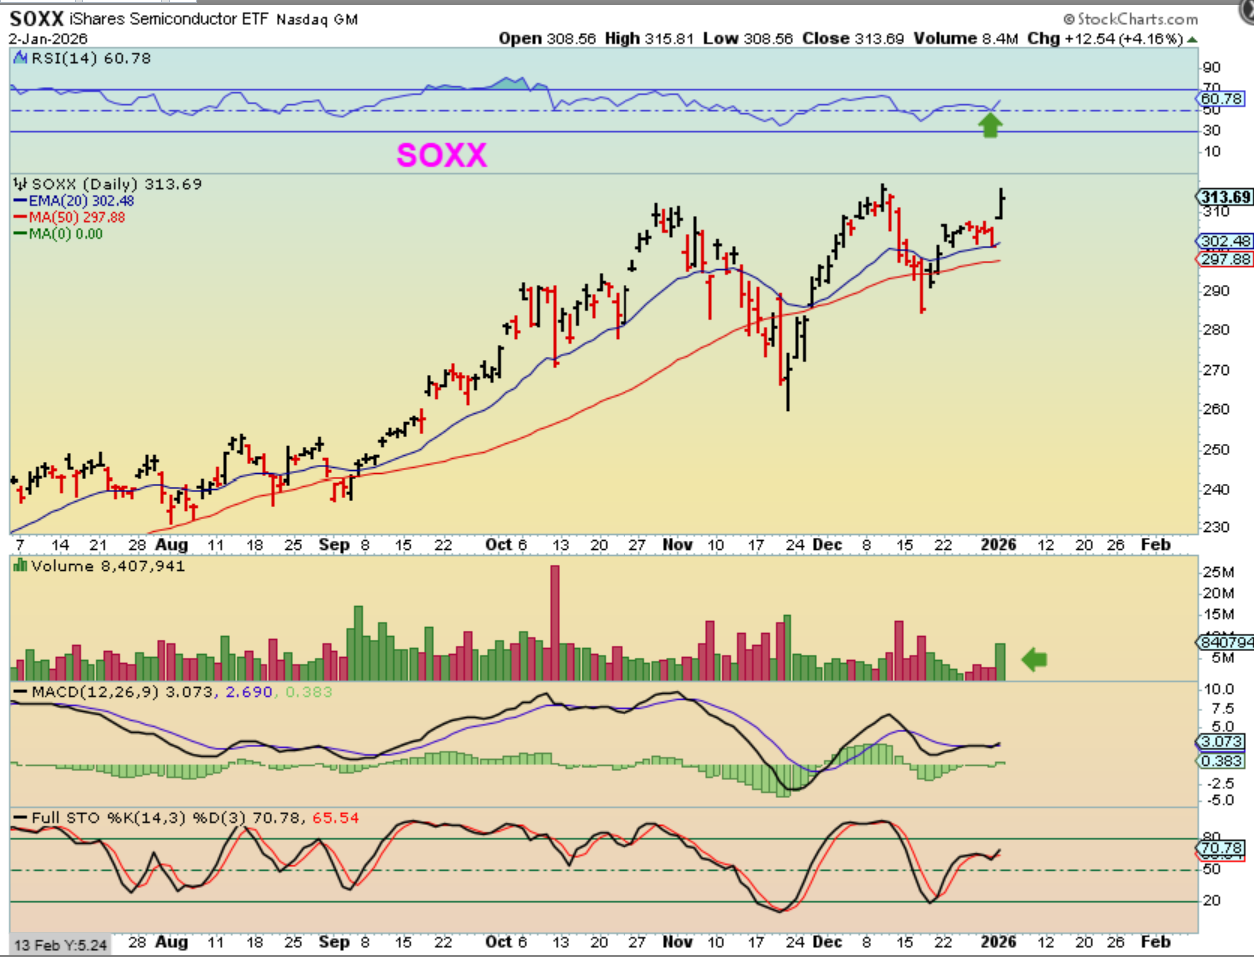
And then when we take a look at The Semiconductor ETF, THE SOXX. You can see that it also closed up strongly on a day when the NASDAQ was weighed down and red. The RSI 50 held up and the volume came in on a holiday week Friday. So we have a mixed bag, don’t we?…
.
So we have a mixed bag, don’t we? At the end of this report I will post several more bullish stock charts that did well on Friday, and as we start the new year, we’ll be able to see if THESE will continue to make excellent gains while the famous 7 large caps take a break and consolidate? Or are those 7 large cap companies leading the markets lower and our small caps will start to weaken too? Time will tell. So far, Friday was a great day for the many stocks and sector on my/our watch lists.
.
I just heard the news about Venezuela, an Oil rich country, and I wonder if it will push Oil sharply one way or the other?
.
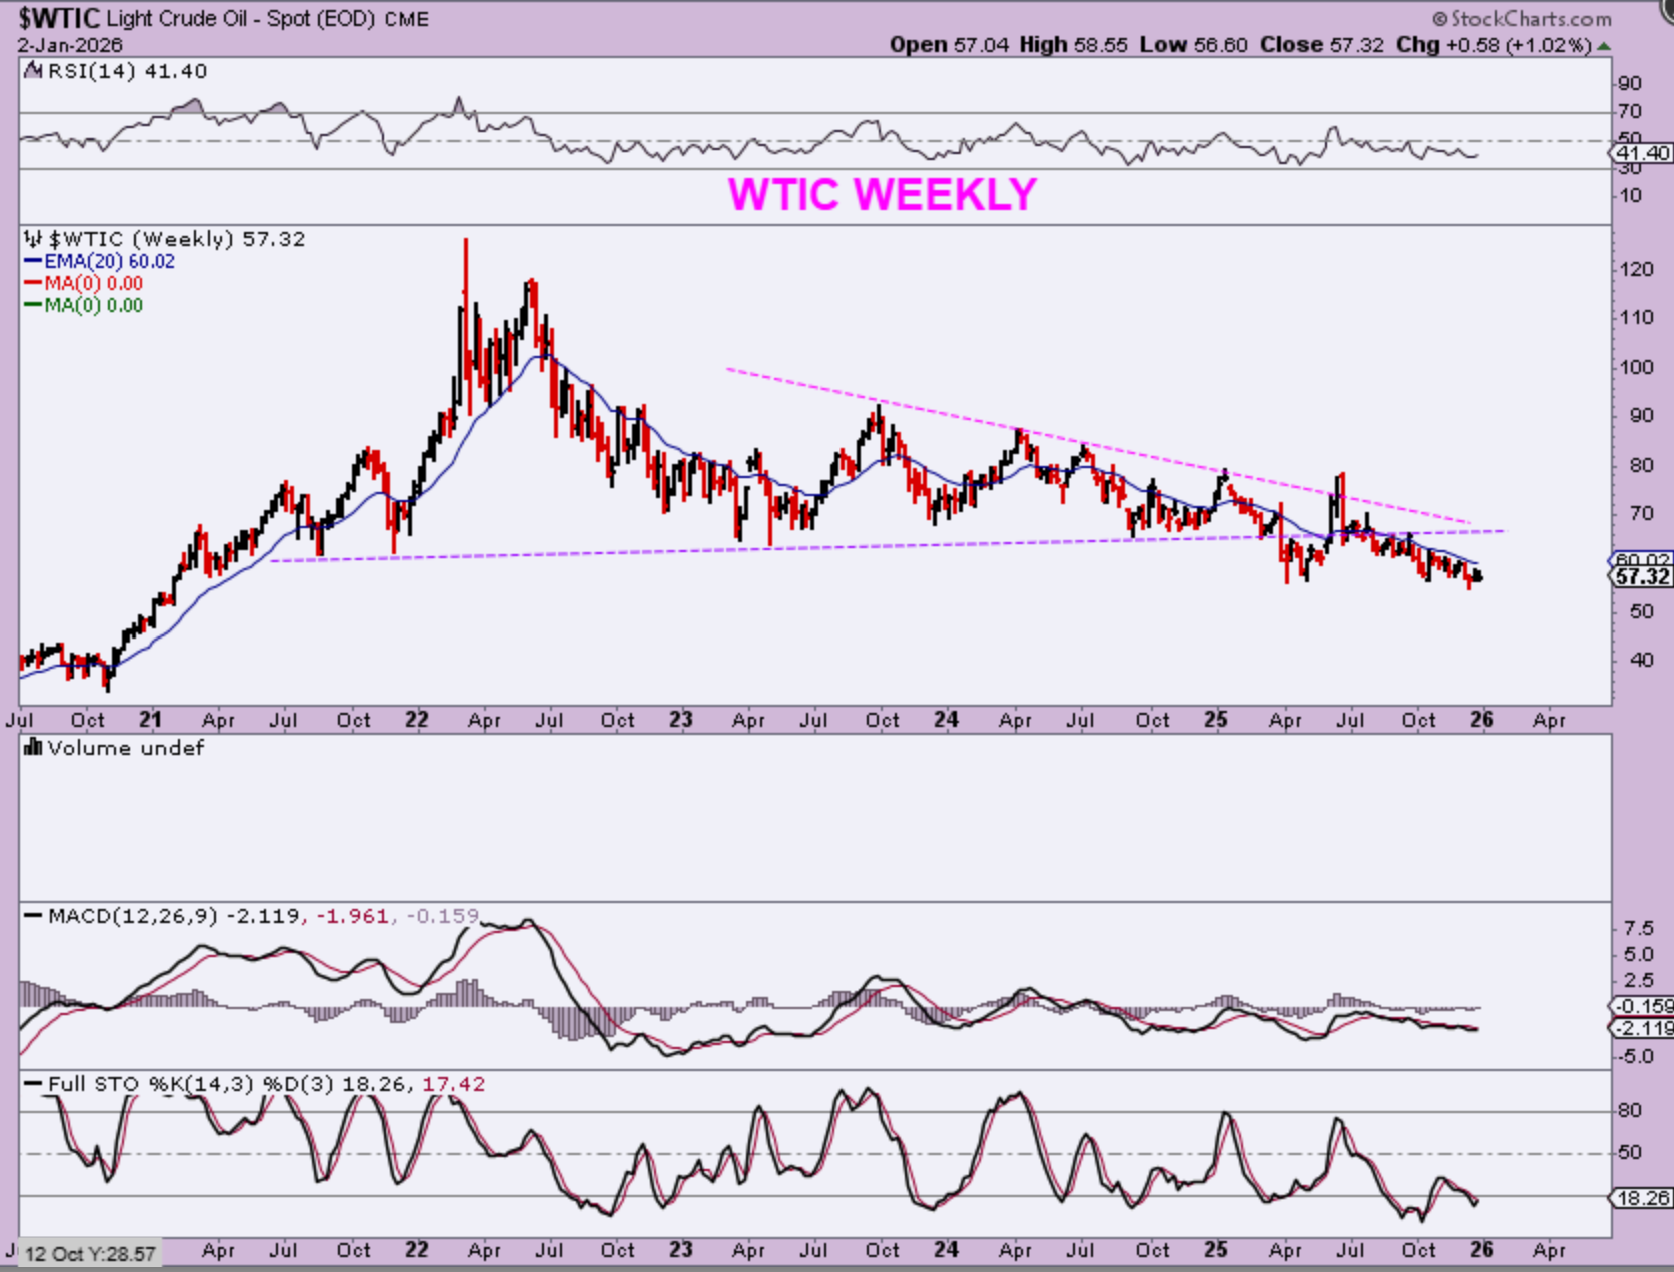
WTIC – So far, Oil is choppy and struggling to move higher. On a weekly chart it is bumping up against and being capped by the 20-week ma.
.
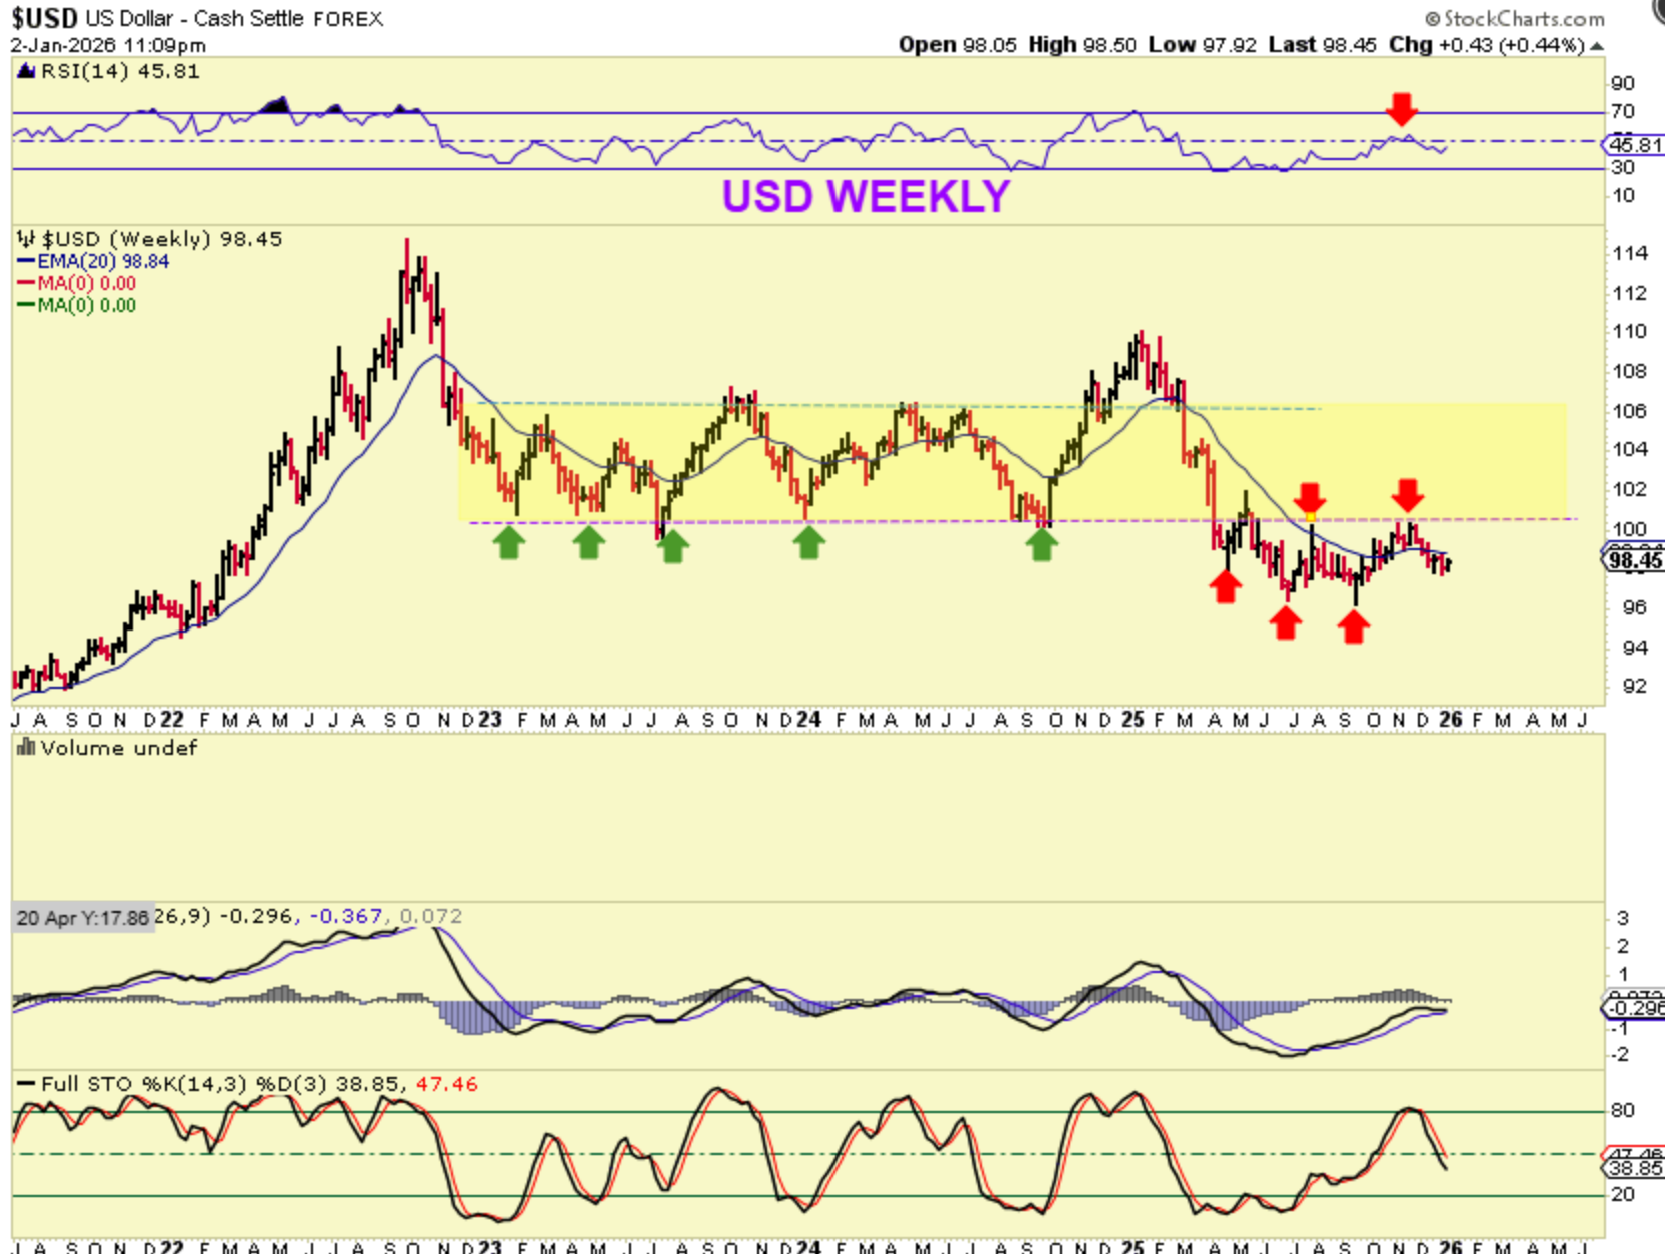
THE USD: The big picture for the Dollar is that it lost support and has been unable to regain it. It WAS making lower lows in 2025, but with this rounding bottom forming I’m watching to see if it stabilizes and starts to form higher lows, possibly in preparation for a break back above $101. Also, would that match the current ‘peak’ in Silver?
.
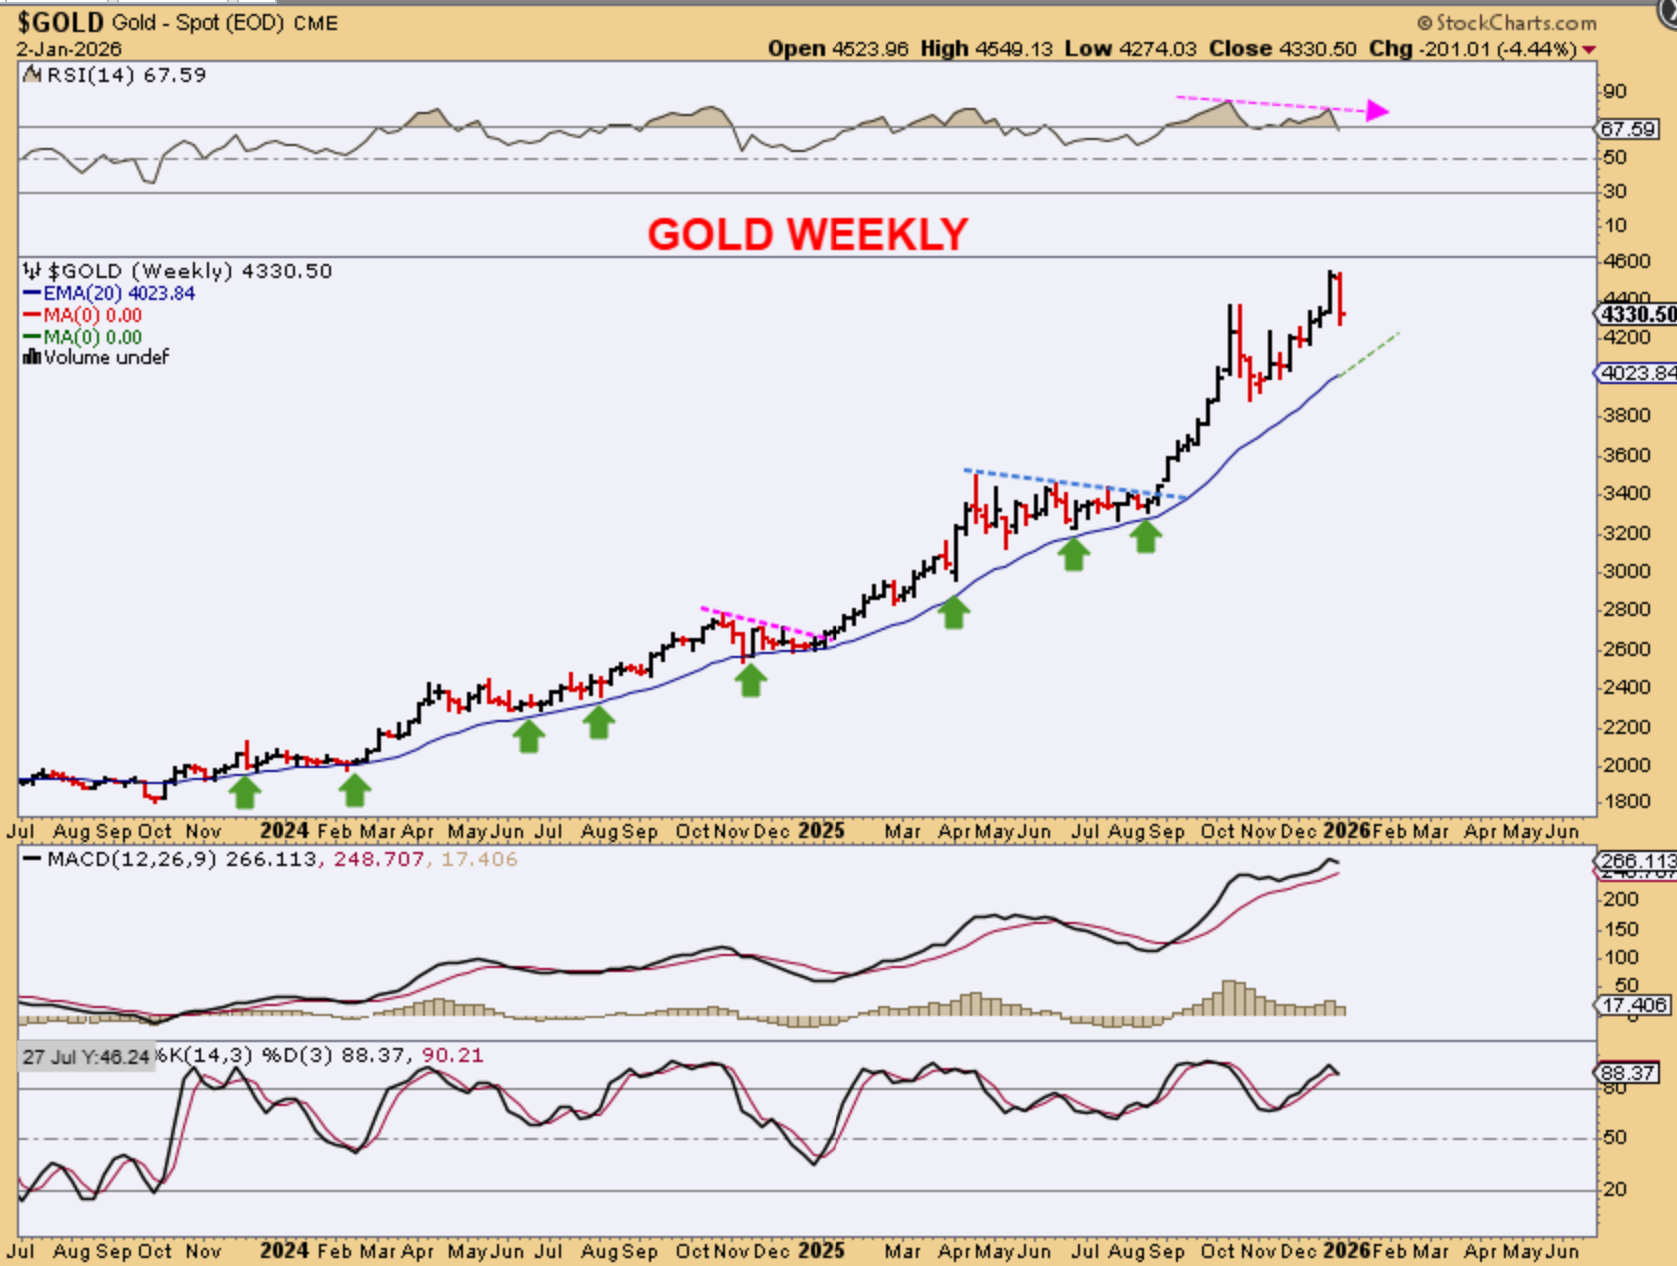
GOLD dropped 4.44% last week, and this was discussed in the daily reports. We should be only on a second daily cycle, so Gold should be able to show a little strength rather than continue to crash here, a drop to the blue 20 week ma is possible. When a dcl forms and it bounces in the 3rd or 4th daily cycle though, we may see that a long consolidation starts again in 2026.
.
That blue 20 week ma has held price faithfully since 2023, so a break of that will be a warning sign in my opinion. Warning of what??…
.
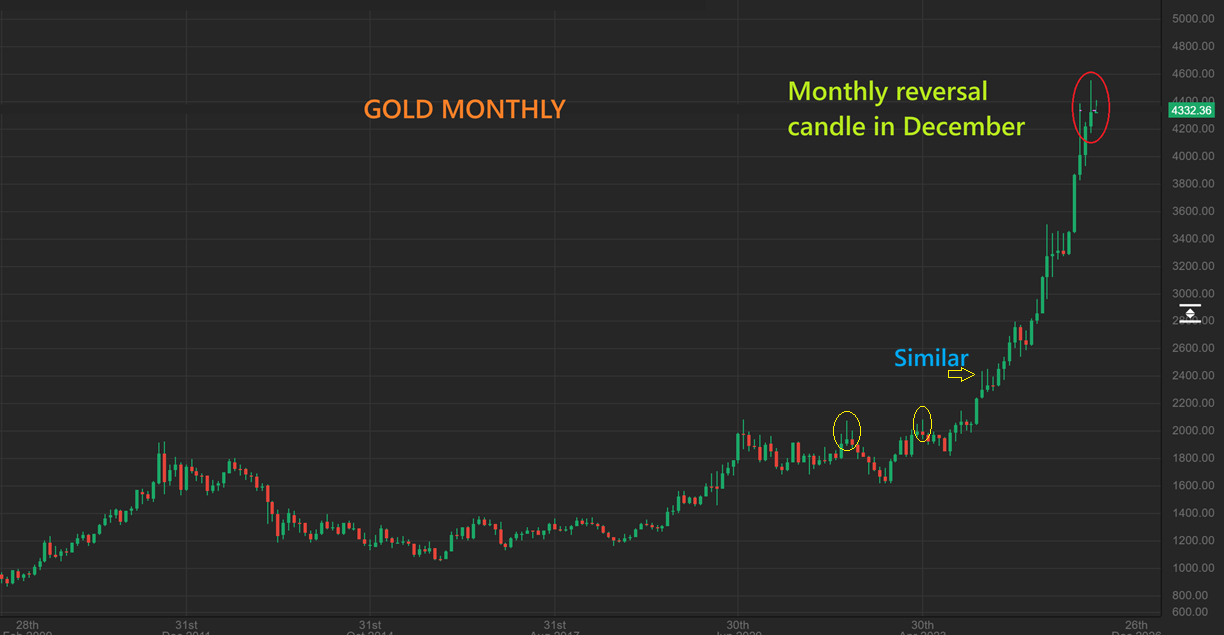
The Month of December ended:
A break of that 20 week ma will be a warning sign that we just saw a Gold Monthly topping / reversal candle in Gold. That candle in the circle is a bearish shooting star, and that usually signals the top of a run. I will point out that we have seen a couple of these hammer type candles on this run that simply saw price go sideways, but with a parabolic run like this, and with Silvers similar look, it may be time for a real pullback/correction.
.
SILVER sold off this week, down 8% for the week. Last week I mentioned in the weekend report, when Silver shot UP 10% on Friday, that this was getting too frothy and parabolic looking. I said that I was concerned, because when Silver ran up all week and then shot up on Friday 10%, Silver Miners were red or up 1-2%. I think that Silver ‘peaked’ and last week…
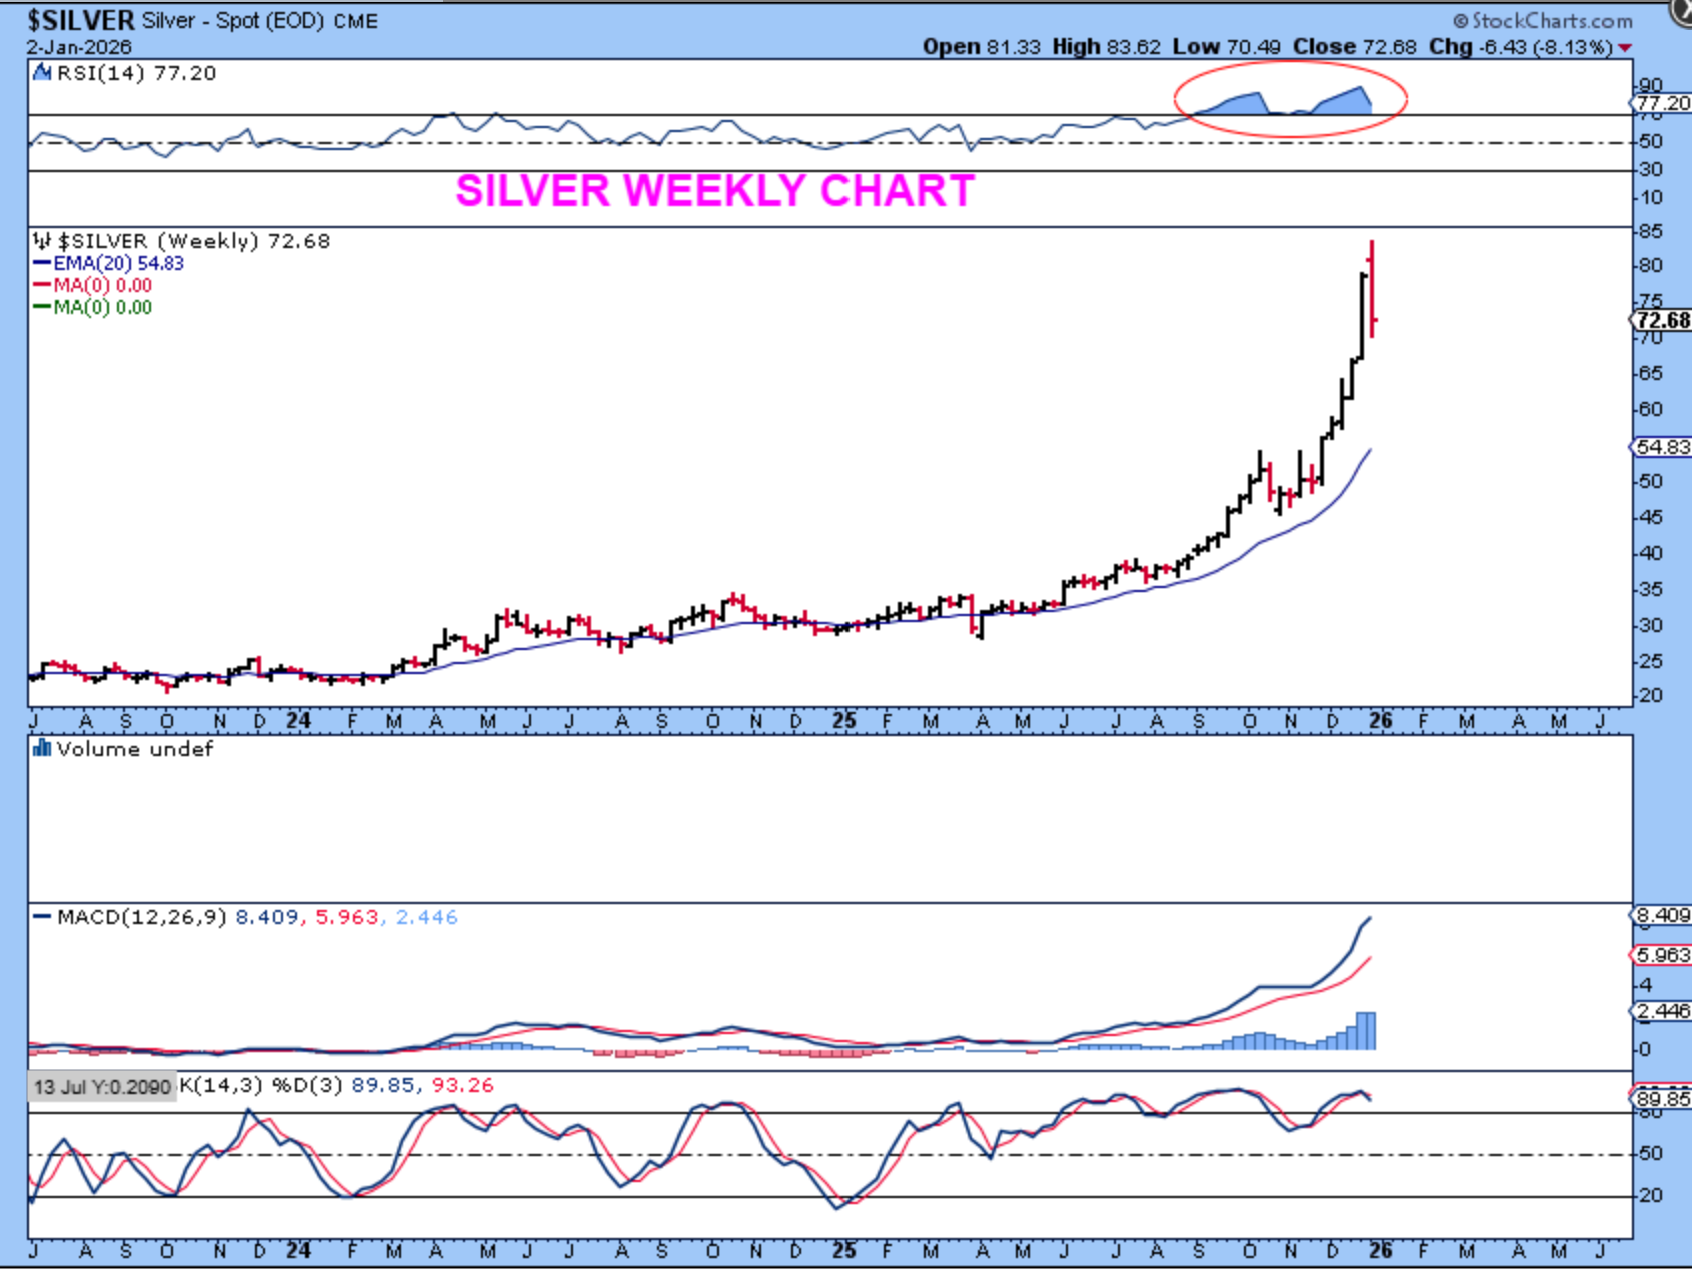
.
I think that Silver ‘peaked’ and last week I used this chart to show that 2011 Silver ‘peak’ as a warning. This run is far mor parabolic than 2011.
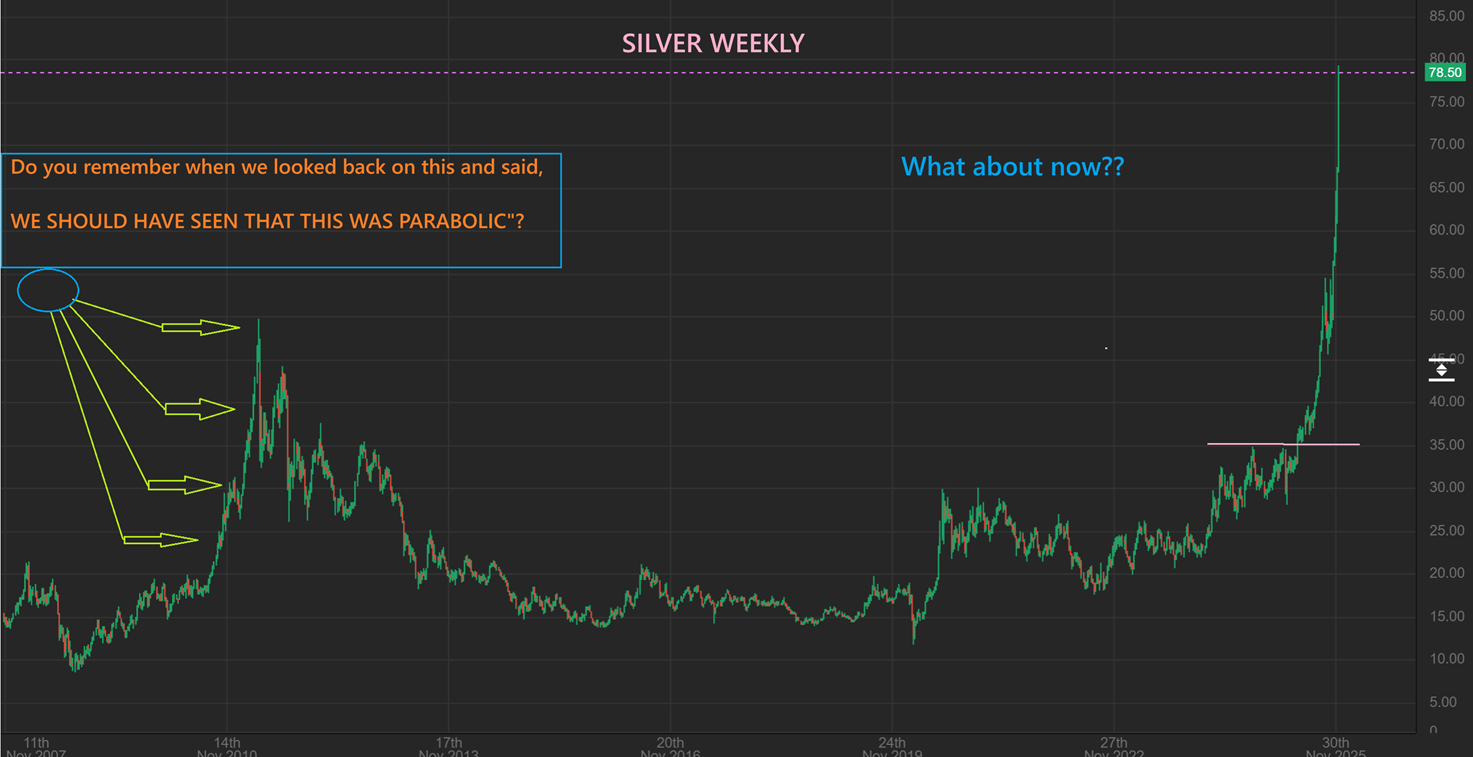
.
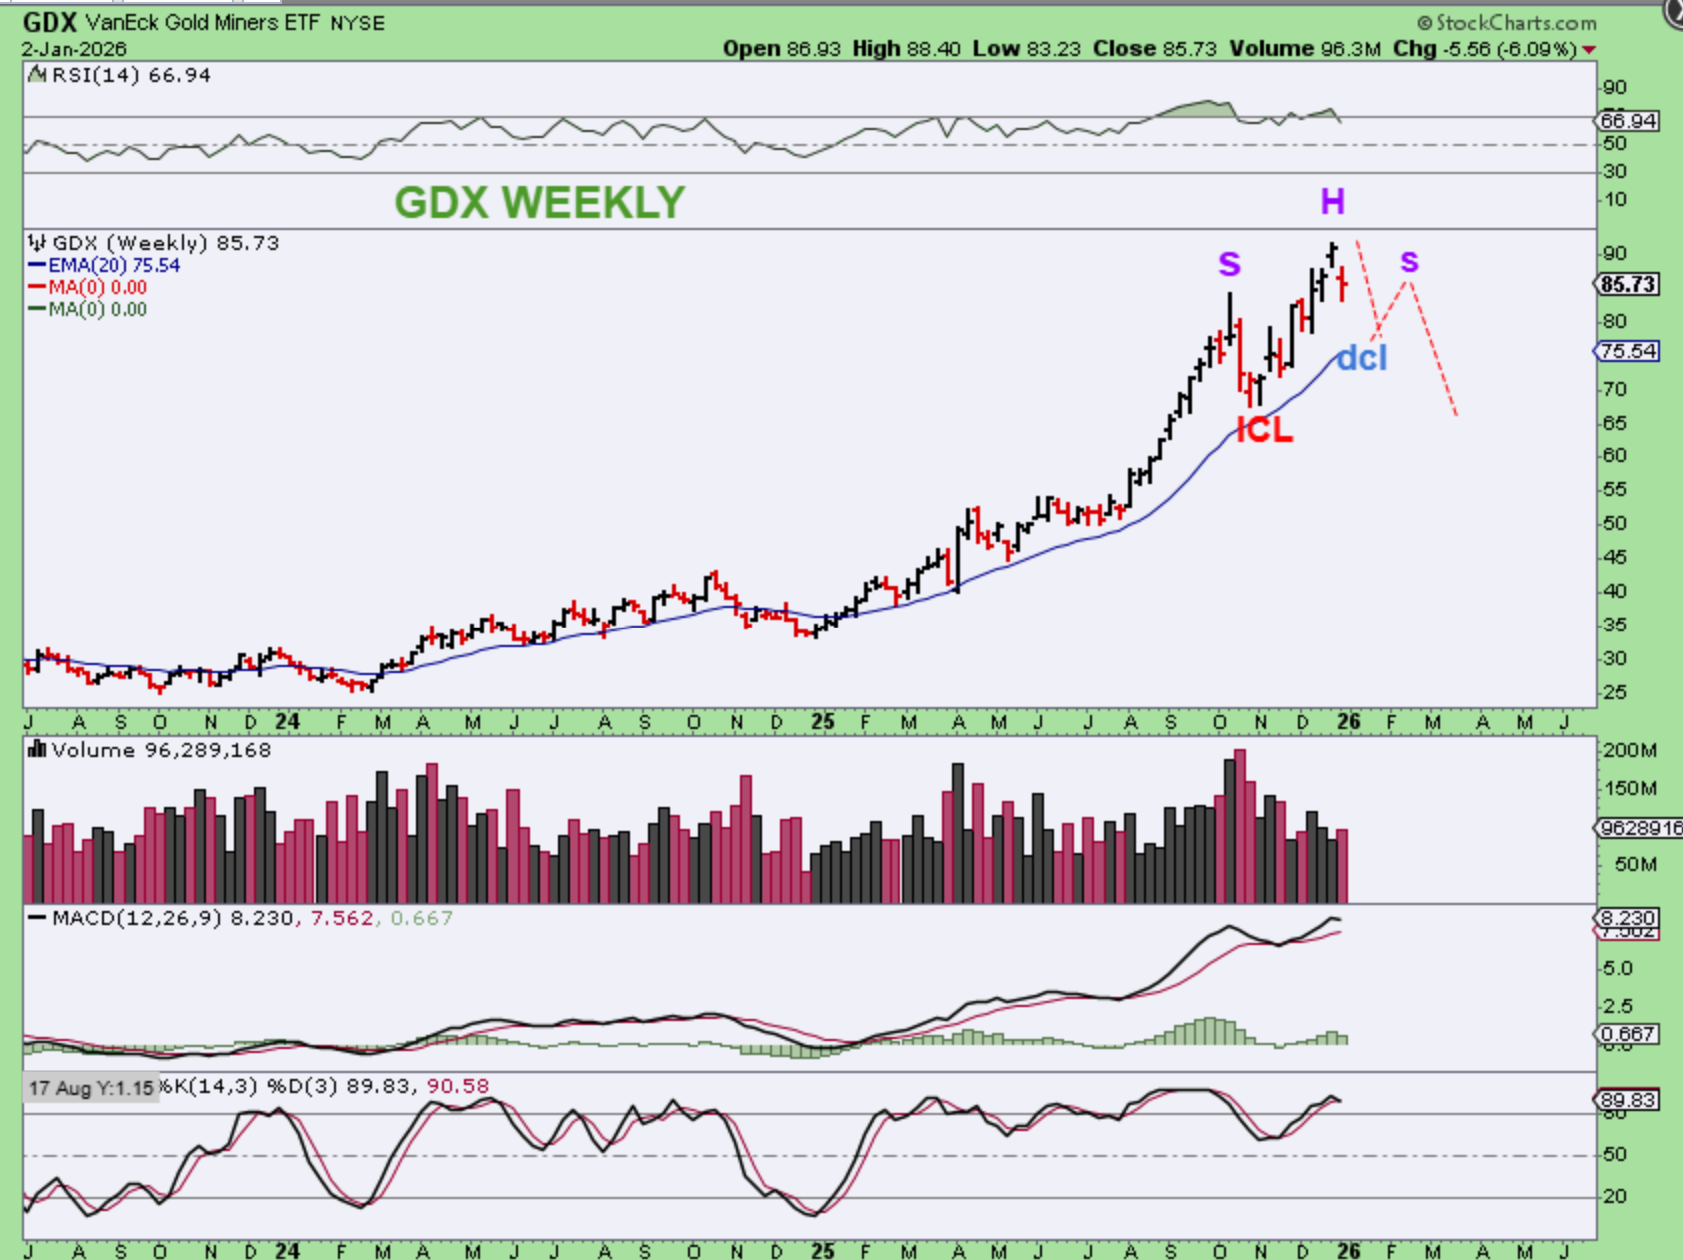
THE GDX WEEKLY gave us a Doji candle – a candle of indecision. That means that Miners could drop or bounce next week, but knowing where we are in the daily cycle, I think that this will close lower next week. So for more of a summary…

.
The GDX gapped down about 9%, but it bounced back and closed down 6% for the week. That gave us the Doji. We could drop into the second daily cycles dcl, bounce into the 3rd daily cycle and form a right shoulder, because if Gold and Silver have peaked, then no doubt the Miners have peaked also.
.
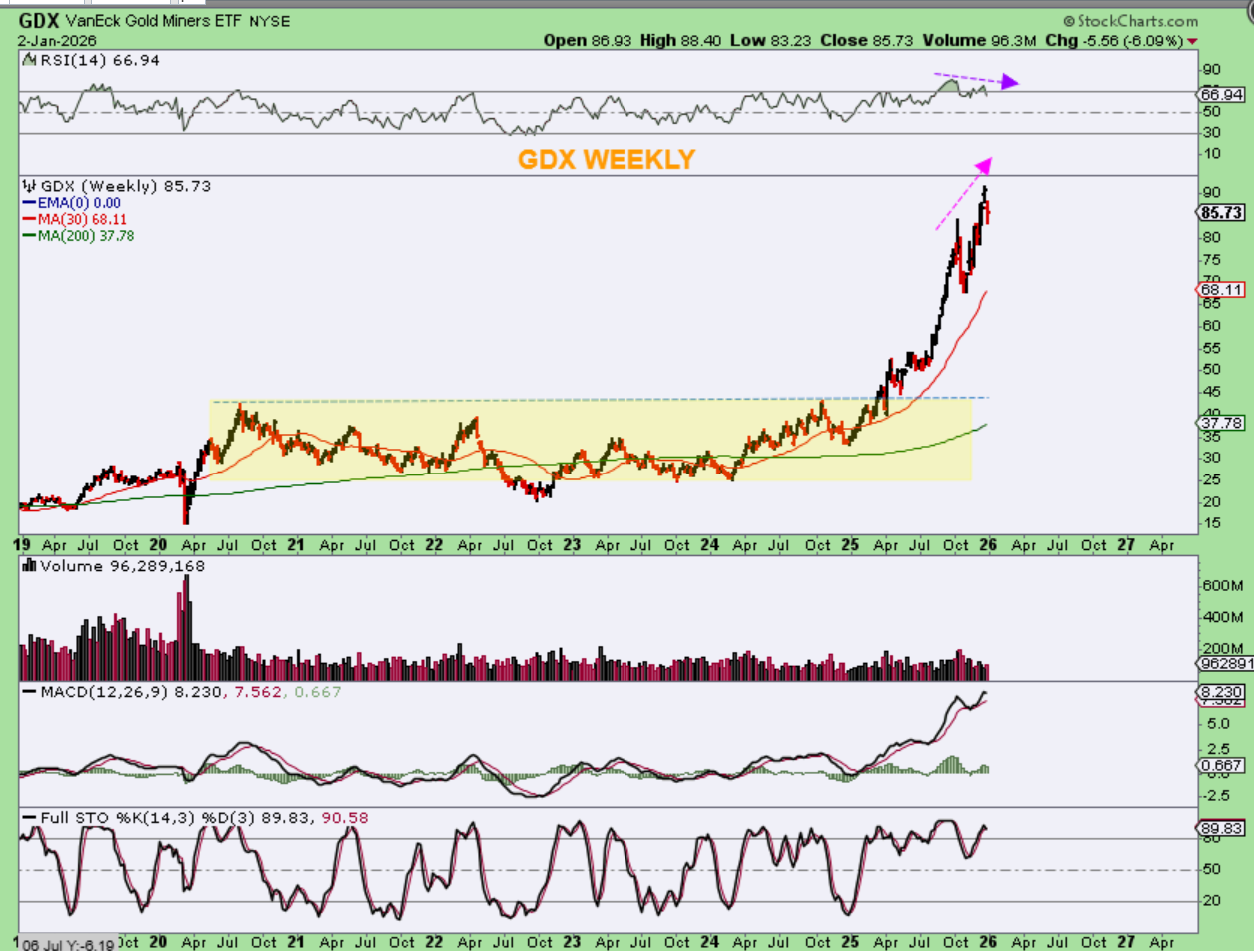
GDX has also been in a somewhat straight up run, and these become unsustainable over time. That is especially the case when the Metals themselves peak. I think that the selling has been lighter because we are only in the 2nd daily cycle. I mentioned last week that when the sellers start to lock in profits, it can lead to a sharp selloff, so keep that in mind when the 3rd daily cycle peaks.
.
What a strong year the bulls had in the General Markets and Precious Metals in 2025, and for Crypto in most of the year too! I think that we have our peak in Crypto due to the 4 year cycle, but a nice buy could show up in the second half of the year, I’m guessing maybe October? Big money can be made in Crypto from that point on. The Precious Metals seem to be peaking in a parabolic run, and they would need to consolidate recent gains too. What about the General Markets? The General Markets may be seeing some rotation, where some leaders consolidate and rest for a while, and other sectors that already pulled back into the recent ICL may begin to take over and rally. Time will tell, but on Friday many stocks were up 10%plus, with some leaders breaking down and the Nasdaq Down. I WILL POST MORE CHARTS BELOW, AFTER BITCOIN.
.
Have a great weekend all, and thank you for spending a great year with me here at Chartfreak! I do appreciate you all being here, and may 2025 be as rewarding!
.
~ALEX
.
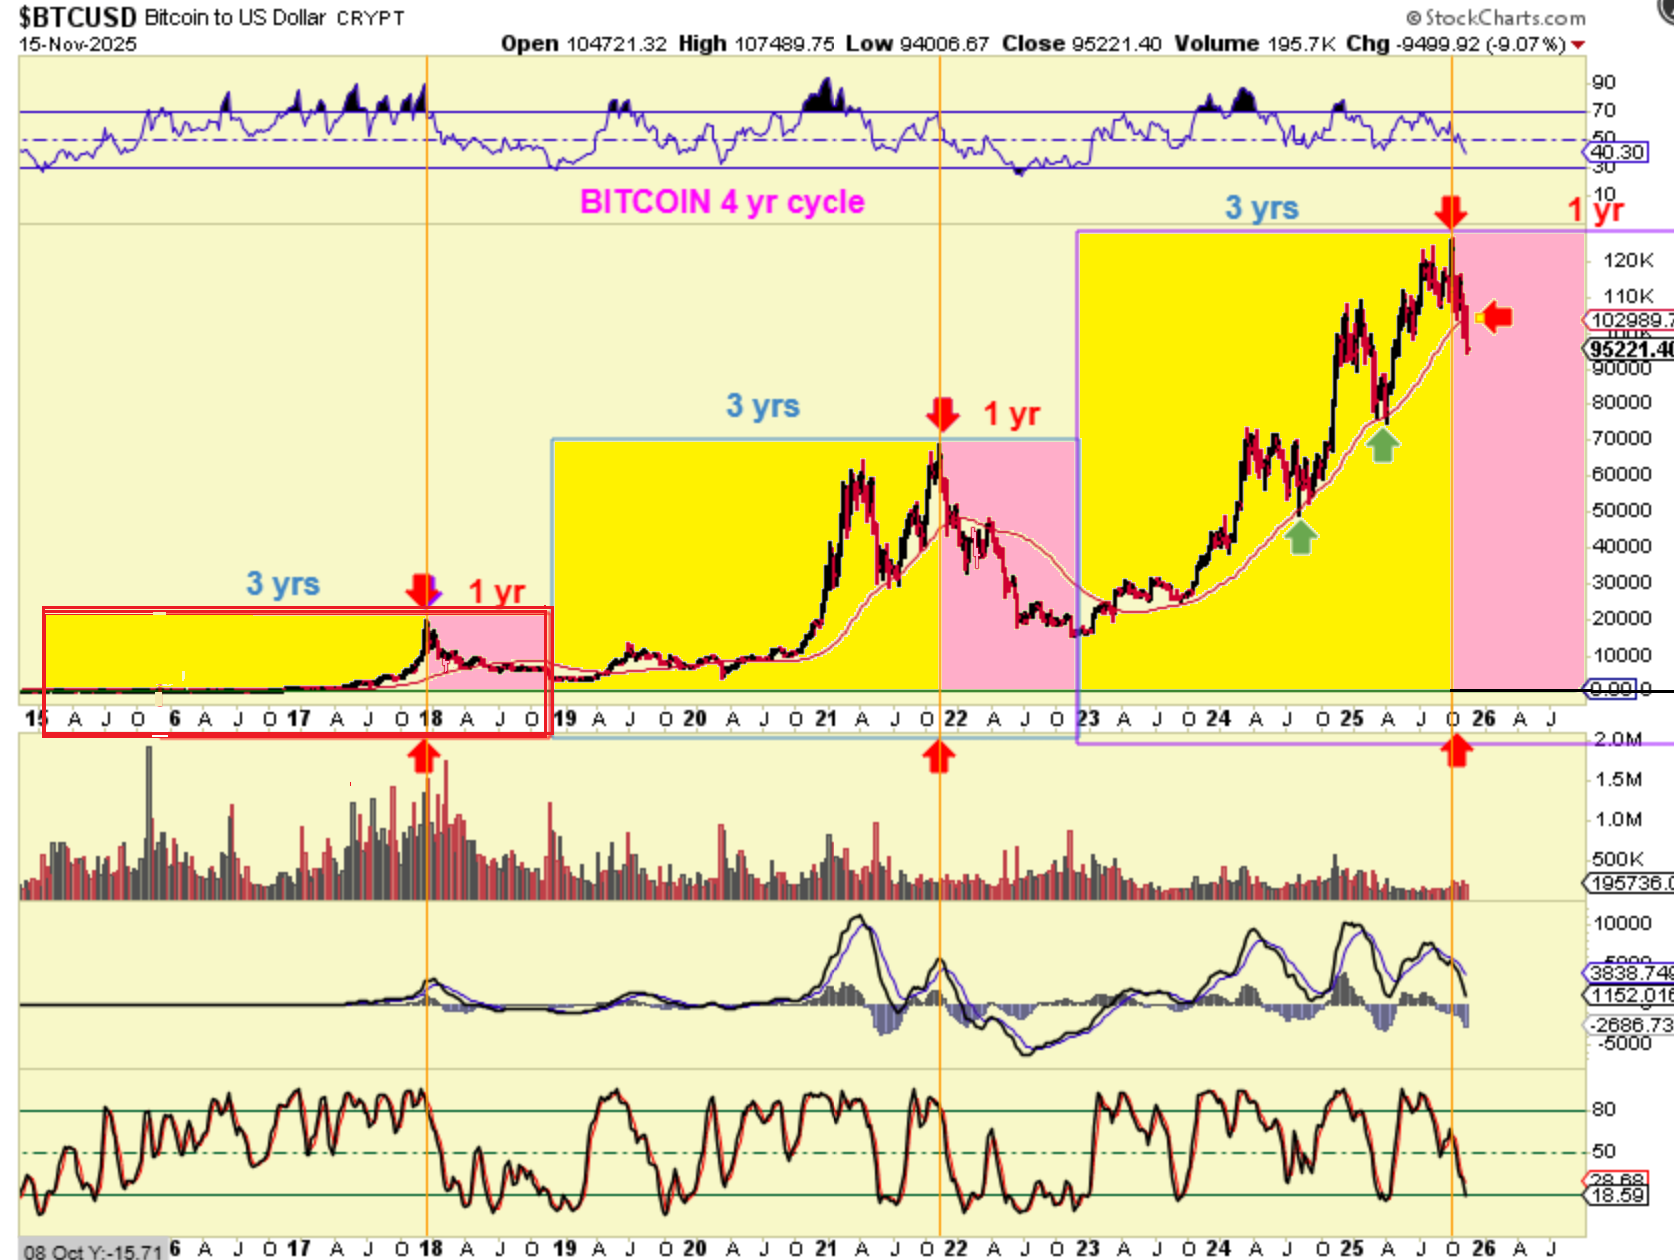
#1: Let’s make this simple and revisit my November 15th chart of Bitcoins 4 year cycle: Bitcoin tends to bottom near the end of the 4th year, so Bitcoin should have a rough year and then bottom neat October-ish? I’ll explain my thoughts on that soon.
So, I had been discussing this 3rd year ‘topping time period’ in September and October, and then I posted this in November as a warning that BITCOIN probably peaked. It peaks in the 3rd year. I expected one more good bounce though, but this likely peaked.
.
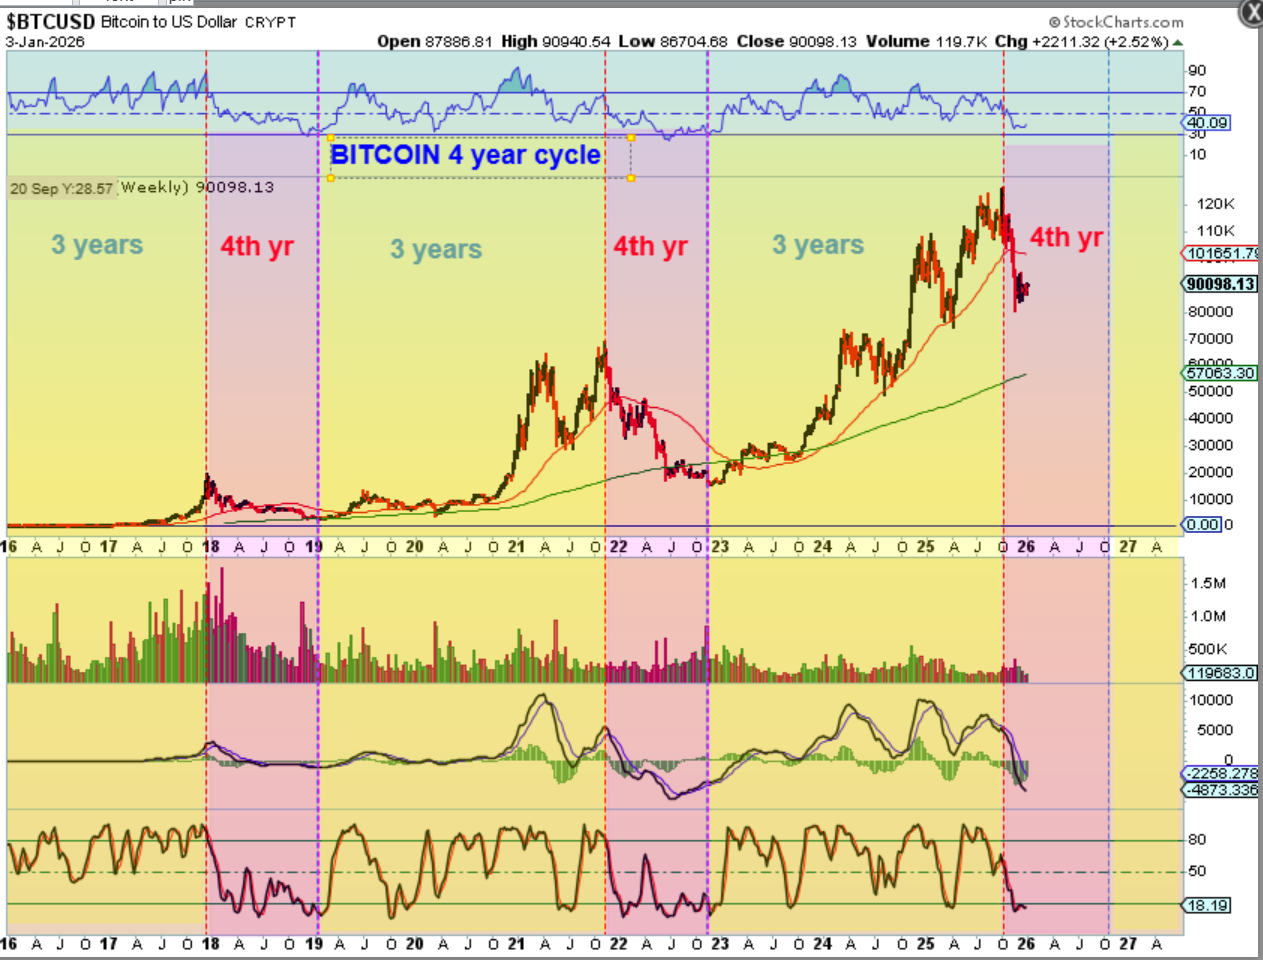
#2 BITCOIN –
So far, we haven’t even seen the ‘bounce’ that I was expecting up to the 50 week ma (red line). Why a bounce? We bottomed into a dcl and I then start to count 60- day daily cycles from there. I thought that we could bounce within the first 40 days. We are now on day 44 today (Sat Jan 3) and we are now running out of time for a bounce. This actually looks like a bear flag too. I have been out of Crypto stocks for weeks now. What do I expect next?
.
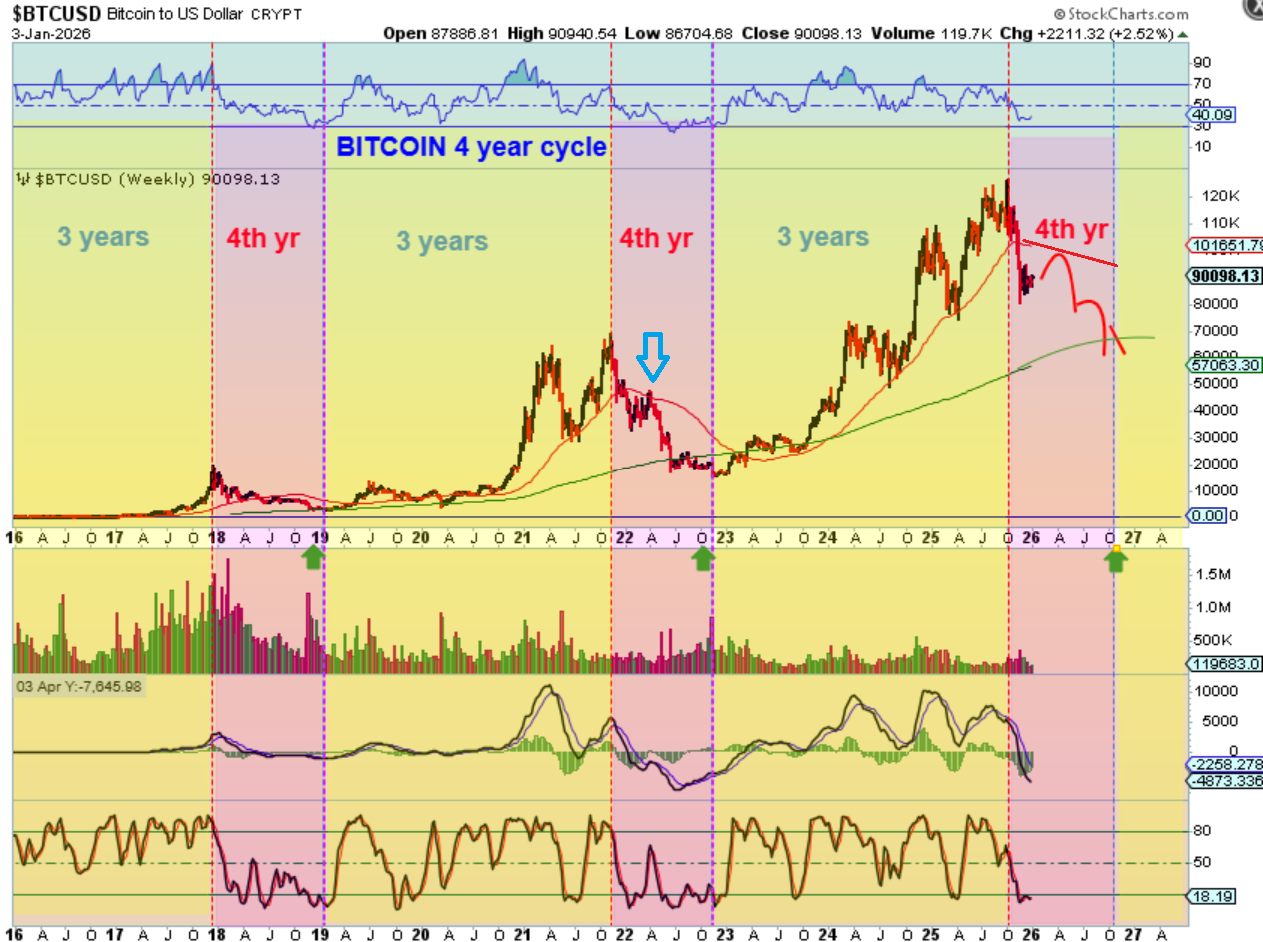
#3 BITCOIN –
In 2022, take note of the blue arrow. That is why I expected a bounce here, to the 50 week ma (red line). That time period in 2022 was similar to the current set up, and it did bounce to the red line then. So I will draw that bounce in now, but we may run out of time. This kind of looks like a bear flag now. I have been expecting 2026 to be a 4th year drop and consolidation period, until maybe the October time period. And then…
.
Then we could start buying crypto stocks when Bitcoin gets below or finds support at the green 200 ma. Price sold under it in the past and then recovered. That seems to be $50,000-60,000 depending on when major buying starts to step in again.
.
Next, I want to just post charts of Fridays price action, which is related to what I put in my report above. I was in the live commenting area Friday posting these charts, some as laggers that could be bought, others just to show that with the NASDAQ down, IWM and SOXX were running. Some of these we have traded or owned from the ICL in November, so some really good gains are already in some of these. Others look ready to go now and will be in future reports too. I will not add a lot of commentary here, for the sake of time and releasing this report soon, but these charts show you bullish stocks on Friday, during a time when the NASDAQ & SPX were red.
.
AAOI has doubled since the Nov ICL. After the half cycle low, it looks ready to go again and was up 13% Friday.
.
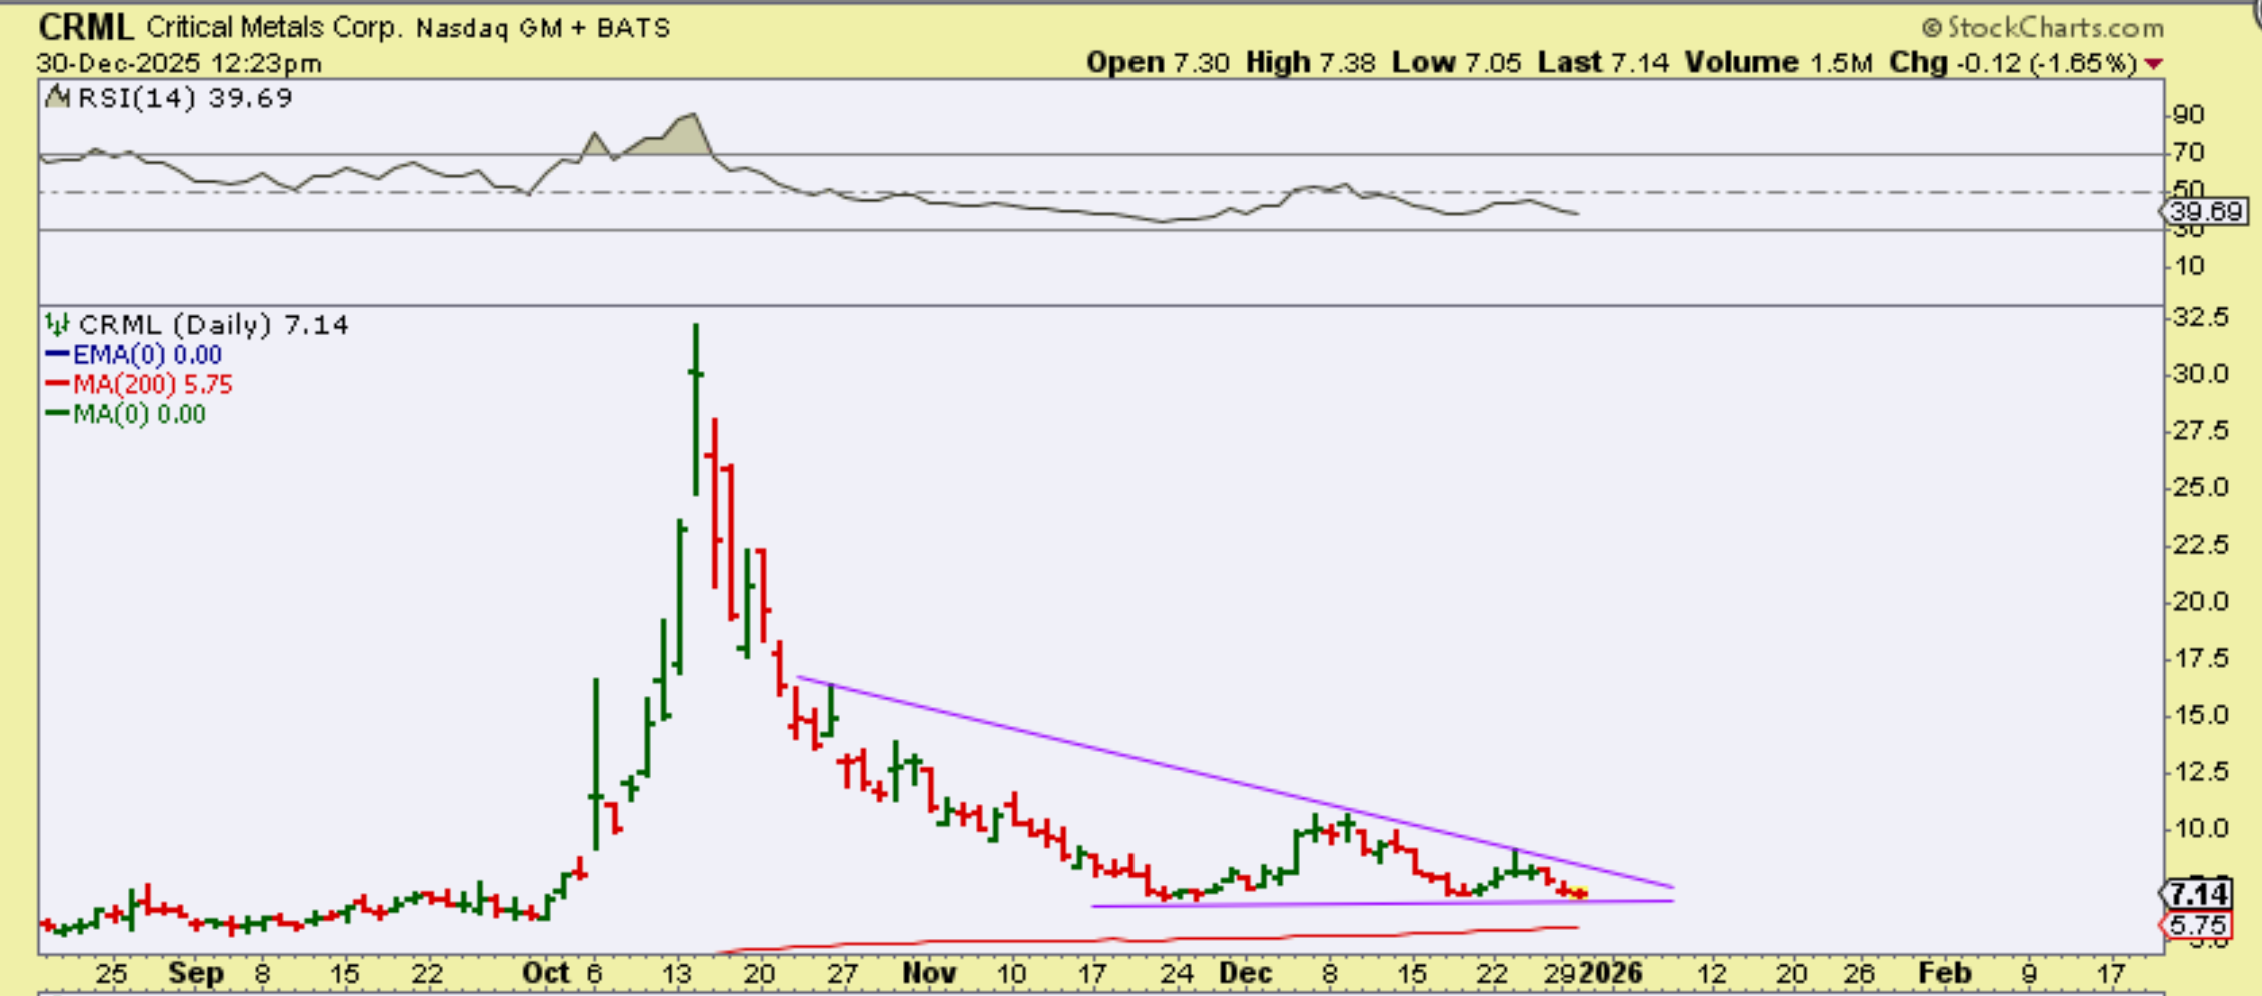
CRML possible wedge Dec 30.
.
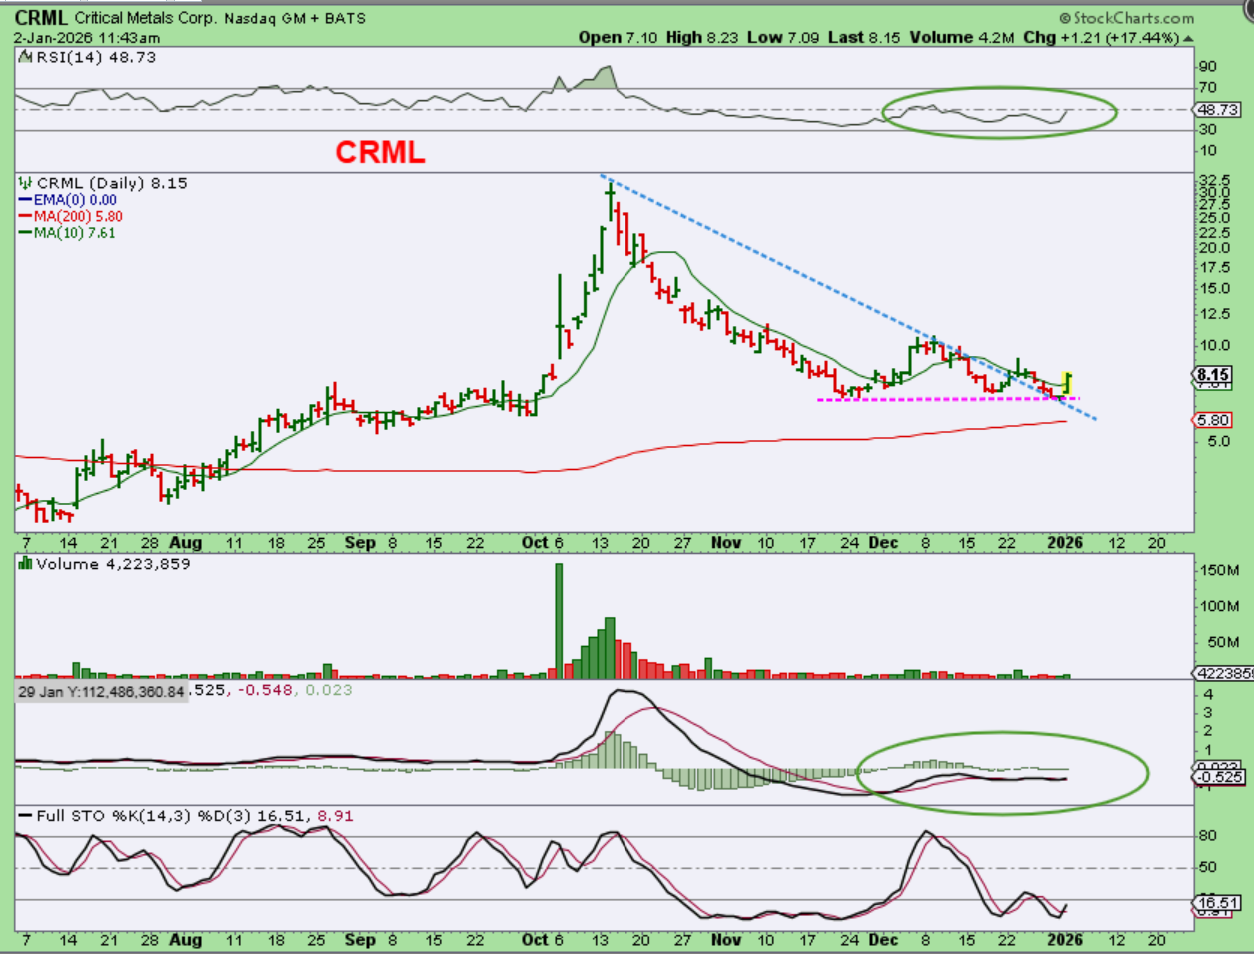
CRML up 17% by 11:30 am Friday. This can run once it gets going.
.
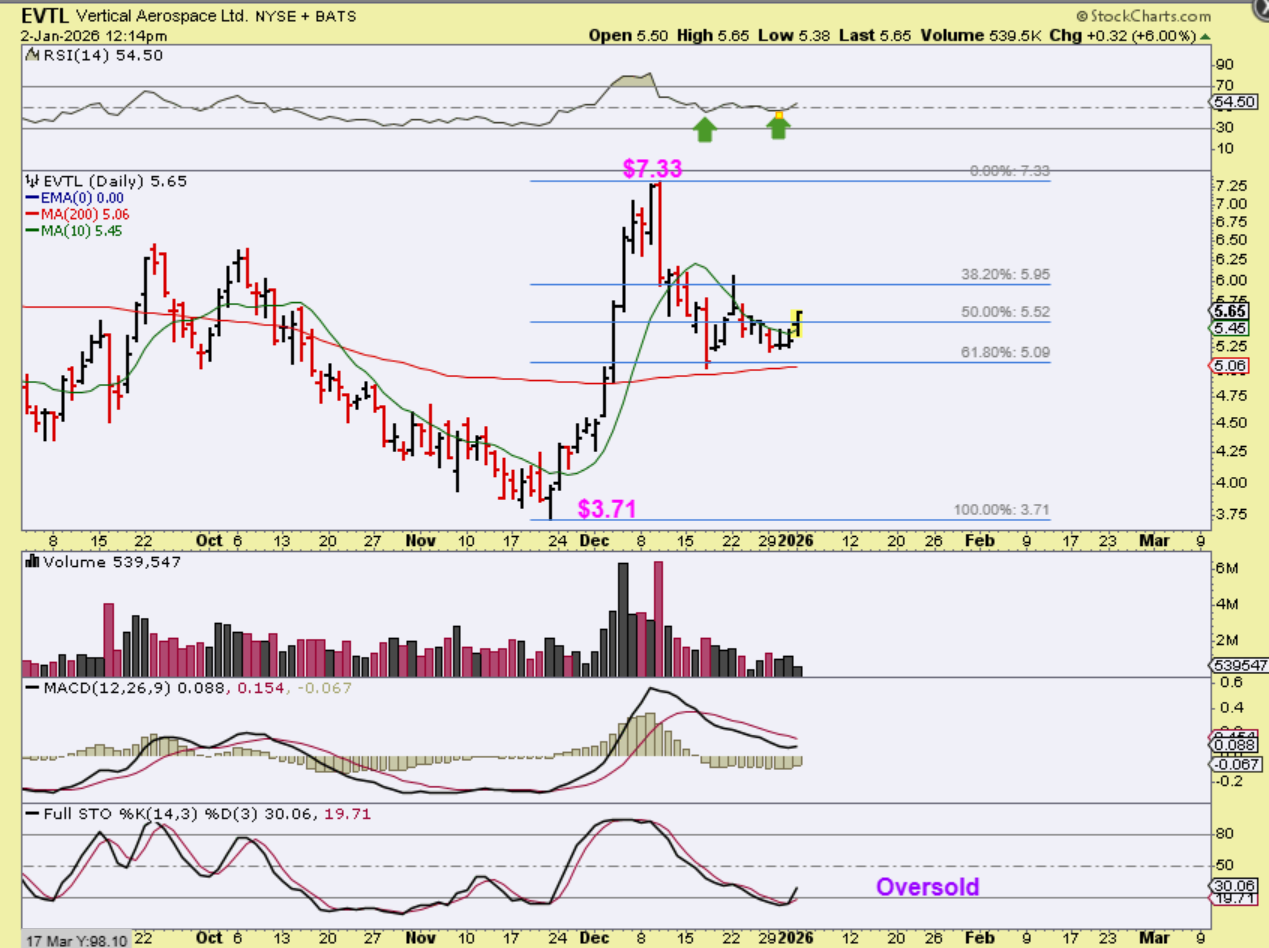
EVTL found support at the 200sma. I posted this in the morning; it closed up almost 10%. Look at that Nov ICL run! It may be ready to run again.
.
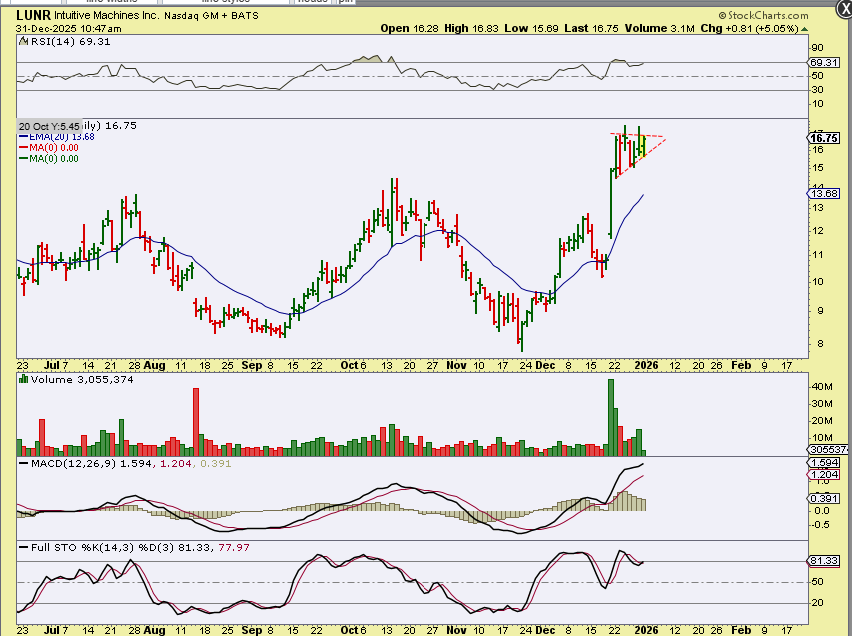
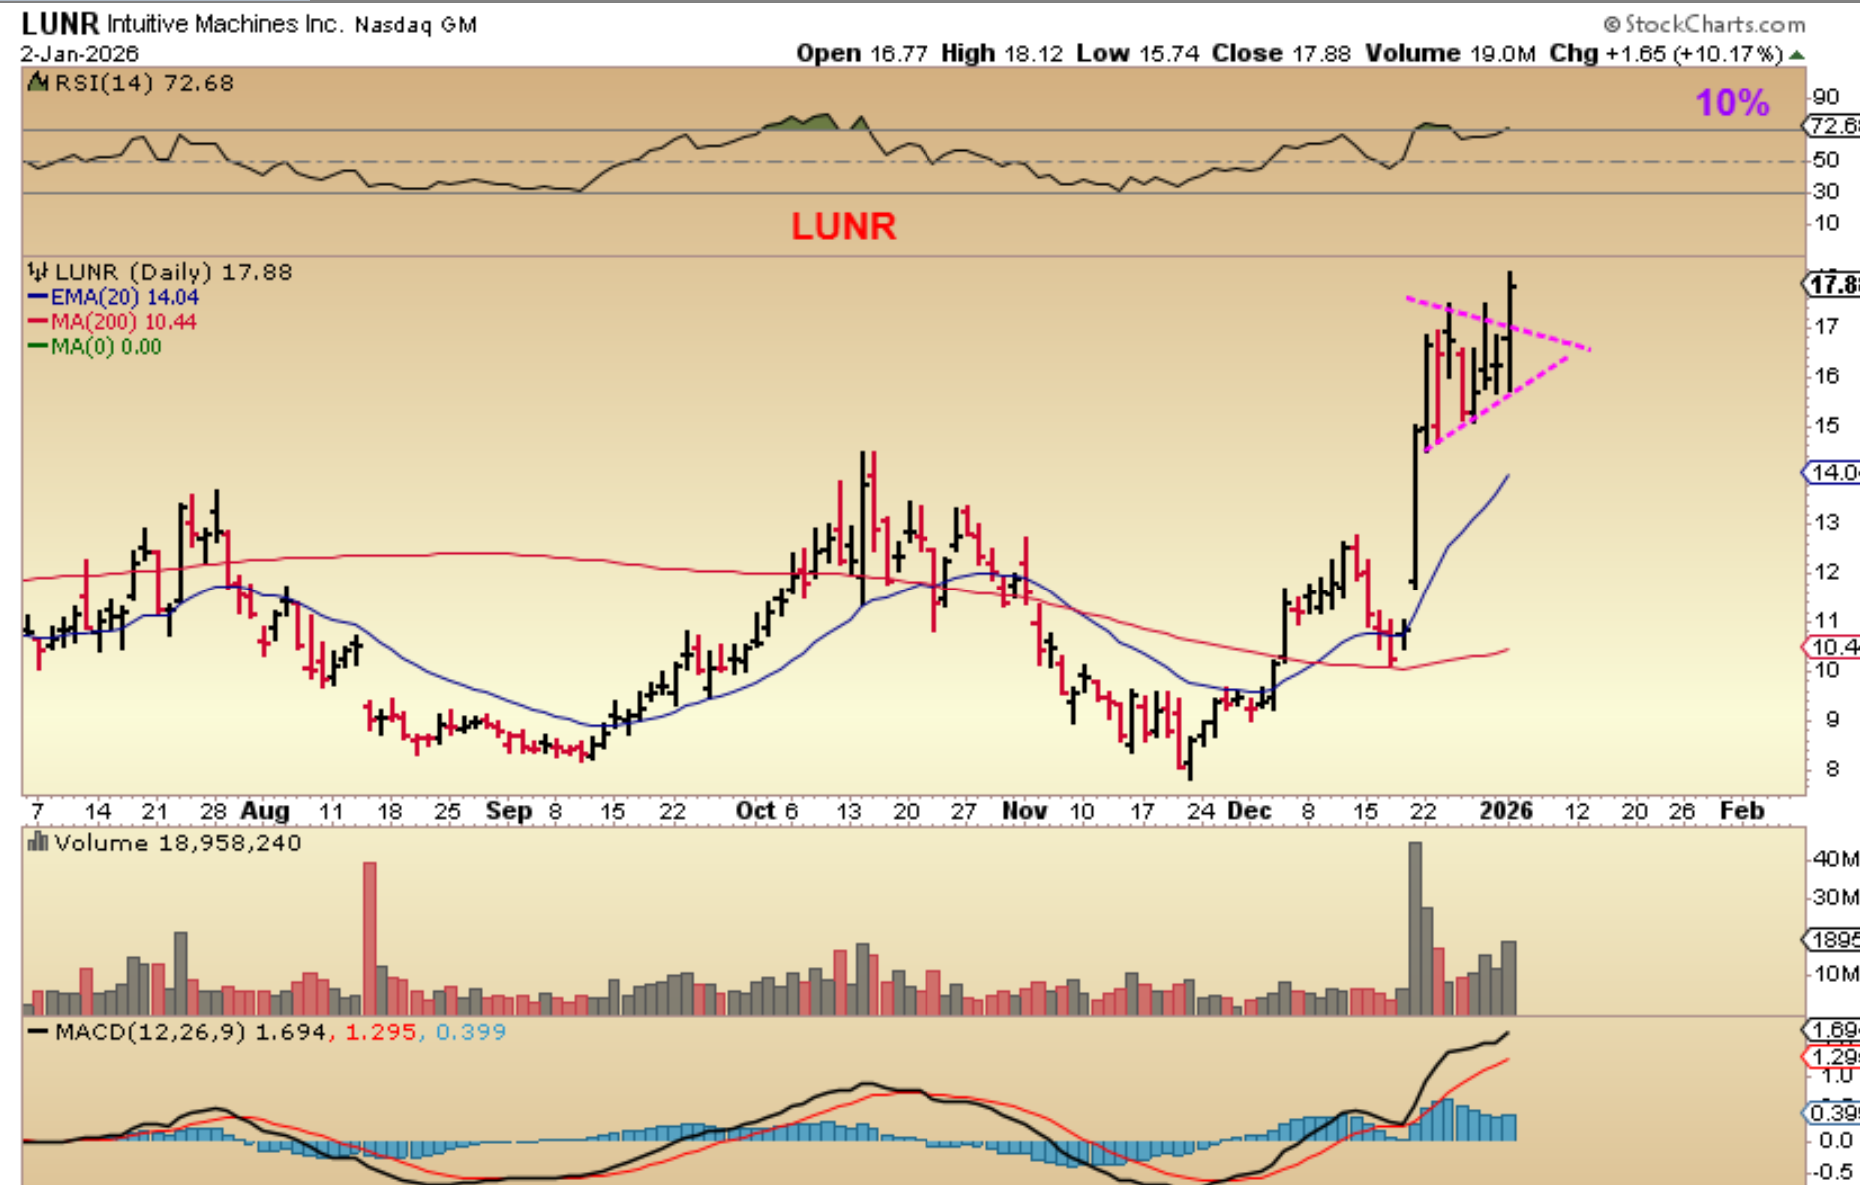
LUNR bull pennant on Dec 31.
.
LUNR up 10% on Friday. LUNR also doubled out of the Nov ICL.
.
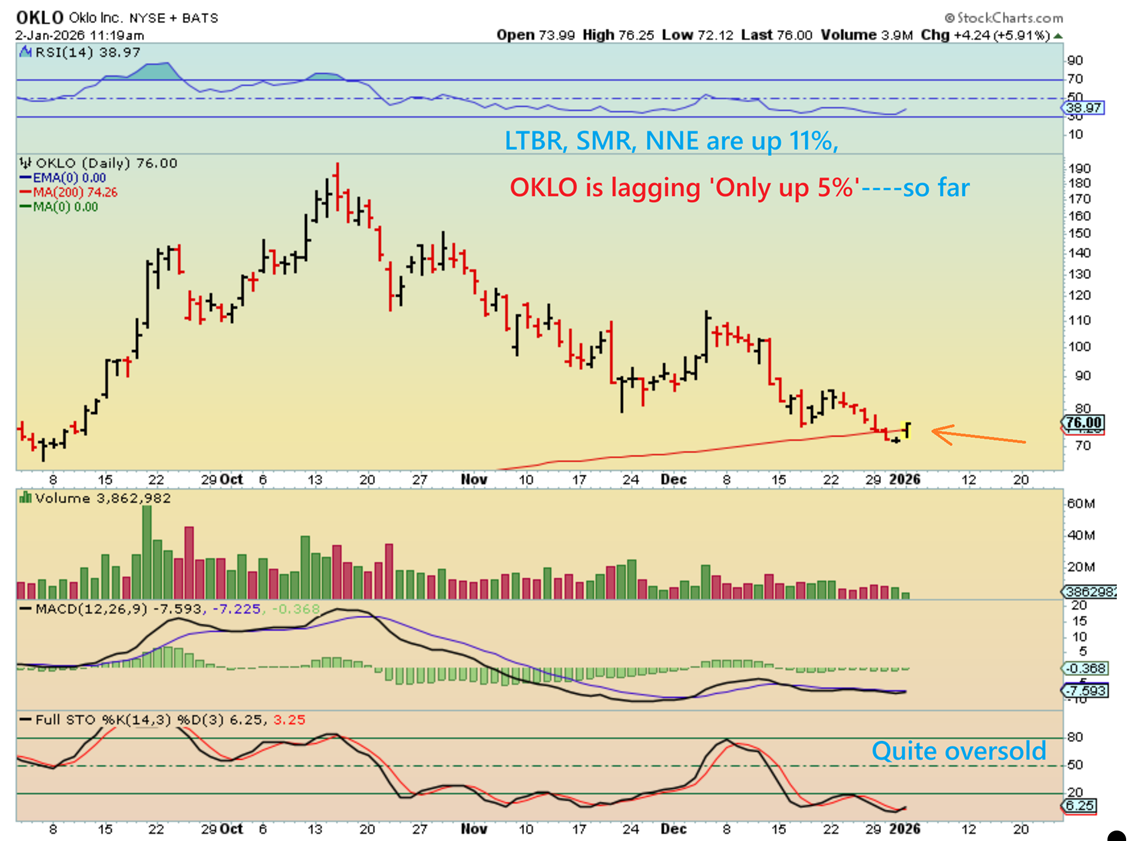
OKLO and other ‘Nuke’ Stocks are lagging, but may be ready to go. at 11 am it was crossing back above the 200sma. It closed up 8.4%
.
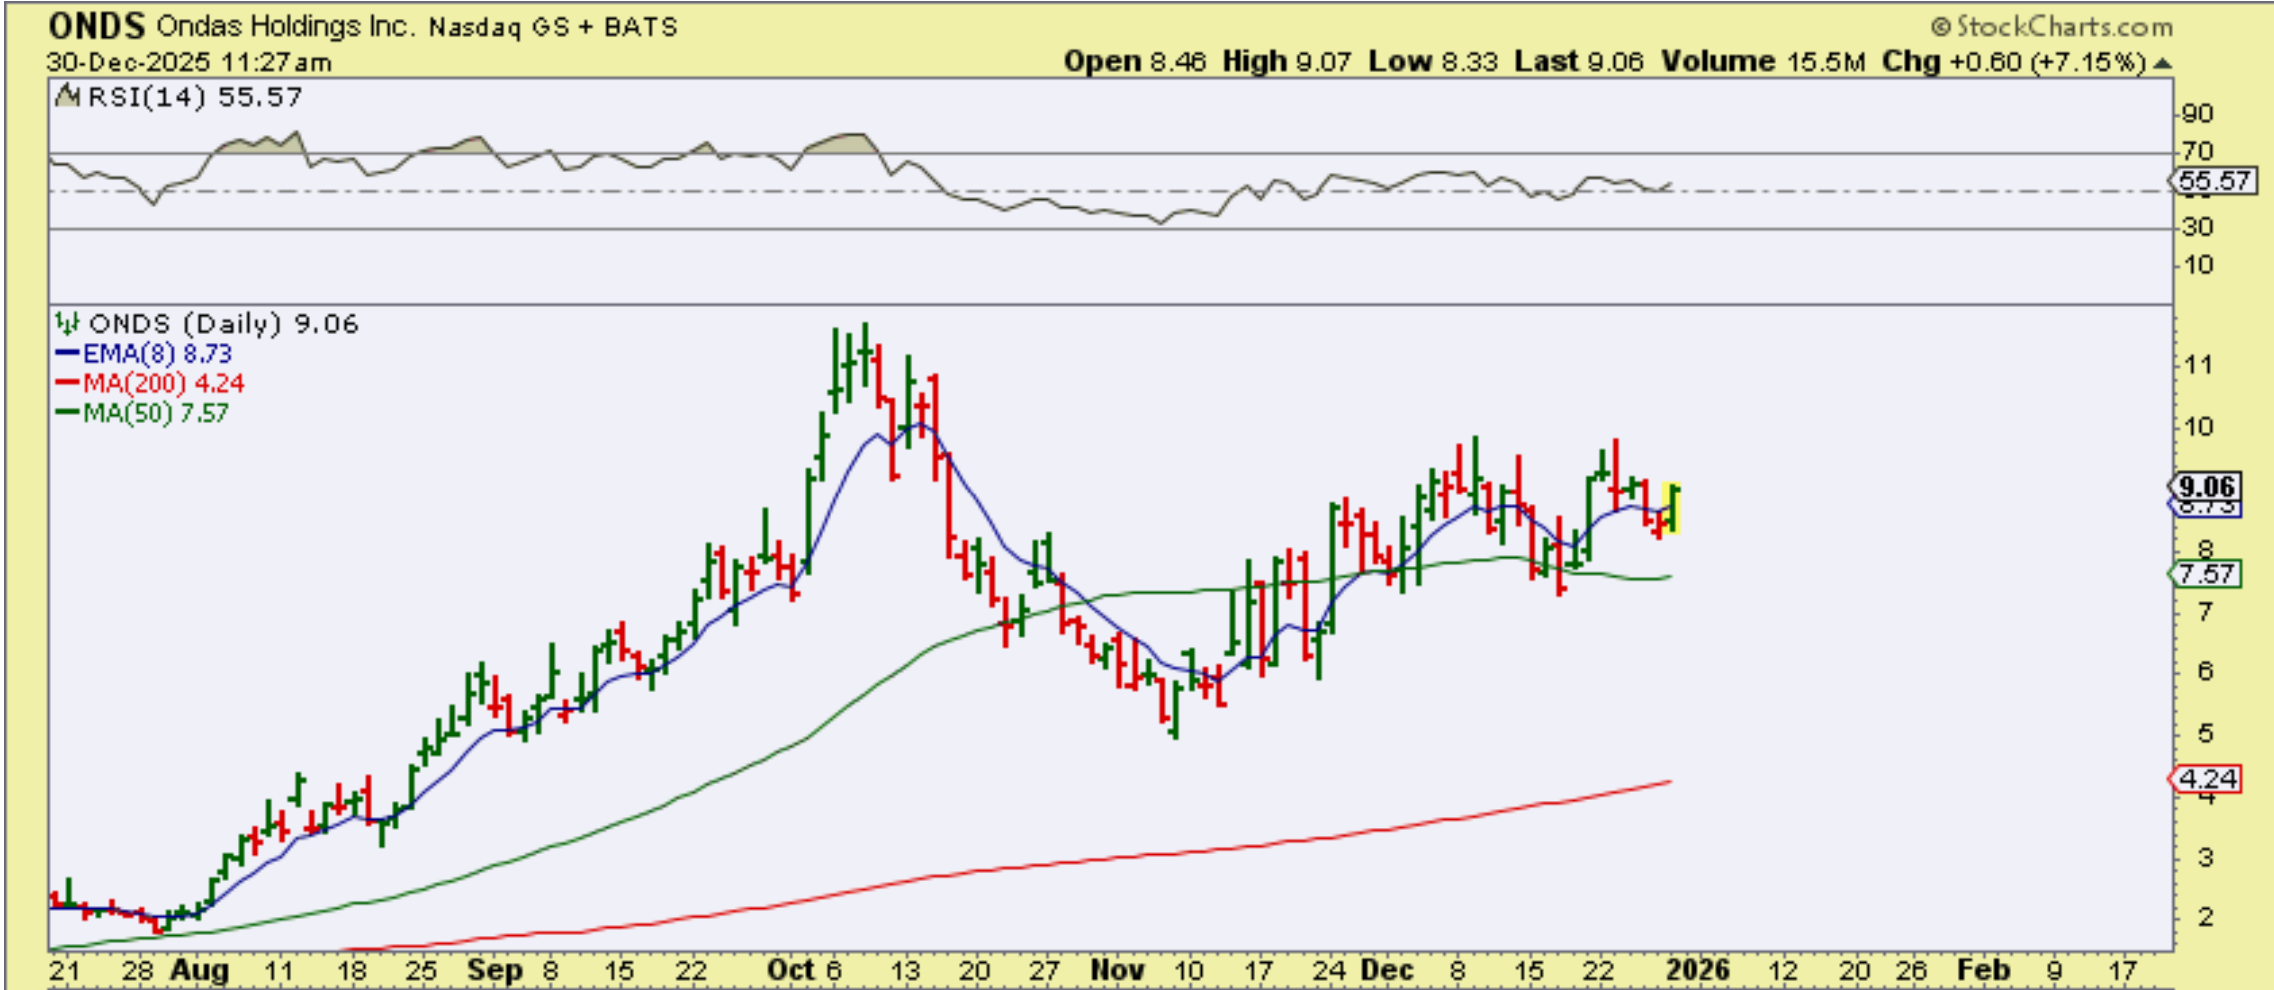
ONDS is choppy but it is a great stock that I have owned ‘buy & hold’. Excellent run this summer. It closed up 13% and is set up like it wants to break to new highs. A cup. Although choppy, it has moved from roughly $5 to $10 since the Nov ICL, and that is a 100% gain already.
.
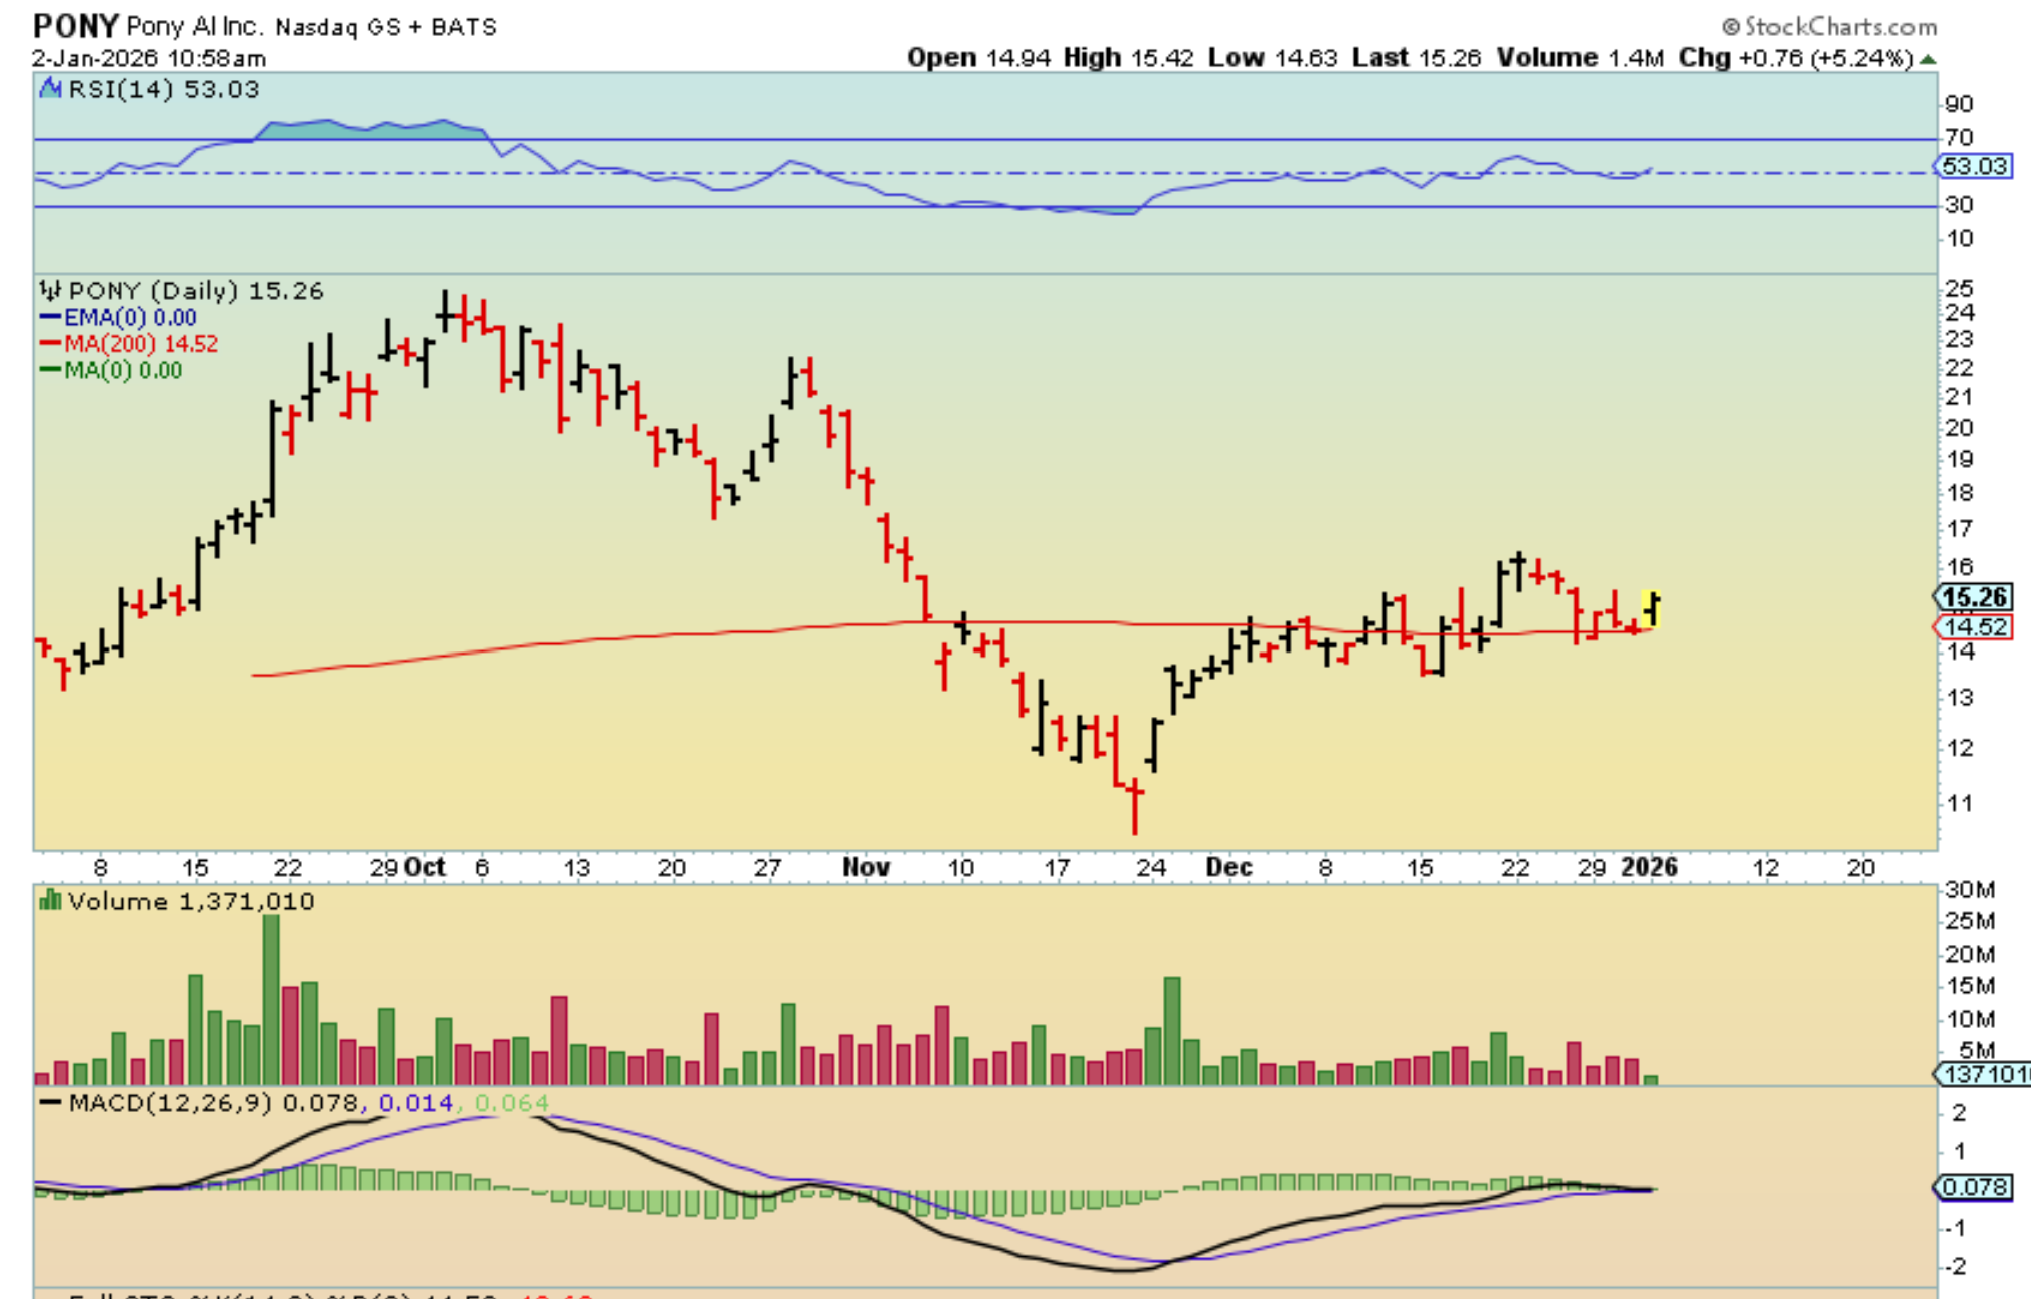
My little Pony is a good set up, so I posted this reversal live. It closed up 11%.
.
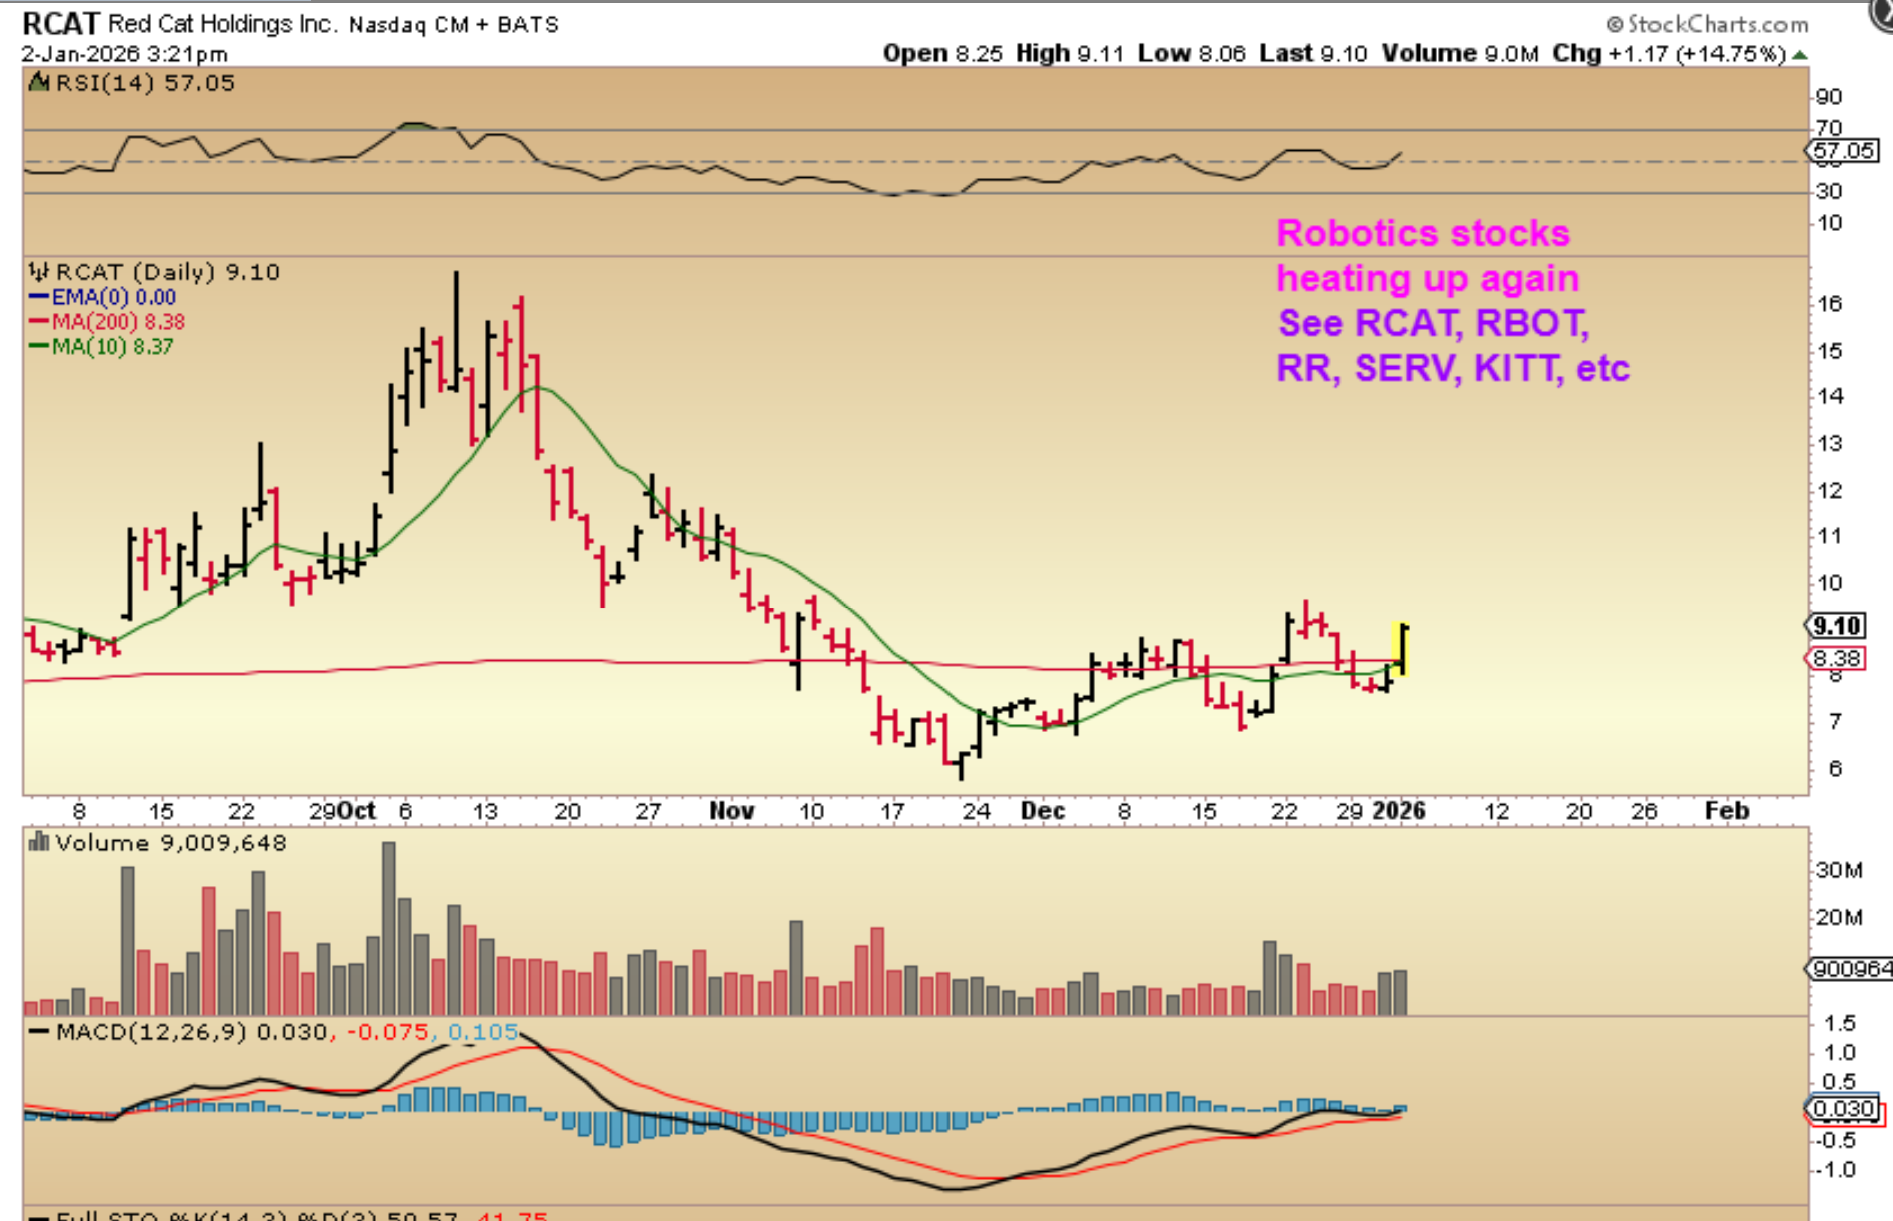
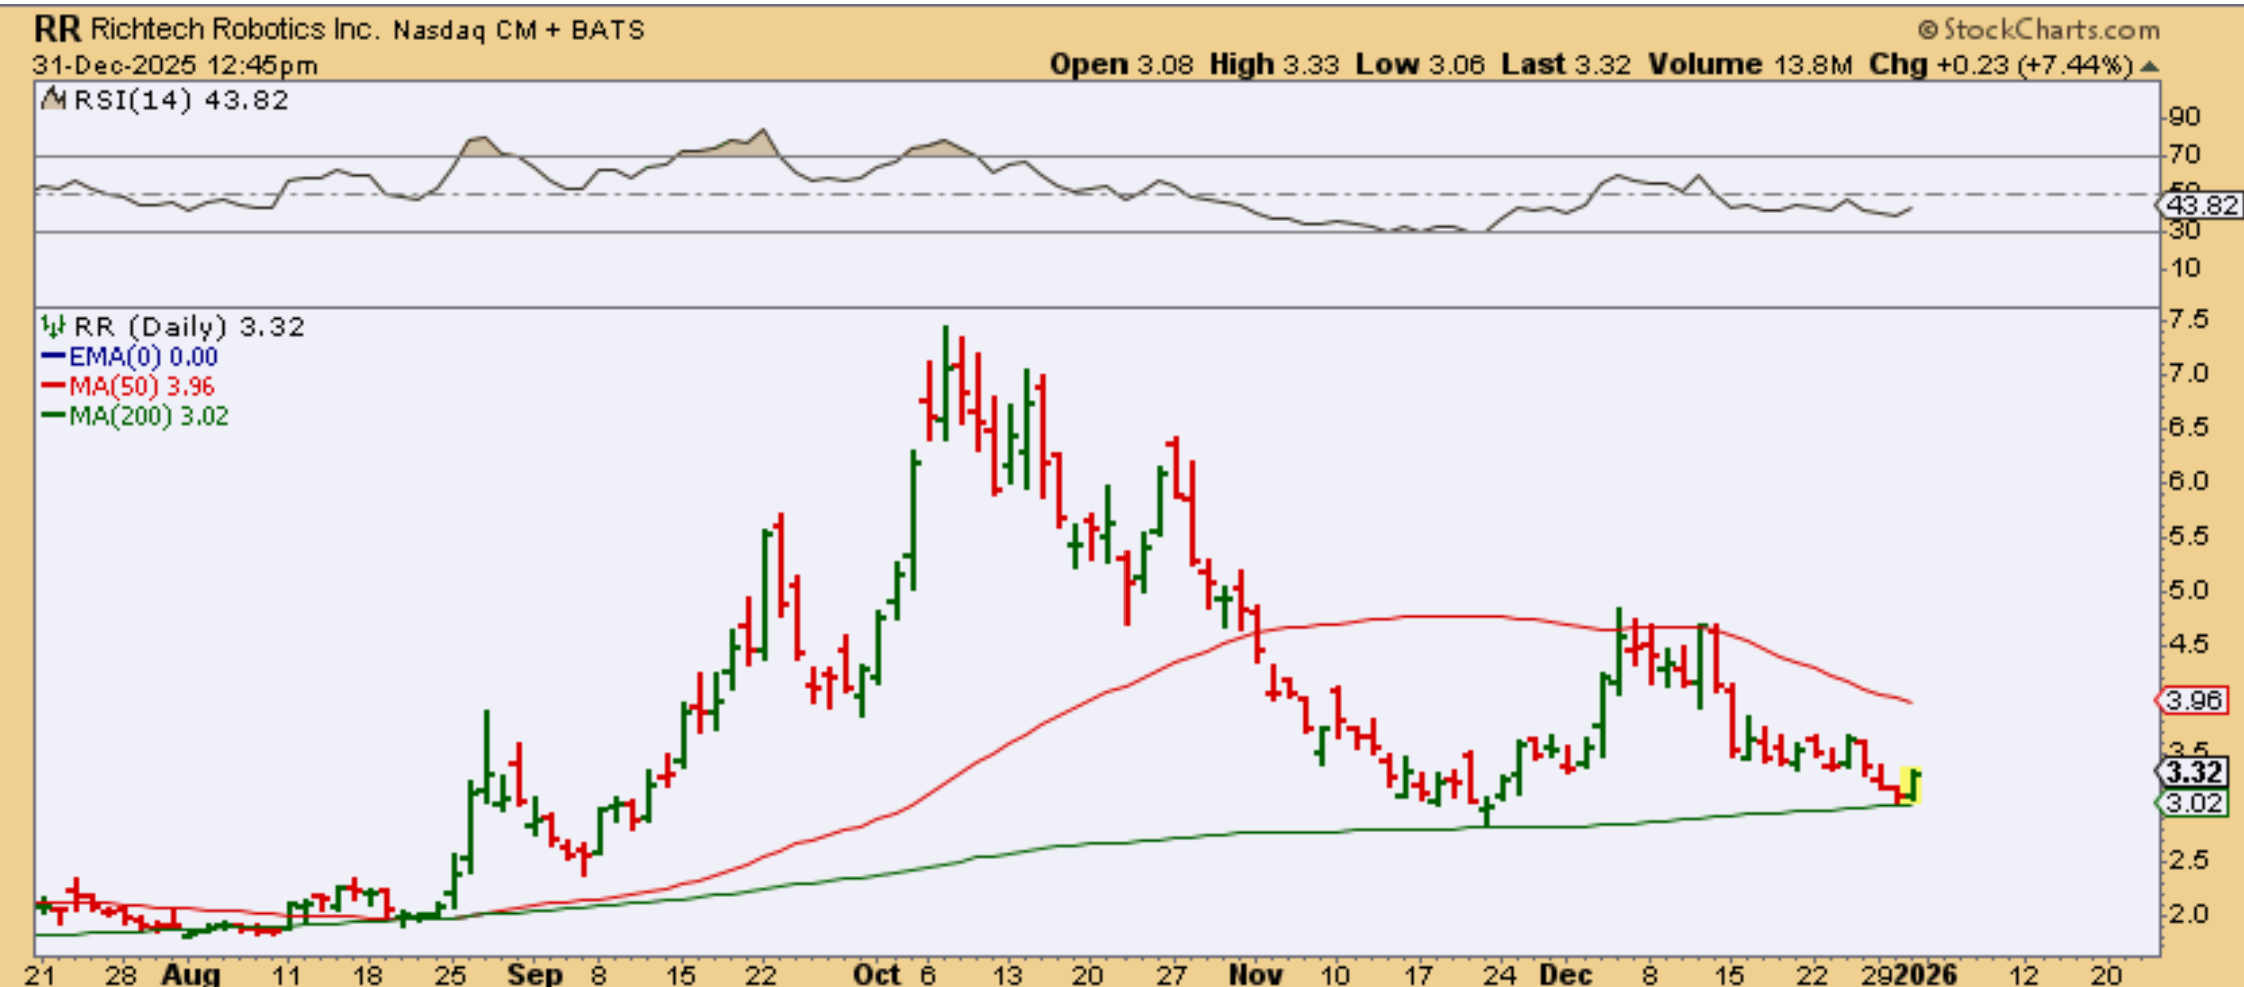
RCAT, SERV, RBOT, RR, KITT, etc did well. These robotics stocks did well in 2025, maybe 2026 too?
.
Everyone knows that I loved RKLB in 2025, and it reversed Friday at support so I posted this live an hr into trading. It was Red to green, only up 2% and it doubled out of the Nov ICL too…

.
RKLB closed up at the highs of the day, up roughly 9%.
.
RR reversed at the 200sma AGAIN. It did rally nicely at the Nov ICL, but it hit the 50sma and also gave it all back. It may be ready for round 2.
.
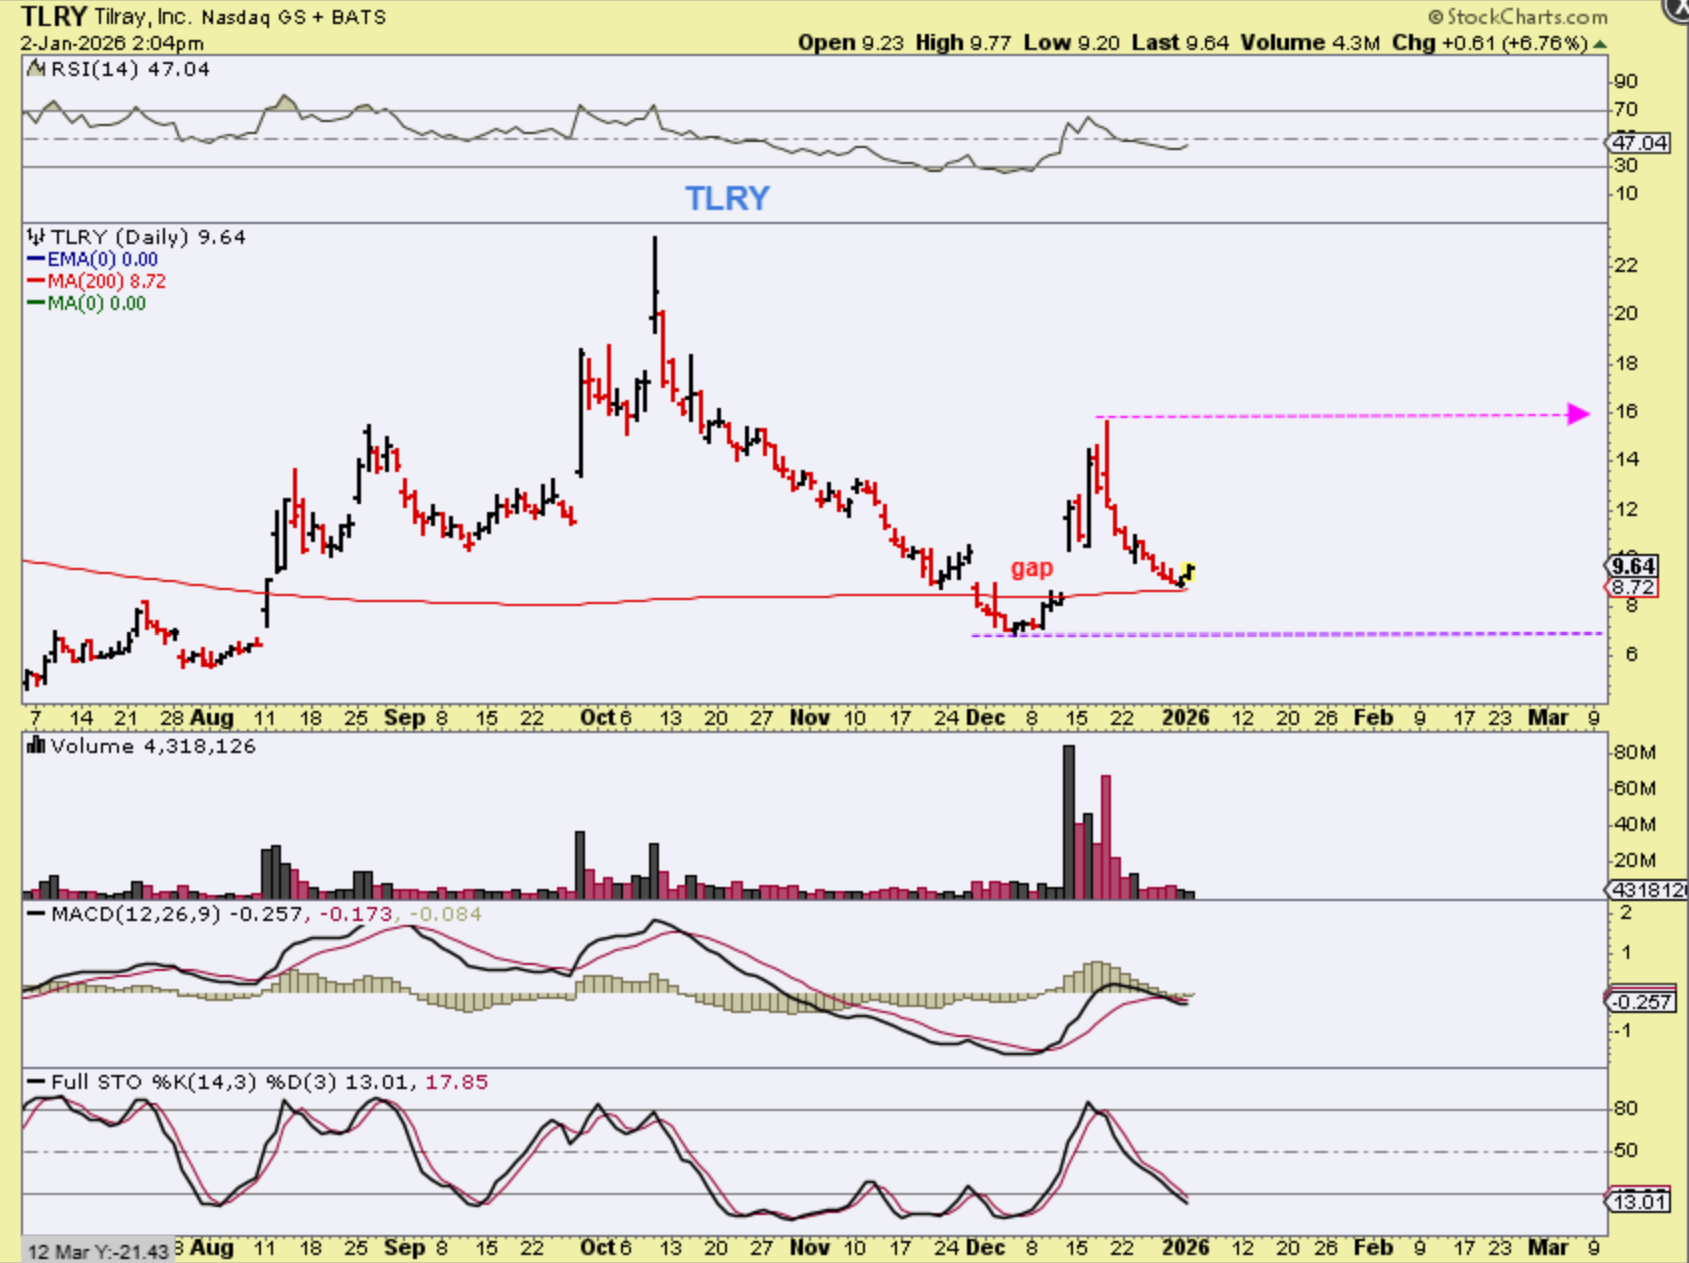
TLRY – The MJ stocks are tricky. They are news driven, but TLRY filled a gap and reversed at support, so buying WITH A STOP can be a plan. I don’t go too heavy with MJ Stocks since they can gap up or down on news.
.
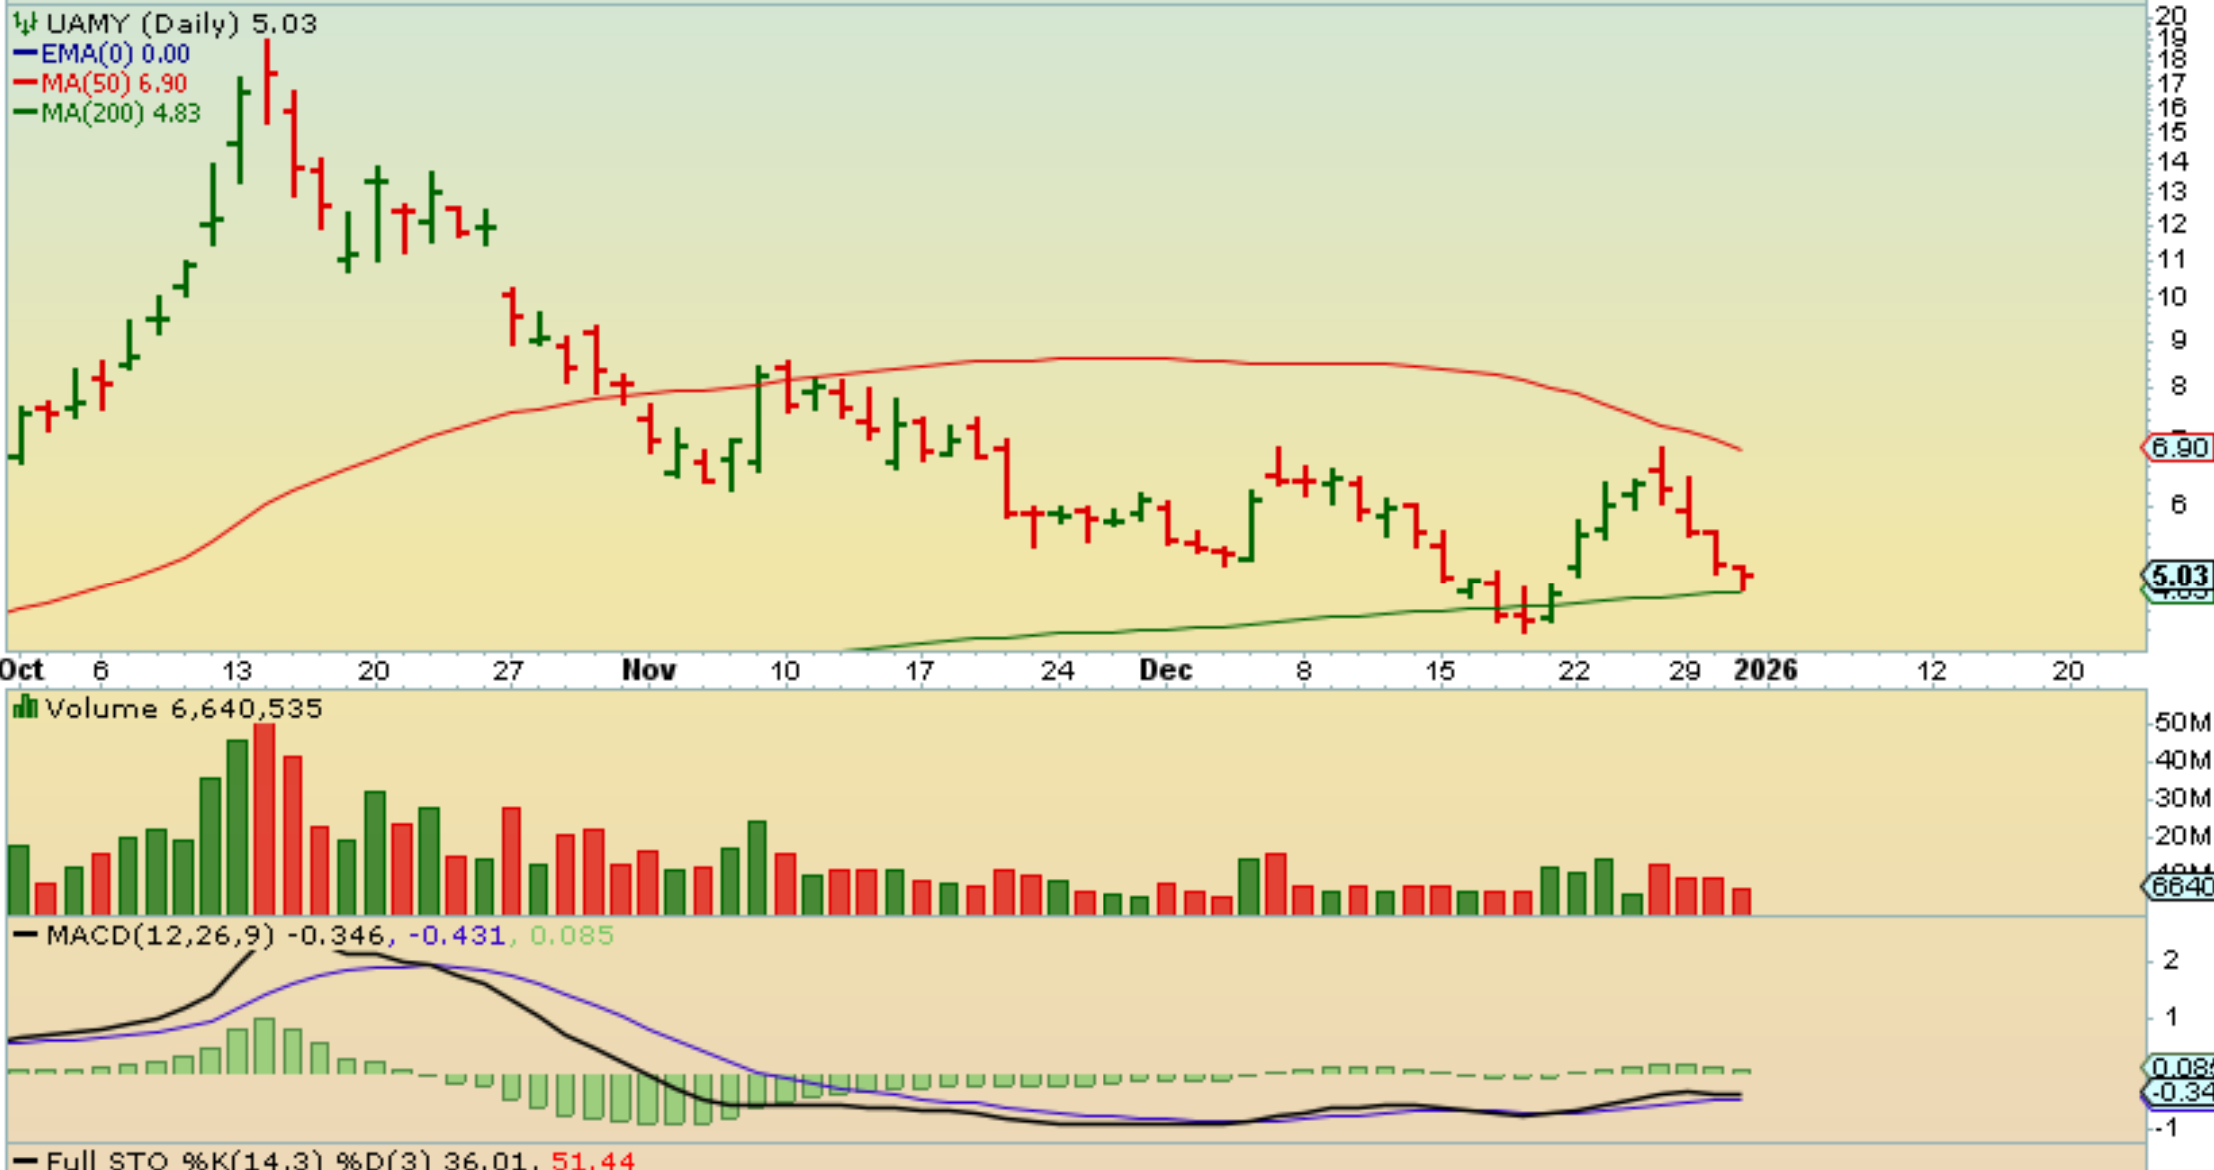
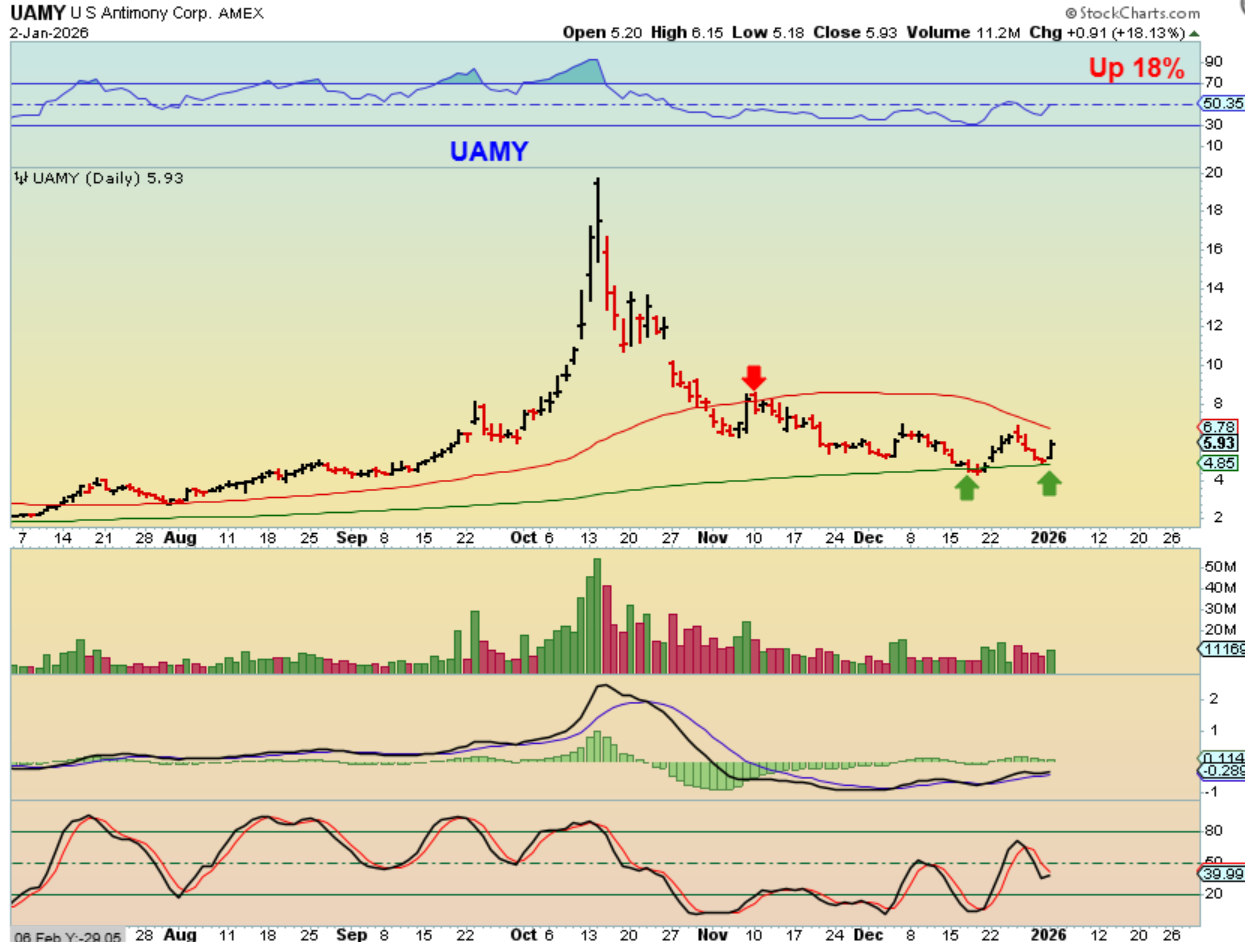
UAMY reverse at the 200sma on Thursday, so I drew this chart and posted it.
.
UAMY was up 18% Friday. I have a feeling that one of these days, these rare Earths and uranium stocks are going to run again.
.

