January 28th – Fed Wednesday
I have a feeling that if we are invested in something that is moving to extremes, and we have a Fed Mtg and his Speech, that day will be one to remember no matter what he says and does. 🙂 We have that set up today, so we’ll see what happens…
.
.
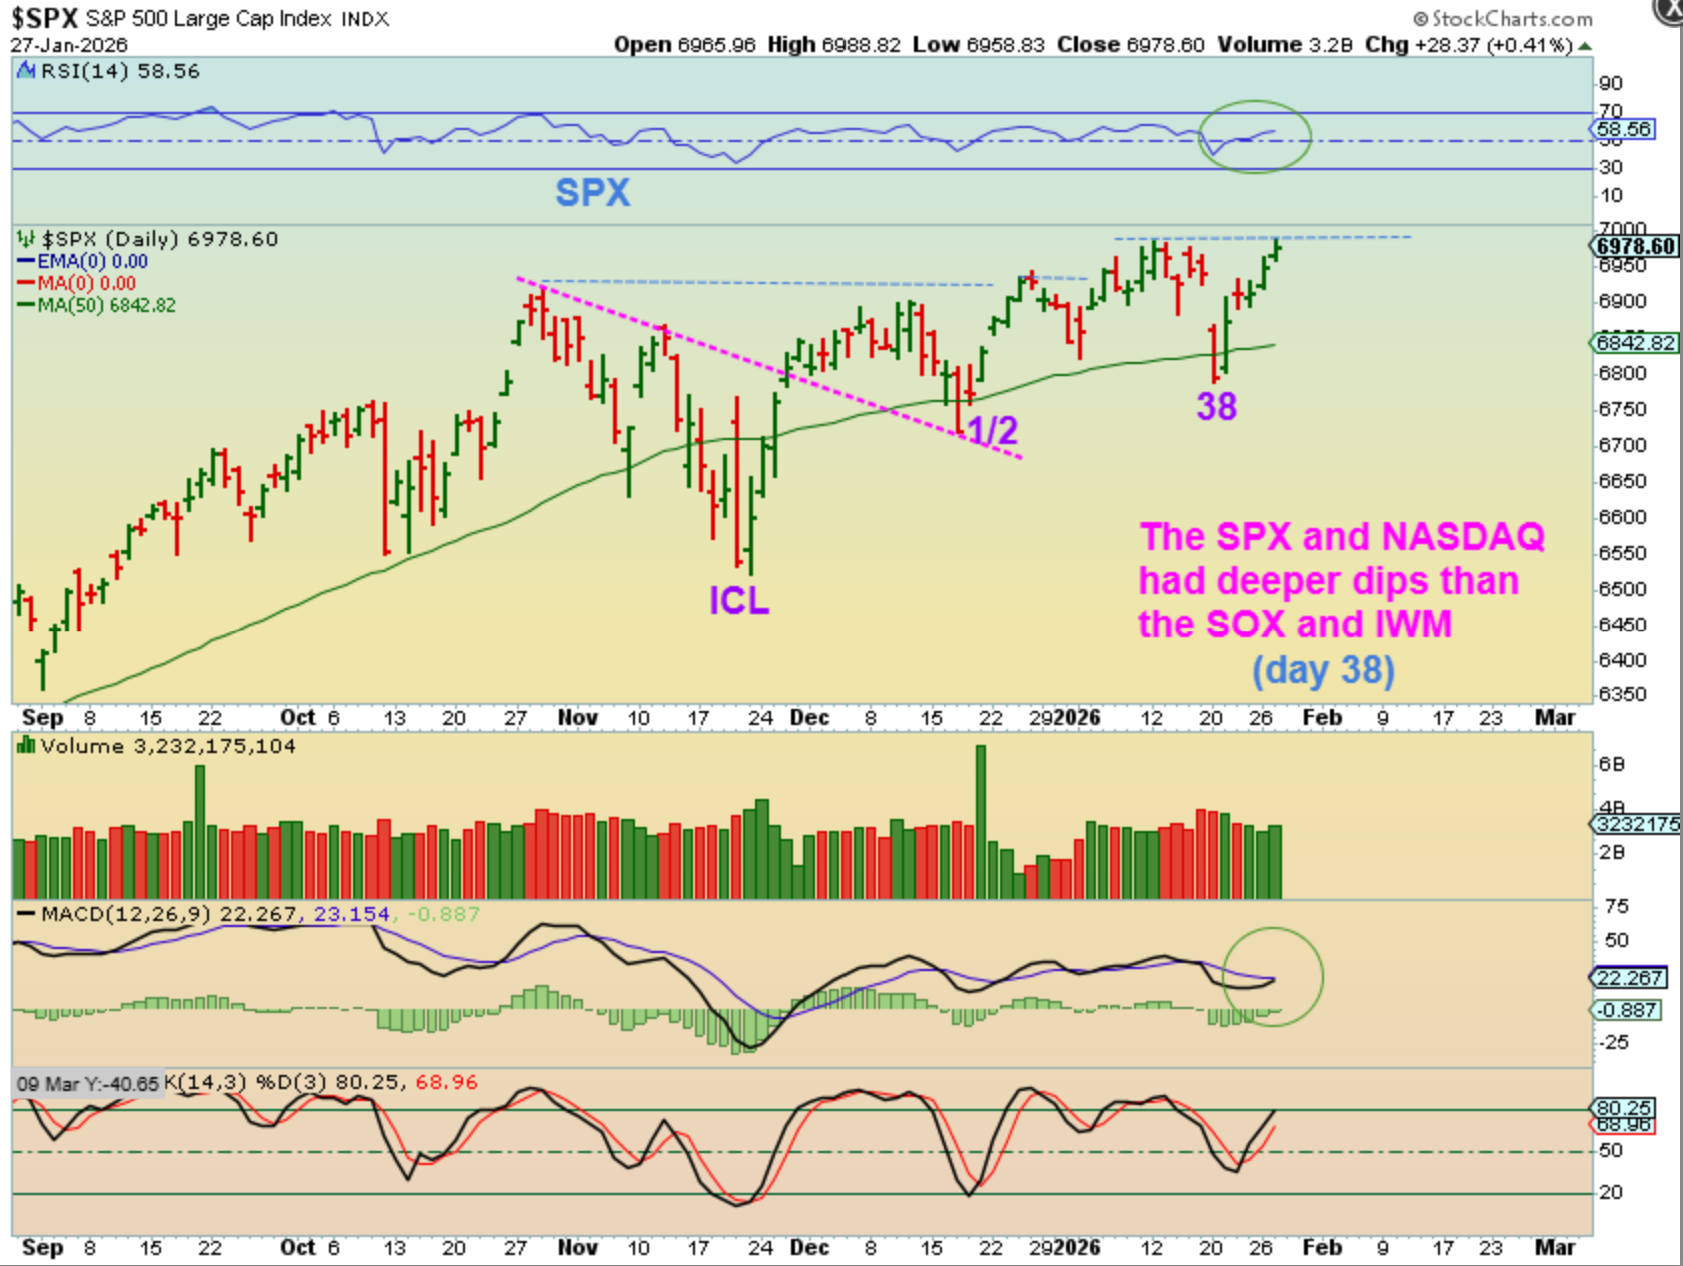
SPX looks to be moving higher on day 5. I noticed that some seem confused that the IWM was selling off, but I had actually mentioned this in the last report and I thought that it was mentioned in the weekend report too. So an idea of what may be happening is this…
1. Look at the drop of the SPX & NASDAQ 6 days ago on day 38. THEY BROKE BELOW THE 50SMA. We saw a shakeout and that now looks like the day 38 dcl.
2. Next we’ll look at the IWM again…
.
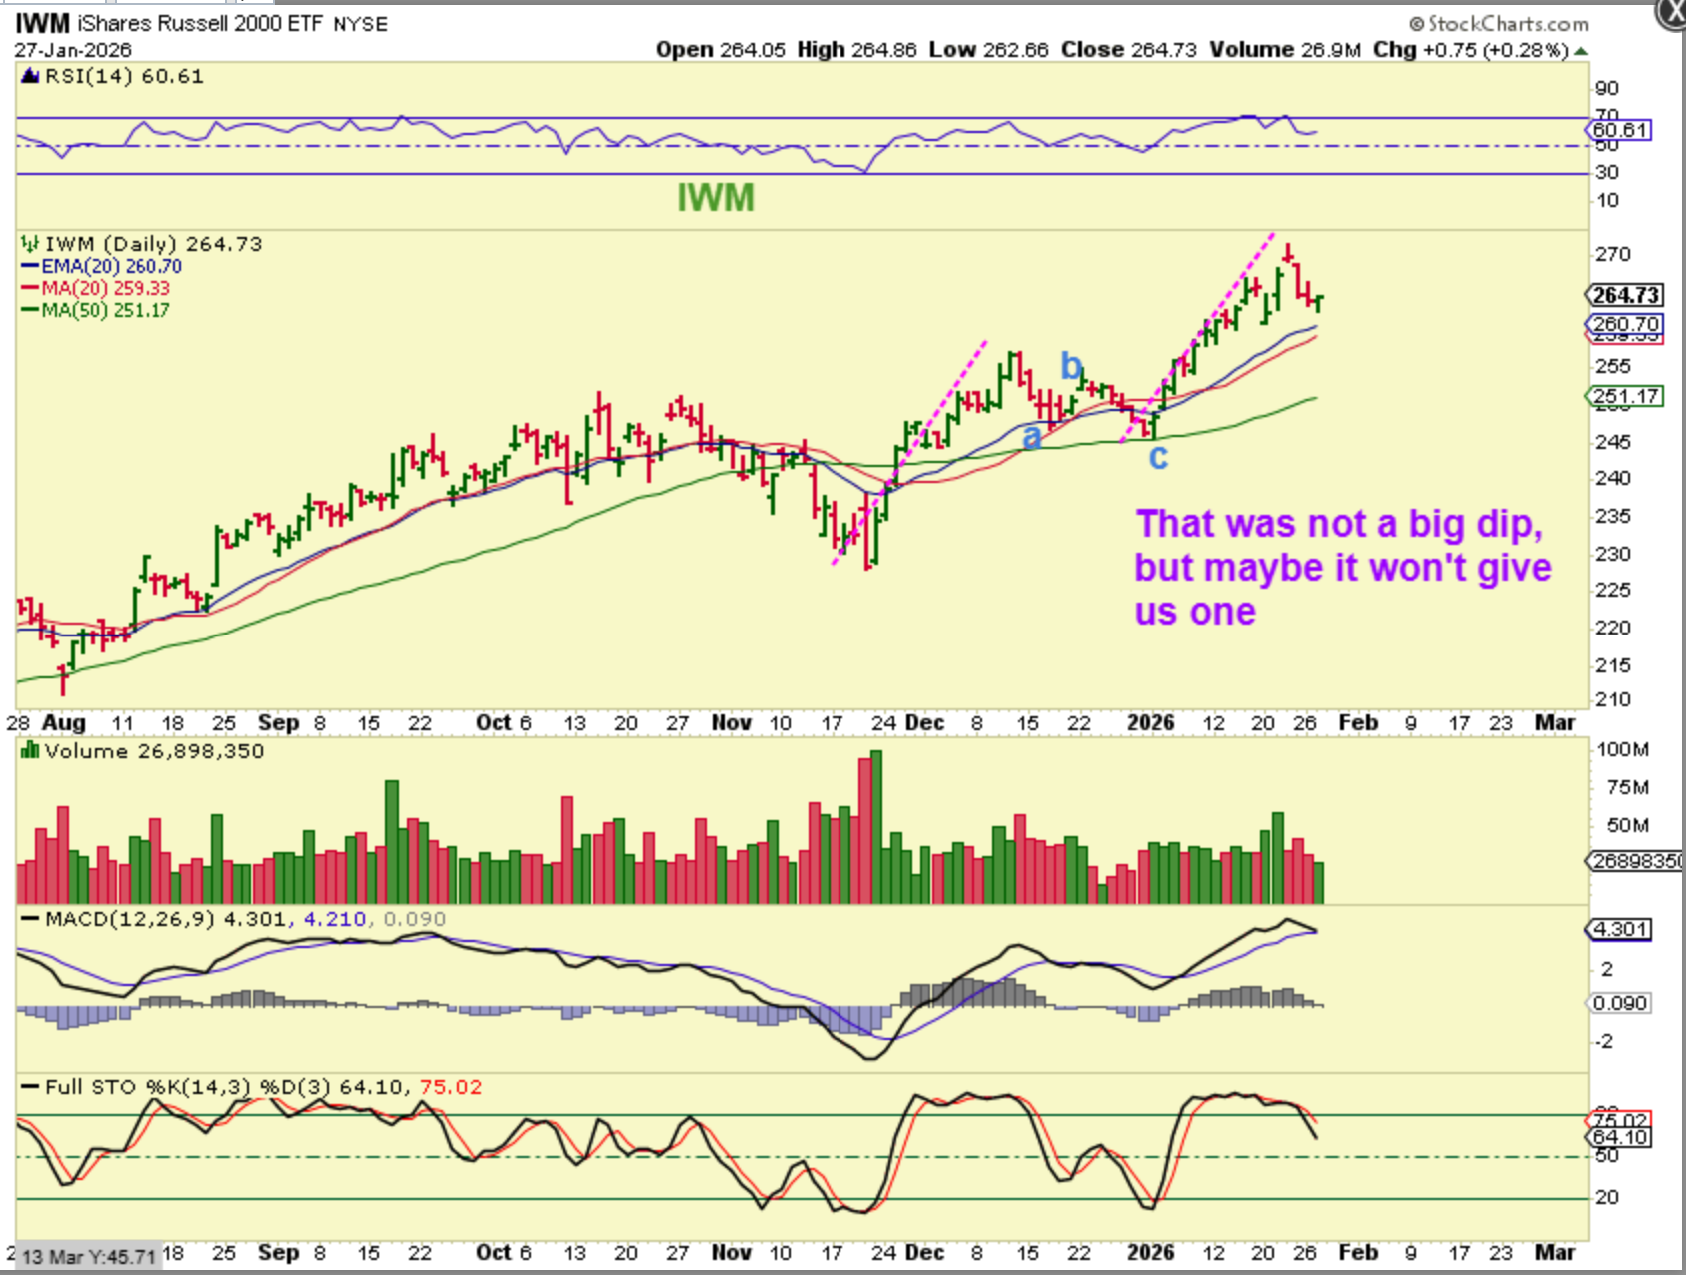
IWM –
2. Next look at the IWM on day 38. Did it crash down through the 50sma last week? Not even close! Was there a visible DCL drop last week? No…so the current dip may be that dcl dip coming late, but the IWM is strong. This pullback is very tame so far and Tuesdays reversal may or may not be the dcl for the IWM…
.
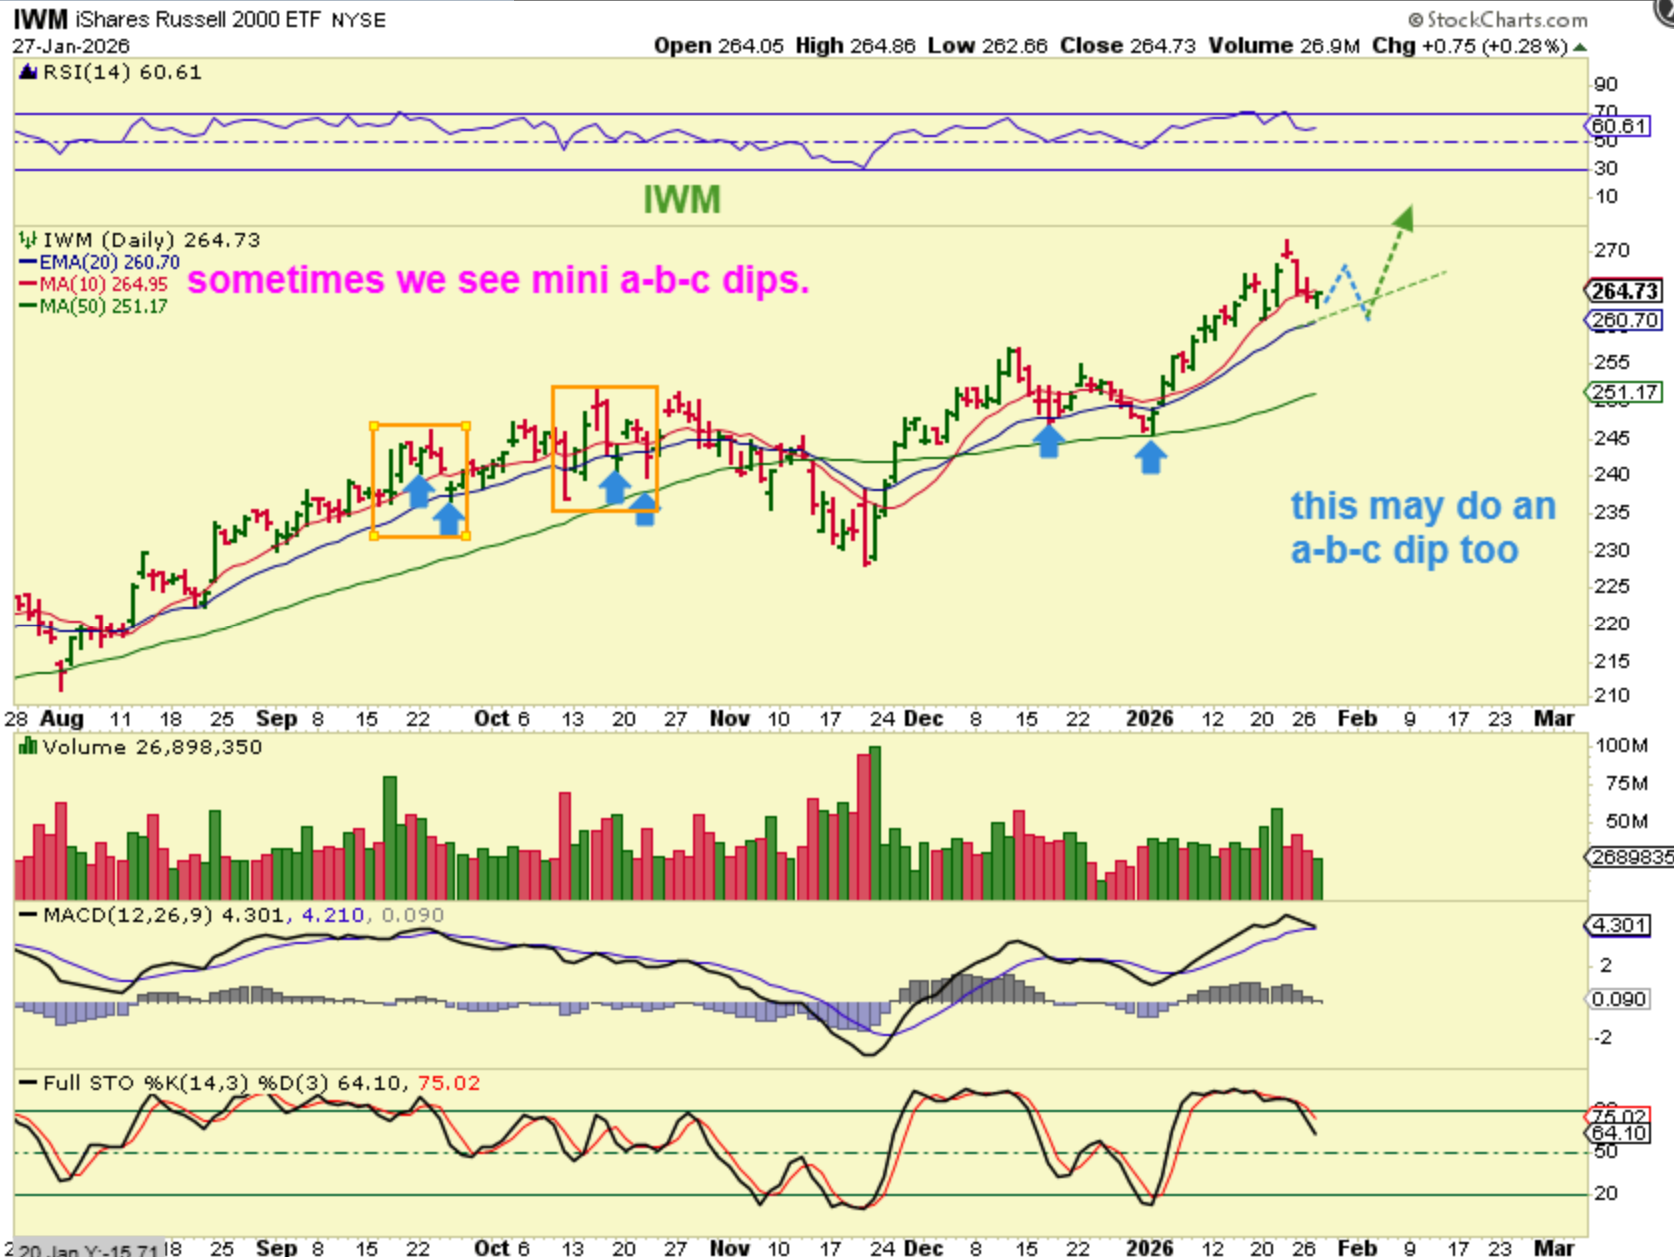
IWM – I often see a dip, small bounce, and a dip again (a-b-c), so I drew one in here simply because we have a Fed Mtg on Wednesday and this is the kind of thing that could happen. Volatility. Price also may just rally higher out of this dip as a mild dcl, we just don’t know yet with the Fed ahead.
.
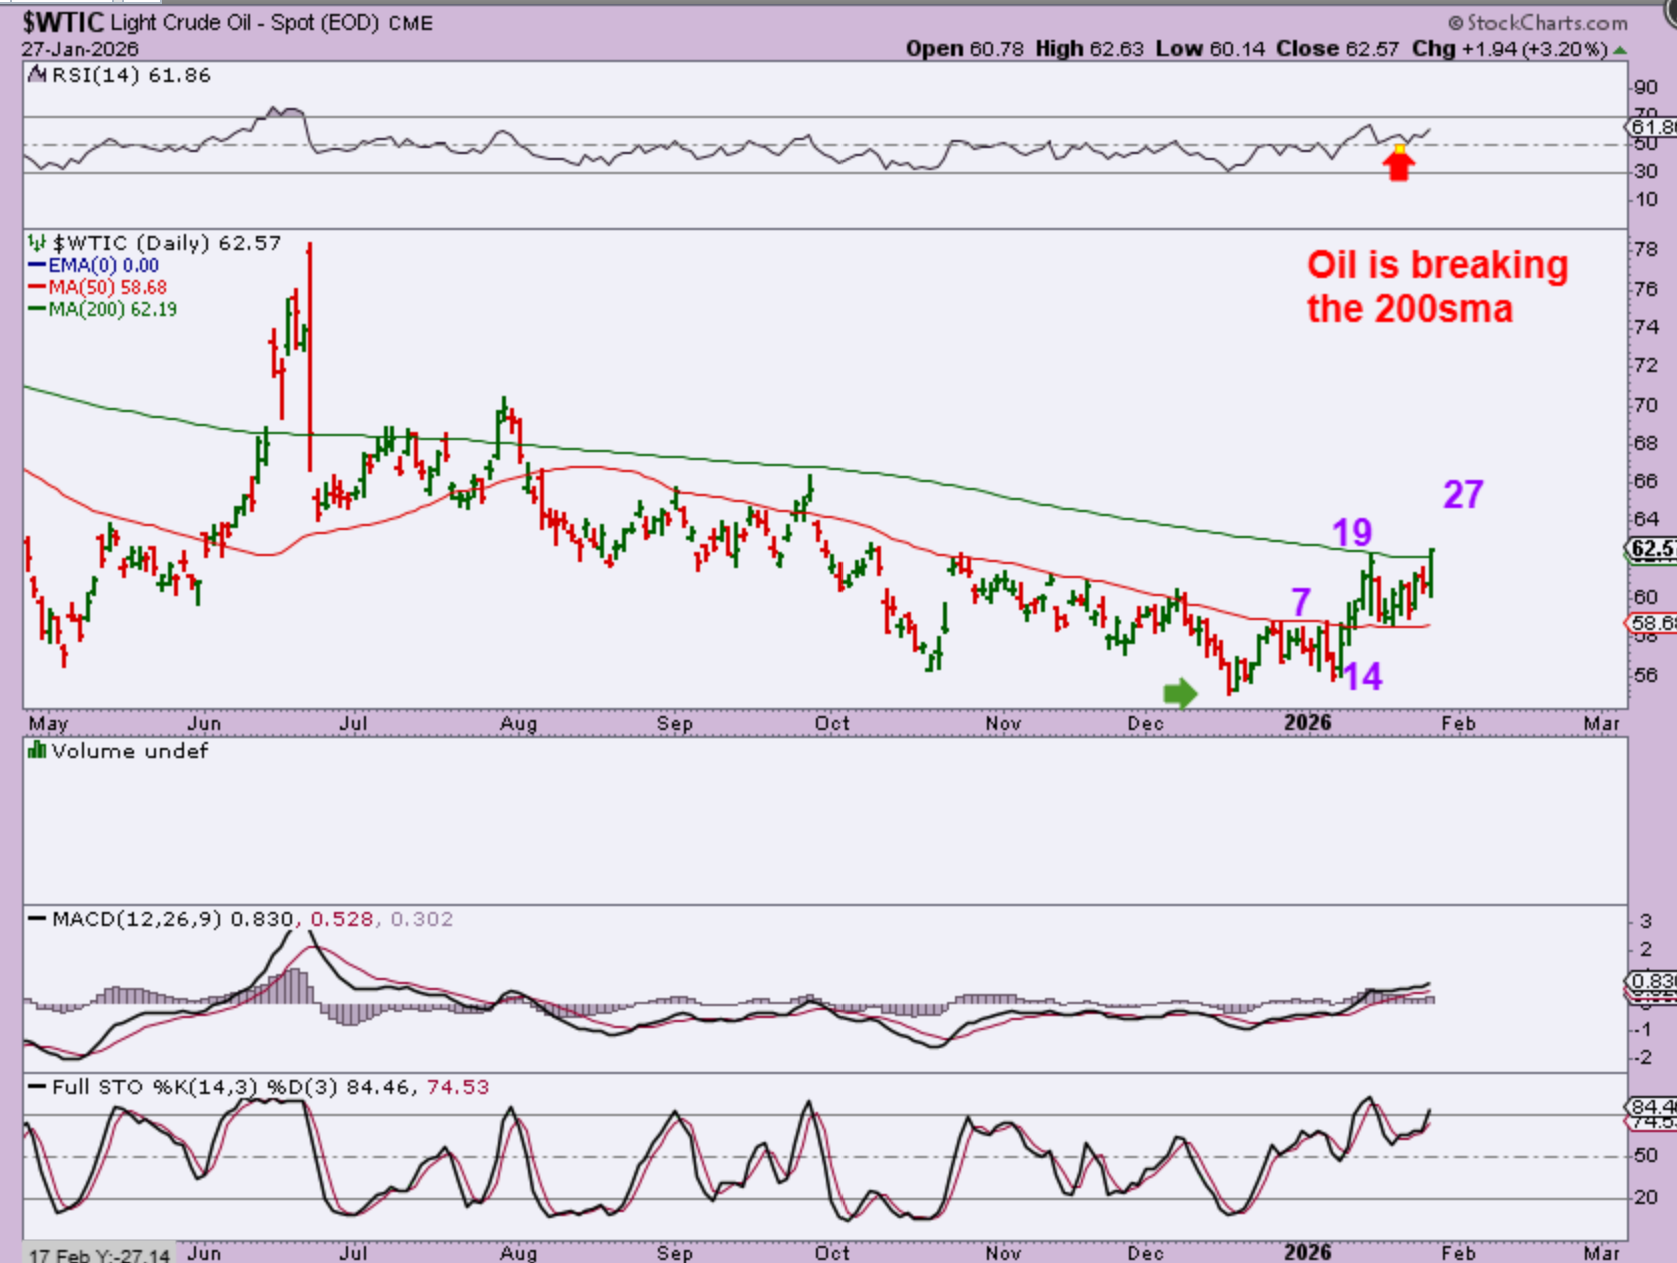
WTIC – Oil is continuing on with its strength. After breaking above the 50sma, it bounced around and is starting to break through the 200sma now. It is only day 27 out of a possible 50 plus, so this could rally from here too.
.
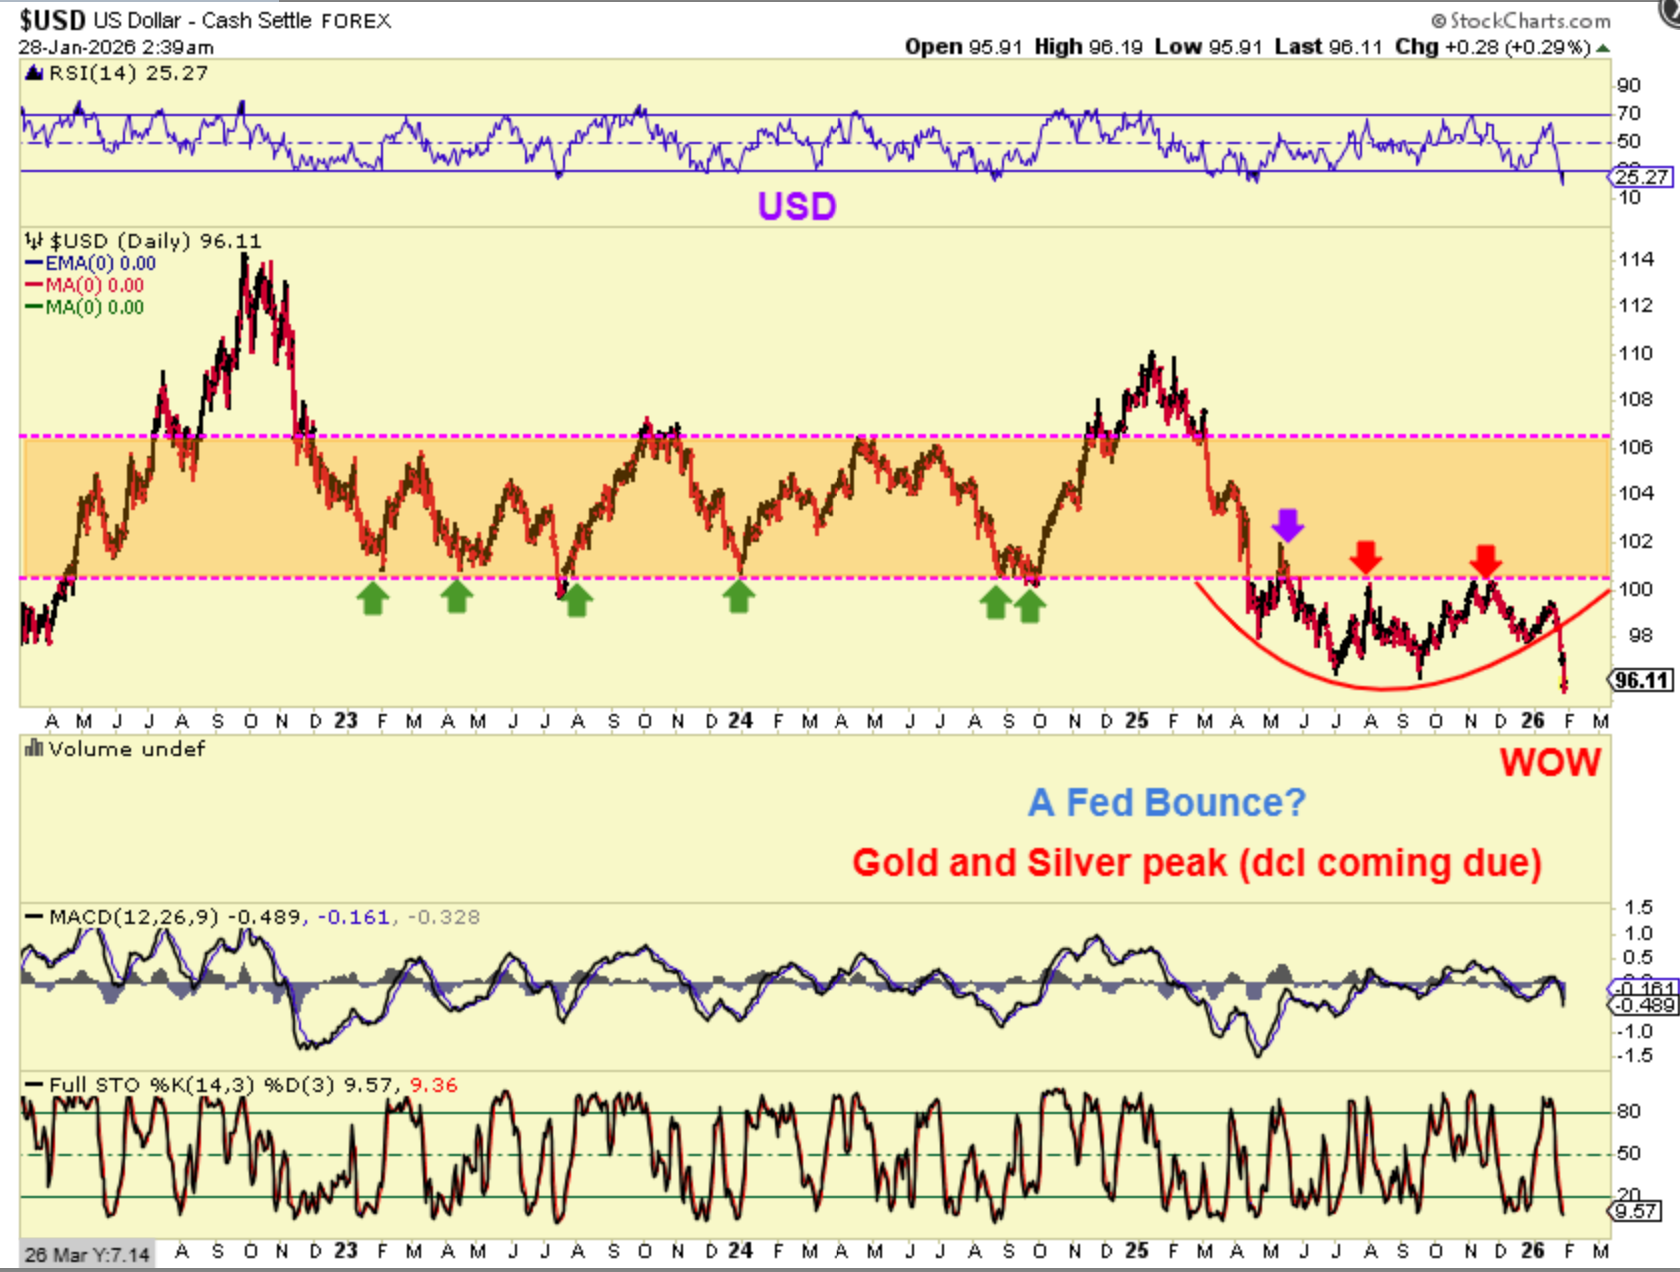
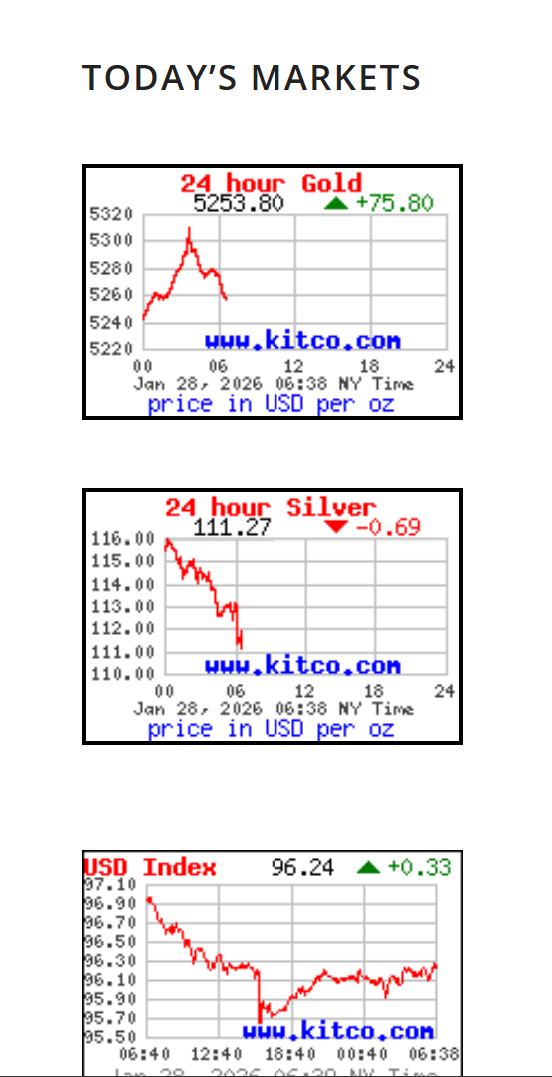
THE USD has plunged to new multiyear lows. Heading into the Fed Mtg the USD dropped sharply and Gold and Silver went straight up. That makes me think that we are going to see reversals this week. Please see the chart below.
.
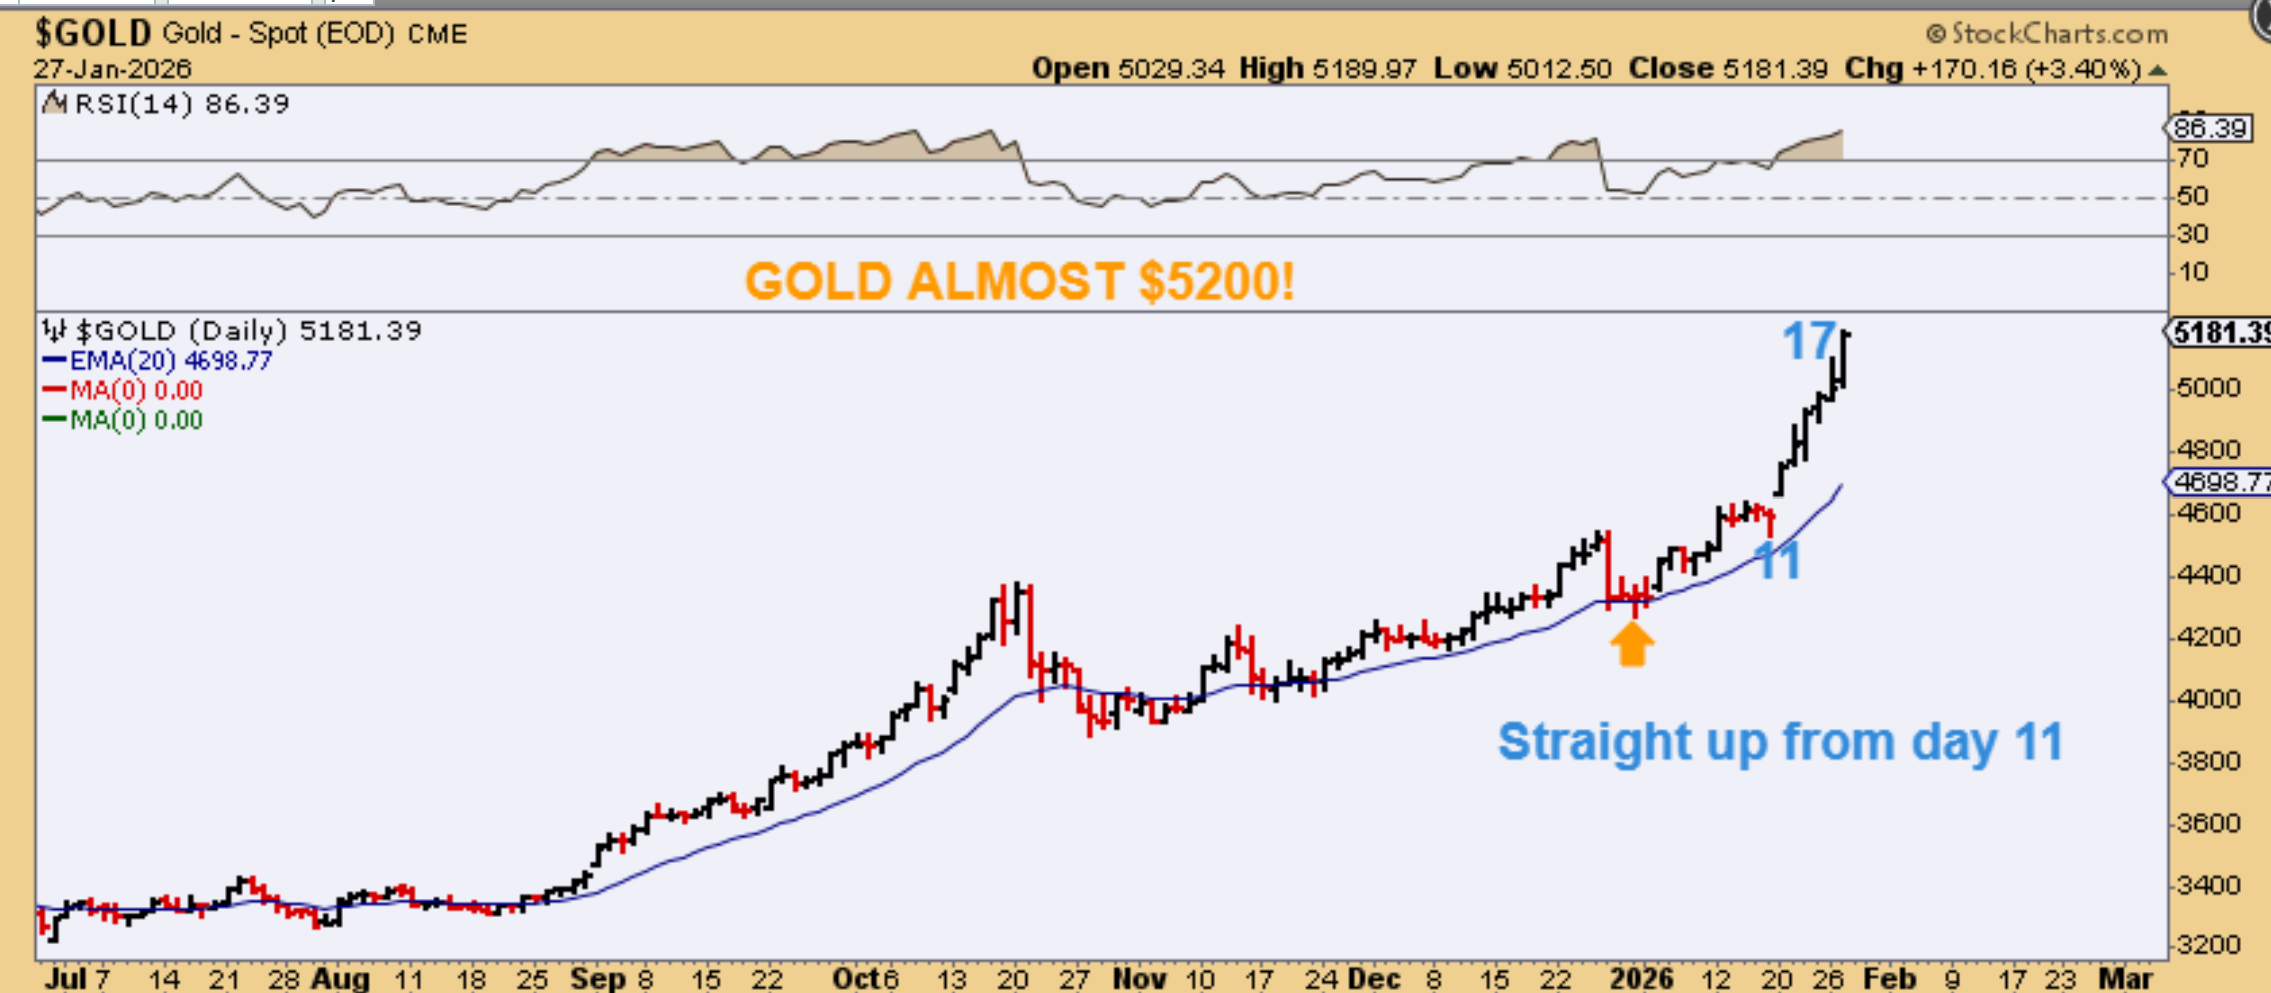
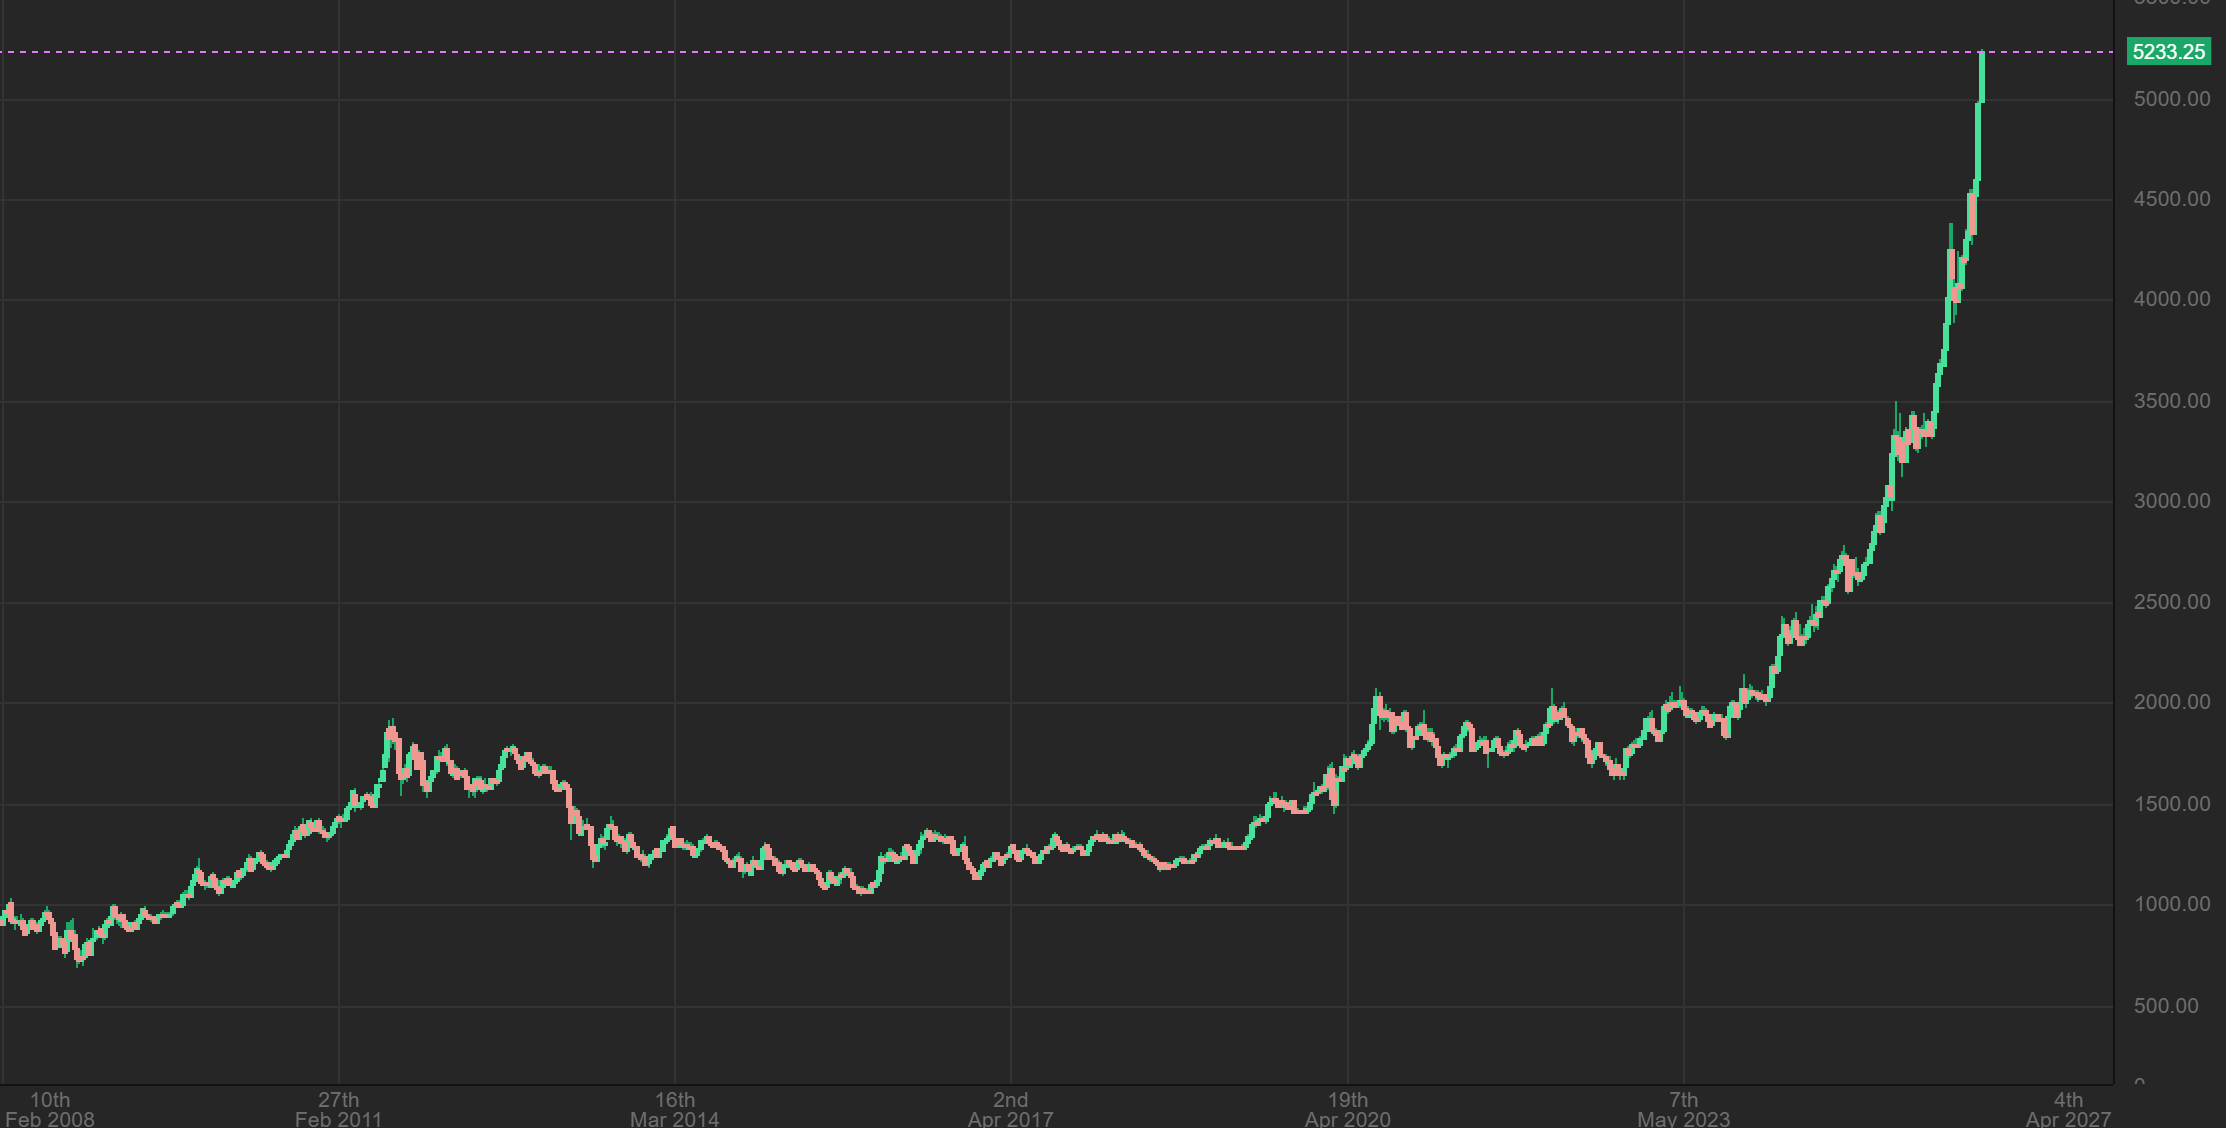
GOLD – We have had a solid run higher heading into the Fed Mtg. We are at day 17, so a peak can occur at any time. That said, it also can surge and put on a couple more days higher, so all we can do is wait and see what the Fed says and how that does affect the precious metals run.
.
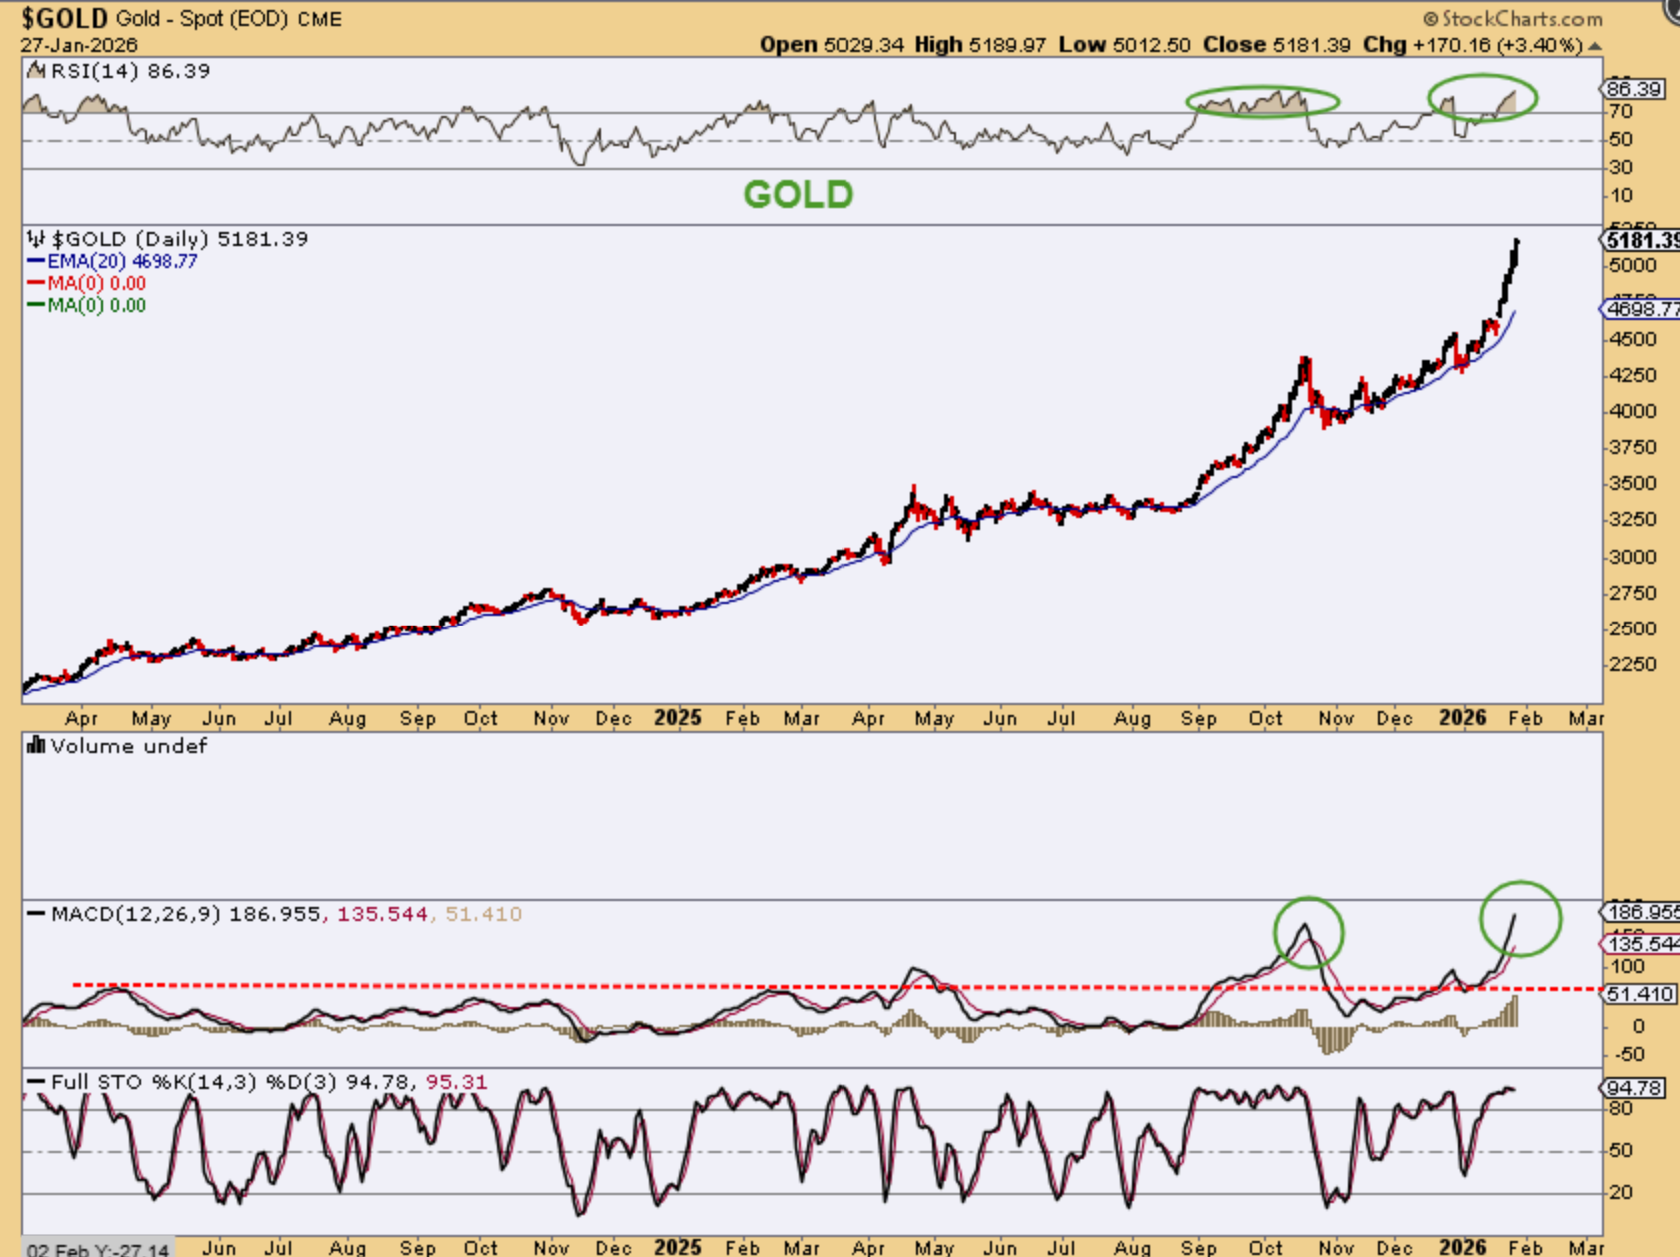
GOLD -Stepping back you can see the move has been pretty close to straight up since that day 11 dip. The MACD and RSI are at extremes, and that just can’t go on forever. Do you want to see the weekly chart?
.
GOLD WEEKLY – Yes, the Gold Weekly chart is breathtakingly… Amazing!
.
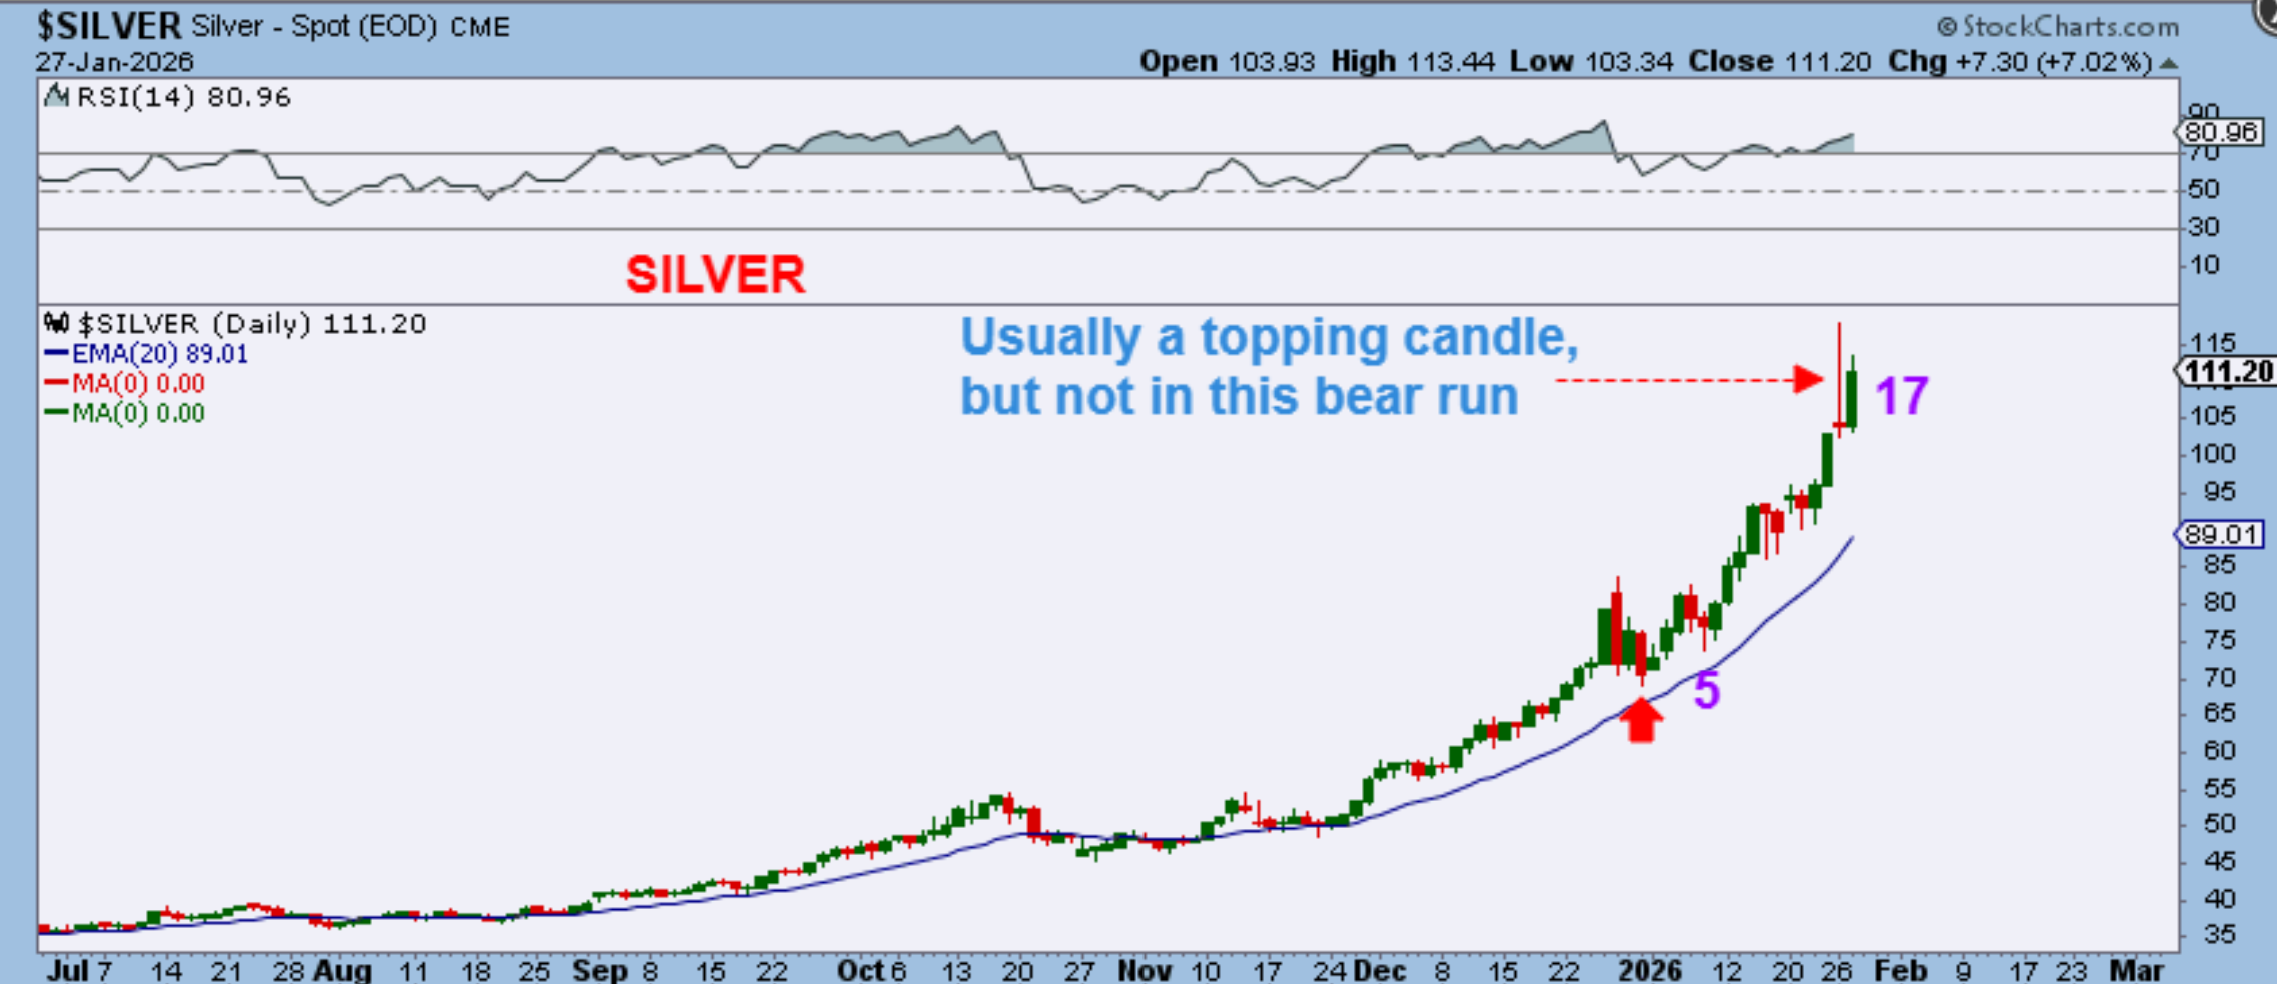
SILVER DAILY – Silver popped up on Monday and then sold off. That is usually a reversal candle, but Silver decided to continue that path higher. This is a strong bull with surprises to the upside for sure.
.
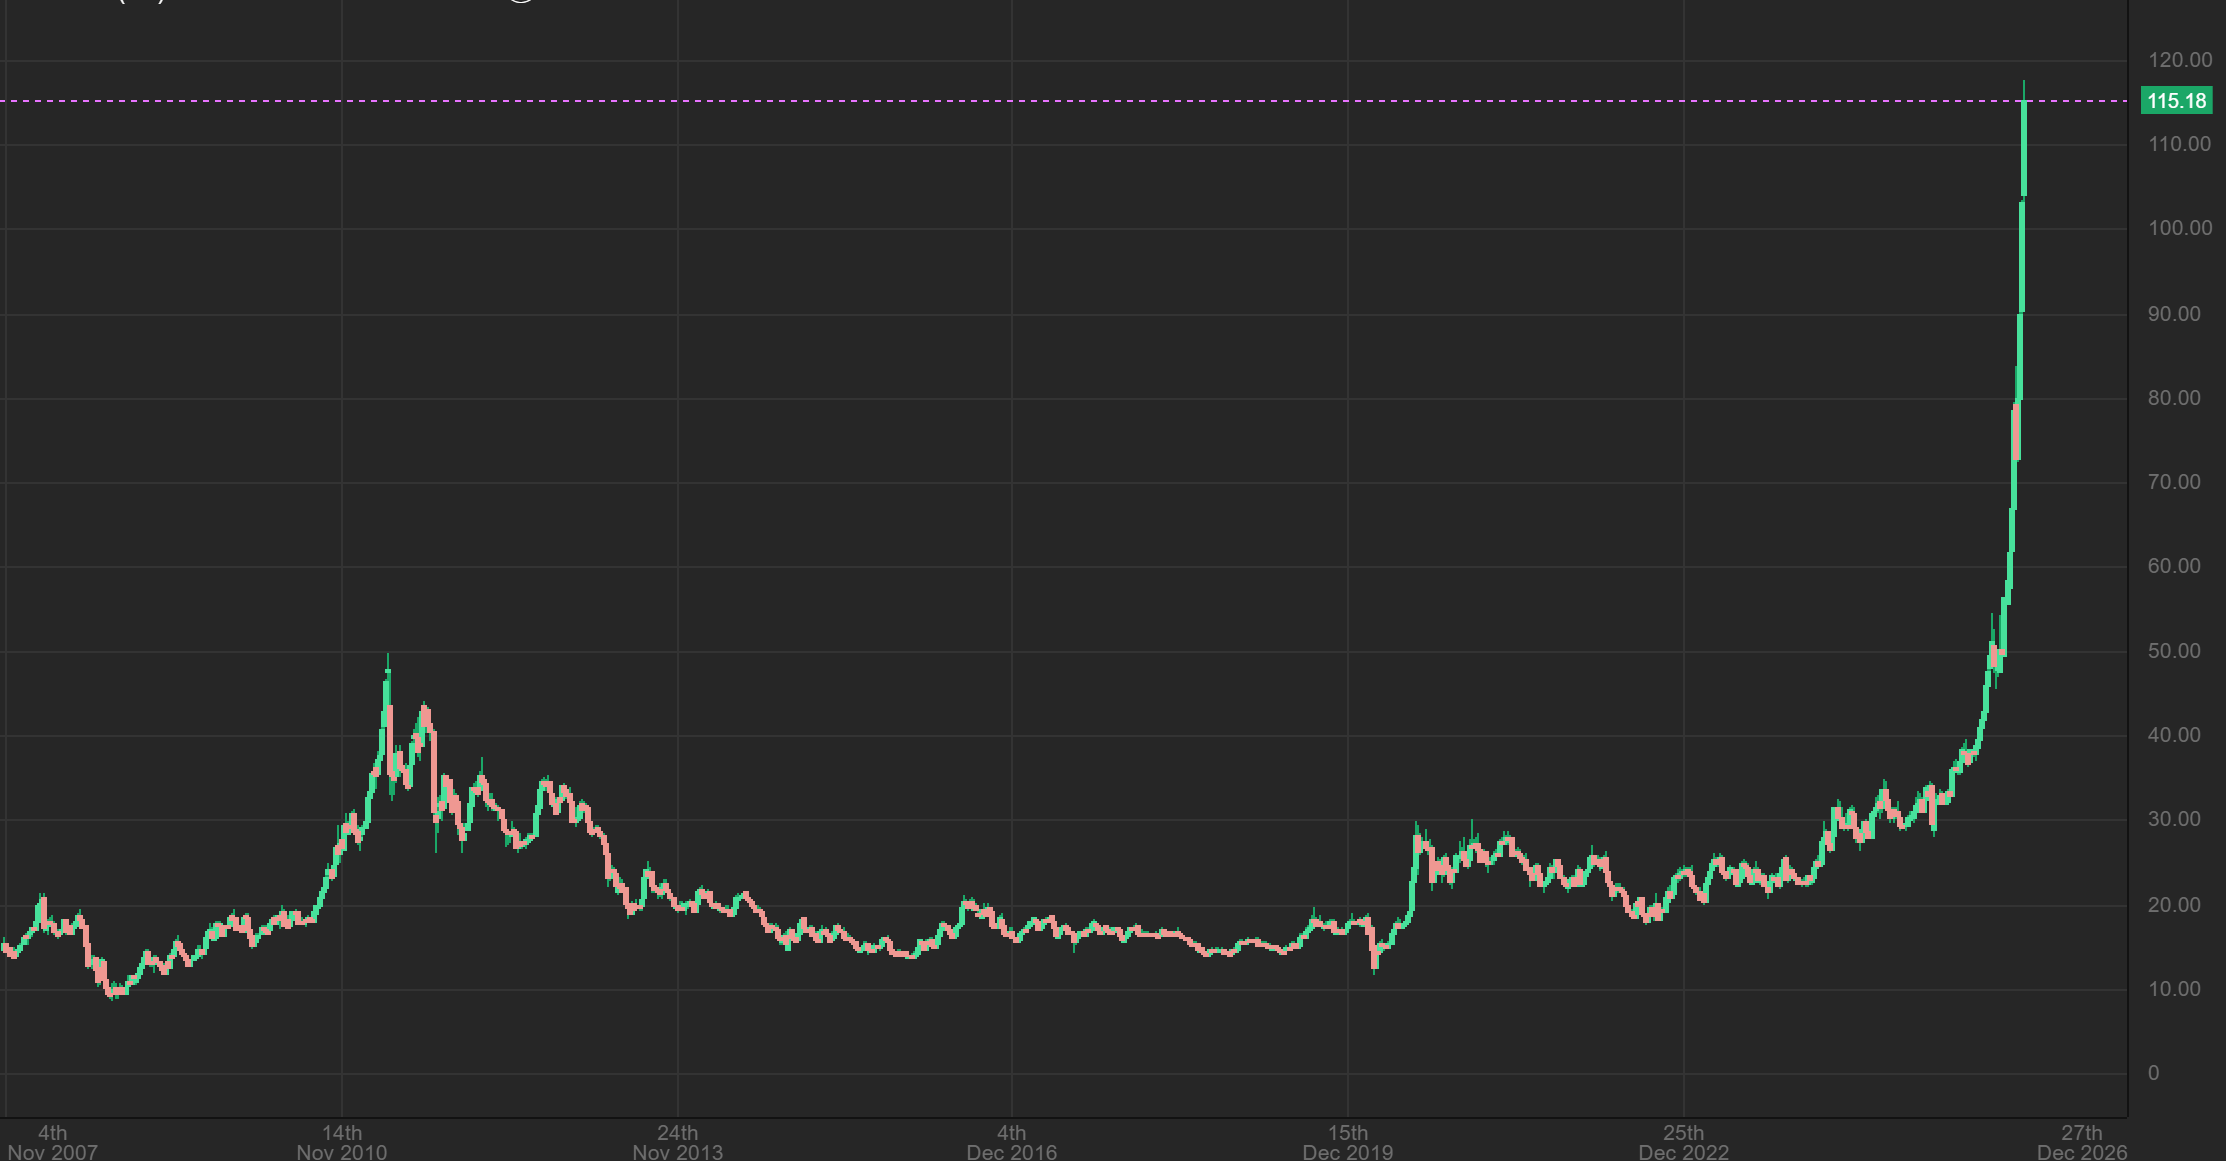
SILVER – This is still a daily chart but you can see the arch of the parabolic climb higher. Coming out of the October dip I thought that it could reach $80 and there was a $97 target area, but this blows that away with Silver going over $117! Remember when Silver was $11 last year? Wow! Do you want to see the weekly now?? 🙂
.
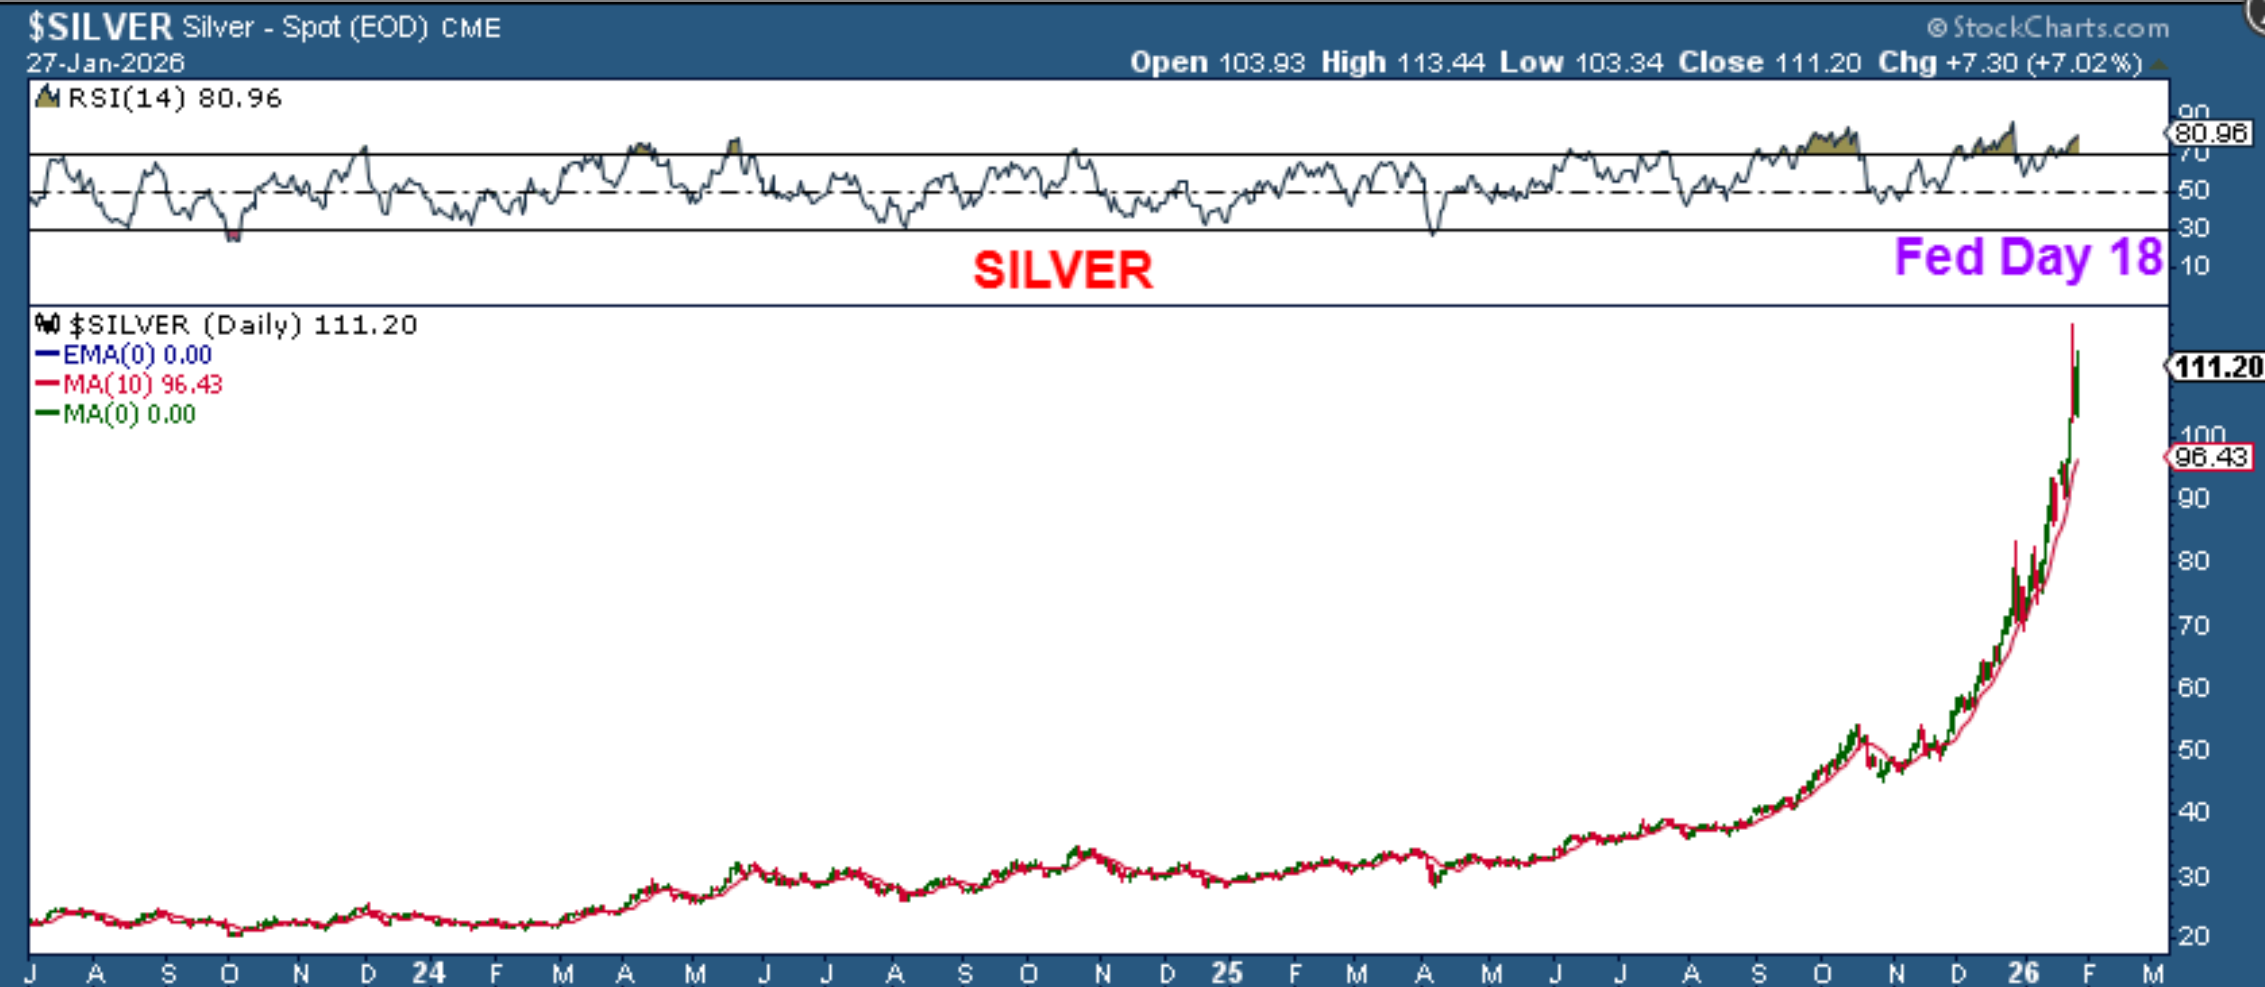
SILVER WEEKLY – This is an extremely strong move! I honestly cannot even imagine what kind of a pullback this will eventually do, but these moves are unsustainable, even though it feels like it will never stop. That 2011 parabolic peak hardly looks parabolic now.
.
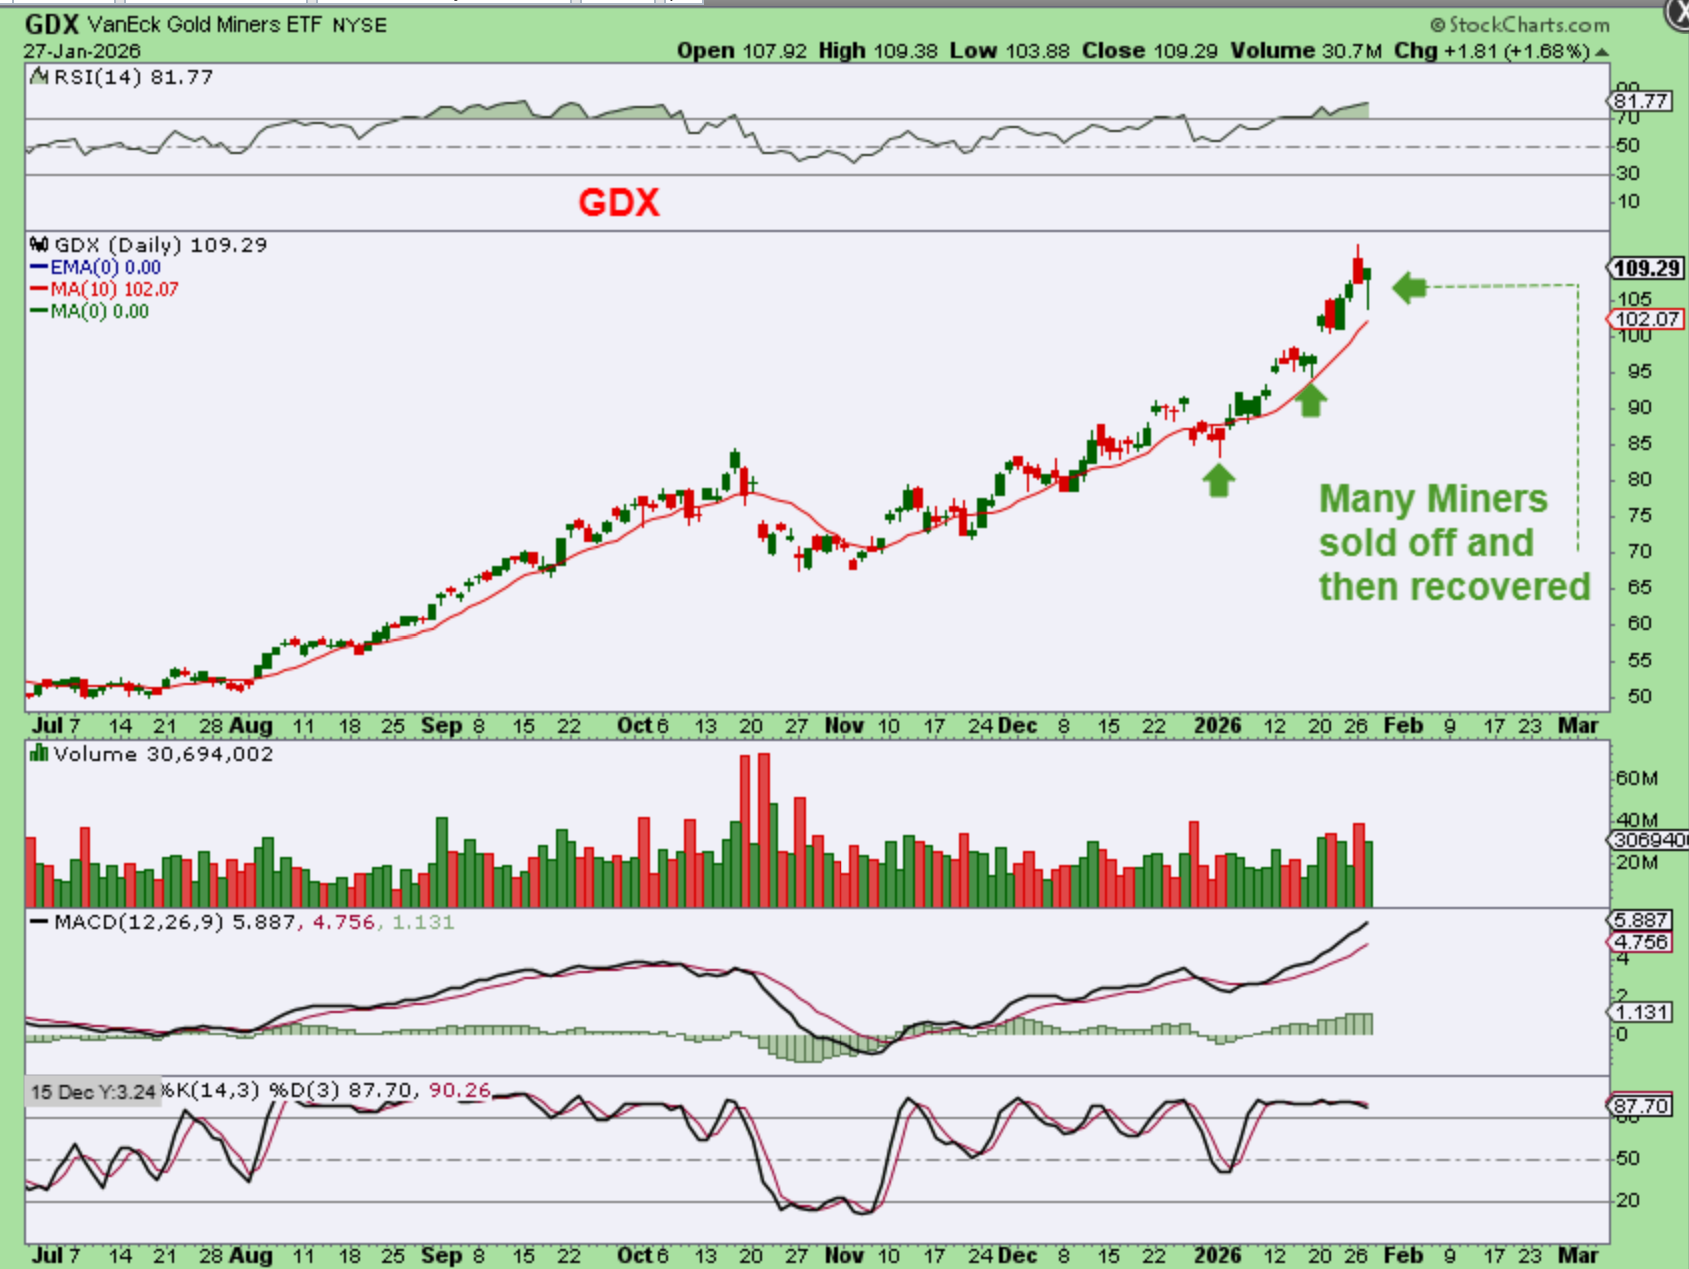
GDX – Most Miners dropped yesterday but they recovered by the end of the day.
.
The above report was written on Tuesday evening. Today is the first F.O.M.C. Meeting of 2026, and since we did get a rate cut last December, it is expected that we will not see any change today. What is discussed in the Fed Meeting from 2:30 p.m. ET onward is what could be a market mover. Gold was up over $115 last night, over $5300! Silver was up about $4 and it was at $116, but they’ve started to sell off from those highs.
I will add some bullish charts that developed yesterday, at the end of this report, below the Bitcoin discussion. We’ll see what this Fed Wednesday brings our way. Enjoy your Wednesday Fed Day trading!
.
~ALEX
.
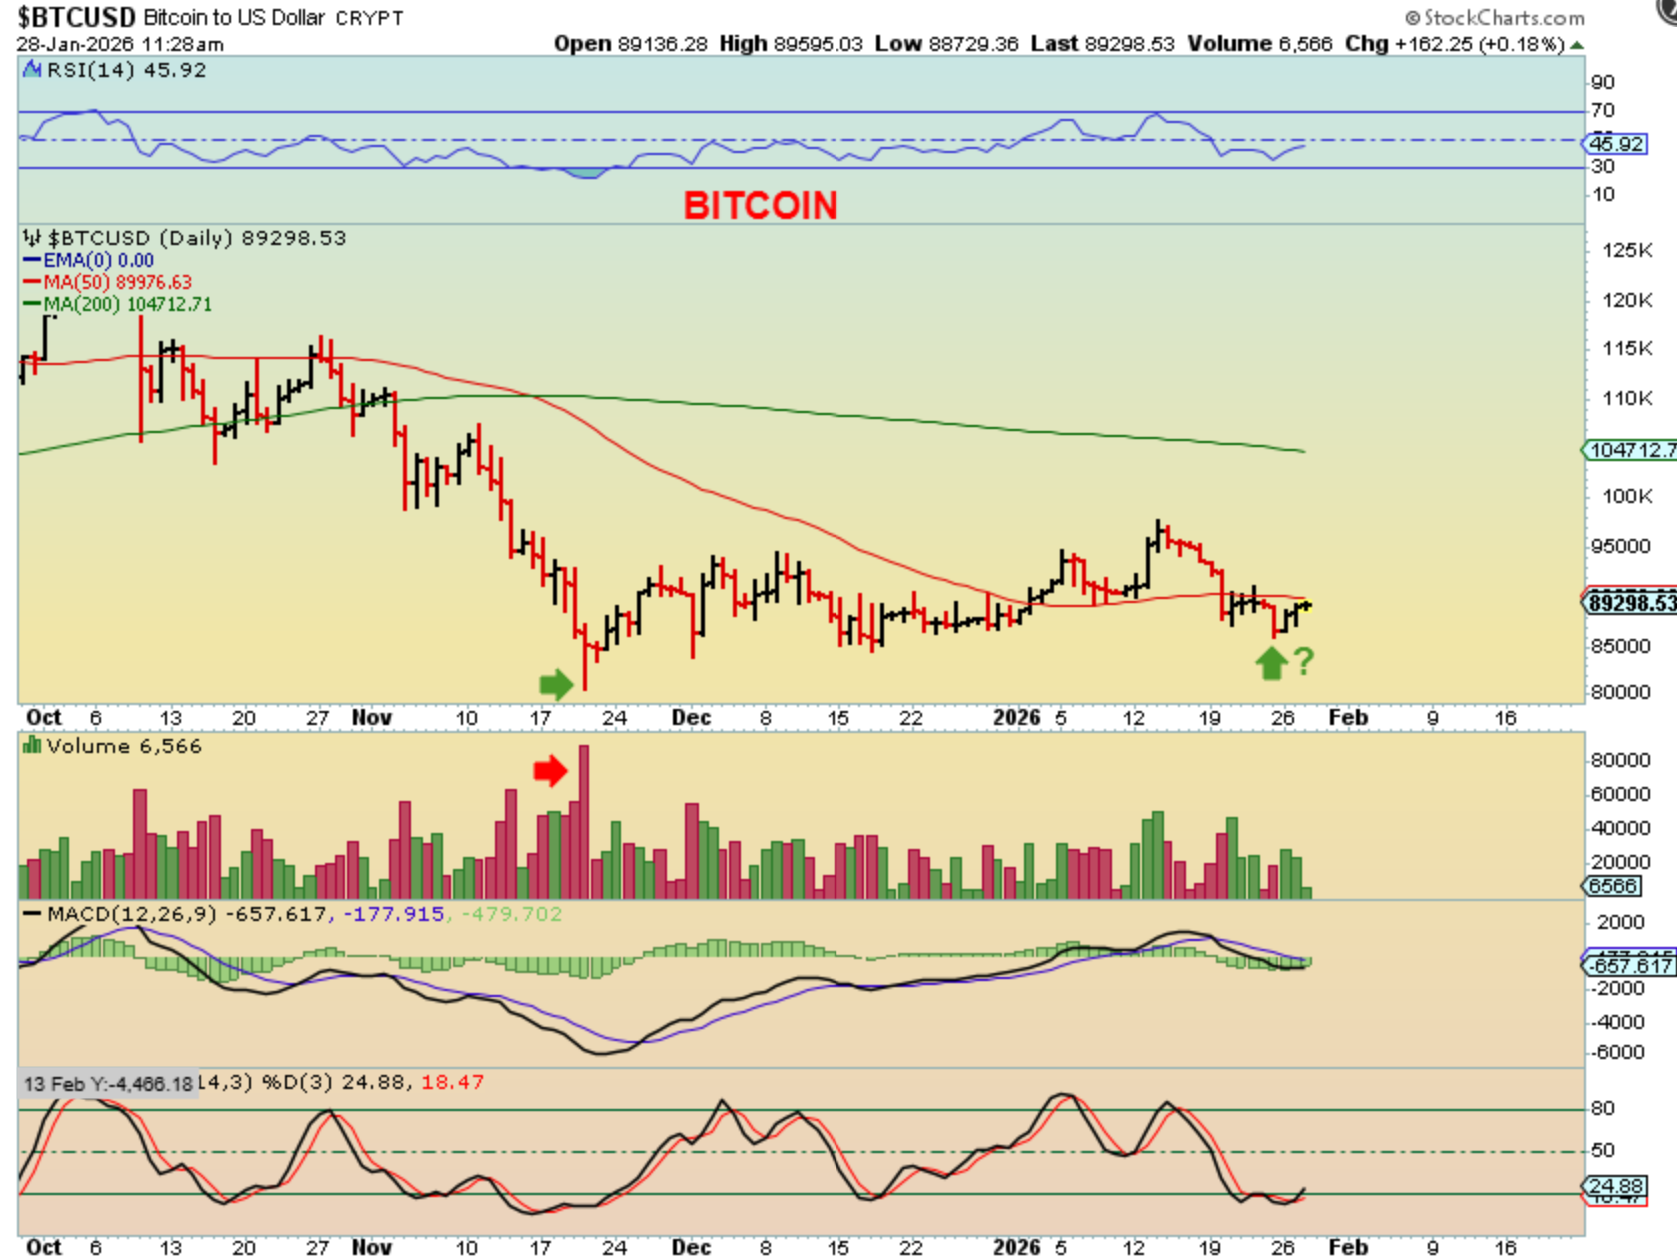
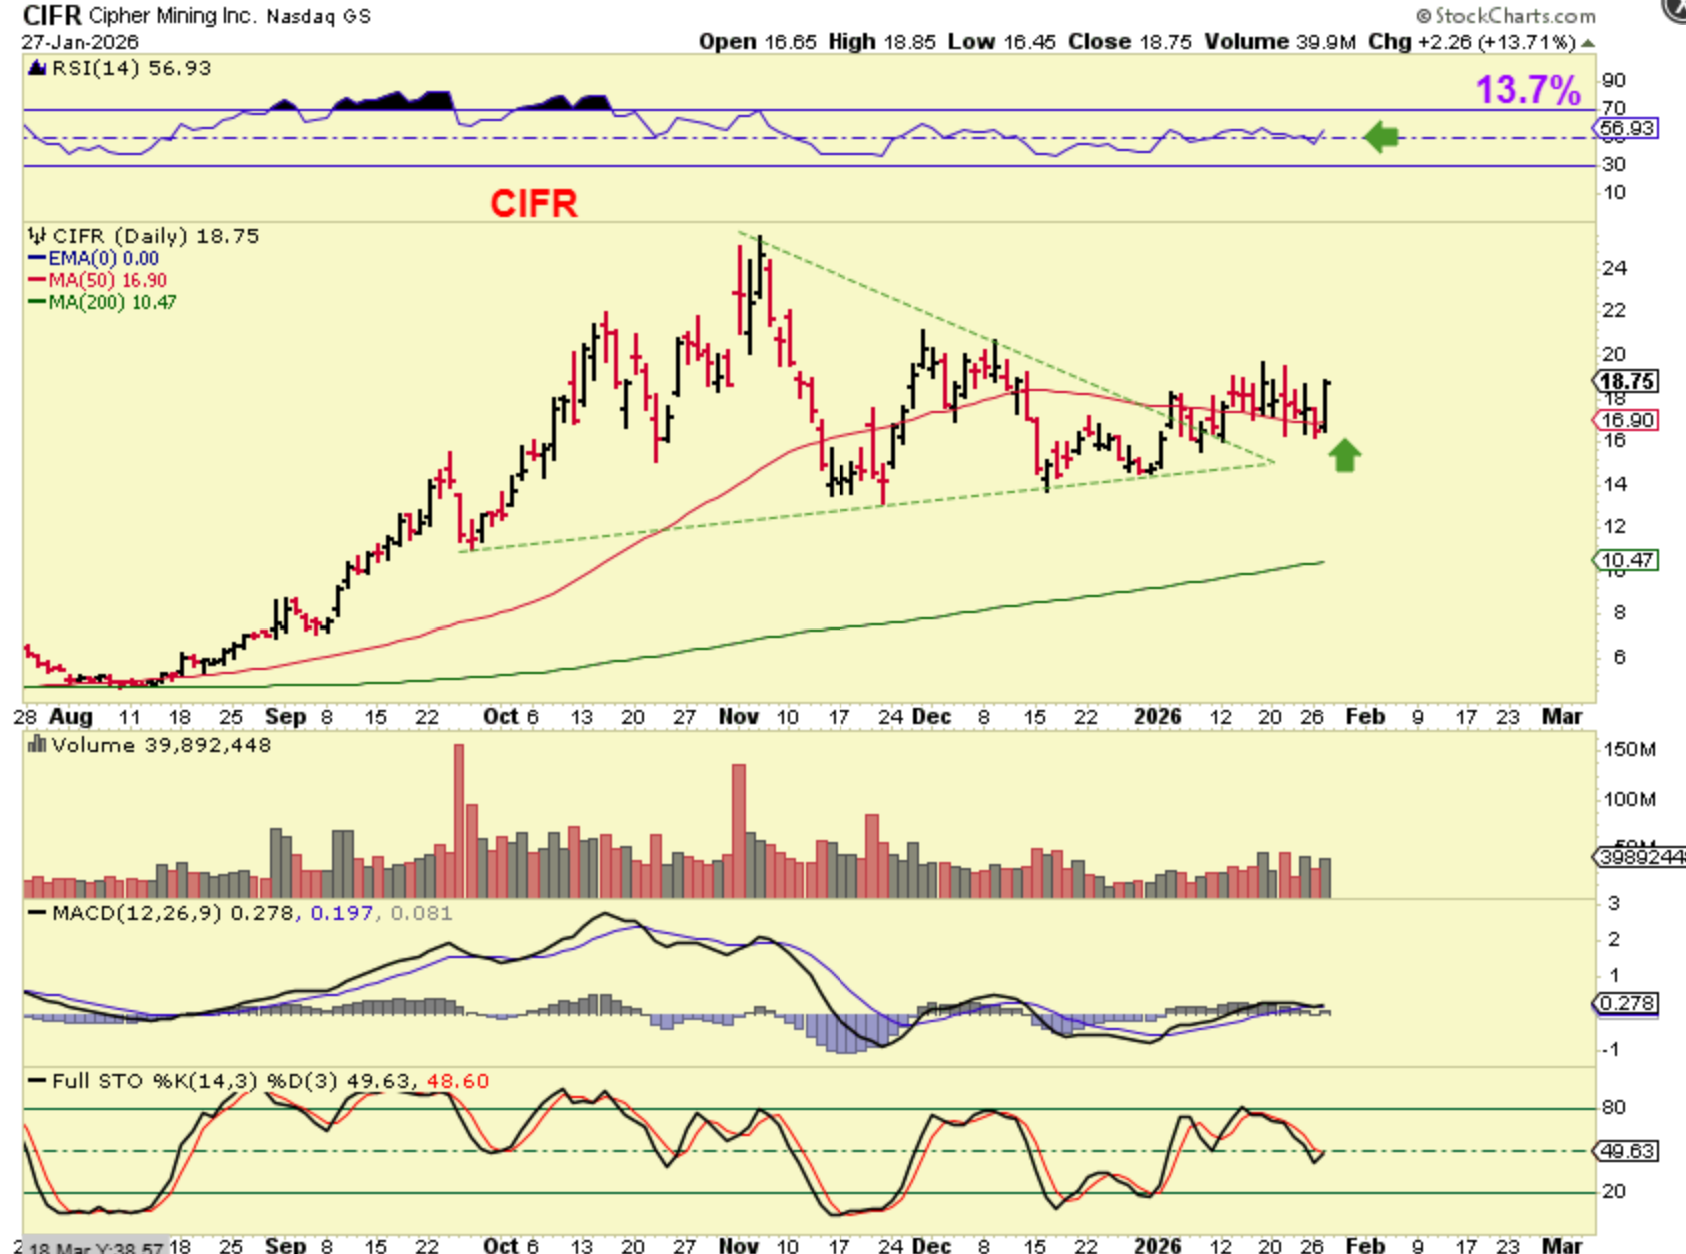
Bitcoin – We have a low around day 64 and a dcl is due. The Crypto stocks moved higher, likely following the general markets or smart money accumulation before a move higher in Bitcoin itself. Some actually had strong gains with Bitcoin hardly moving. CIFR was up almost 14%, IREN up 14.5%, WULF up 11%, etc etc.
.
CIFR is above the 50sma and moved up almost 14%. That is a big move on a day when Bitcoin hardly moved, and that is not the only one, as mentioned above. This sector may lead to some good short term trades.
.
I pointed out BBAI midday on Tuesday. It reversed on the 50sma and is inside of a large triangle consolidation. It is a bullish set up at this point.
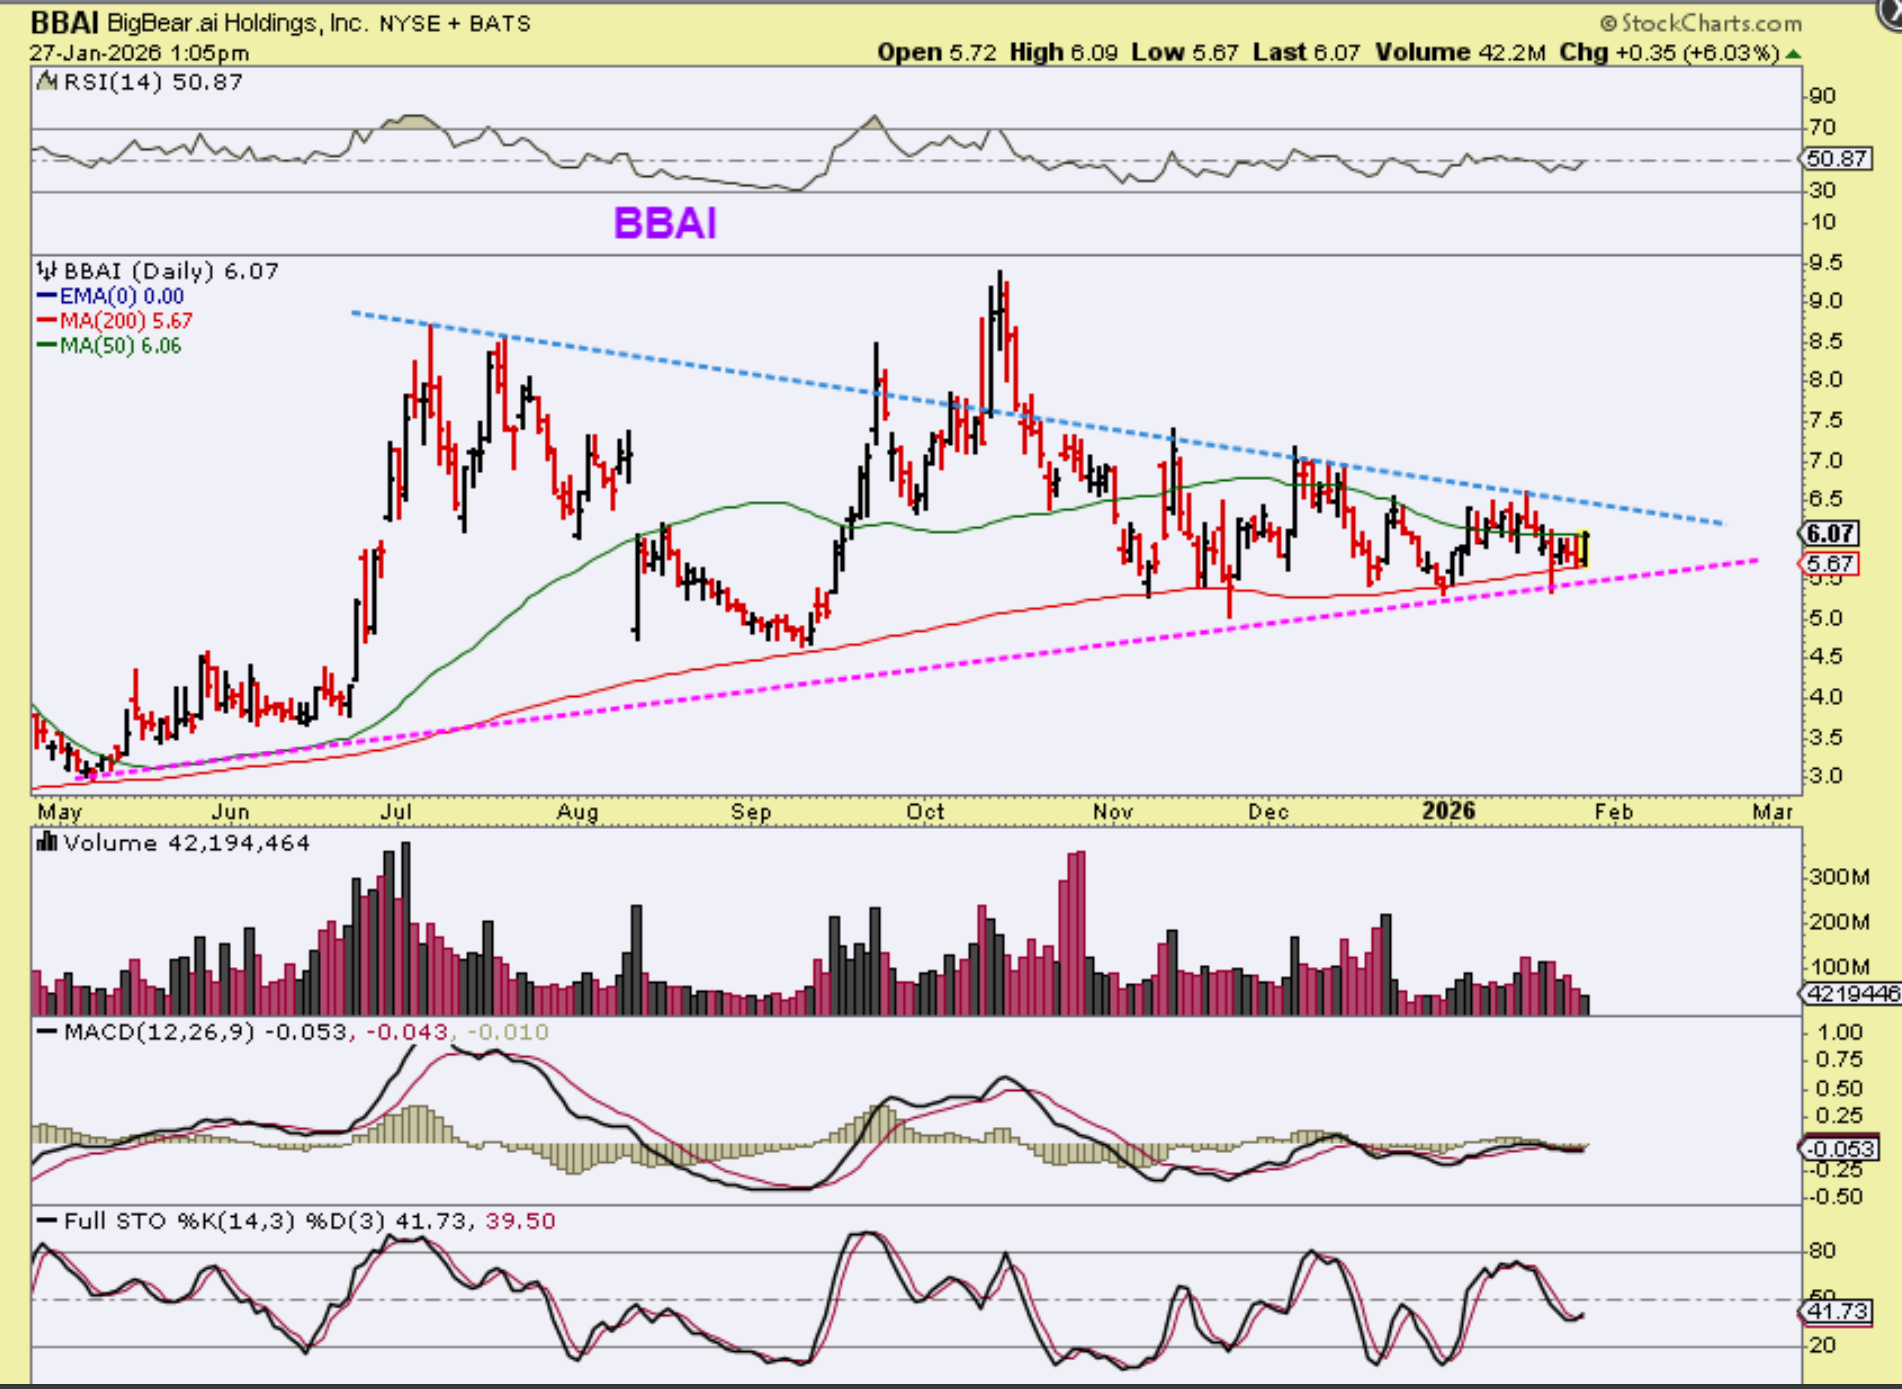
.
LAES was reversing in the morning, so I poste this chart as a low risk entry at the 50 & 34 sma. It closed up almost 7% and can continue higher.
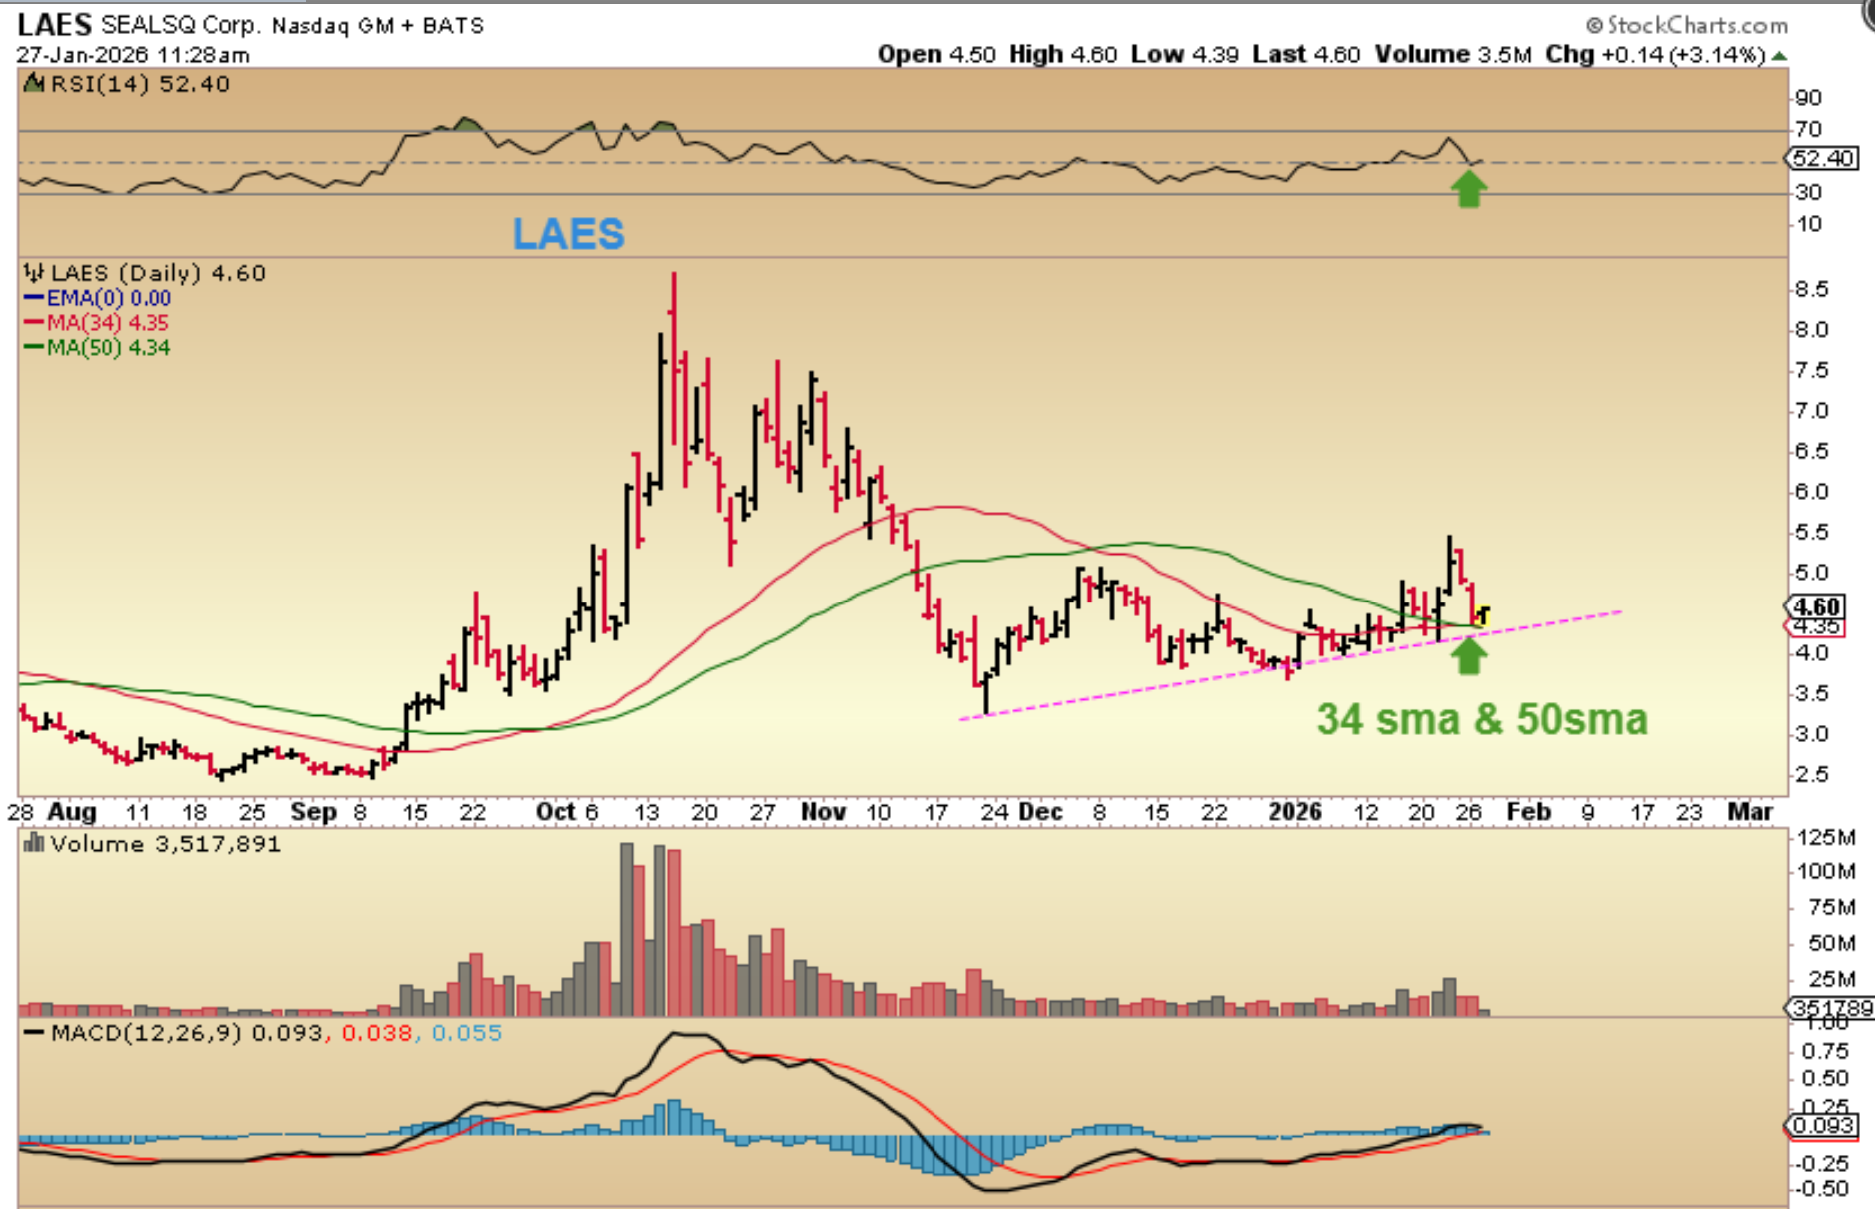
.
ONDS reversed above the 34 sma (Drones)
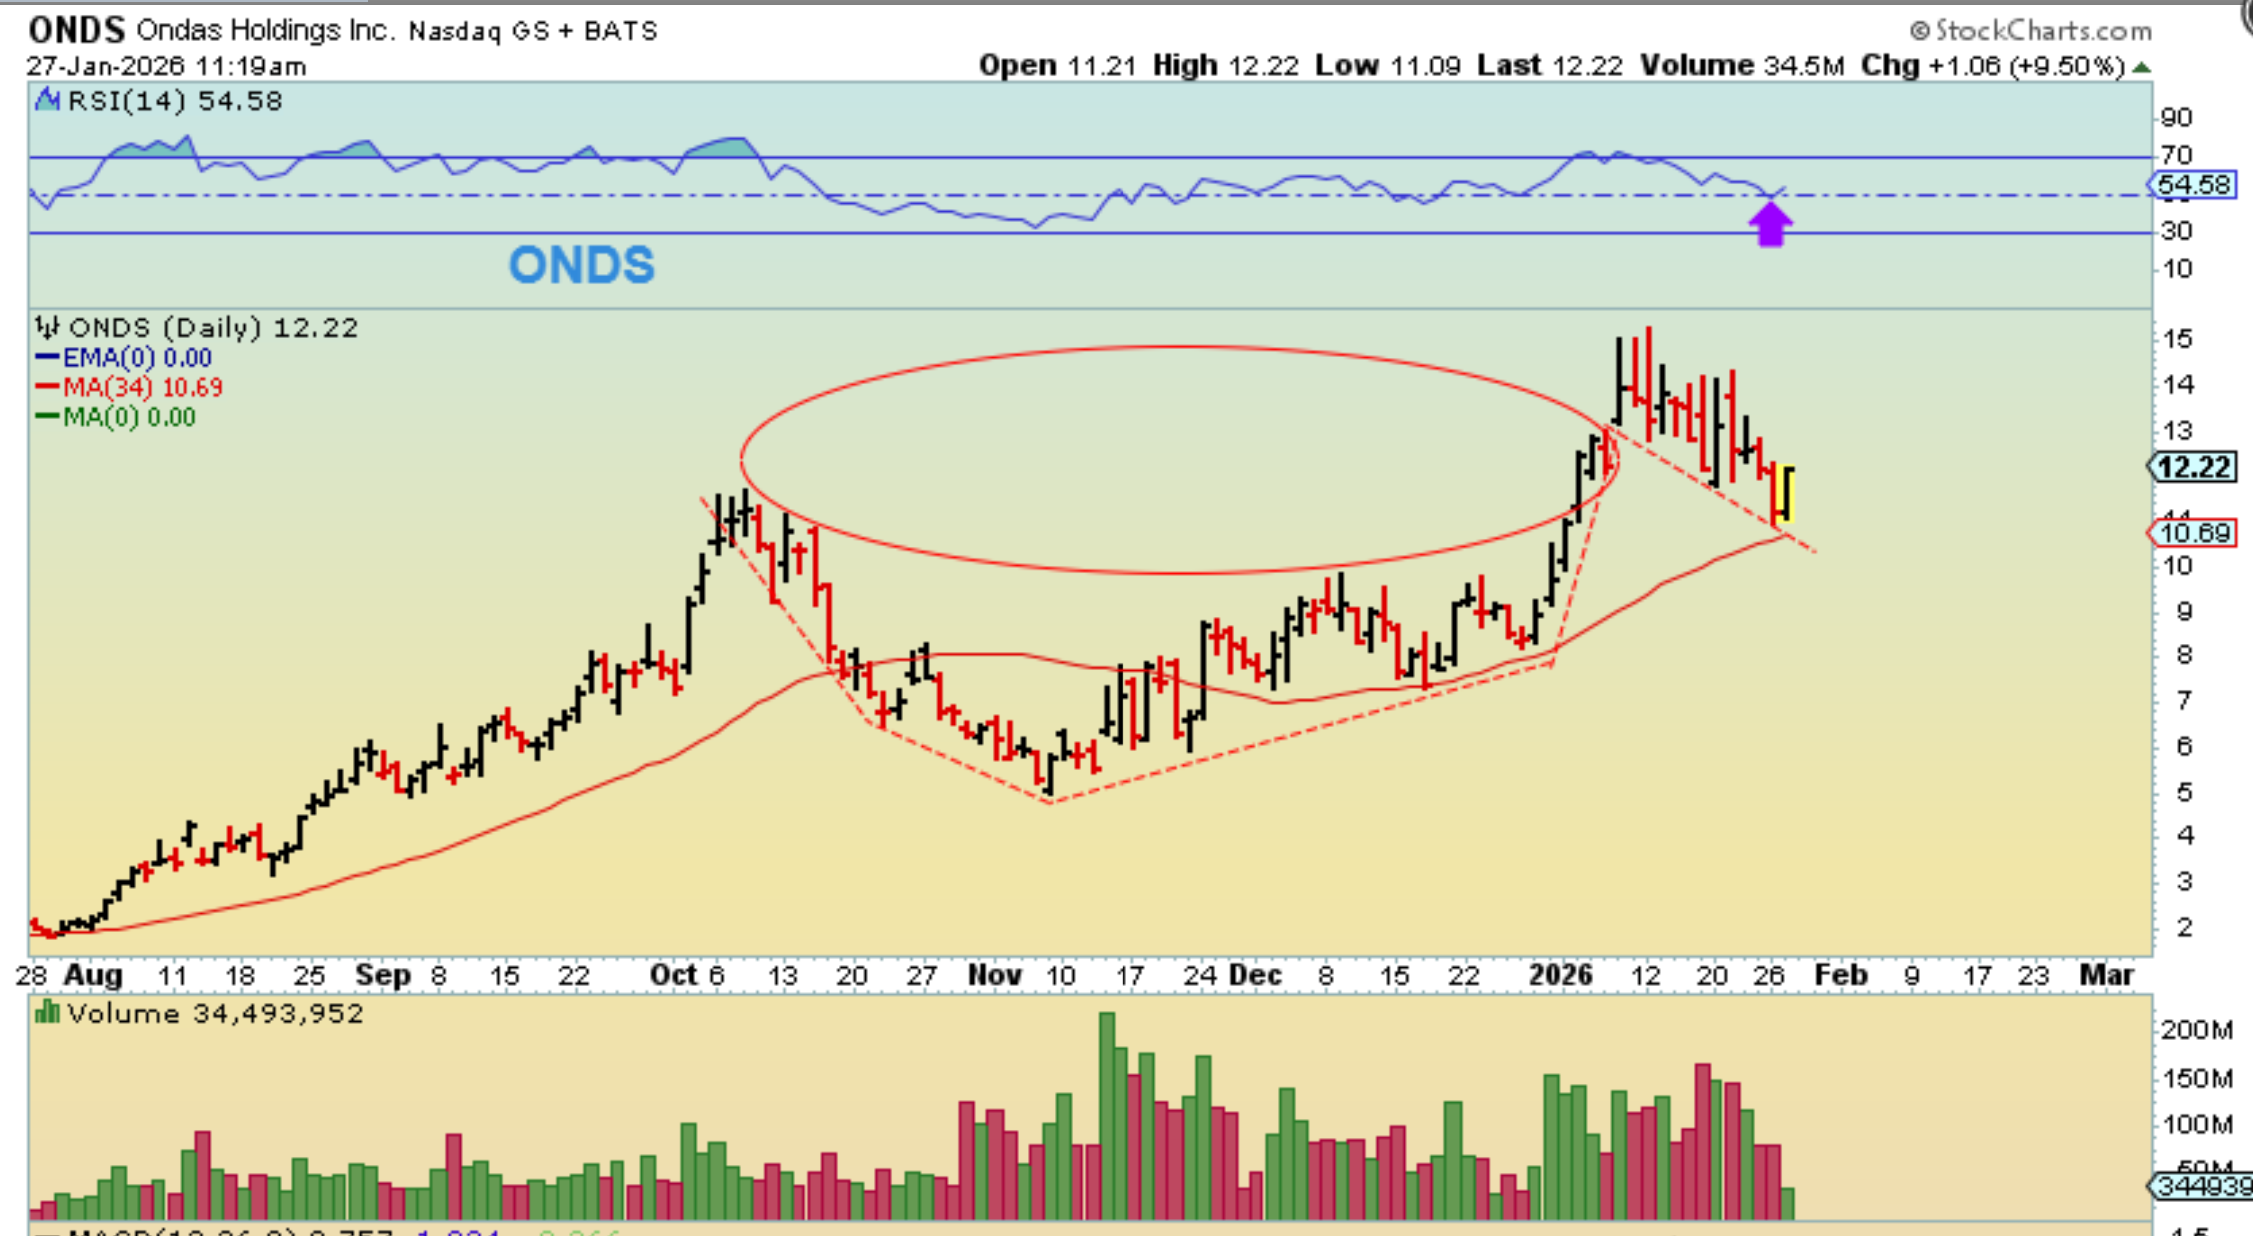
.
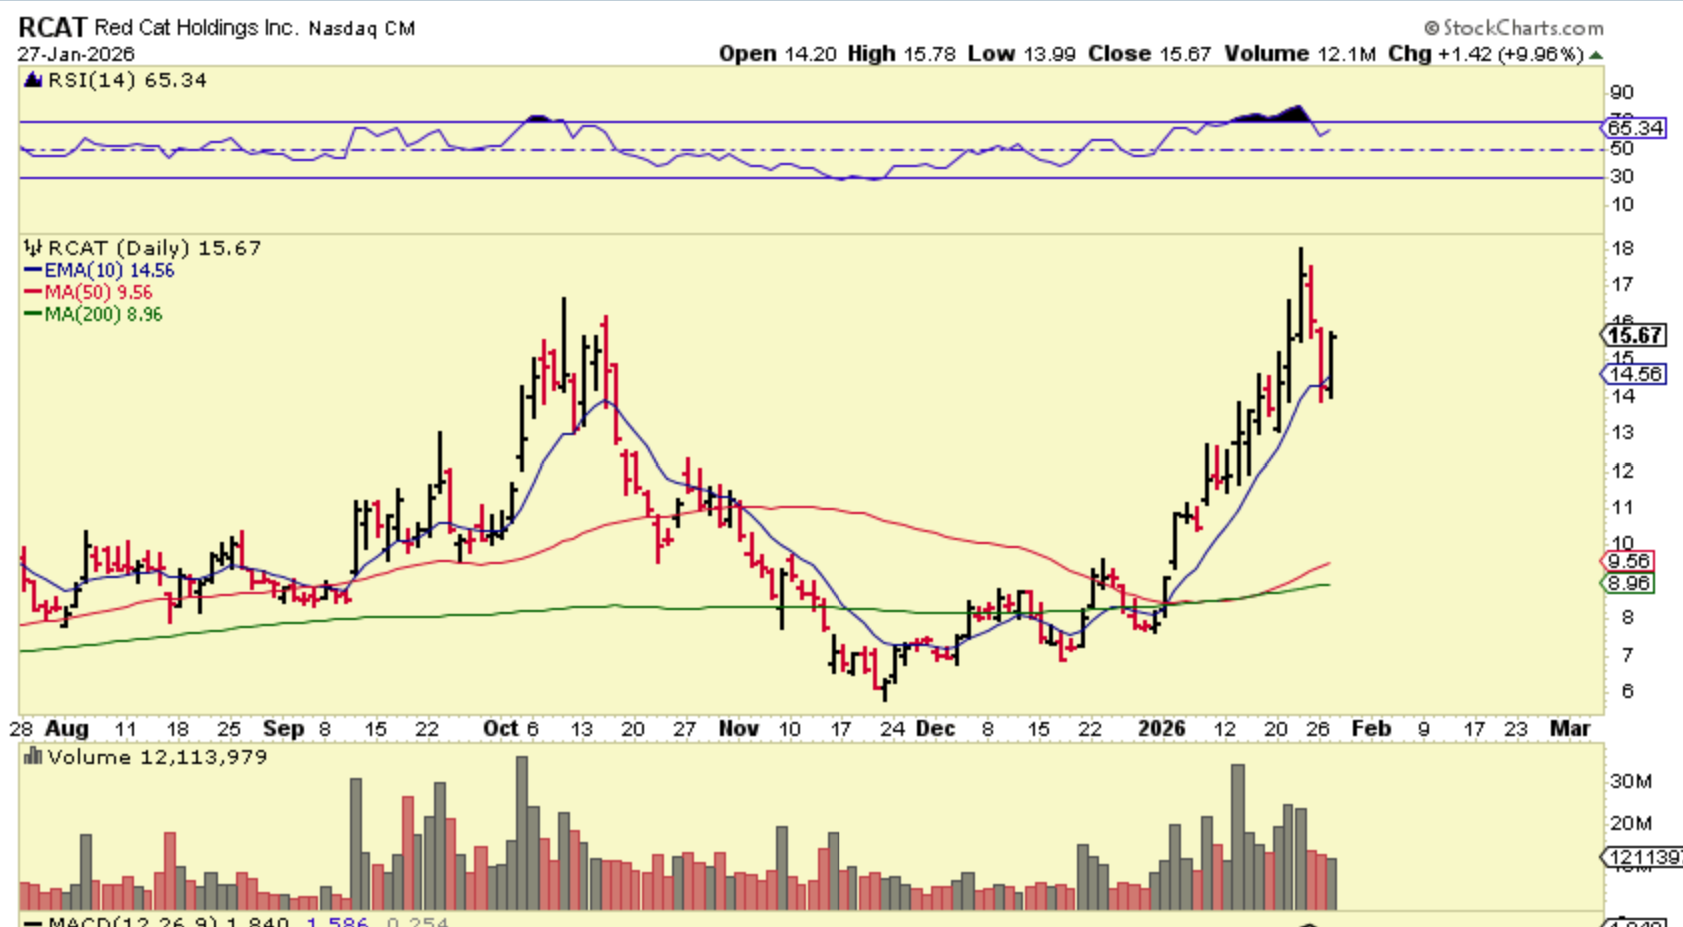
RCAT (Drones) was sitting right on the 13sma, so it could be bought with a stop. It closed up about 10%…
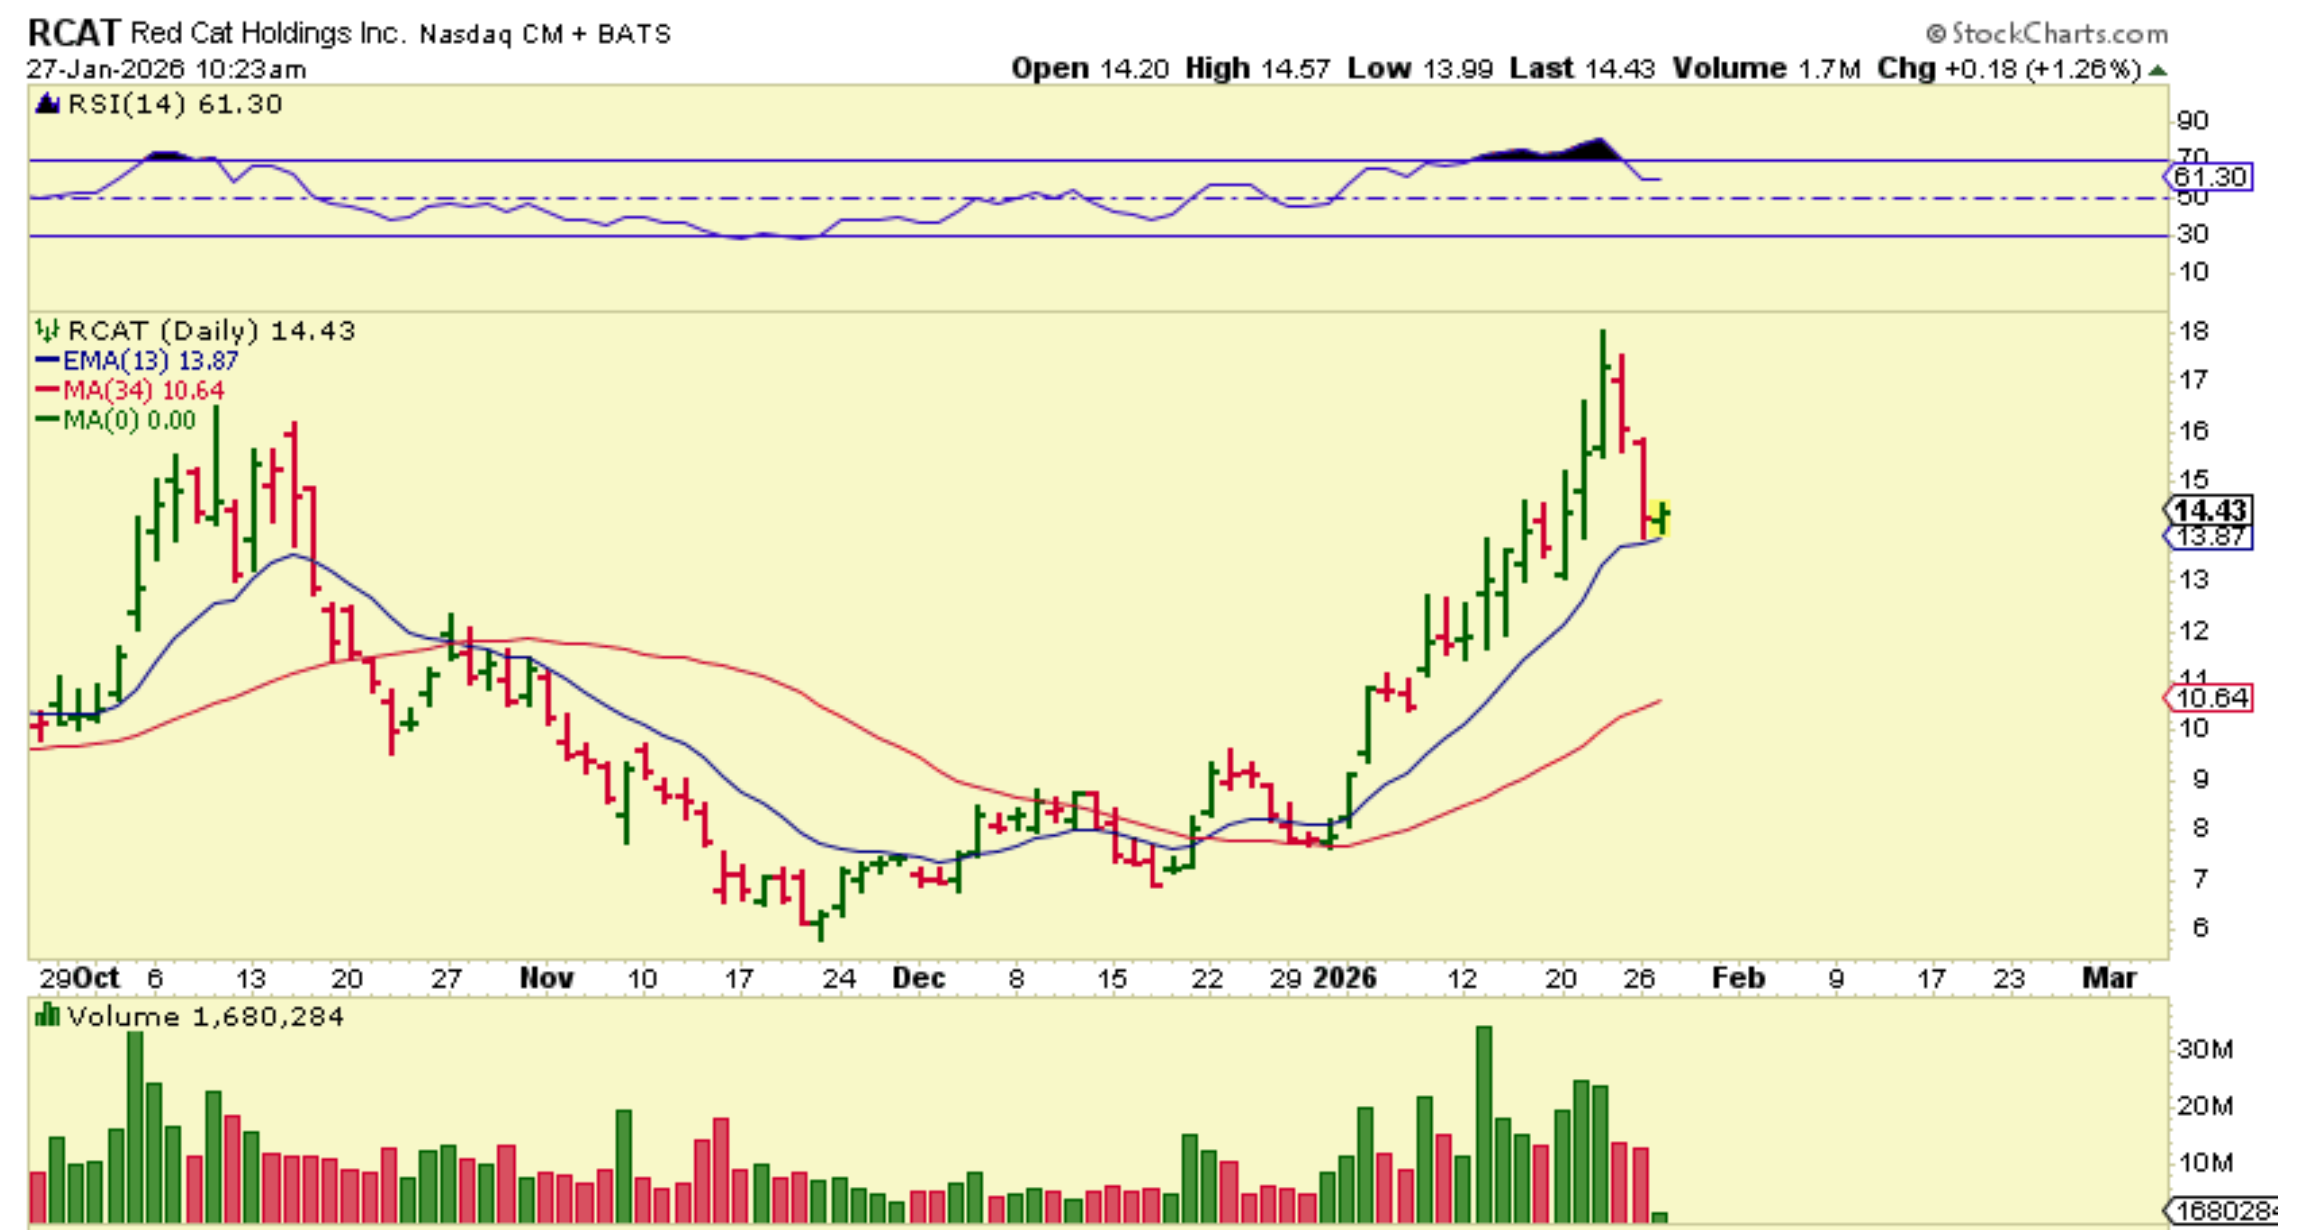
.
RCAT closed up with 10% gains.
.
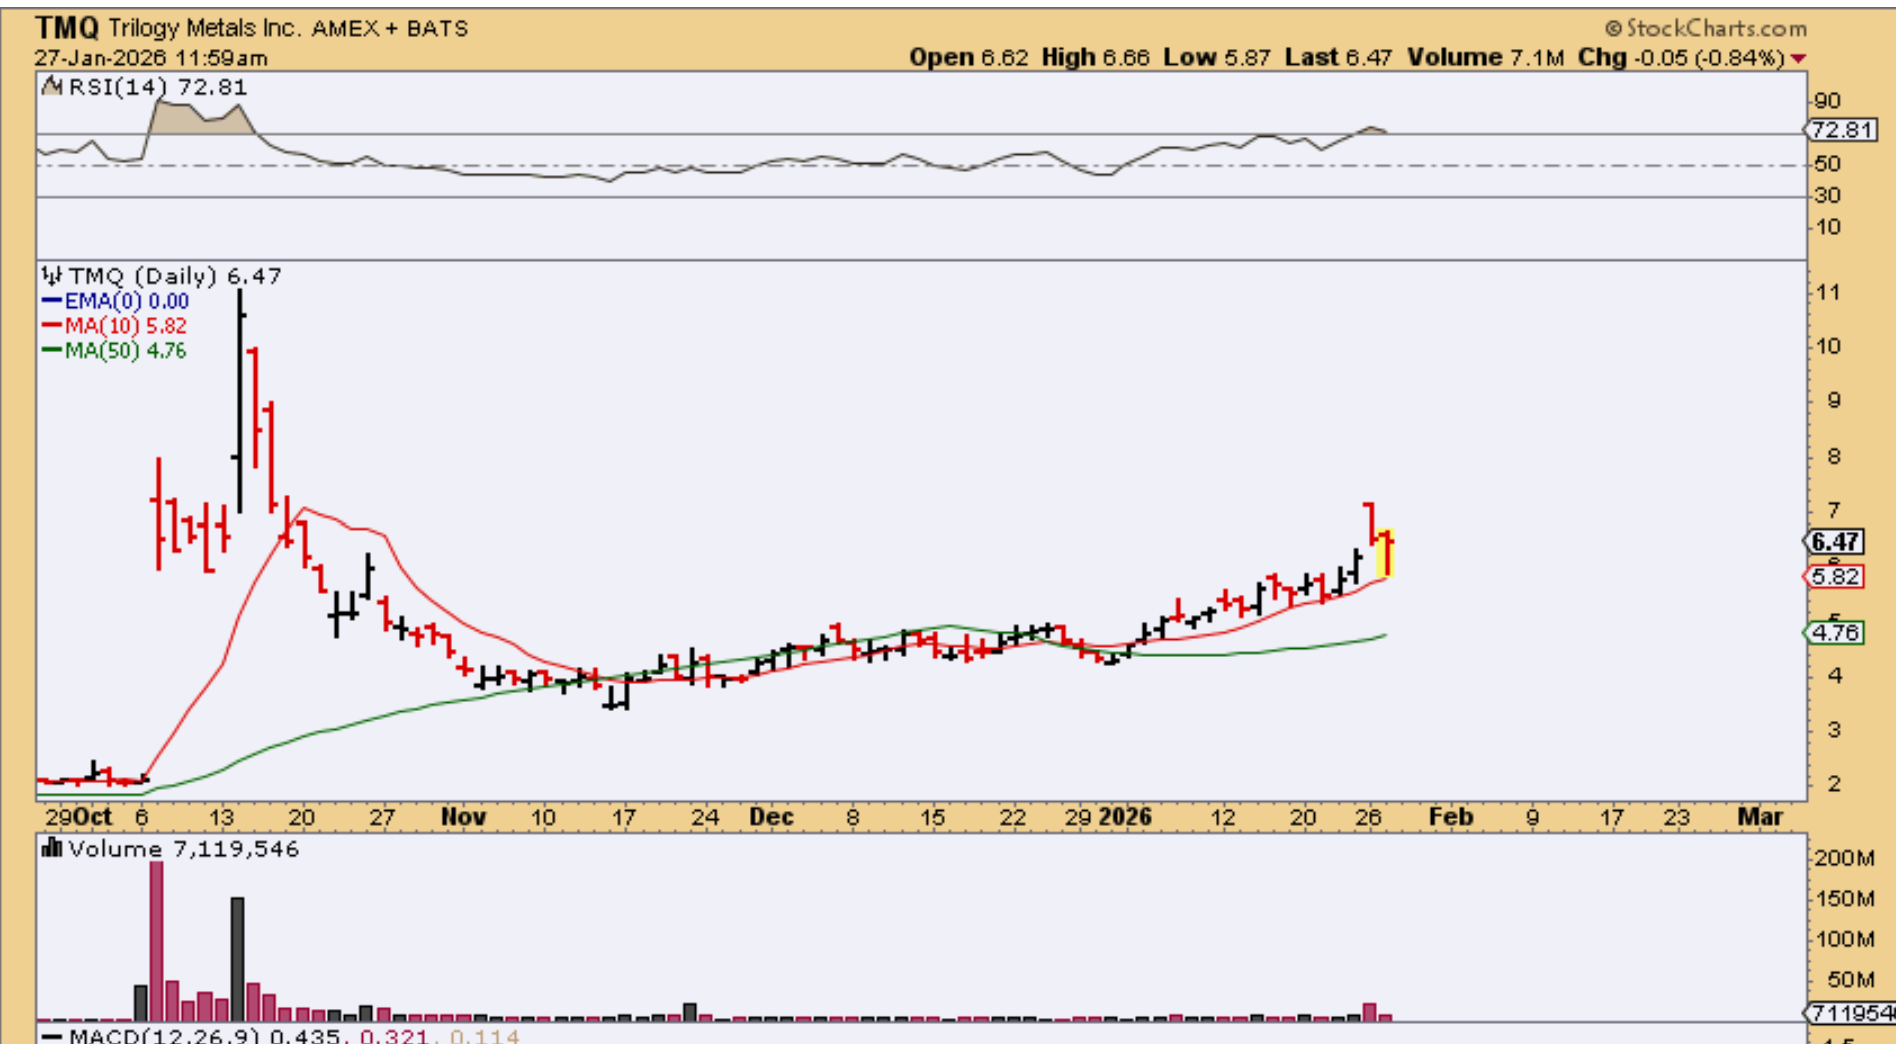
TMQ reversed off of the 10sma. It eventually turned green and was up almost 6%.
.
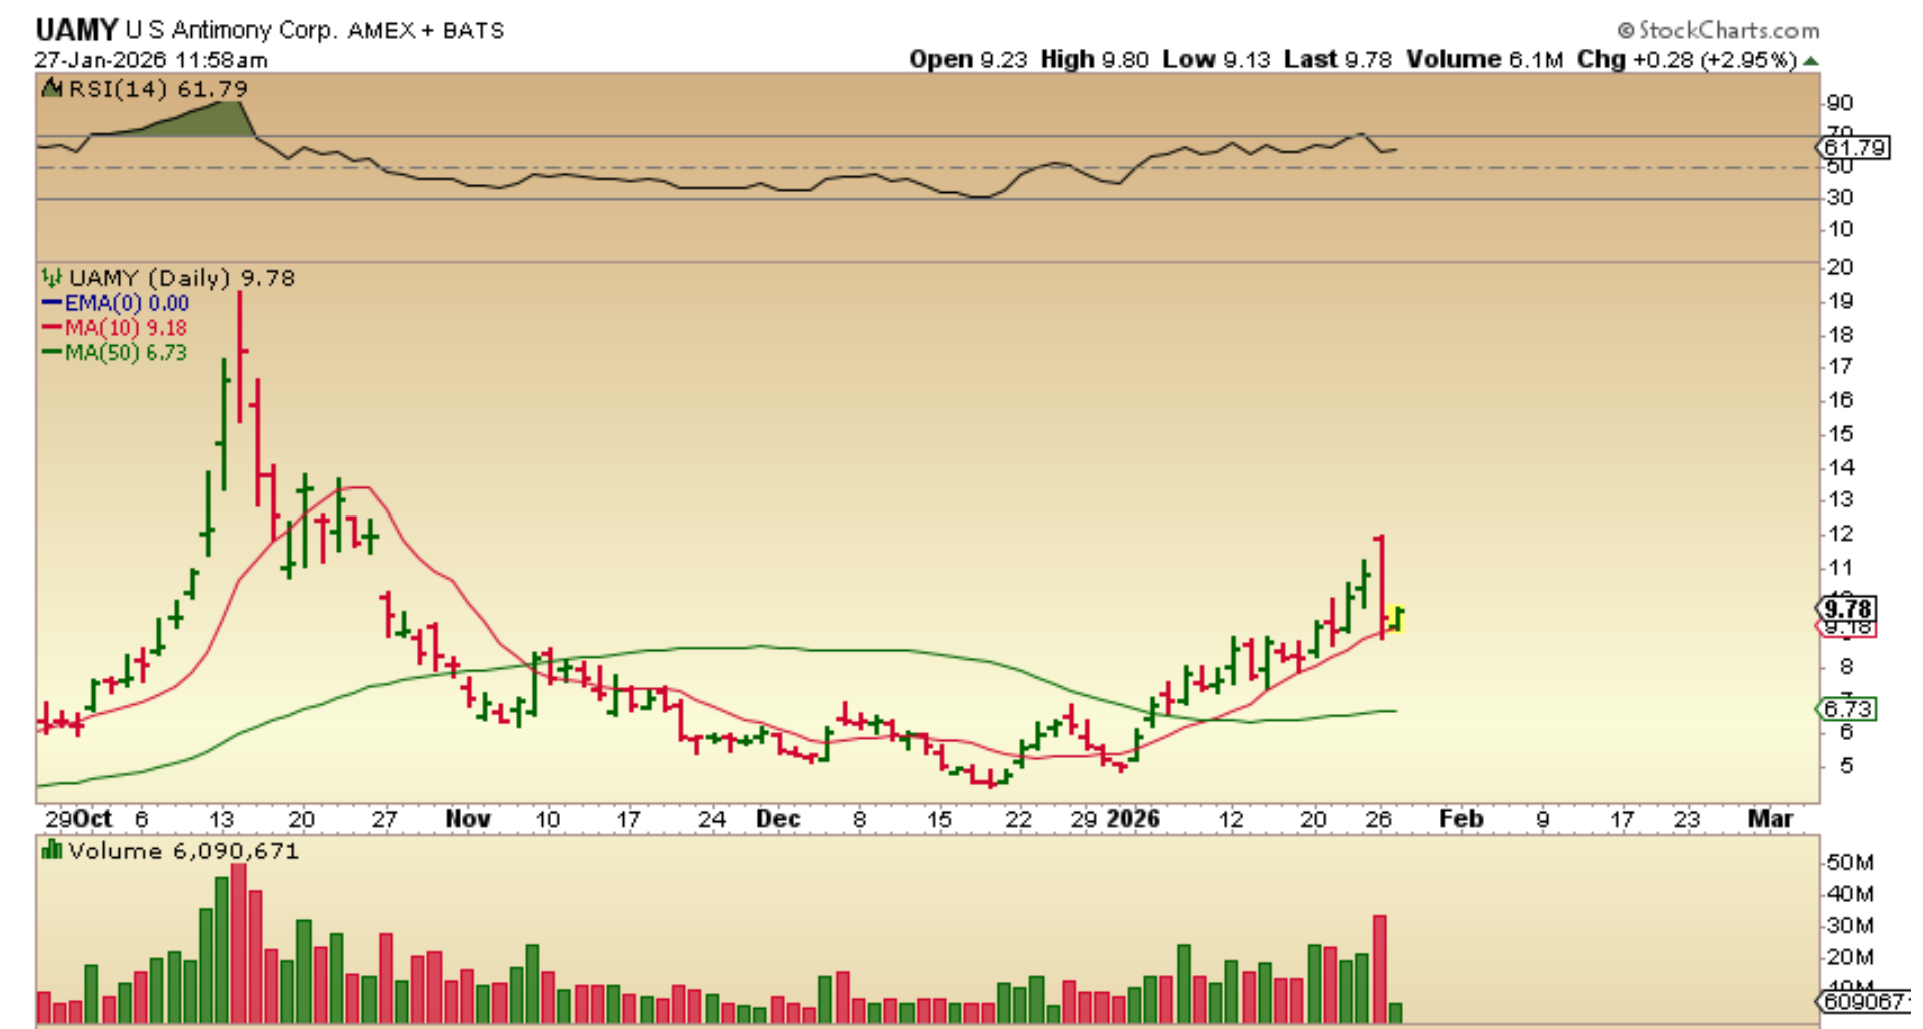
UAMY turned up at the 10sma too, so we are seeing various areas of support trying to hold up price. We’ll see if the Fed can trigger a continuation rally in the 2nd daily cycle.