Bullish action continues and even grows in many sectors, with the exception if the USD. That being the case, let’s just do a nice review!
.
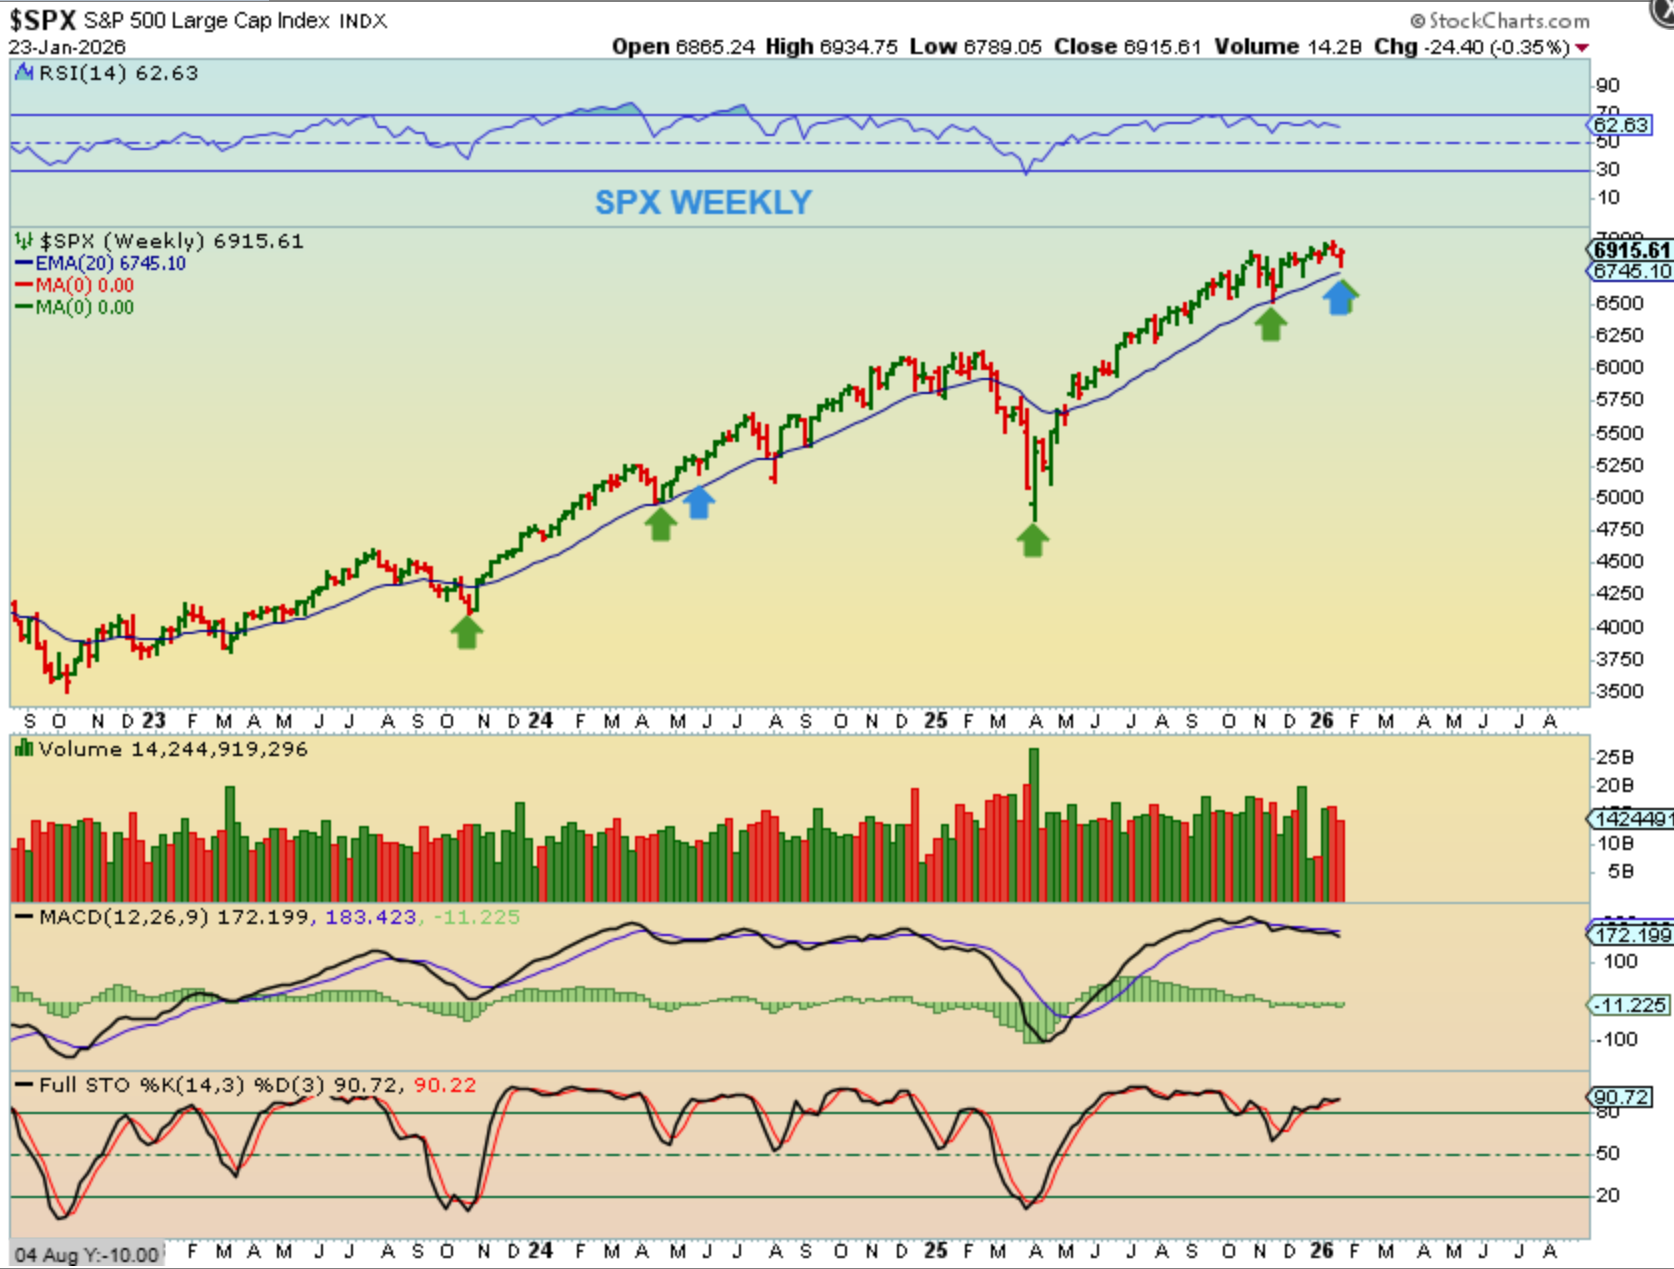
The SPX and General Markets entered day 30+, so we knew that they could begin to dip into a dcl at any time. Last week we saw that dip and a reversal. You may recall that the daily charts lost and regained the 50sm, and the weekly charts reversed slightly above the 20 weekly ma.
.
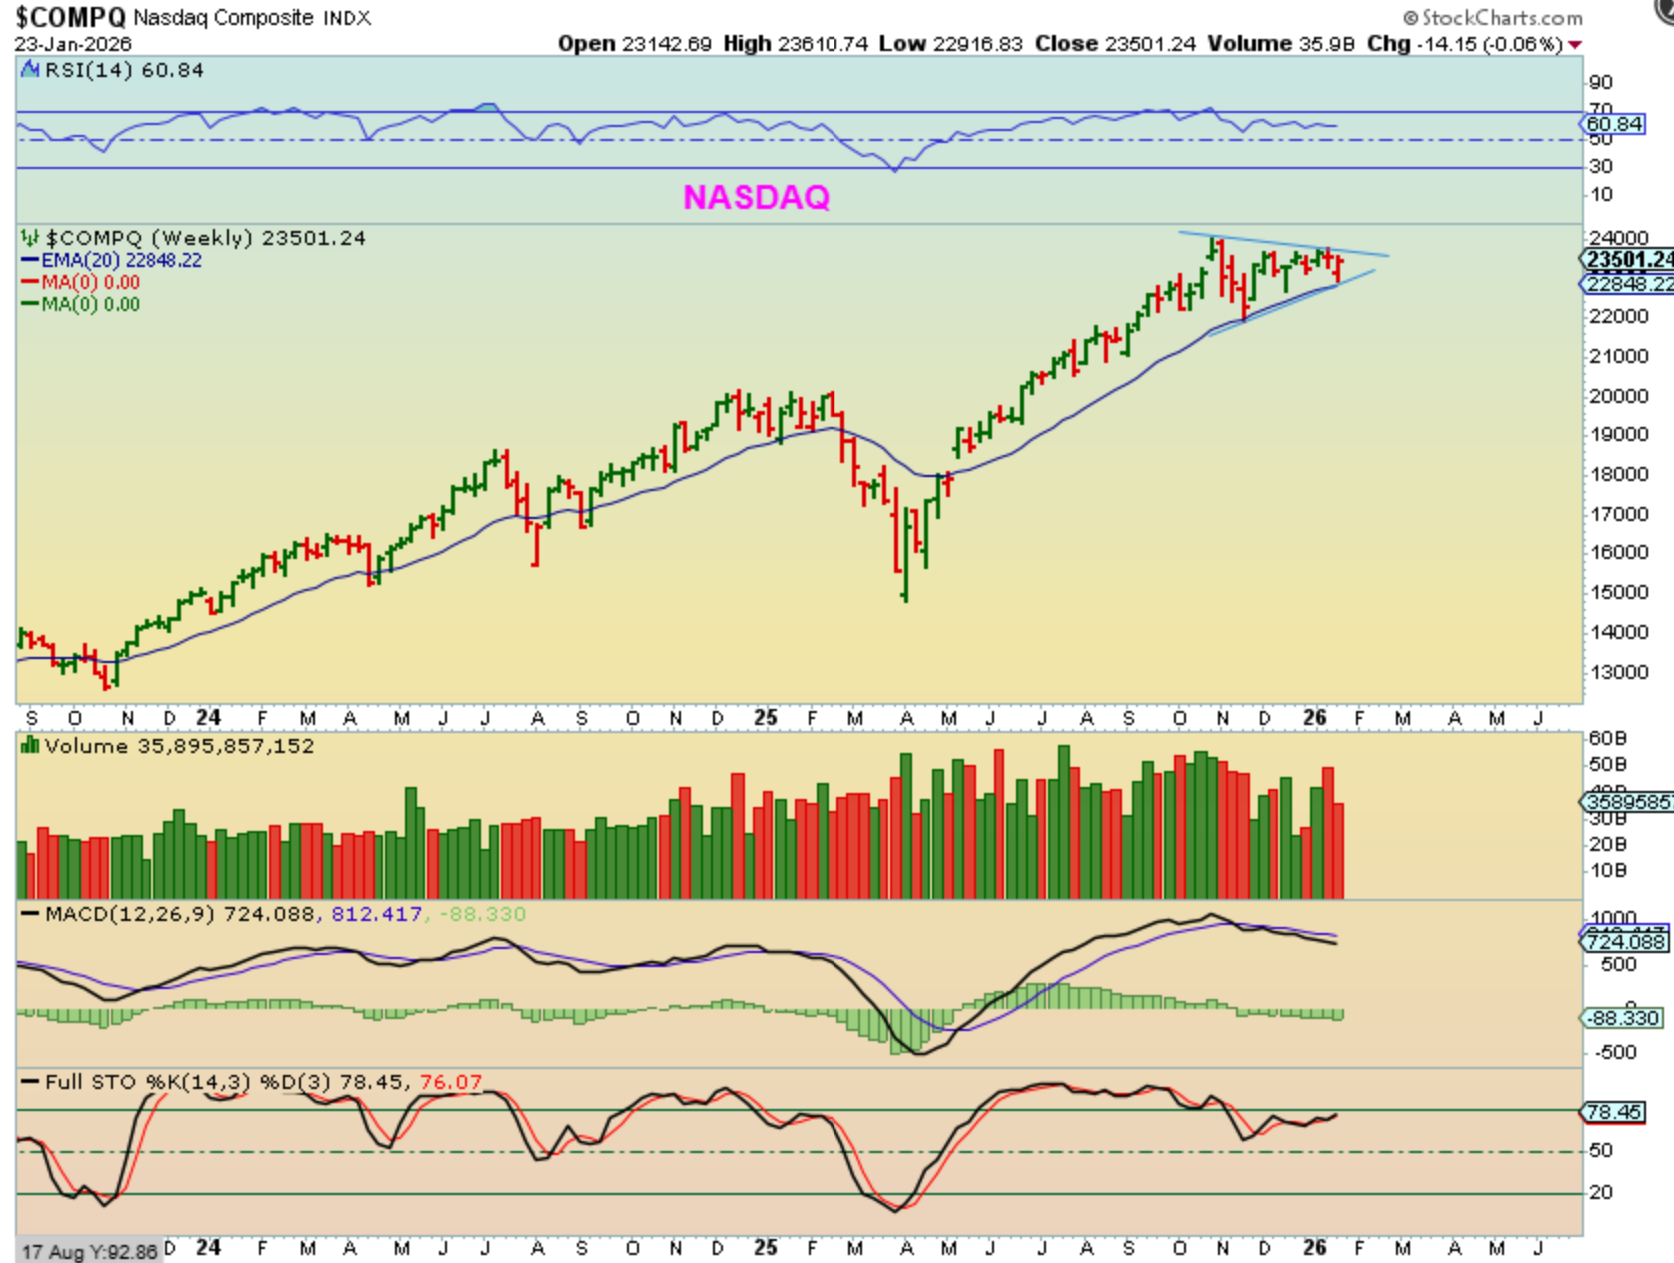
The NASDAQ WEEKLY simply extended that triangle that I was following on the daily charts, and with a dcl in place, we should see a breakout as soon as next week. We are at the apex.
.
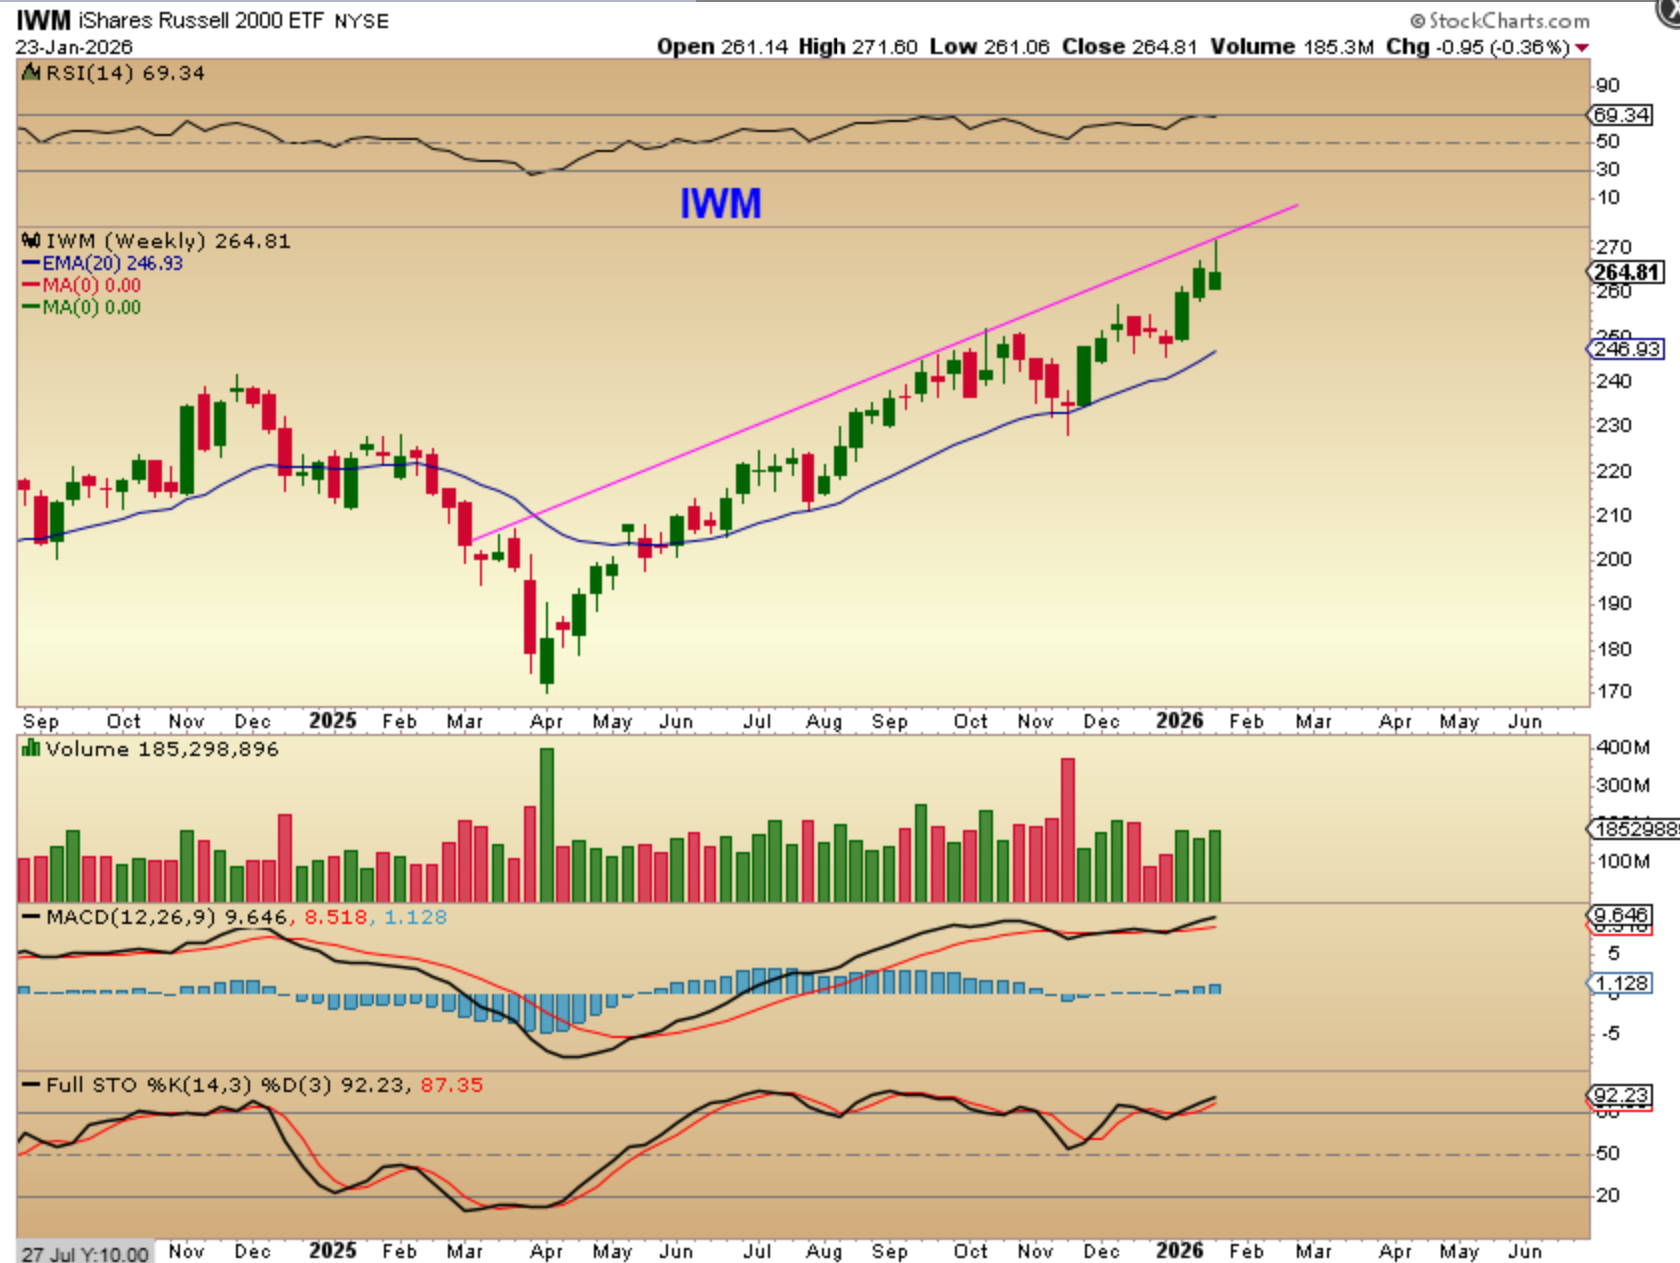
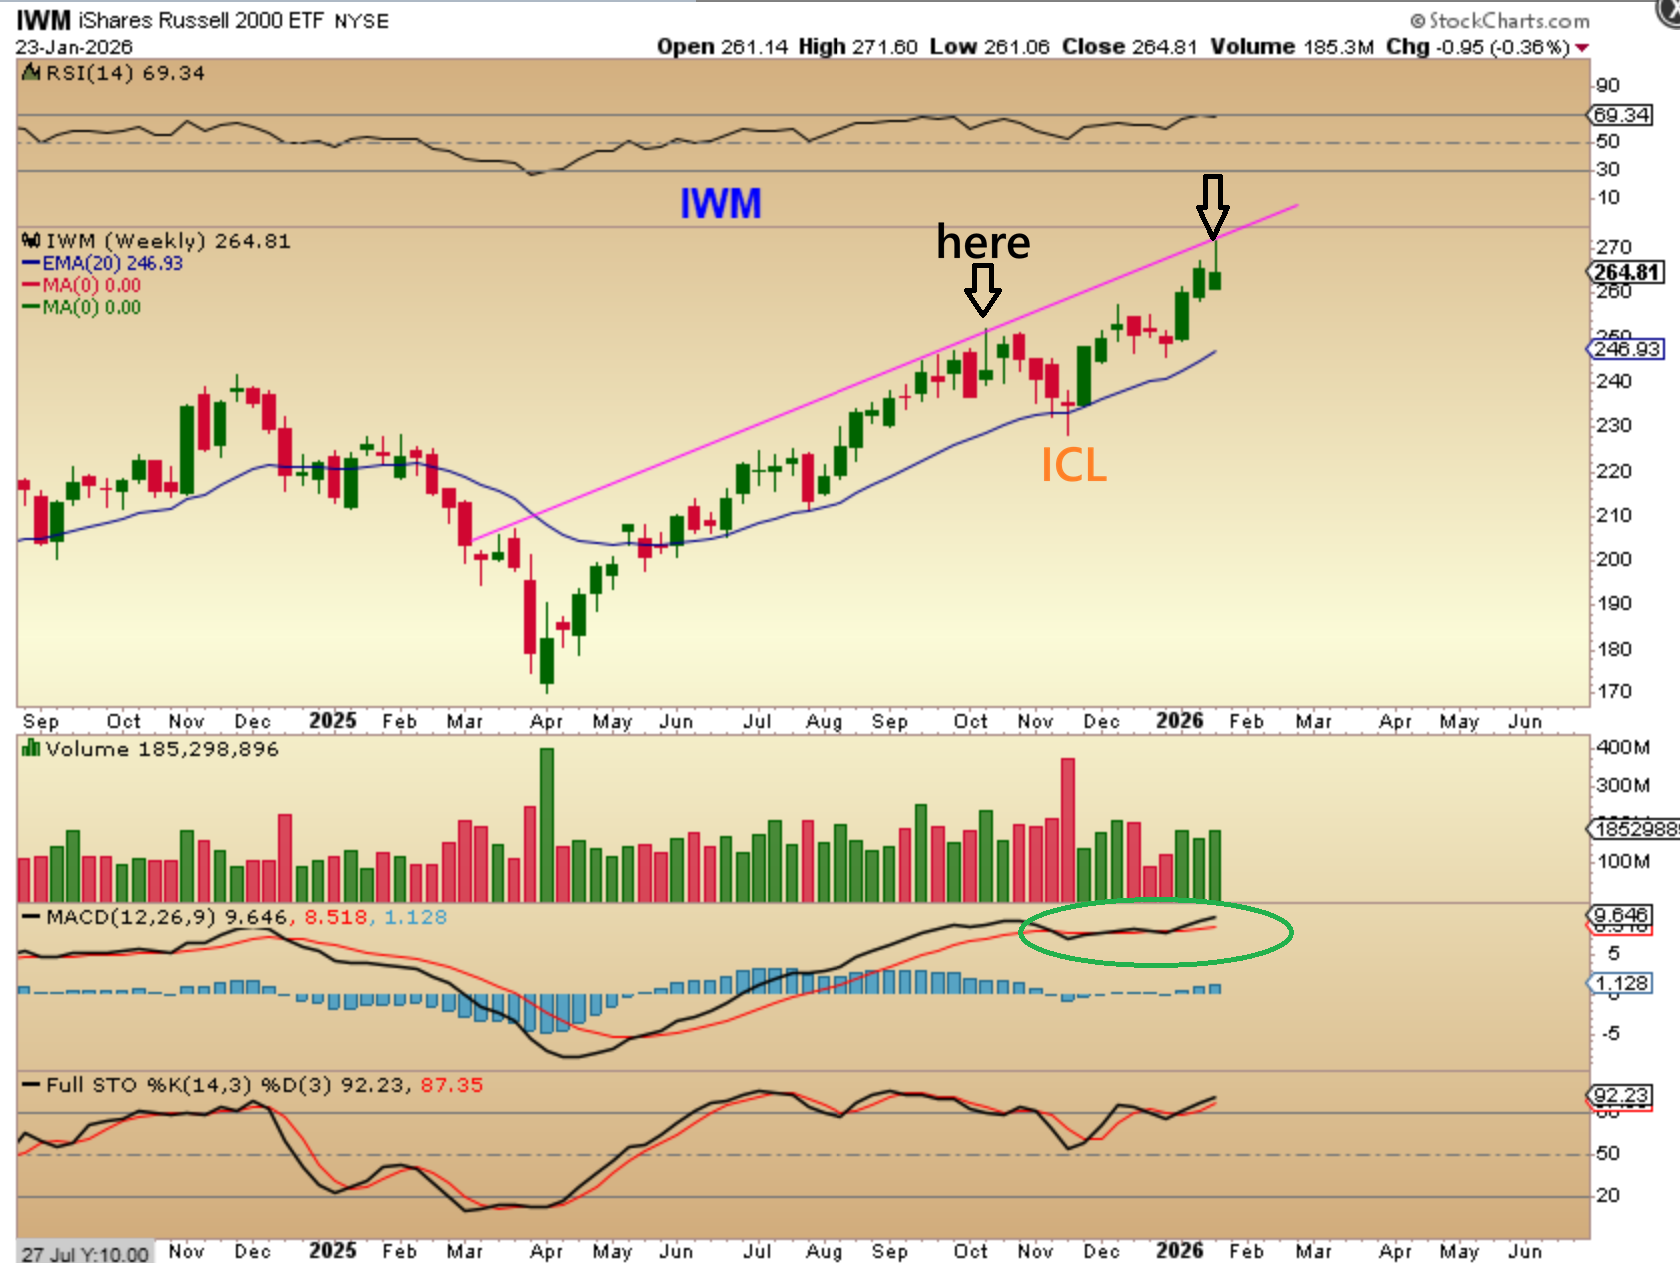
THE IWM & SOXX were not dipping lower when the SPX & NASDAQ did, so oddly enough, they sold off on Friday while the SPX & NASDAQ ran higher. They may pull back a little, but …
.
These can just dip a little and then continue to ride up and along this upper trendline. We saw that in October for 2 weeks with the same weekly candle, and that was when an ICL was due. We are currently leaving an ICL behind from November.
.
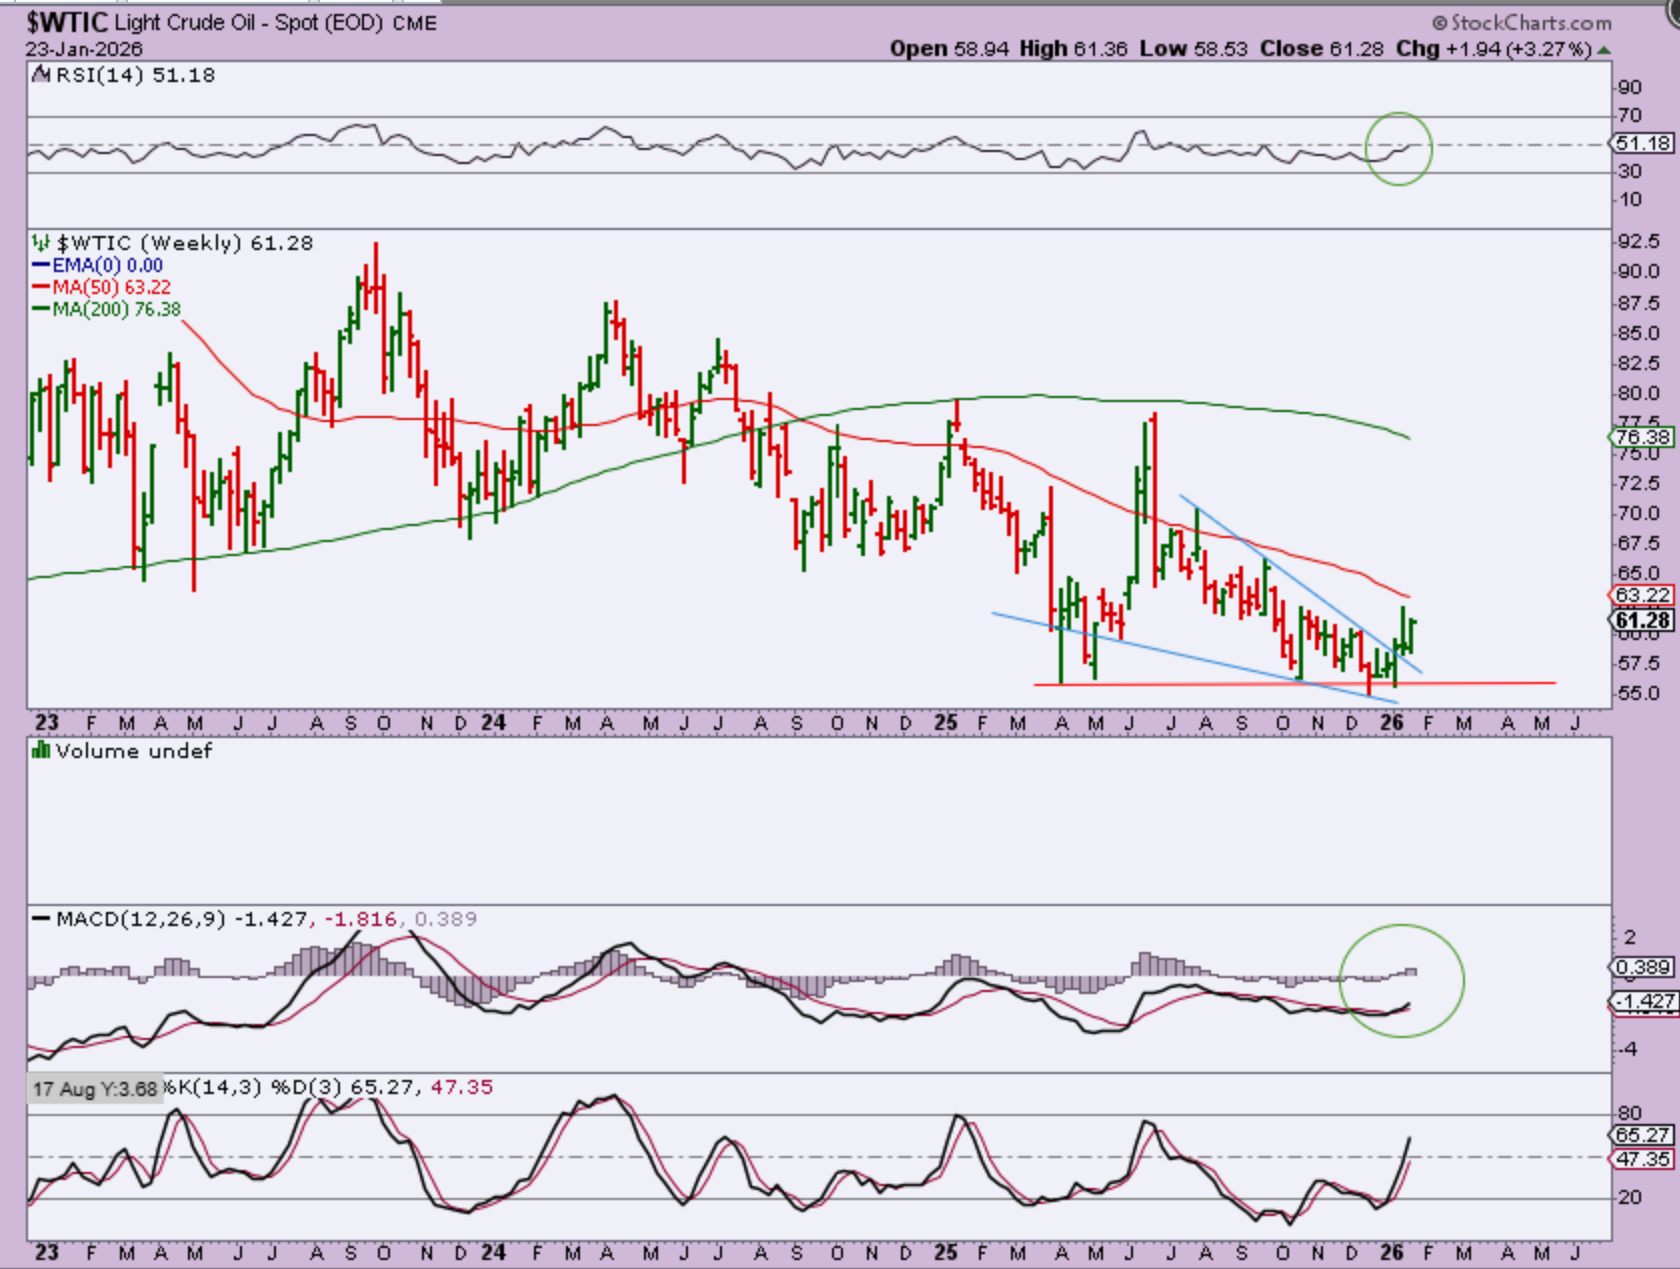
WTIC – Oil became more bullish after a shakeout in December. I drew in a stealth descending wedge breakout, and we know that Oil was finally able to break above the 50sma and is now lining up to try a break of the 200sma on daily charts. I’ll continue to cover it daily in the weekday reports. And…
.
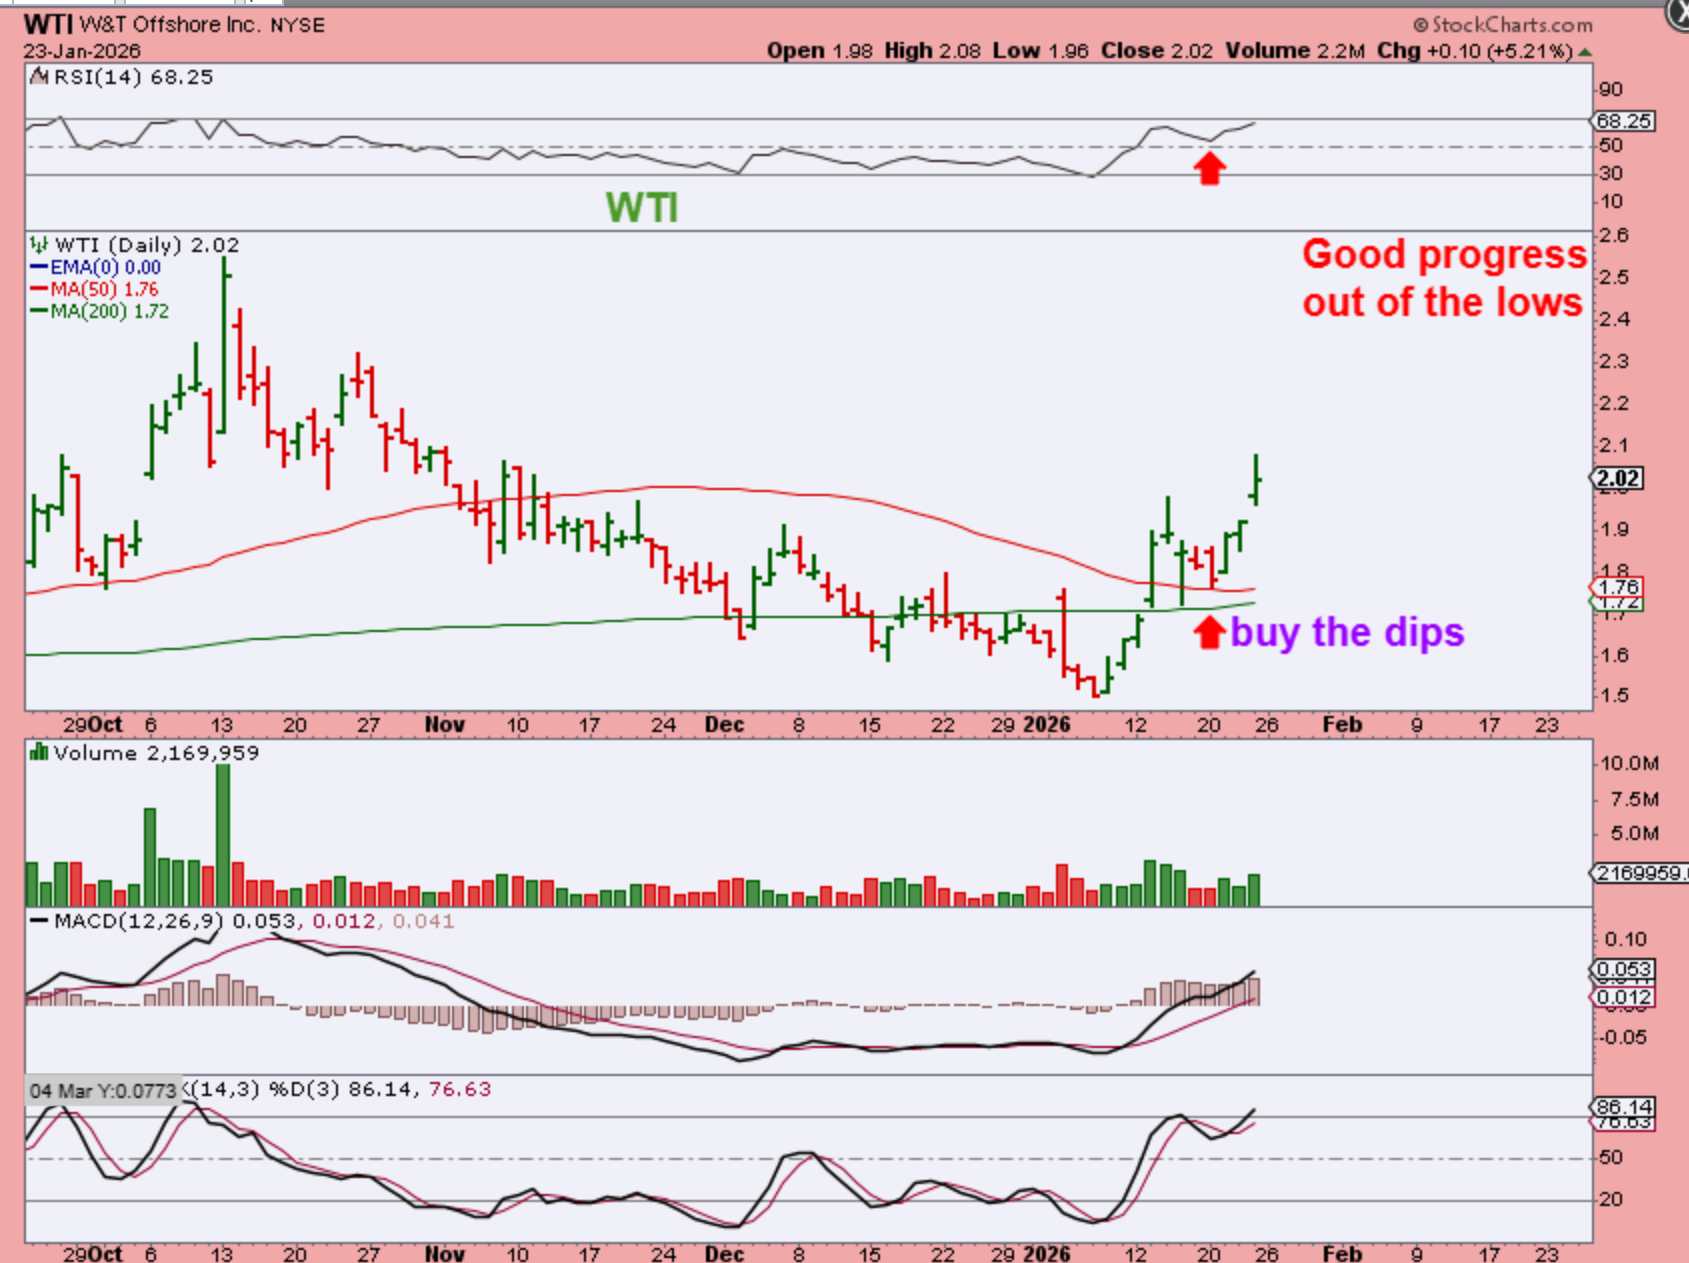
And if you look at the stocks that have been mentioned recently, like WTI, PUMP, VET, VLO, NOG, etc, you’ll see that they’ve been beaten down but are now making some progress with Oil moving higher too. Not only that…
.
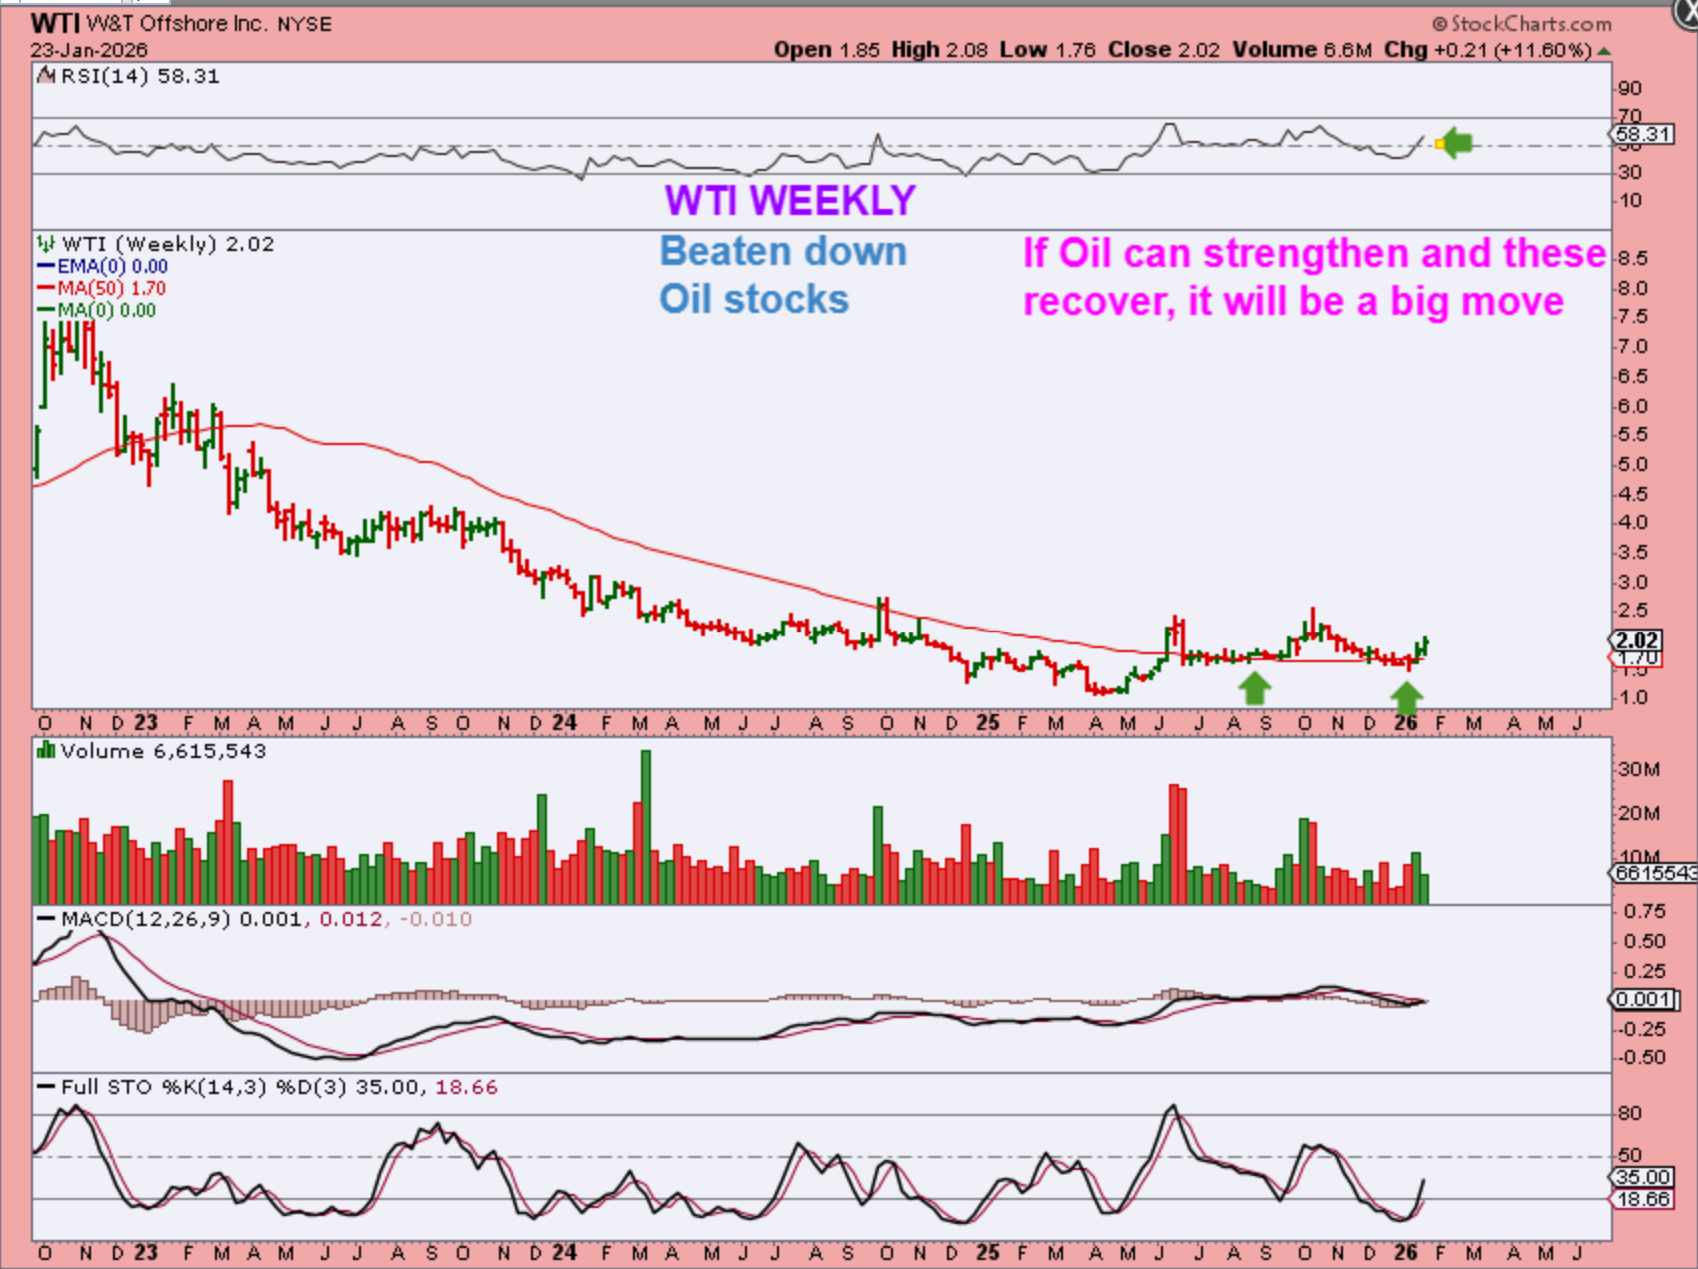
WTI WEEKLY: The weekly charts look very good after making a nice long rounding bottom base. The upside potential for a buy and hold from $2 here (if Oil continues to recover) could be big.
THE USD:
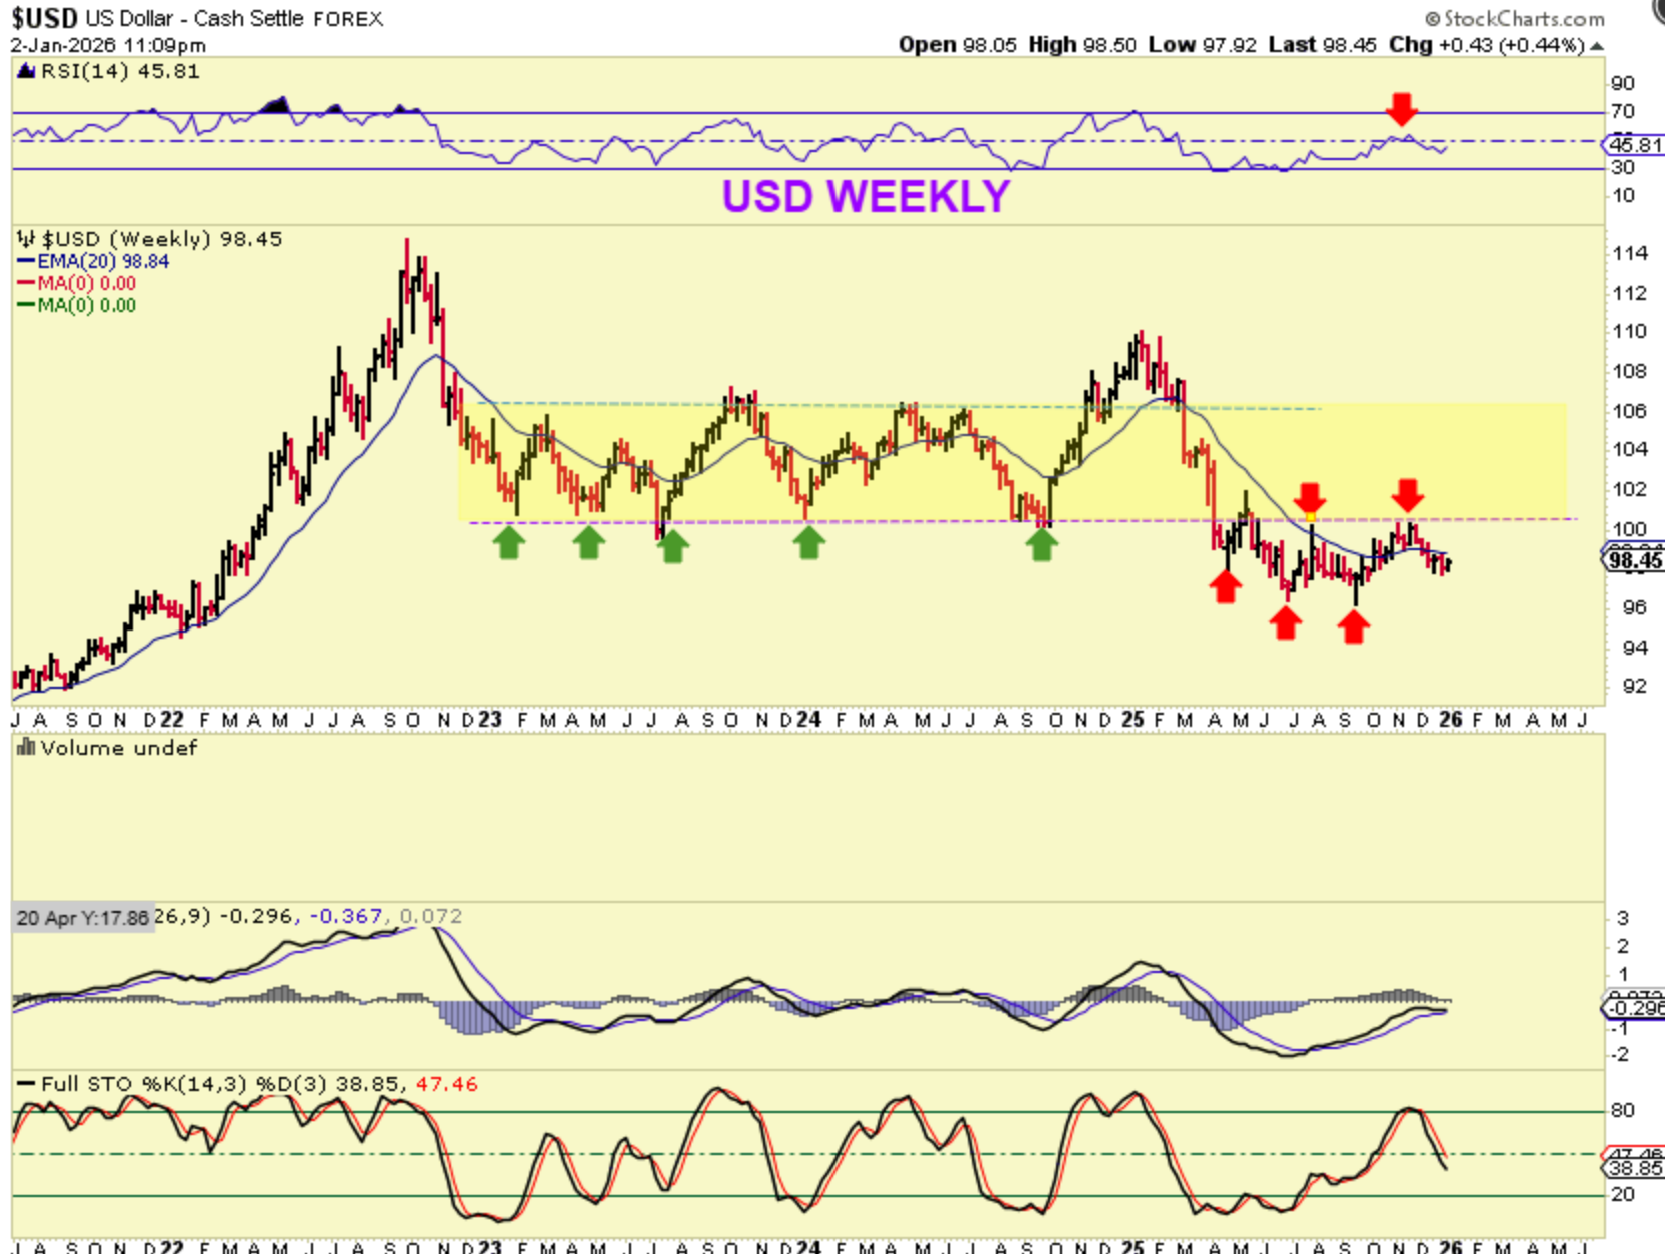
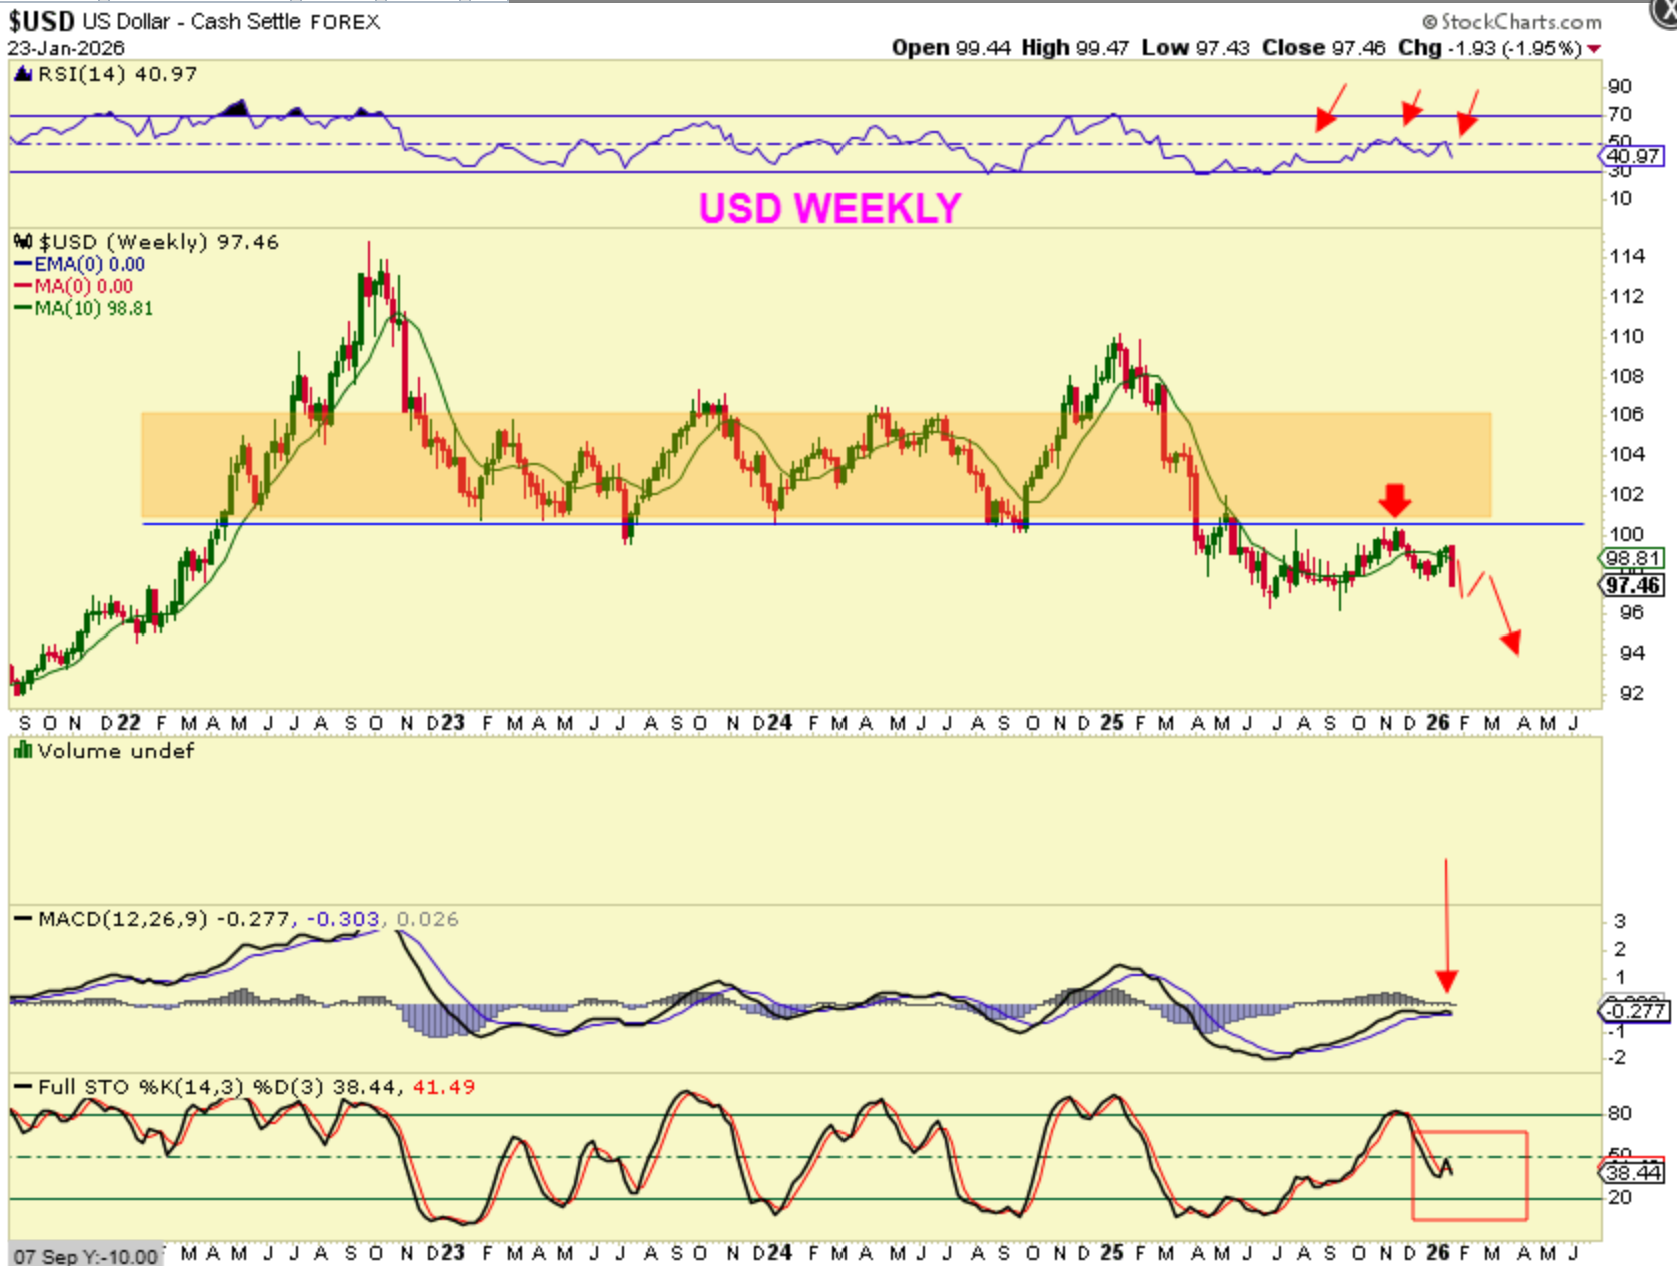
I had been pointing out a series of lower lows that had now changed to a higher low. Also L.T. Cycles formed, but now we had a R.T. Cycle, so an ICL had formed. How strong would it become?
THE USD:
In early to mid-December I thought that it would still roll over, because it failed at resistance. Now a dcl could form as a higher low, but it could still roll over UNLESS it broke back into that shaded area acting as resistance.
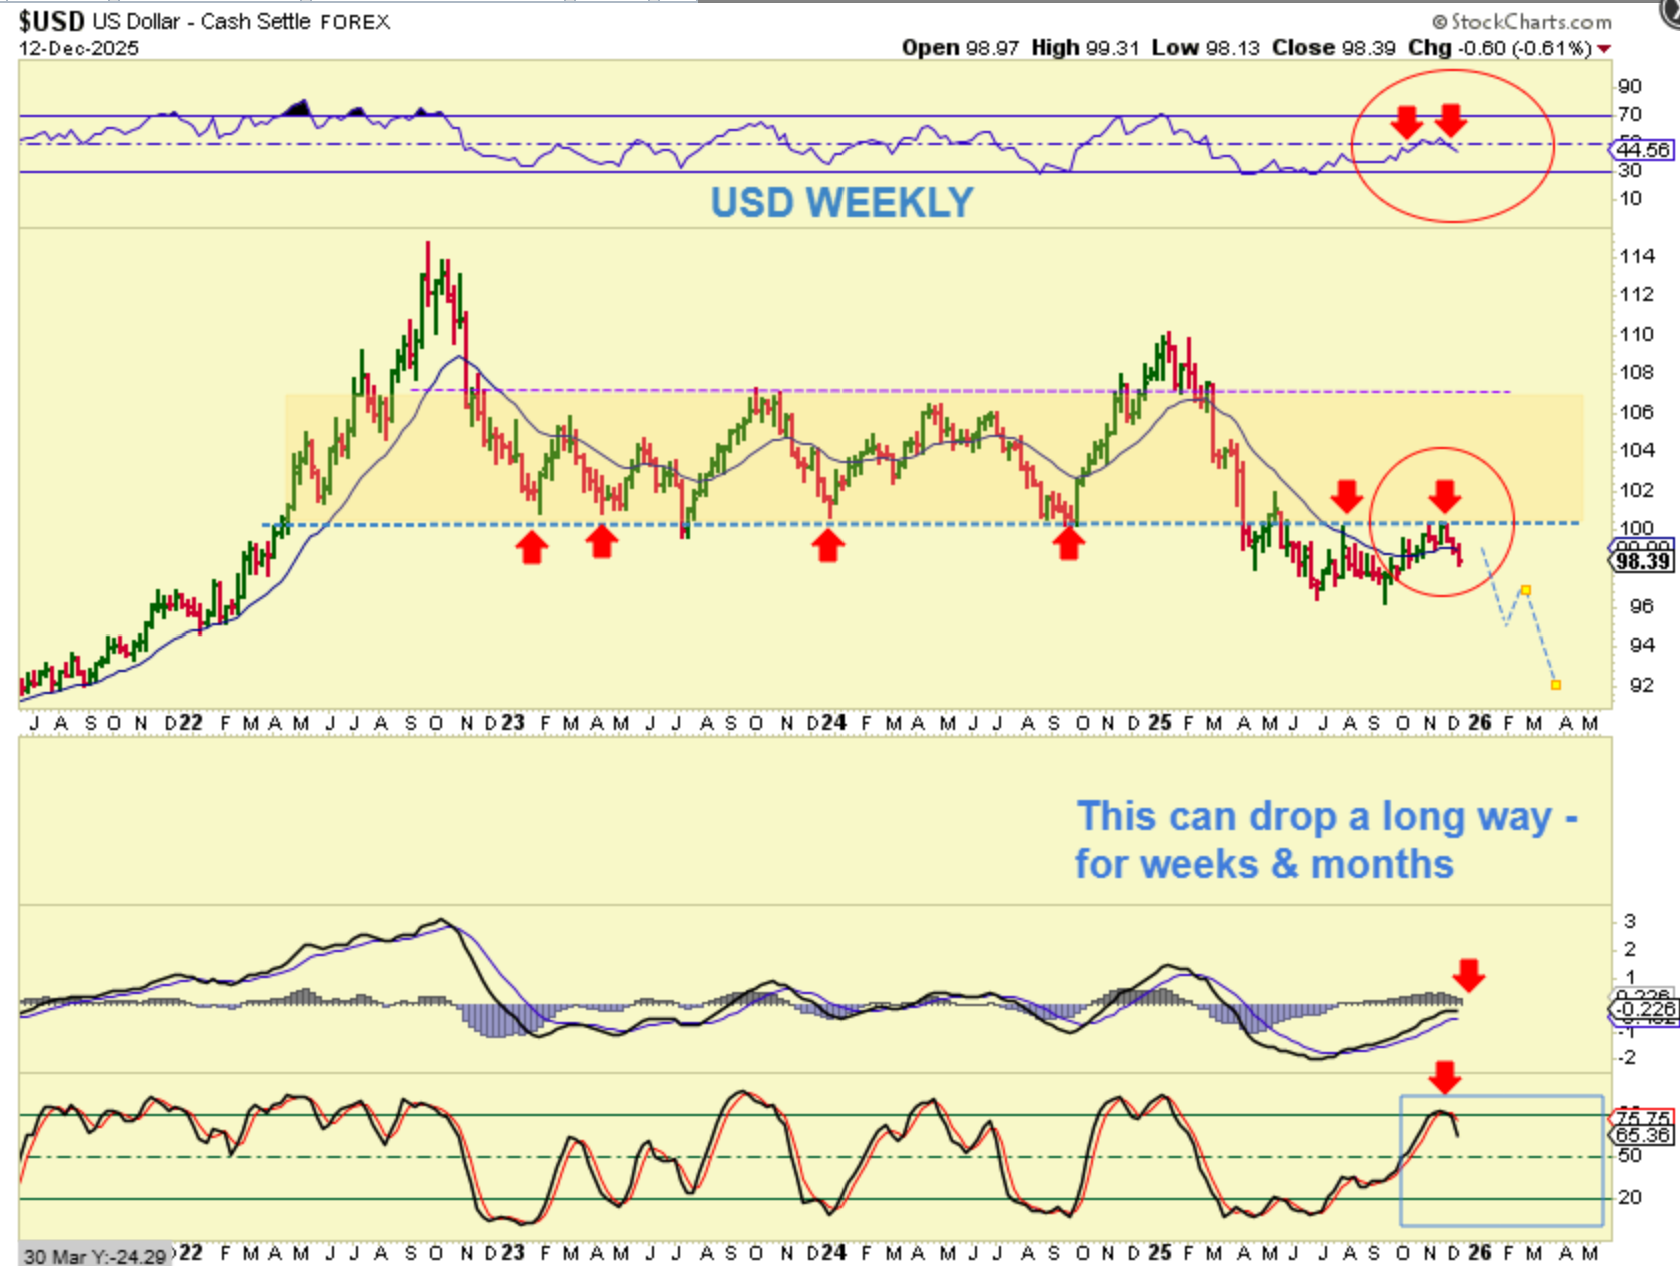
1. THE USD has the ICL.
2, It was rejected at support turned resistance, and
3. It formed a higher low (dcl), but now it dropped 2% this week and the RSI is curling down below 50% again. It is possible that the USD will continue lower over time. IF SO, it does make me wonder if that will cause Gold to hold up. For example:
.
It does make me wonder if Gold could hold up, because the USD did for a while.
For example: Let me give you a quick idea of what I’m thinking with the following 3 charts.
.
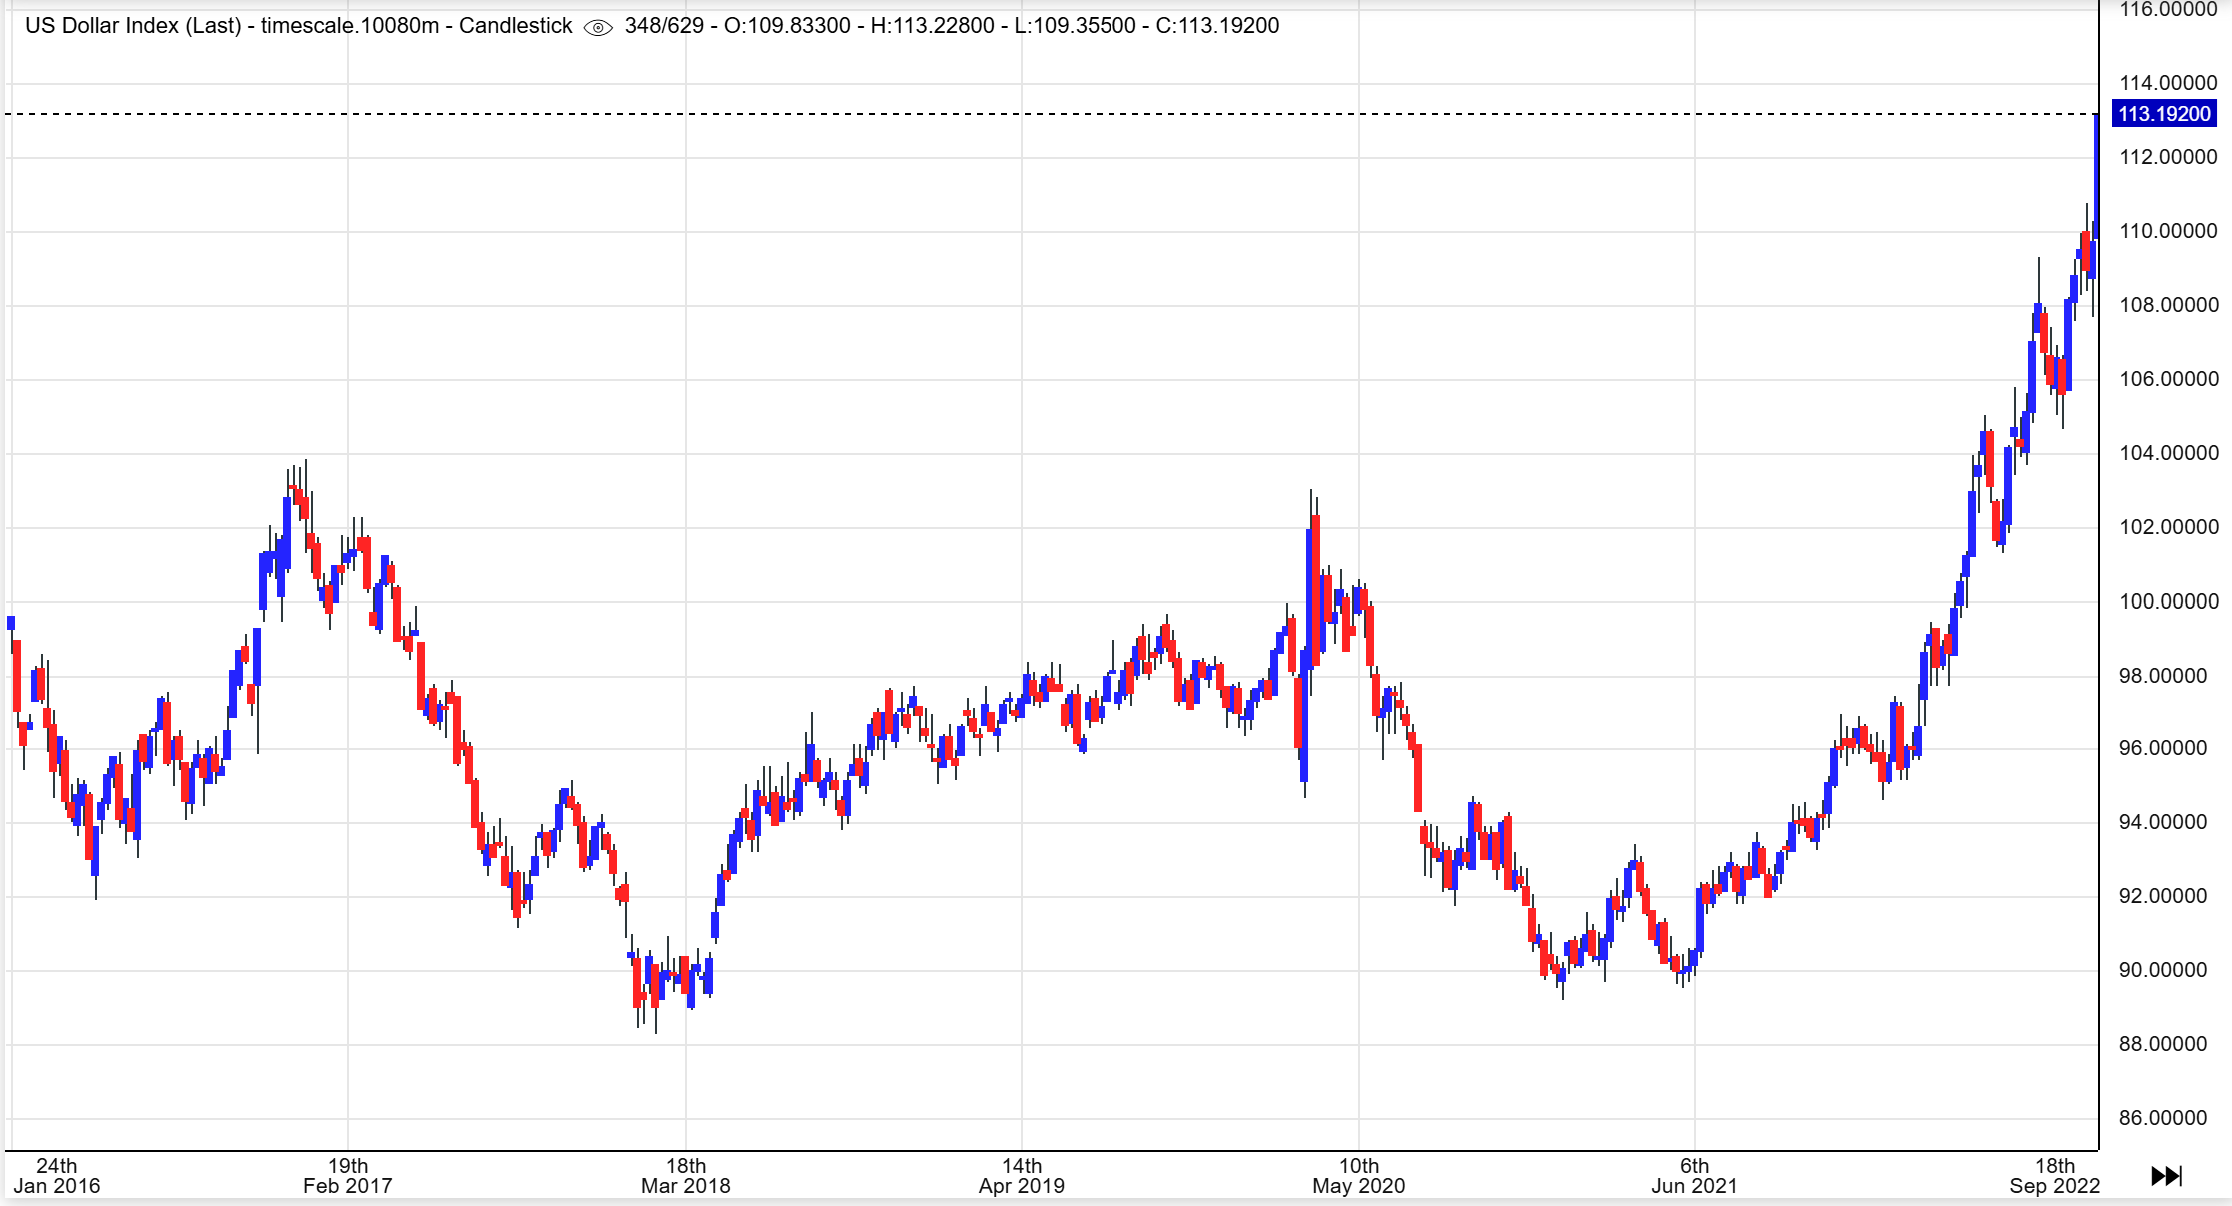
#1: There was a time when the USD ran somewhat parabolic, as seen here. It then sold off…
.
#2: The USD topped and sold off, but the crash phase was kind of short-lived. It dropped less than 50%, as seen here, and then…
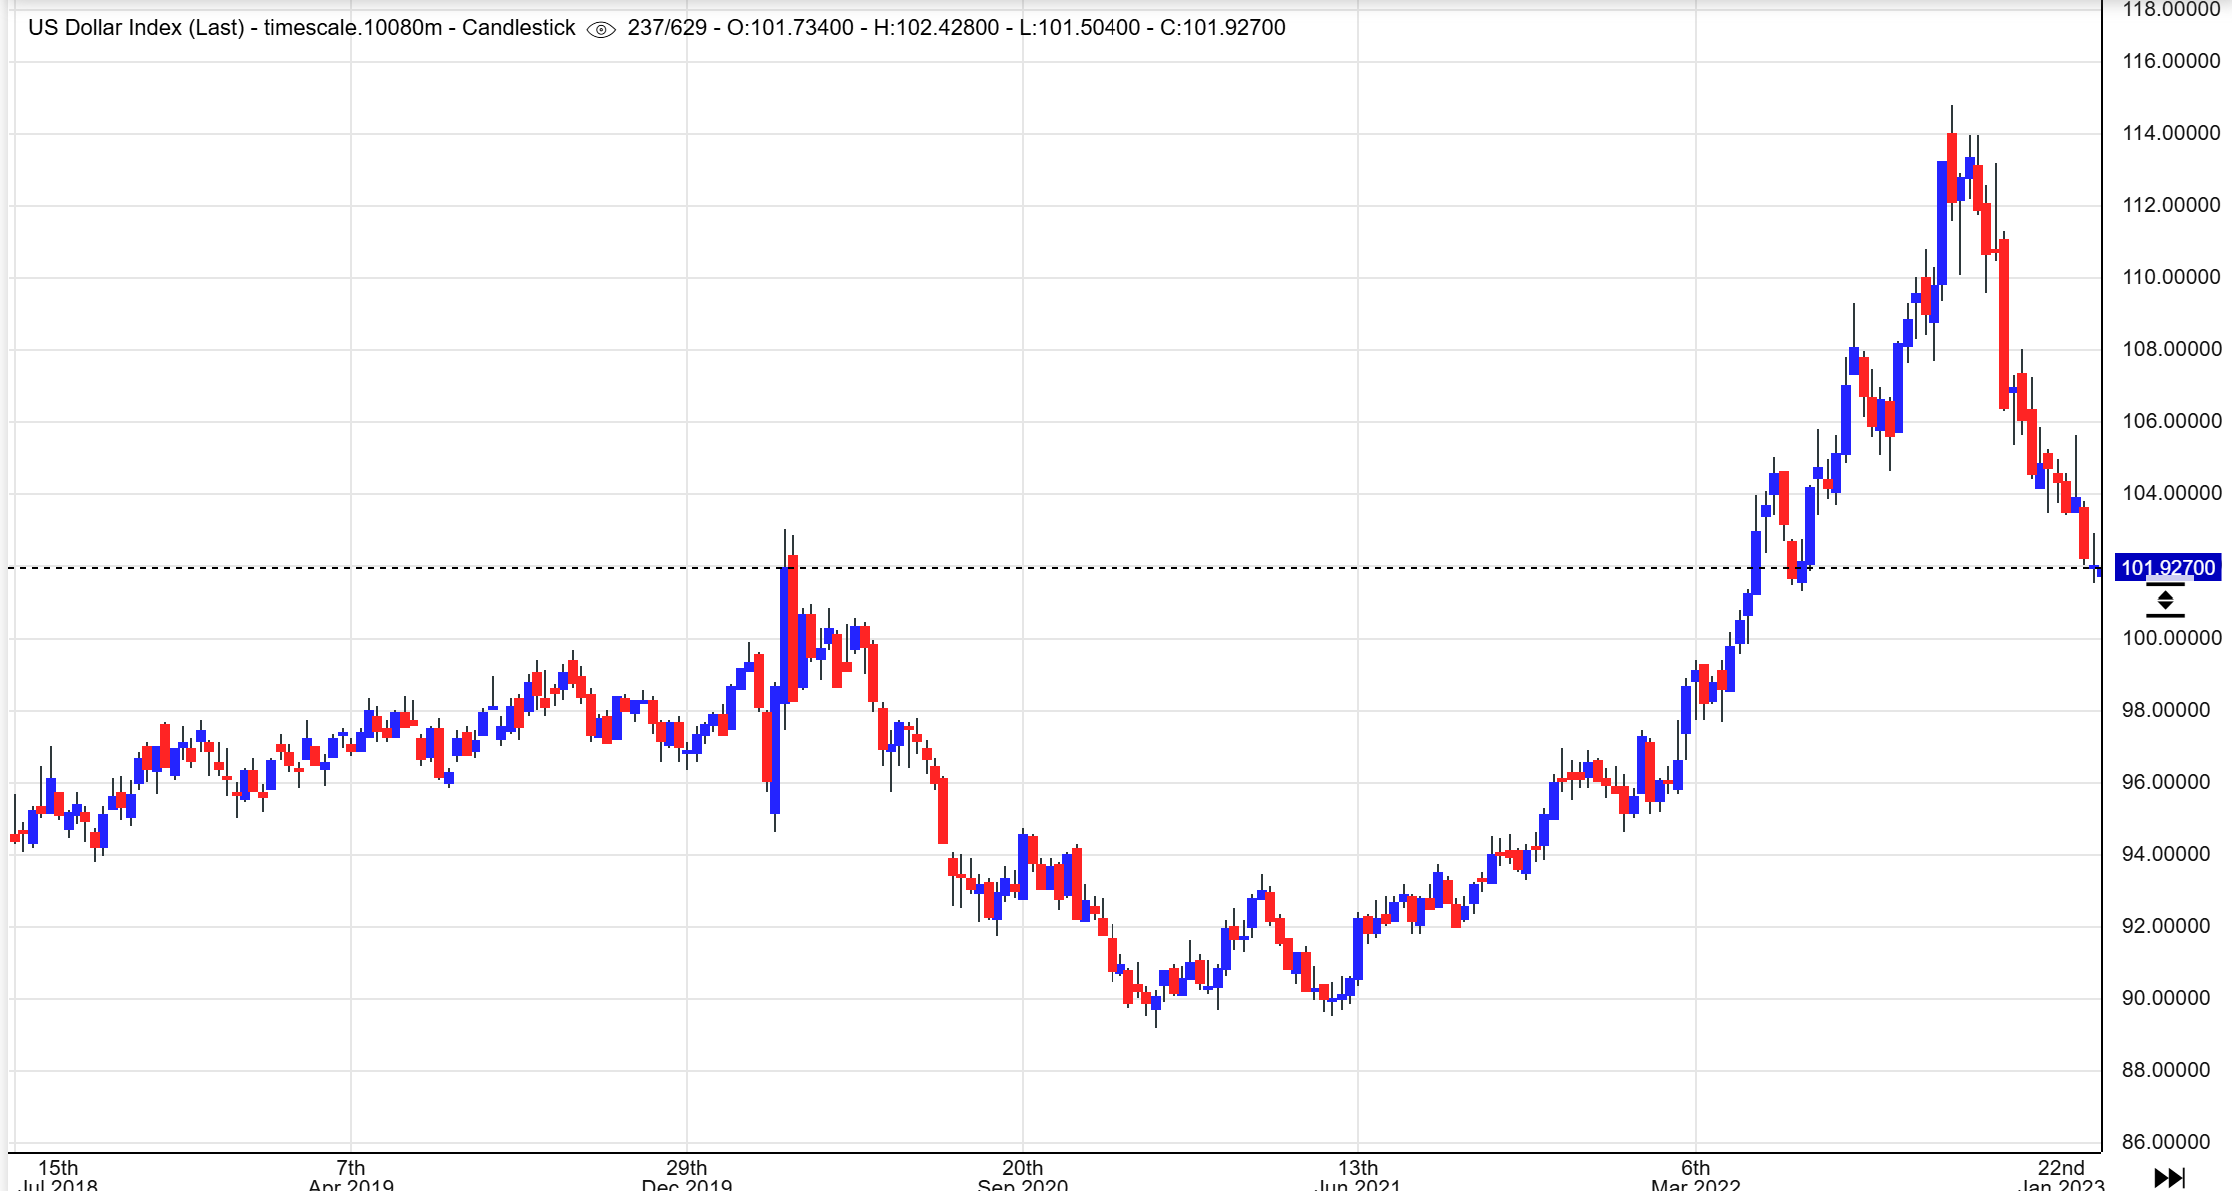
#3. The crash phase was kind of short-lived. It dropped less than 50%, as seen here, and then consolidated sideways. If Gold did this while the USD chopped lower, Gold could hold up and consolidate like the USD did. The dollar seems to be weakening in that IC. It does have time to chop around and run higher again and at that time Gold could drop, but then as the USD sells down again, Gold could consolidate and run higher again once the parabolic exuberance dies down. 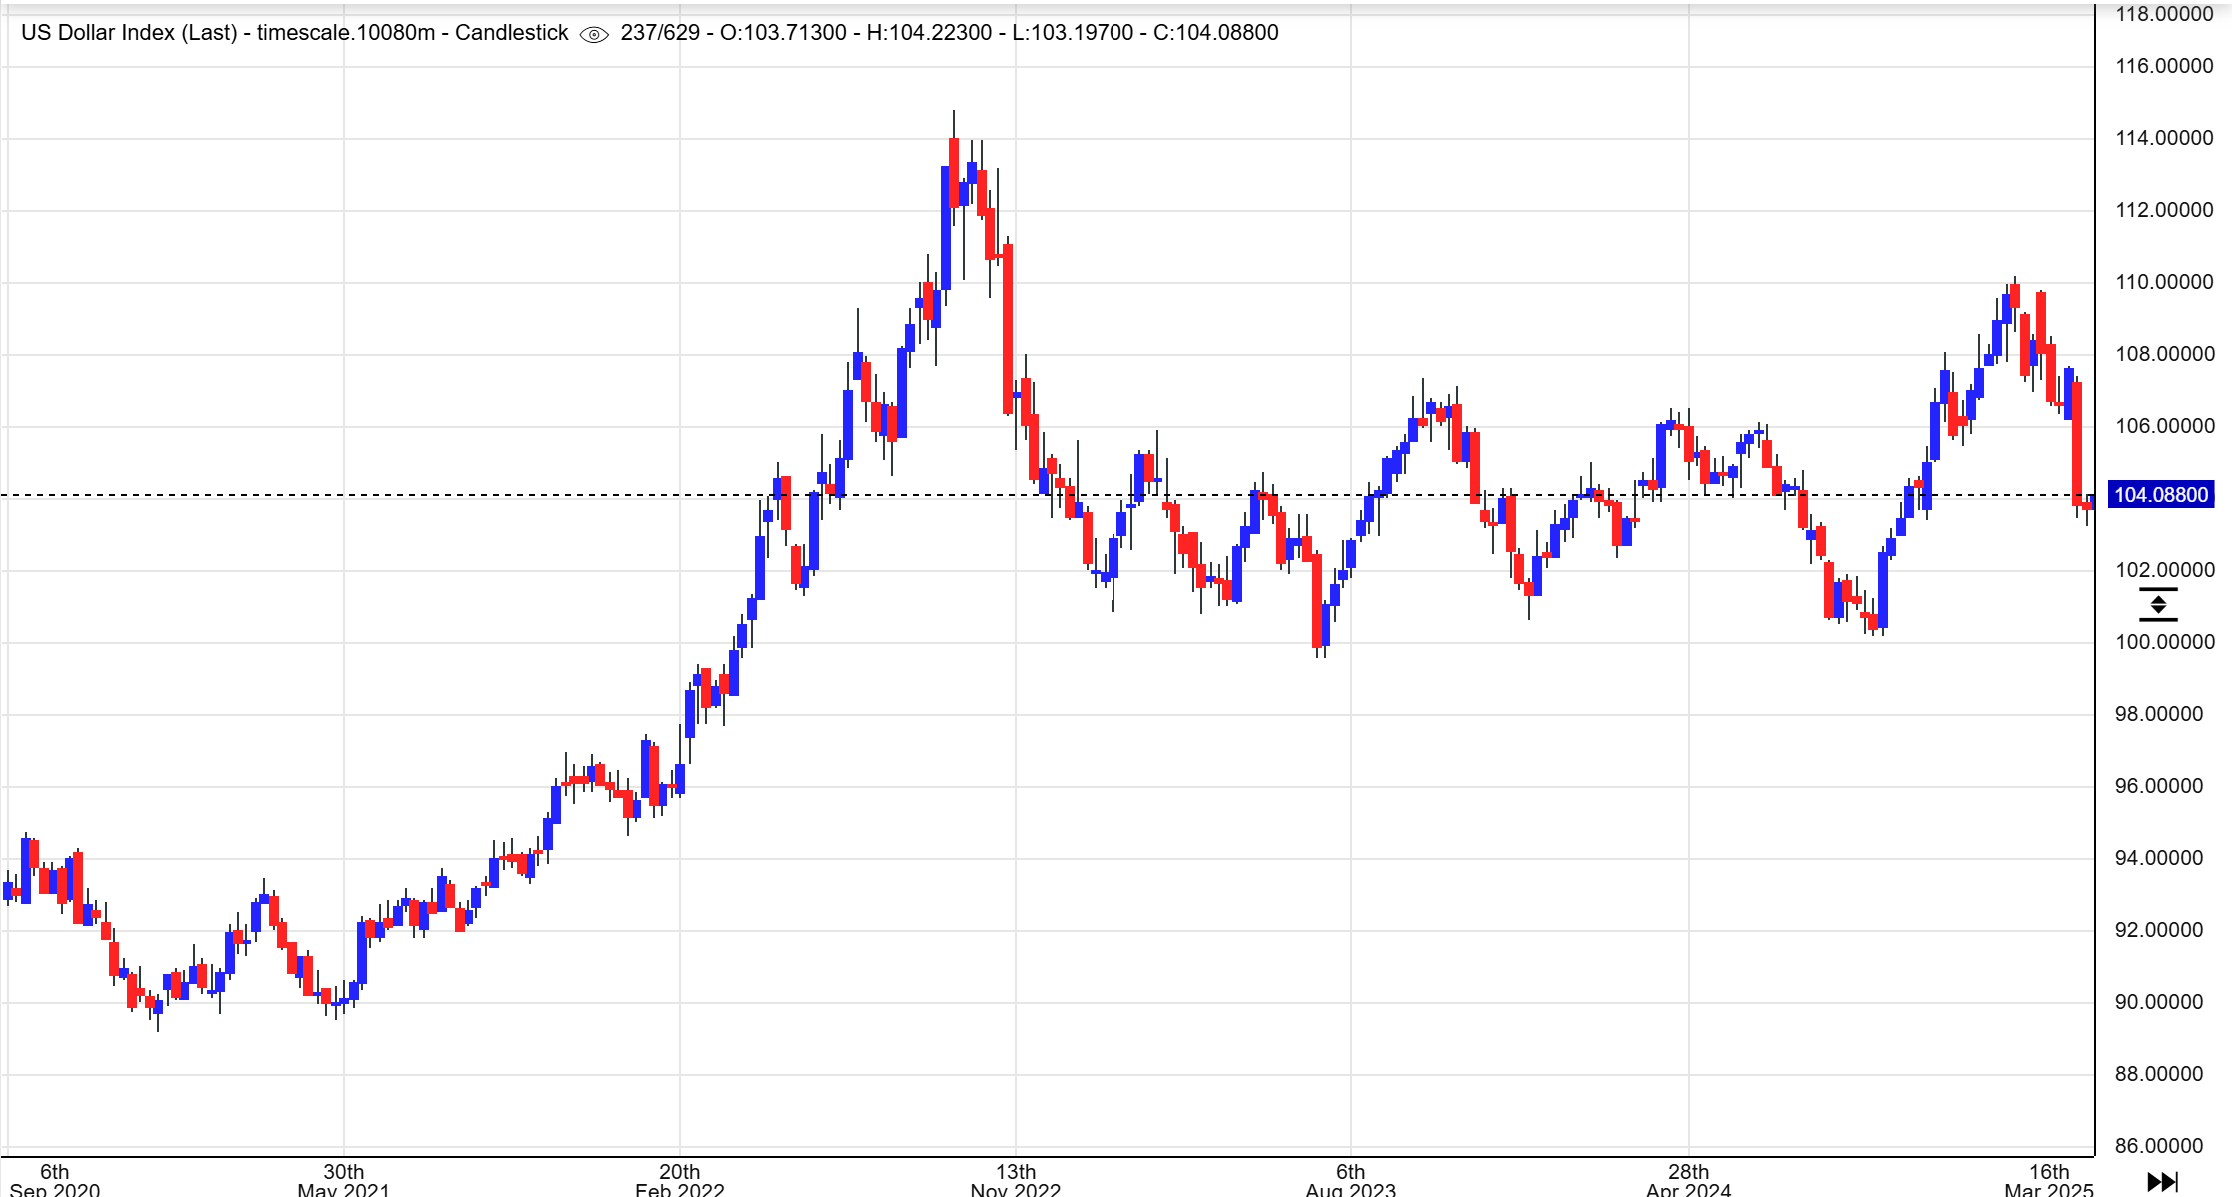
The above idea is just a thought that I’m having if the USD had 2 strong daily cycles out of the ICL, but now starts to roll over into an ICL, with 2 or 3 week ones later.
.
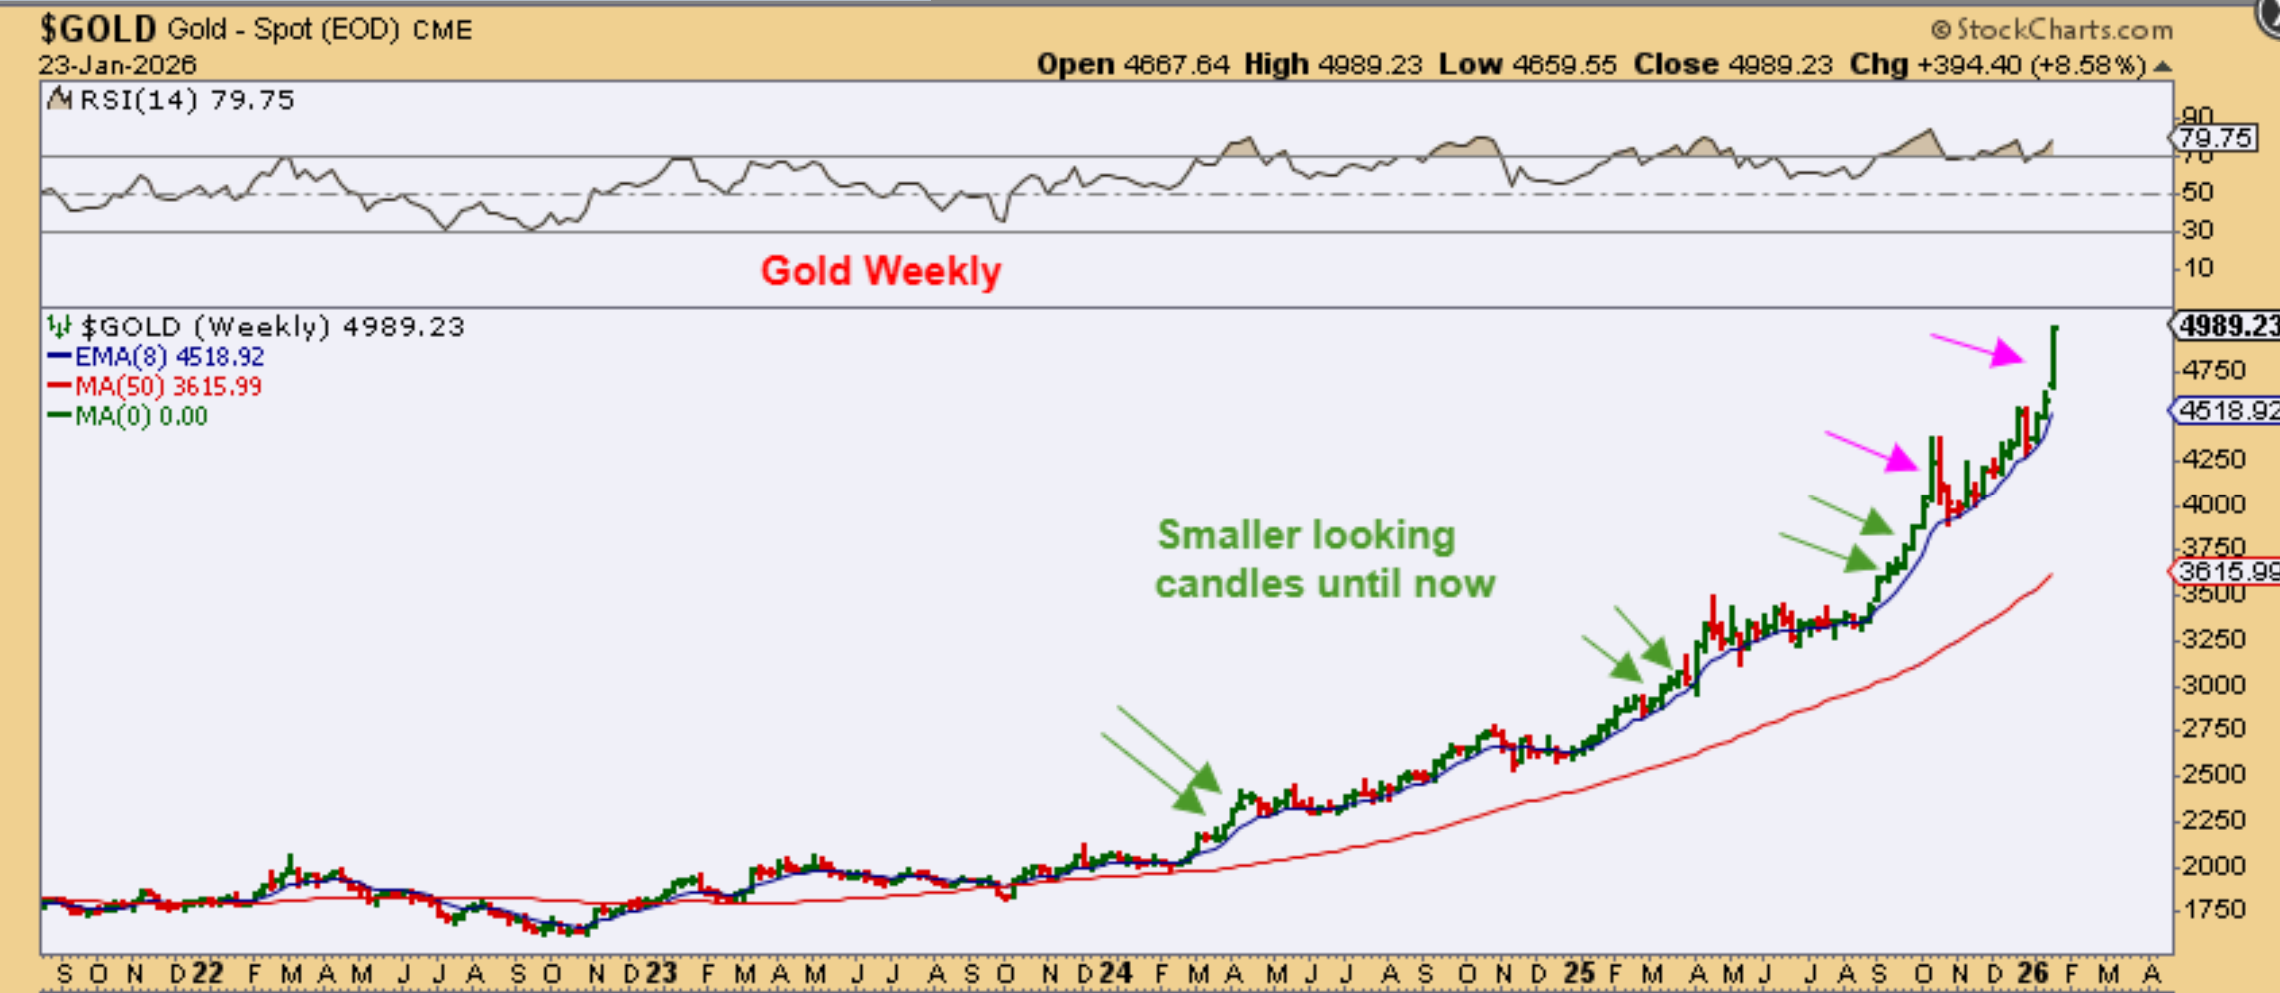
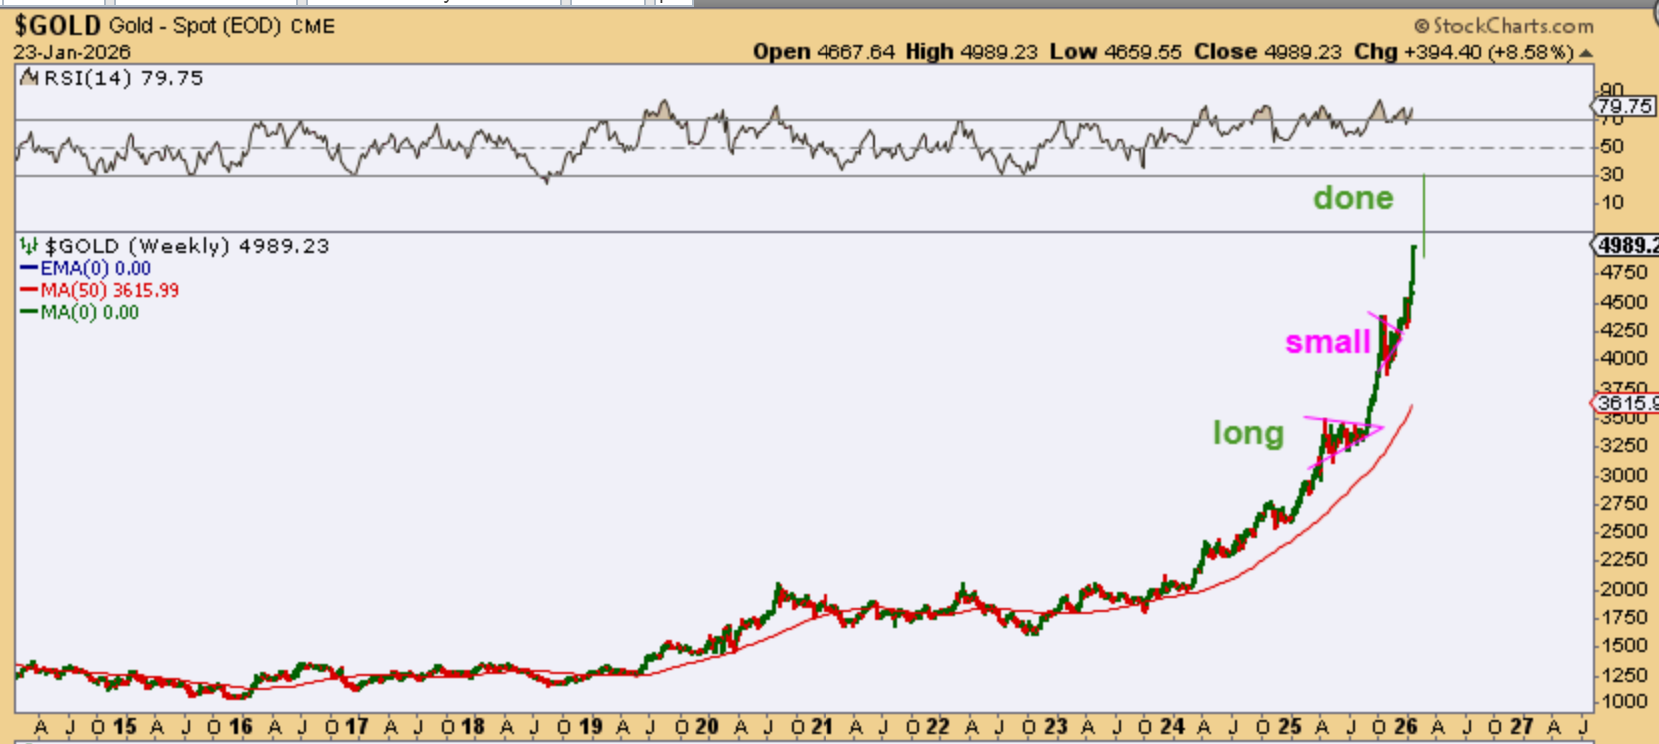
GOLD had a very strong week, up 8.58%. It is almost at $5000 and it could run higher again next week! Why? We are only on day 16 of a possible 25+ day daily cycle, so 5 more up days would be possible and that is next week. Or 3 up and 3 down, 3 up, etc . So…
.
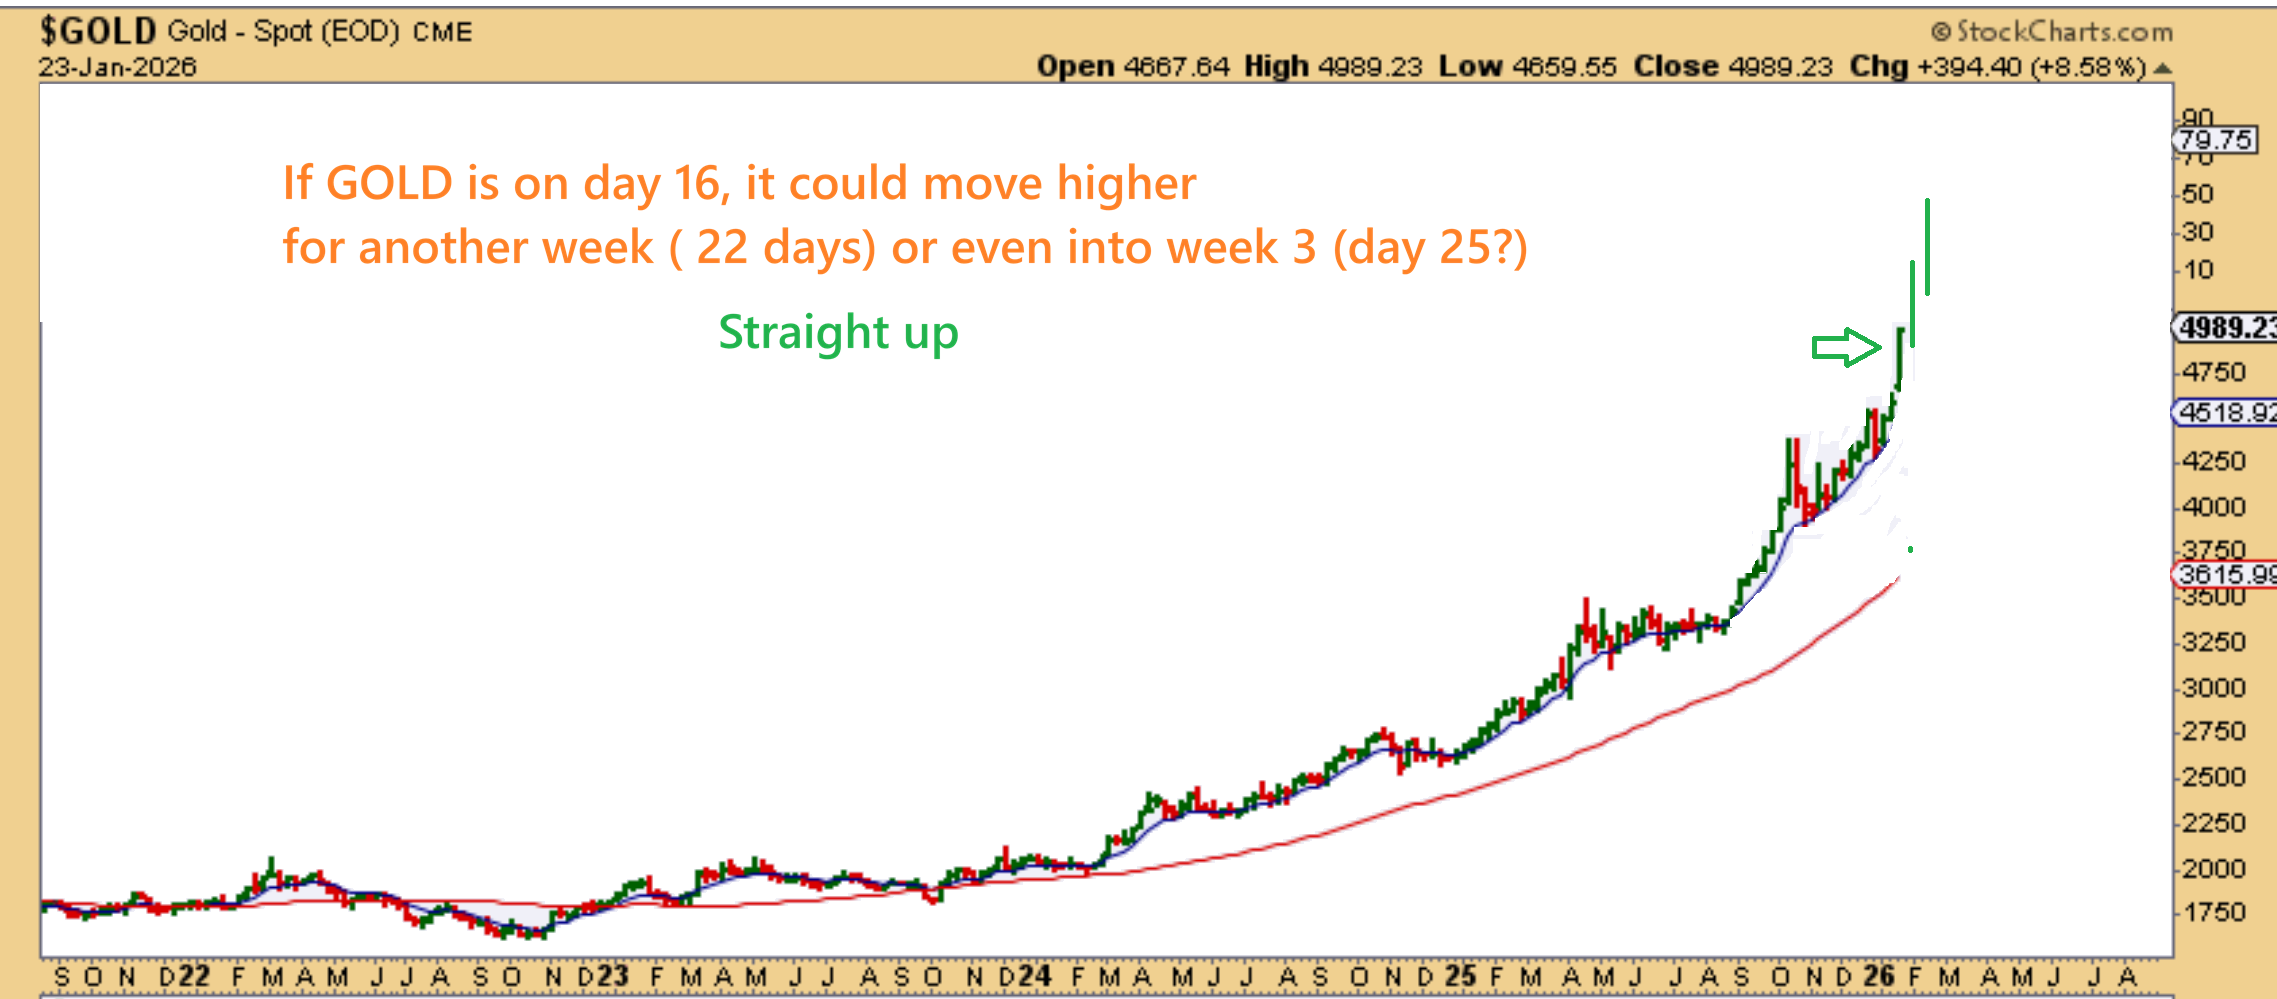
Idea #1 : GOLD is on day 16 and it can just go parabolic, as seen here. Please read the chart.
.
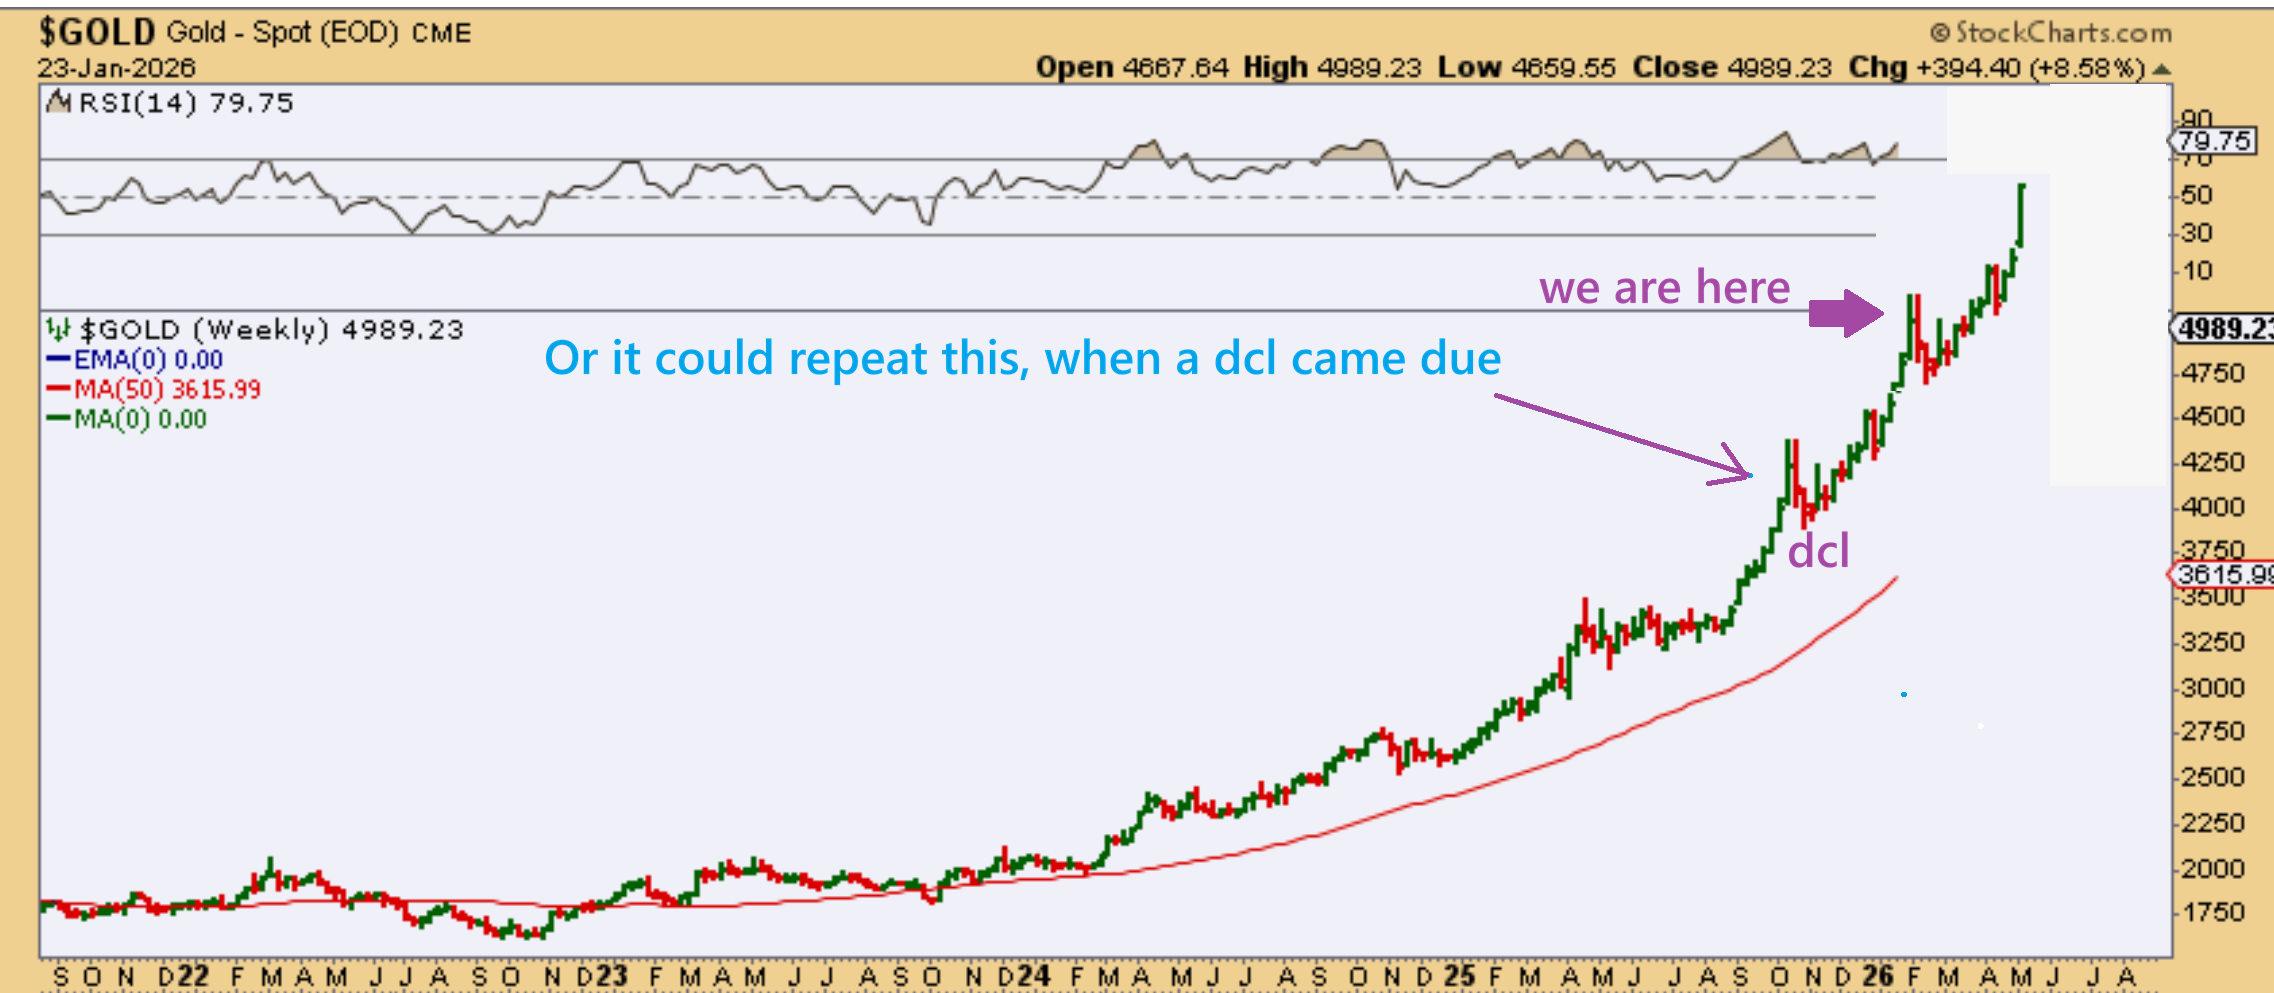
Idea #2: Now take a look at the lower magenta arrow, it looks like where we are now with magenta arrow #2.
If Gold drops soon into a dcl and ‘re-sets’ again, it could do what it did at the lower arrow and run again. Let me take that move at the lower magenta arrow and add it to where we are now…
.
Here I took a copy of that dcl at the first arrow and added that dip into a dcl to where we are now. GOLD then chopped along higher and took ff again. We could see this if the USD bounces (Gold drops to a dcl) and then the USD sells off and Gold runs again. WE JUST NEED TO KEEP IN MIND THAT THIS IS ALREADY CONSIDERED PARABOLIC and they can end at any time.
.
WE JUST NEED TO KEEP IN MIND THAT THIS IS ALREADY CONSIDERED PARABOLIC and they can end at any time. We had a multi-month consolidation, a short one in Oct/November, and this may be the final Rocketship ride.
One more up week beyond $5000 next week could top this out for now.
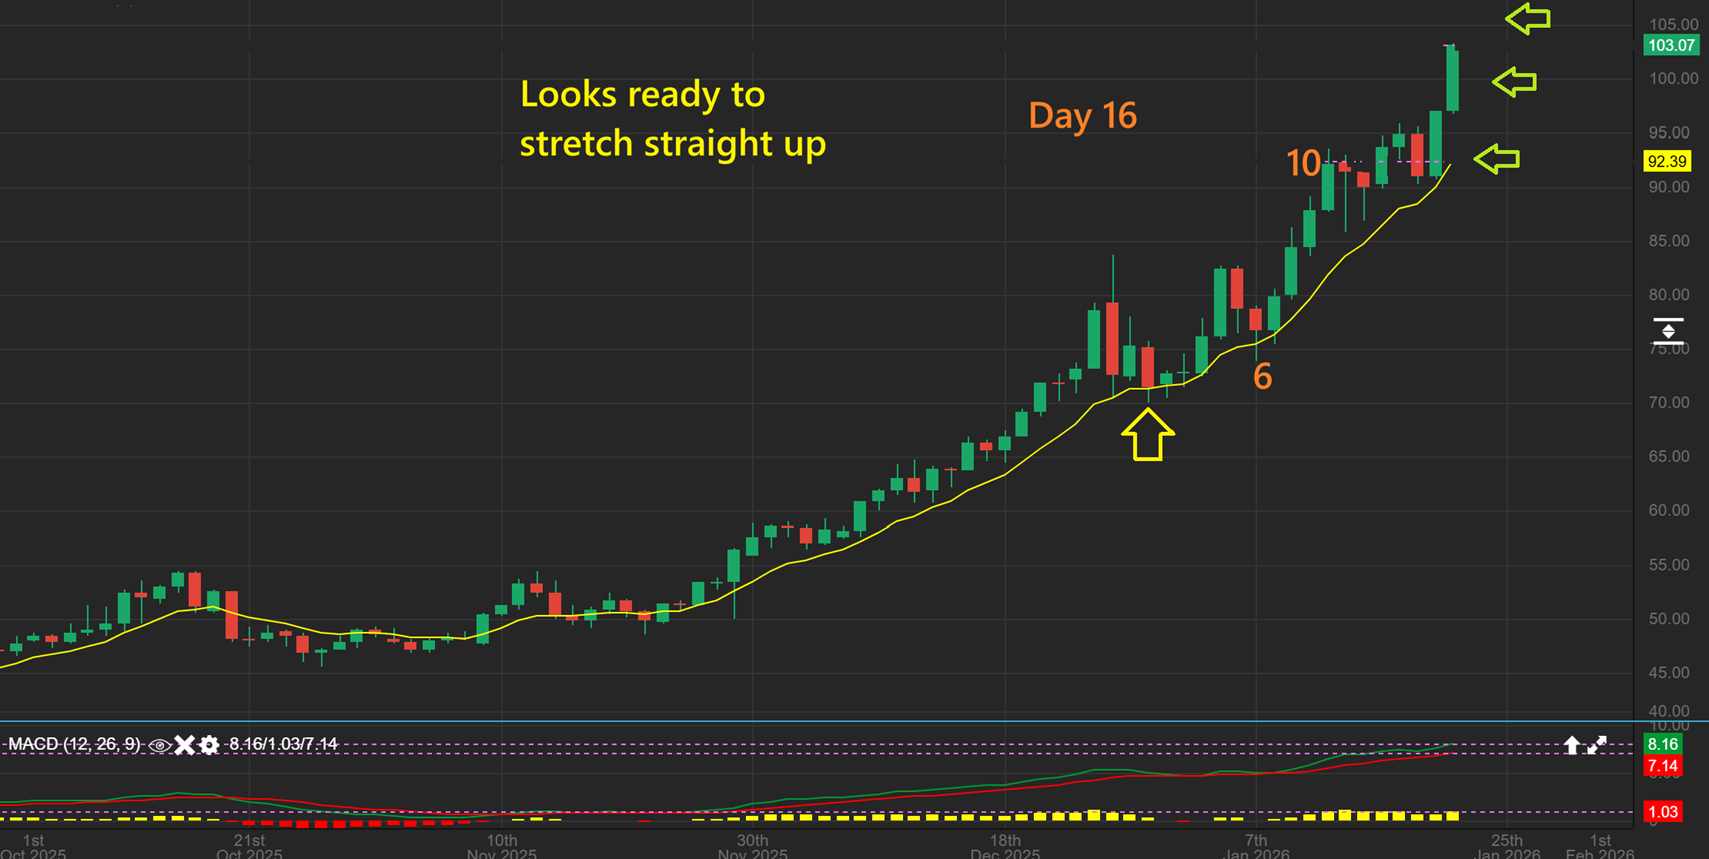
SILVER DAILY – As pointed out last week, when you compare the recent moves to moves in early 2025, it is starting to have long strong candles. It now looks like it could to go straight up. Look at the last 2 days, day 15 and 16.
.
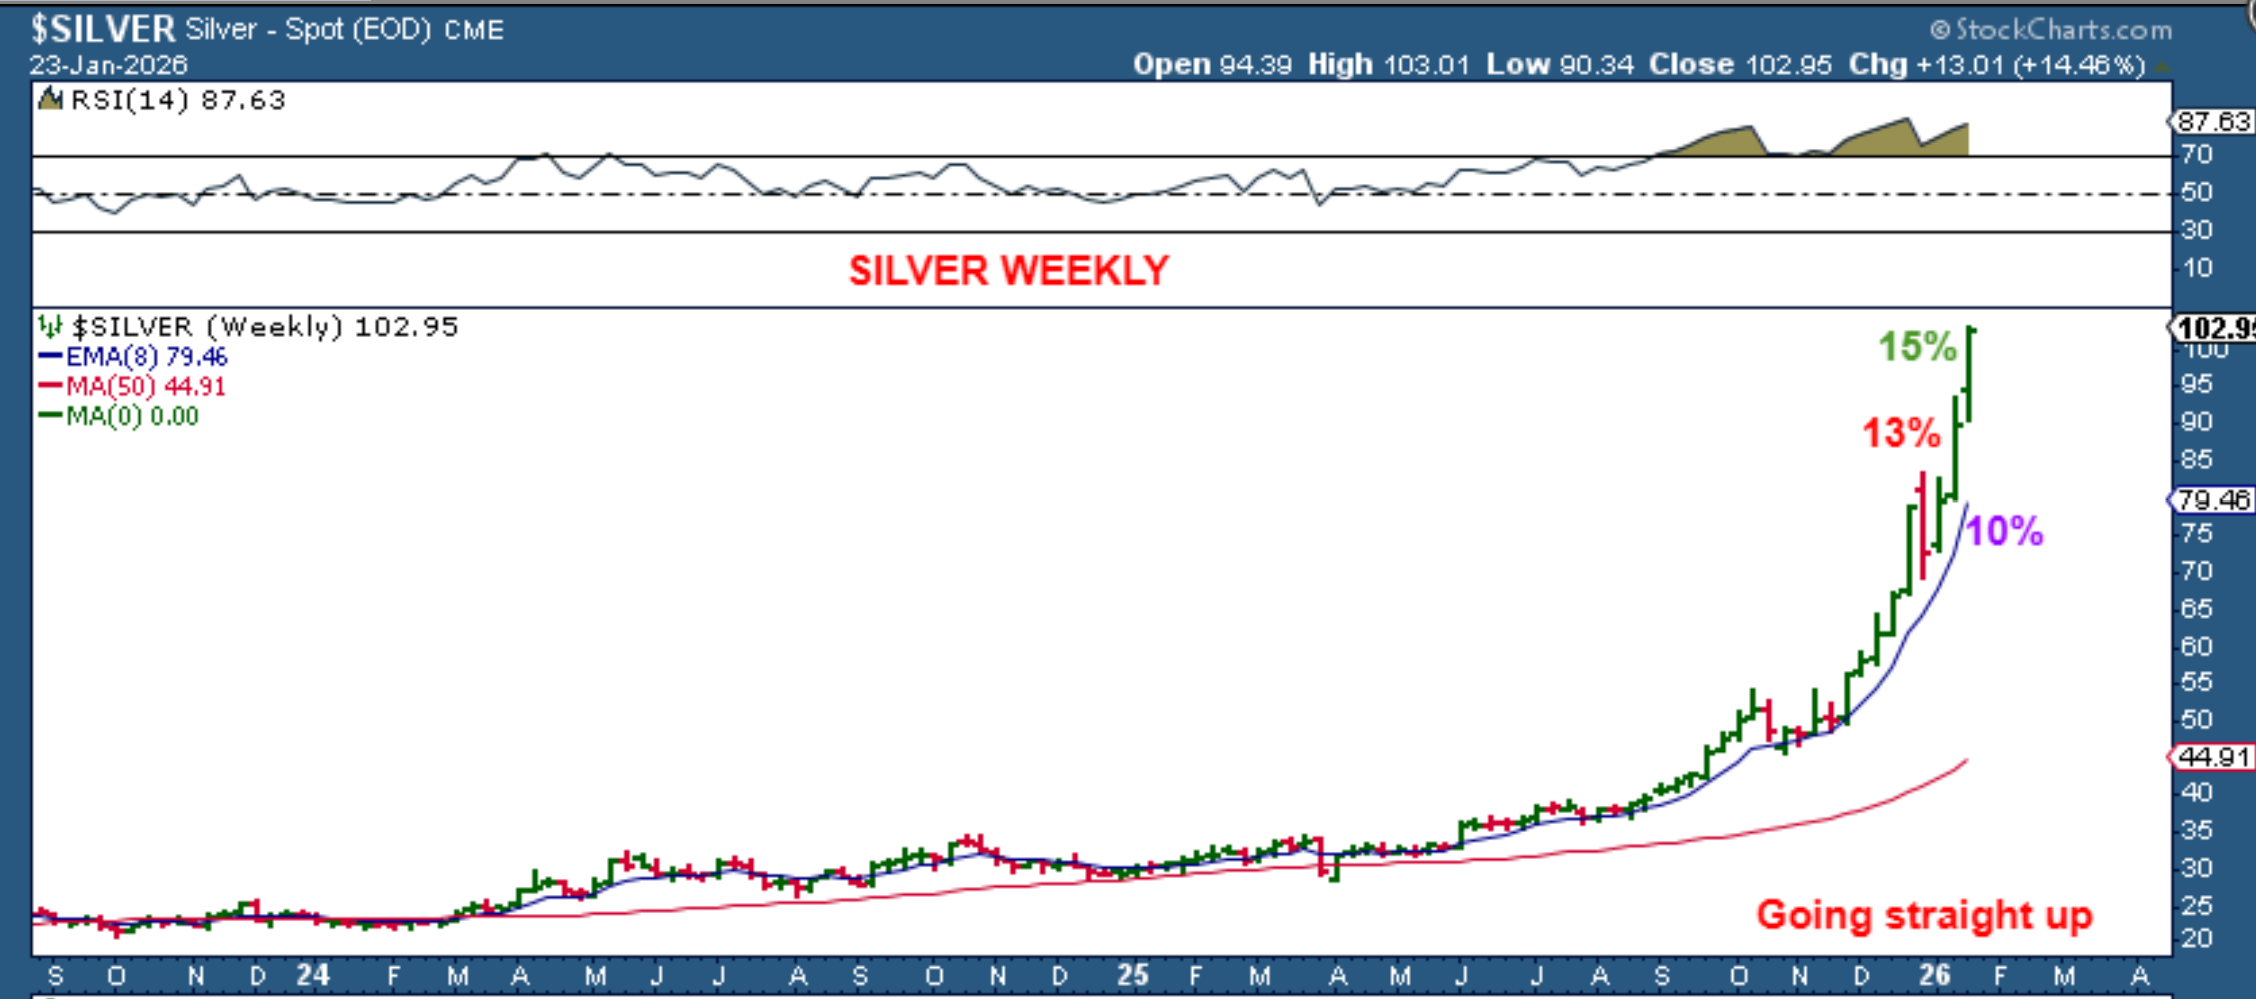
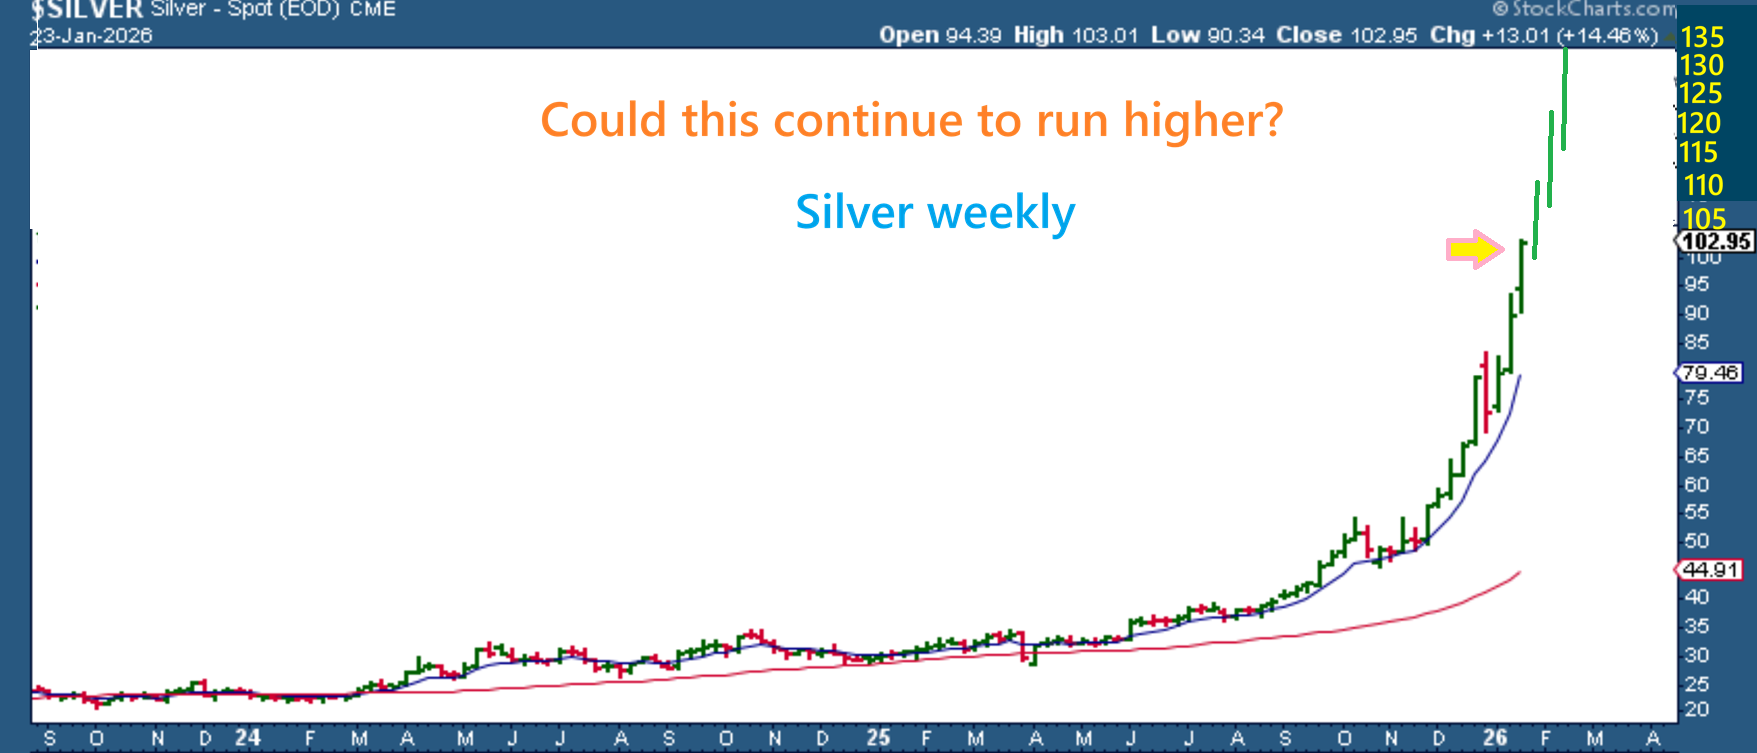
SILVER WEEKLY – This is quite parabolic. Could it go higher for one more week? It could, since it is only day 16. The last 2 weeks have been straight up for Silver.
.
I’ll add candles for a visual
SILVER: How many weeks are left? At day 16 it could peak next week or the week after. This move is straight up.
.
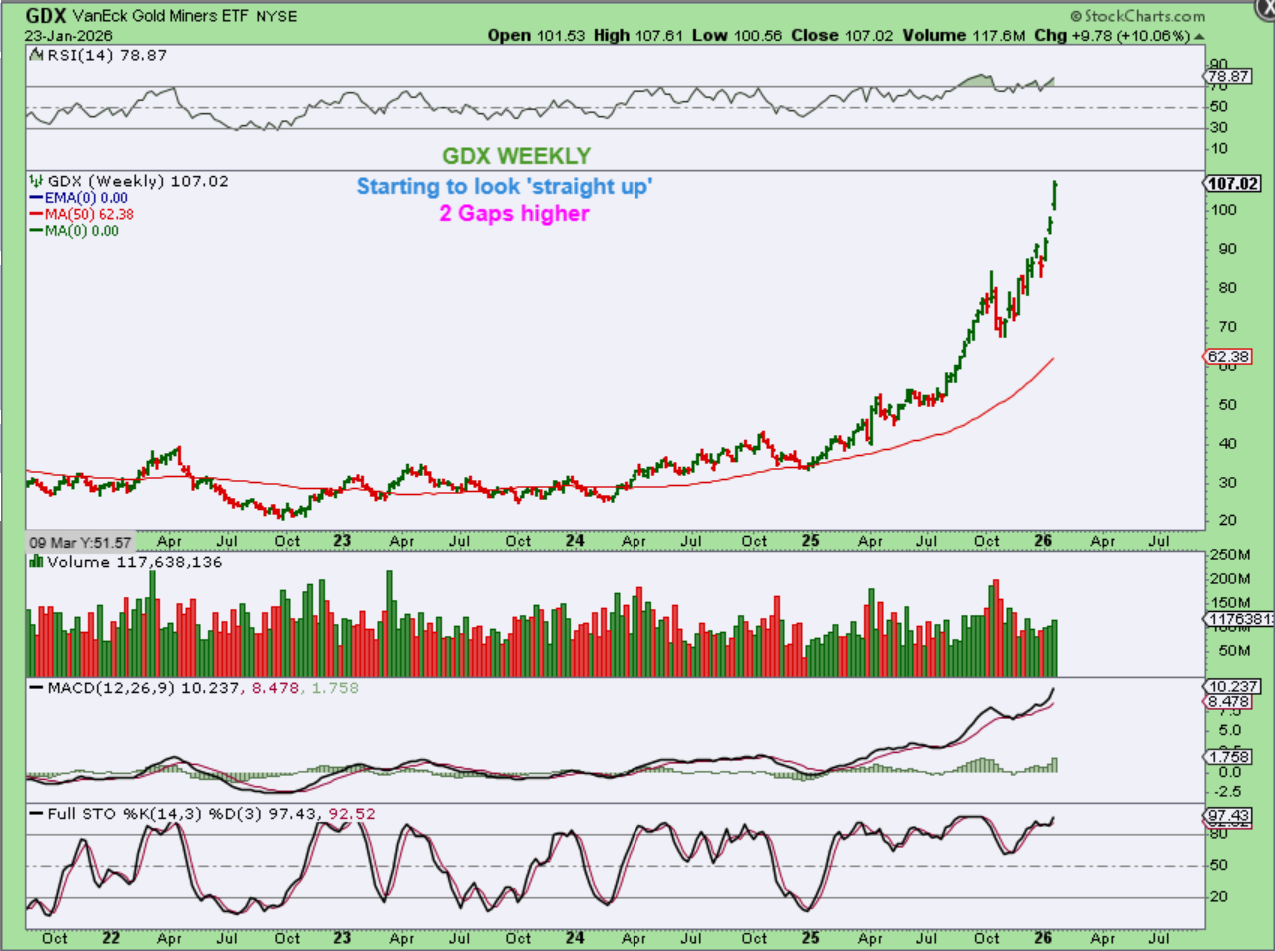
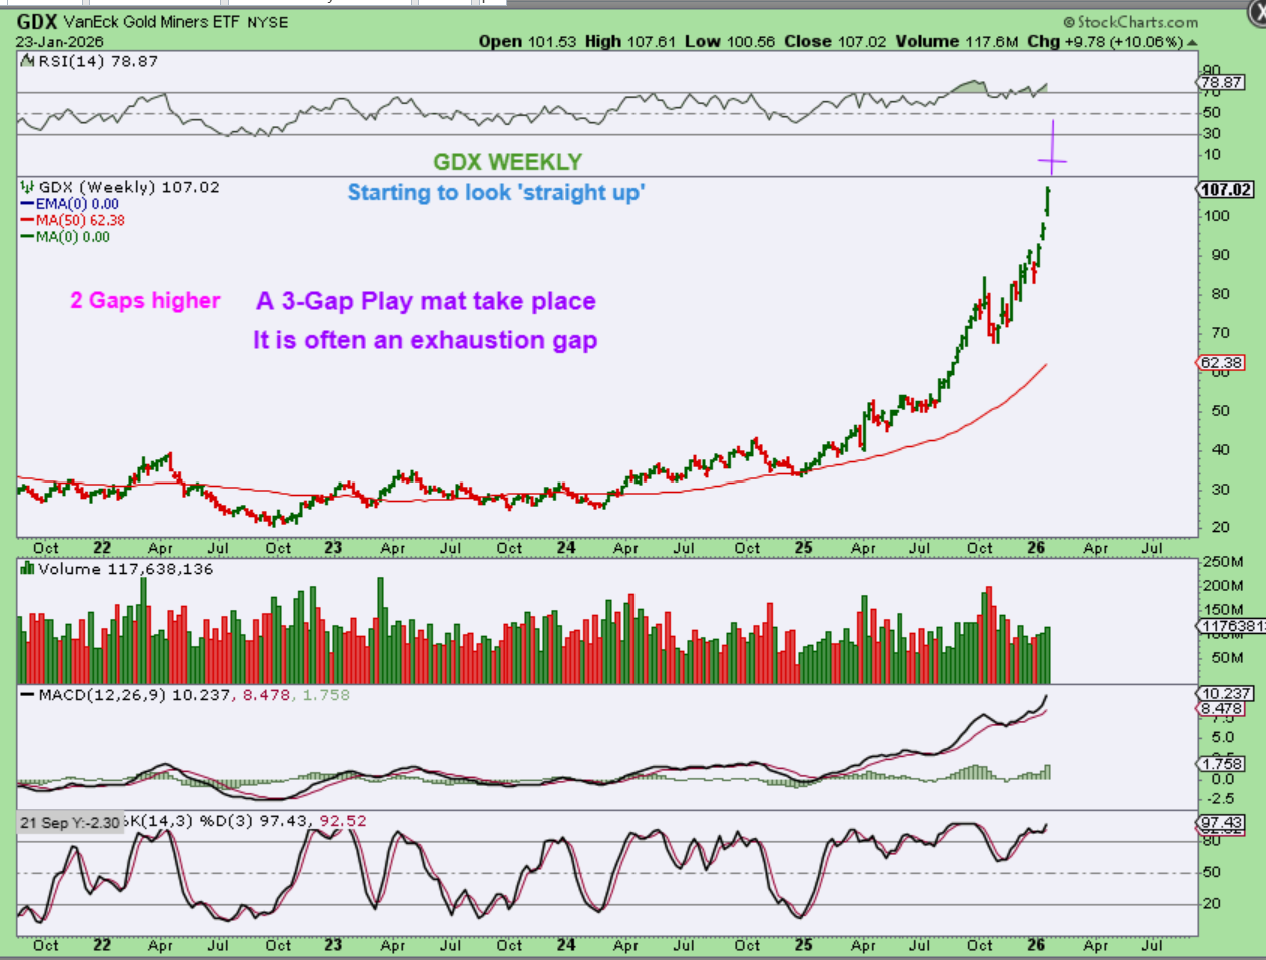
GDX- So this is gapping up, up, and away. It’s taking on that final straight up look, but with cycle timing, it could even pop up again next week, we’ll see. It may even run up for 3 days or 4 days and then drop, leaving us with a weekly reversal this week or next. That would look like this…
.
GDX- Could run up next week and start to pull back, leaving a candle something like this. Honestly, it is not possible to tell how the final part of this daily cycle will play out. You could just try to raise stops if you want to get out on the next dip. A 3-gap-play is when price ramps up and then goes gap, gap, gap. That last gap is often a final exhaustion move that runs out of buyers.
.
Go Bulls! Have a great weekend everyone.
.
Sidenote: The report is a bit late because my weekend is getting messy, and I may not be around on Monday. Much of the U.S. is engulfed in a major storm, with Ice and snow. We are getting 2 feet where I am Sunday through Monday, and my mother’s plumbing let go this morning (not frozen pipes, it was a corroded ‘cap’ popped off and flooded her basement). So I’ve been there cleaning up and now with this storm I will be cleaning up snow here and at her place, so I may or may not be able to be in the commenting and trading on Monday, depending on storm. Feel free to post your trades, bullish set ups, Bullish %-gainer moves, ugly dips or whatever you see happening, etc- It does help me to skim through on a lunch break and get a quick snapshot of the day, so I imagine that it helps others busy at work too. That’s why I do it. Thanks!
.
~ALEX
.
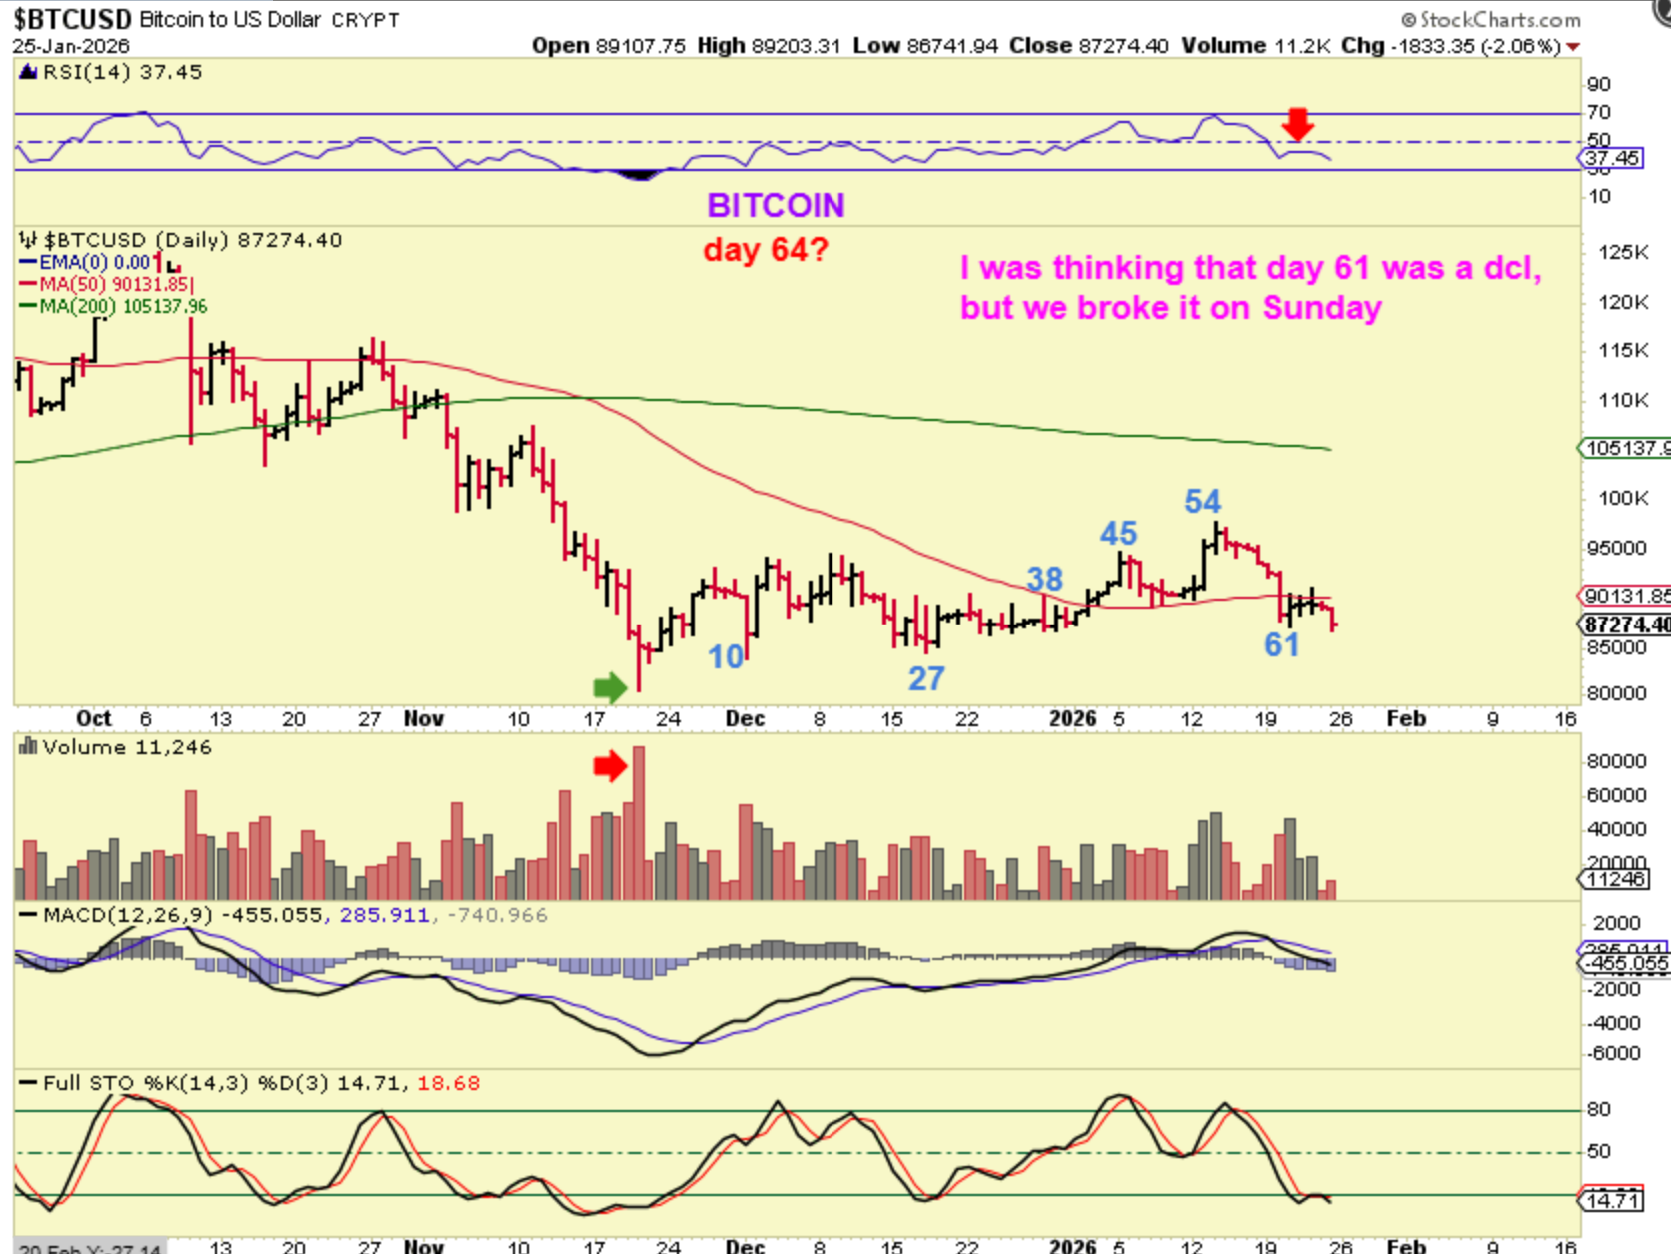
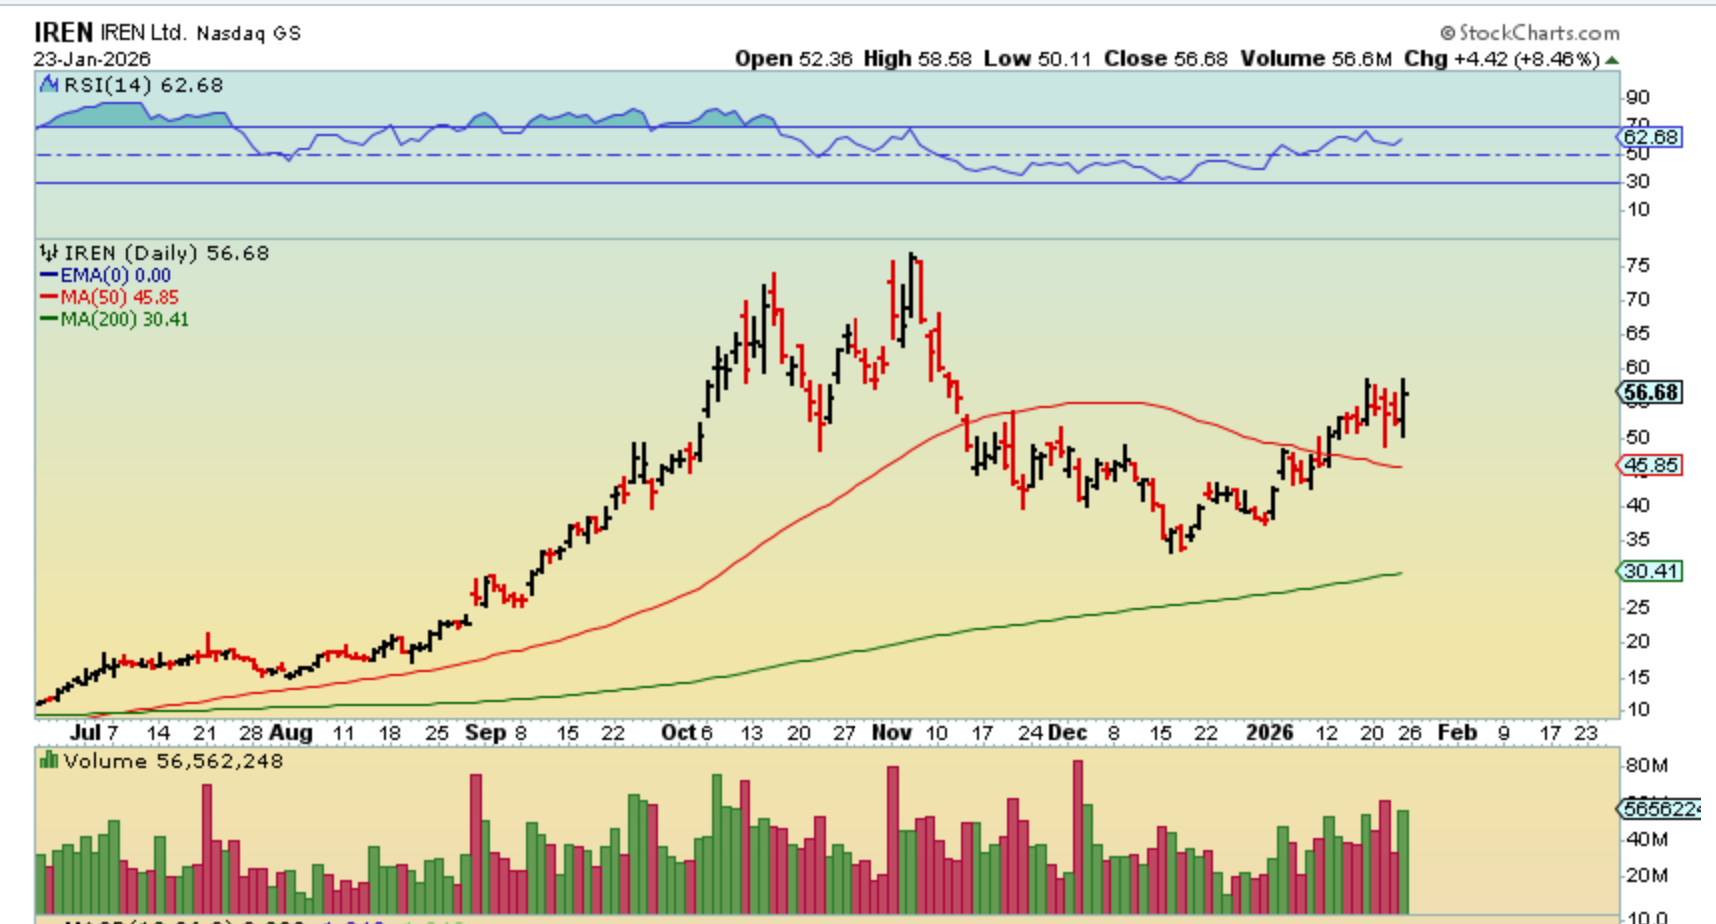
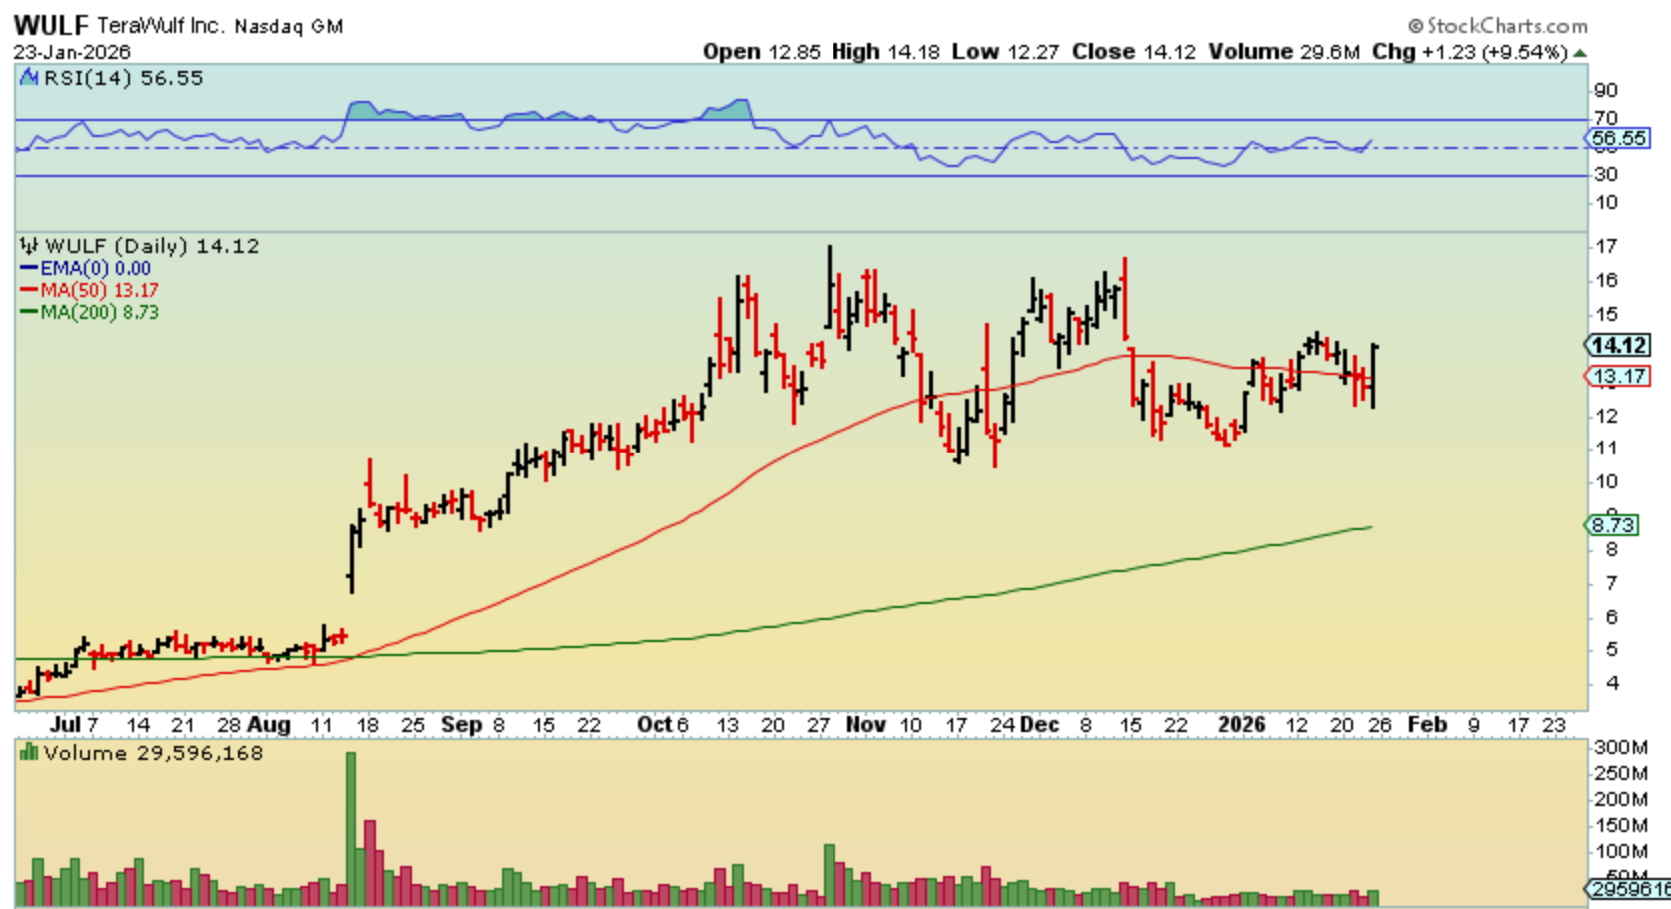
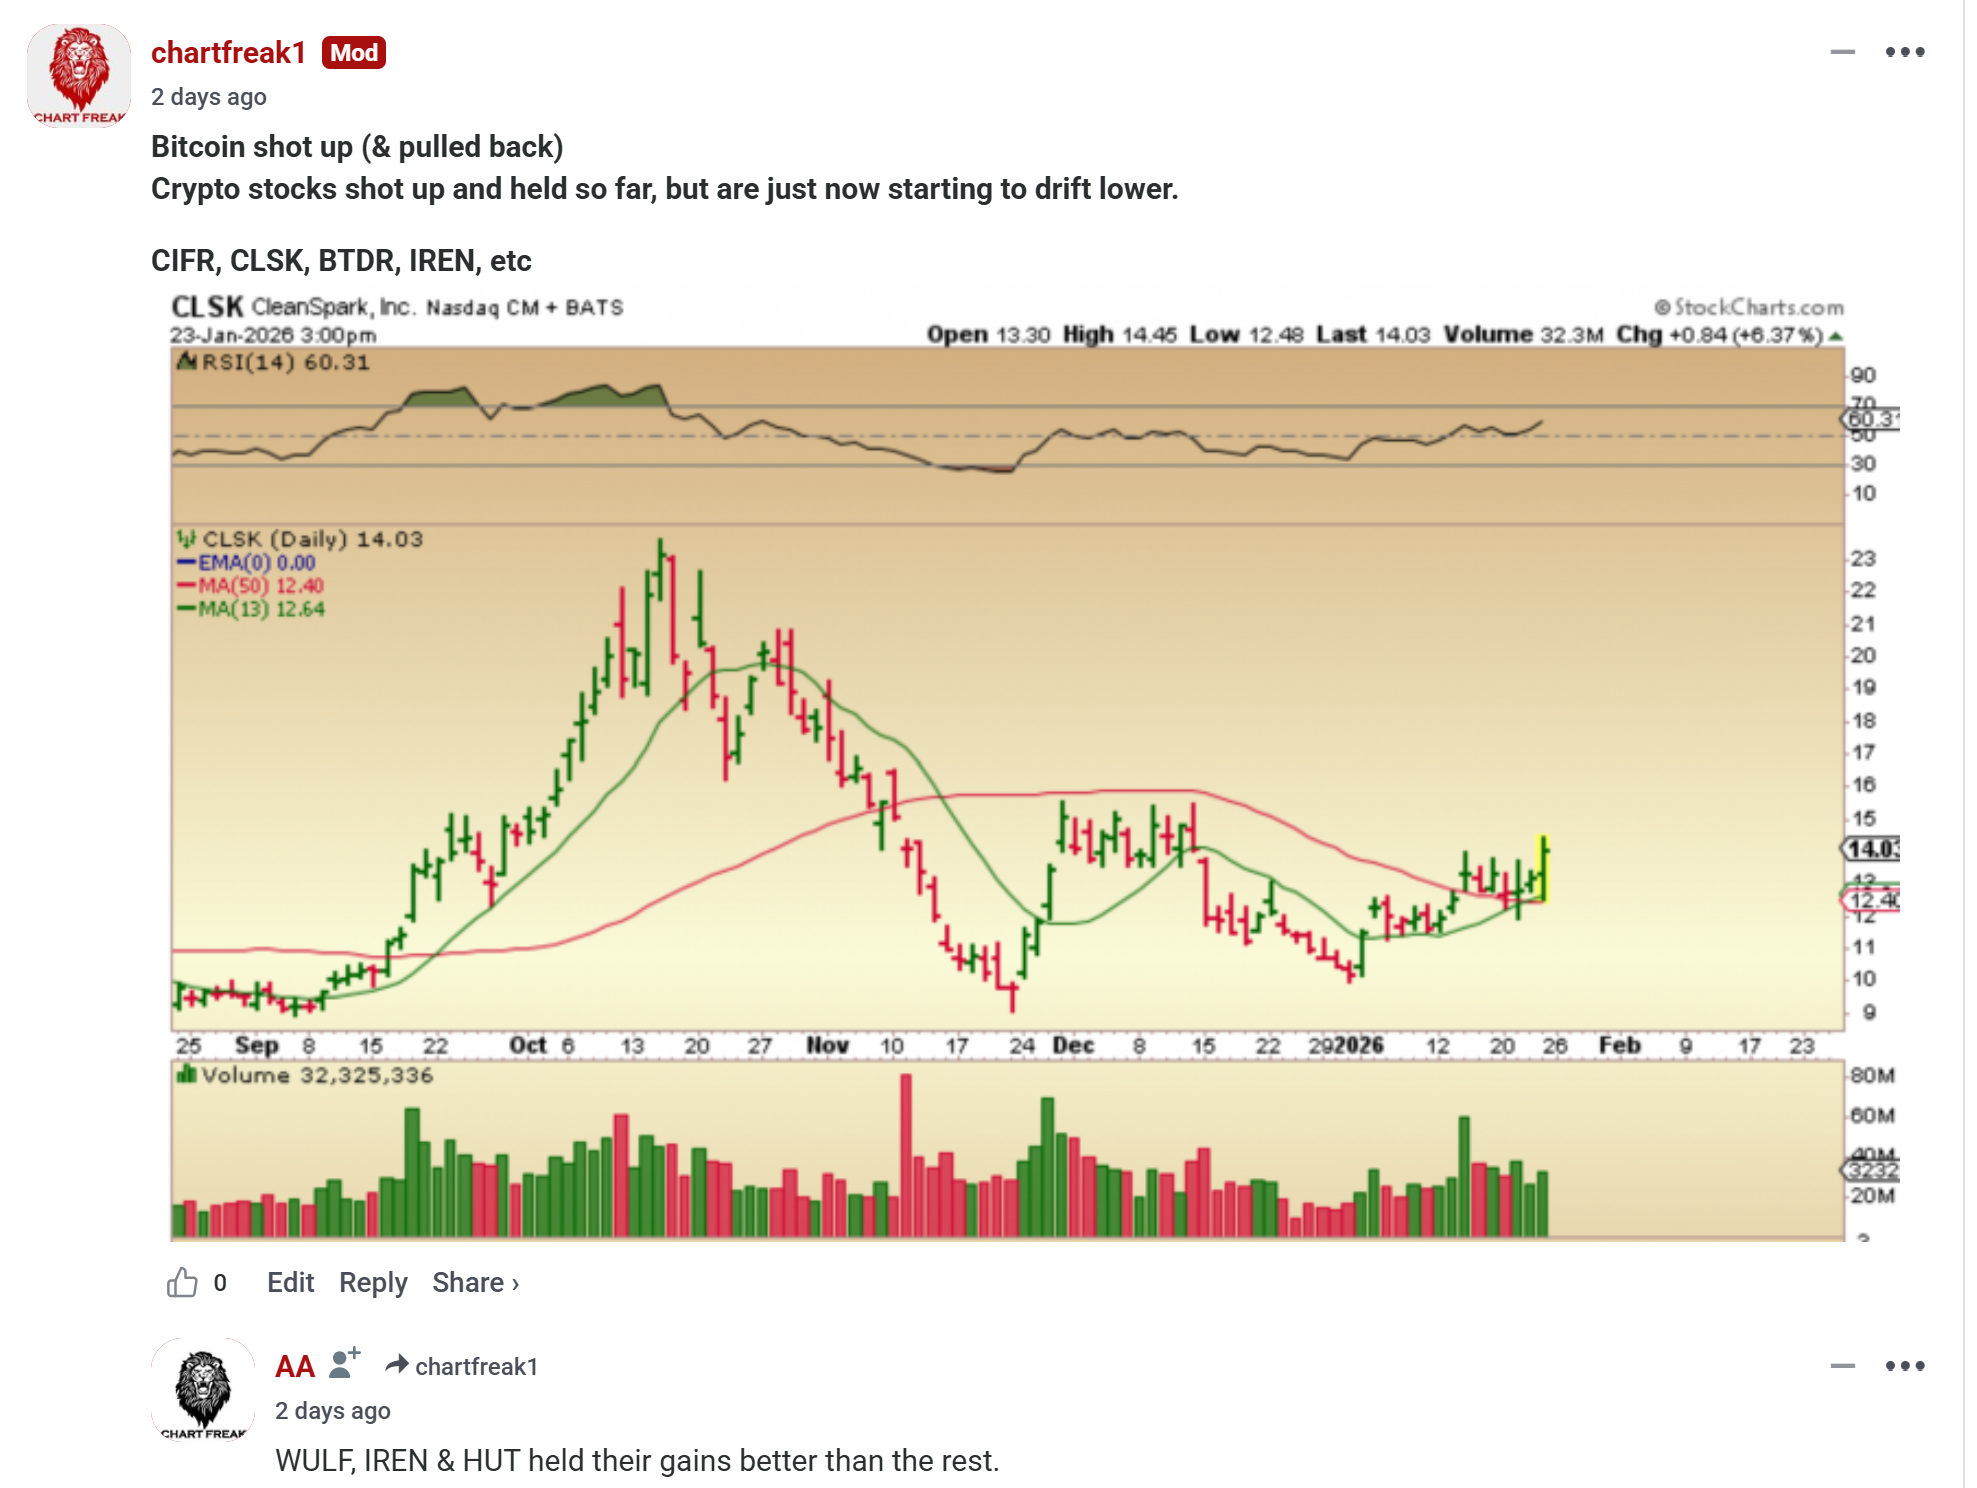
BITCOIN looked as though we had a dcl on day 61, but with a break of that low on Sunday, it is likely just an extension of that same daily cycle. Many Crypto stocks did well on Friday. See CLSK, IREN, WULF, HUT, etc. If bitcoin sells of next week, they’ll suffer.
.
IREN has actually been climbing as Bitcoin chopped sideways. It was up 8% on Friday.
.
WULF regained the 50sma and was up almost 10%
From Fridays comments with the reply from ‘AA’.
Friday January 23rd – Bulls! 
 Tuesday January 27th
Scroll to top