I am leaving at 8:30 am today and will be away for the day. Yesterdays 8:30 am Data was received bullishly by the markets, since inflation came in lighter than expected, HOWEVER, some analysts questioned the data as ‘inaccurate’ as the day went on, and the markets were rather choppy all day long. Today we have ‘existing home sales’ data at 10 a.m., but I don’t really think that this will be a market mover.
.
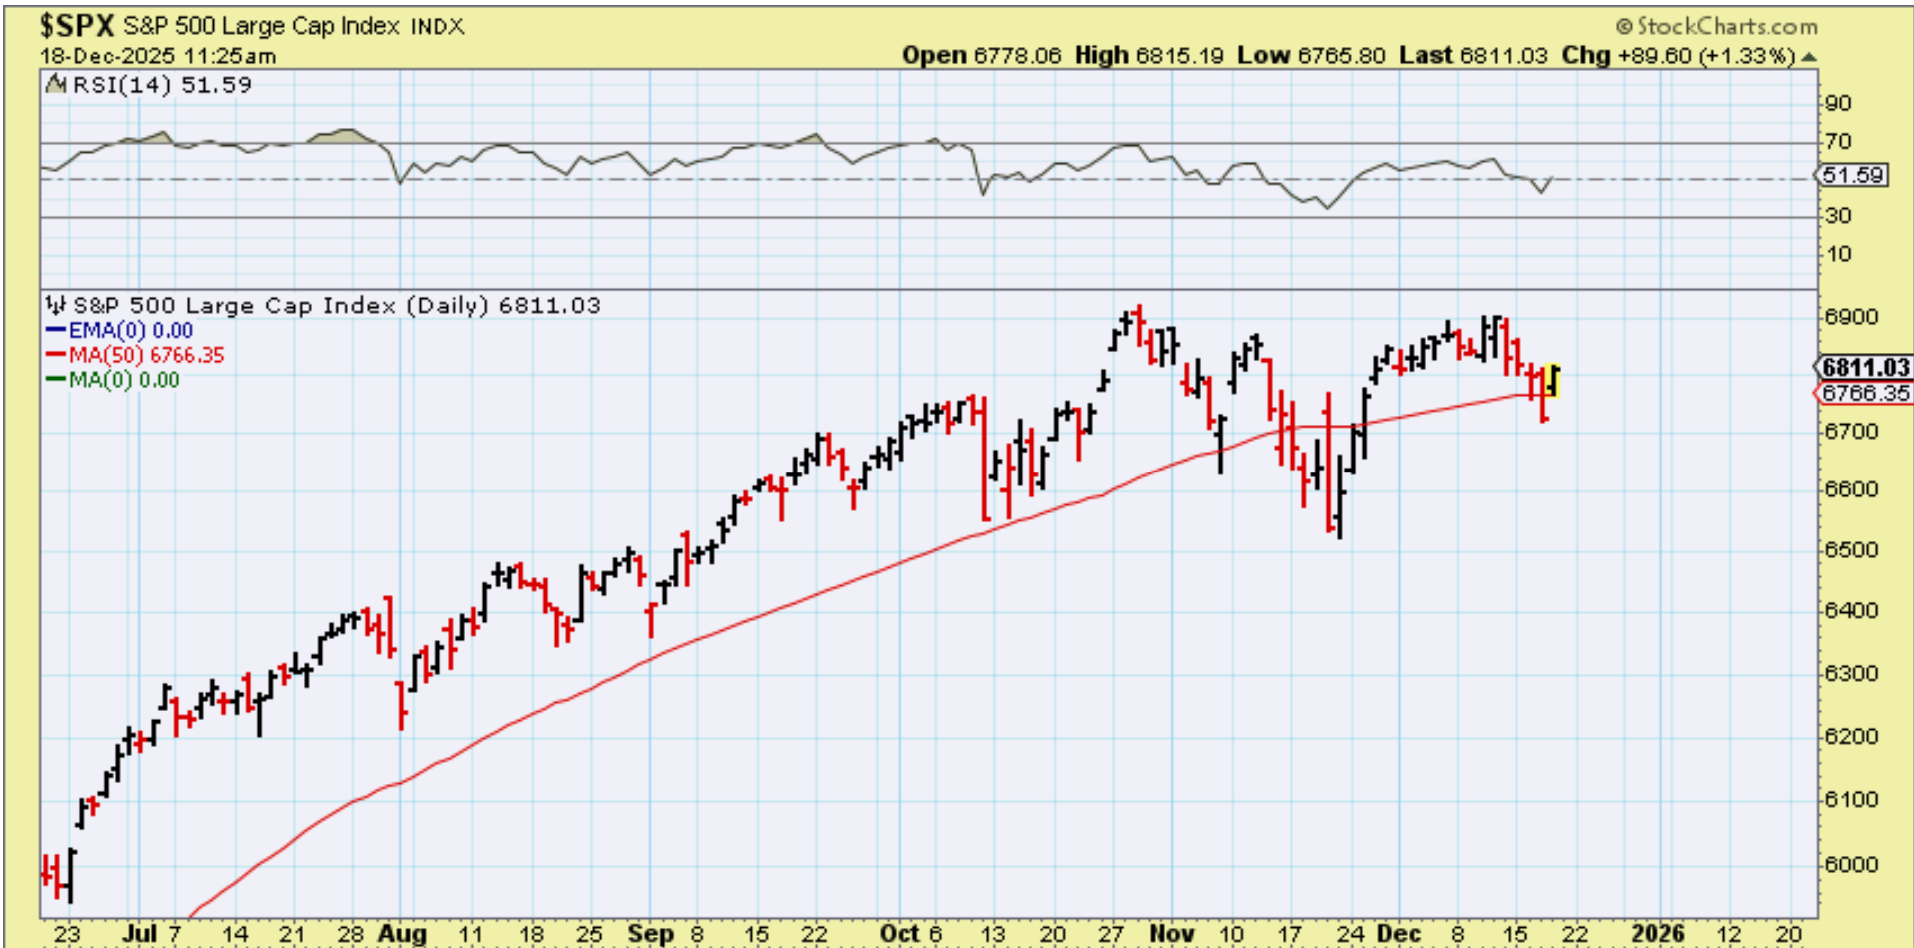
In the first 2 hours of trading THE SPX gapped back up and over the 50sma and ran higher by almost 100 points. So on this chart that I captured at 11:30 am, it looked like a shake out at the 50sma, however…
.
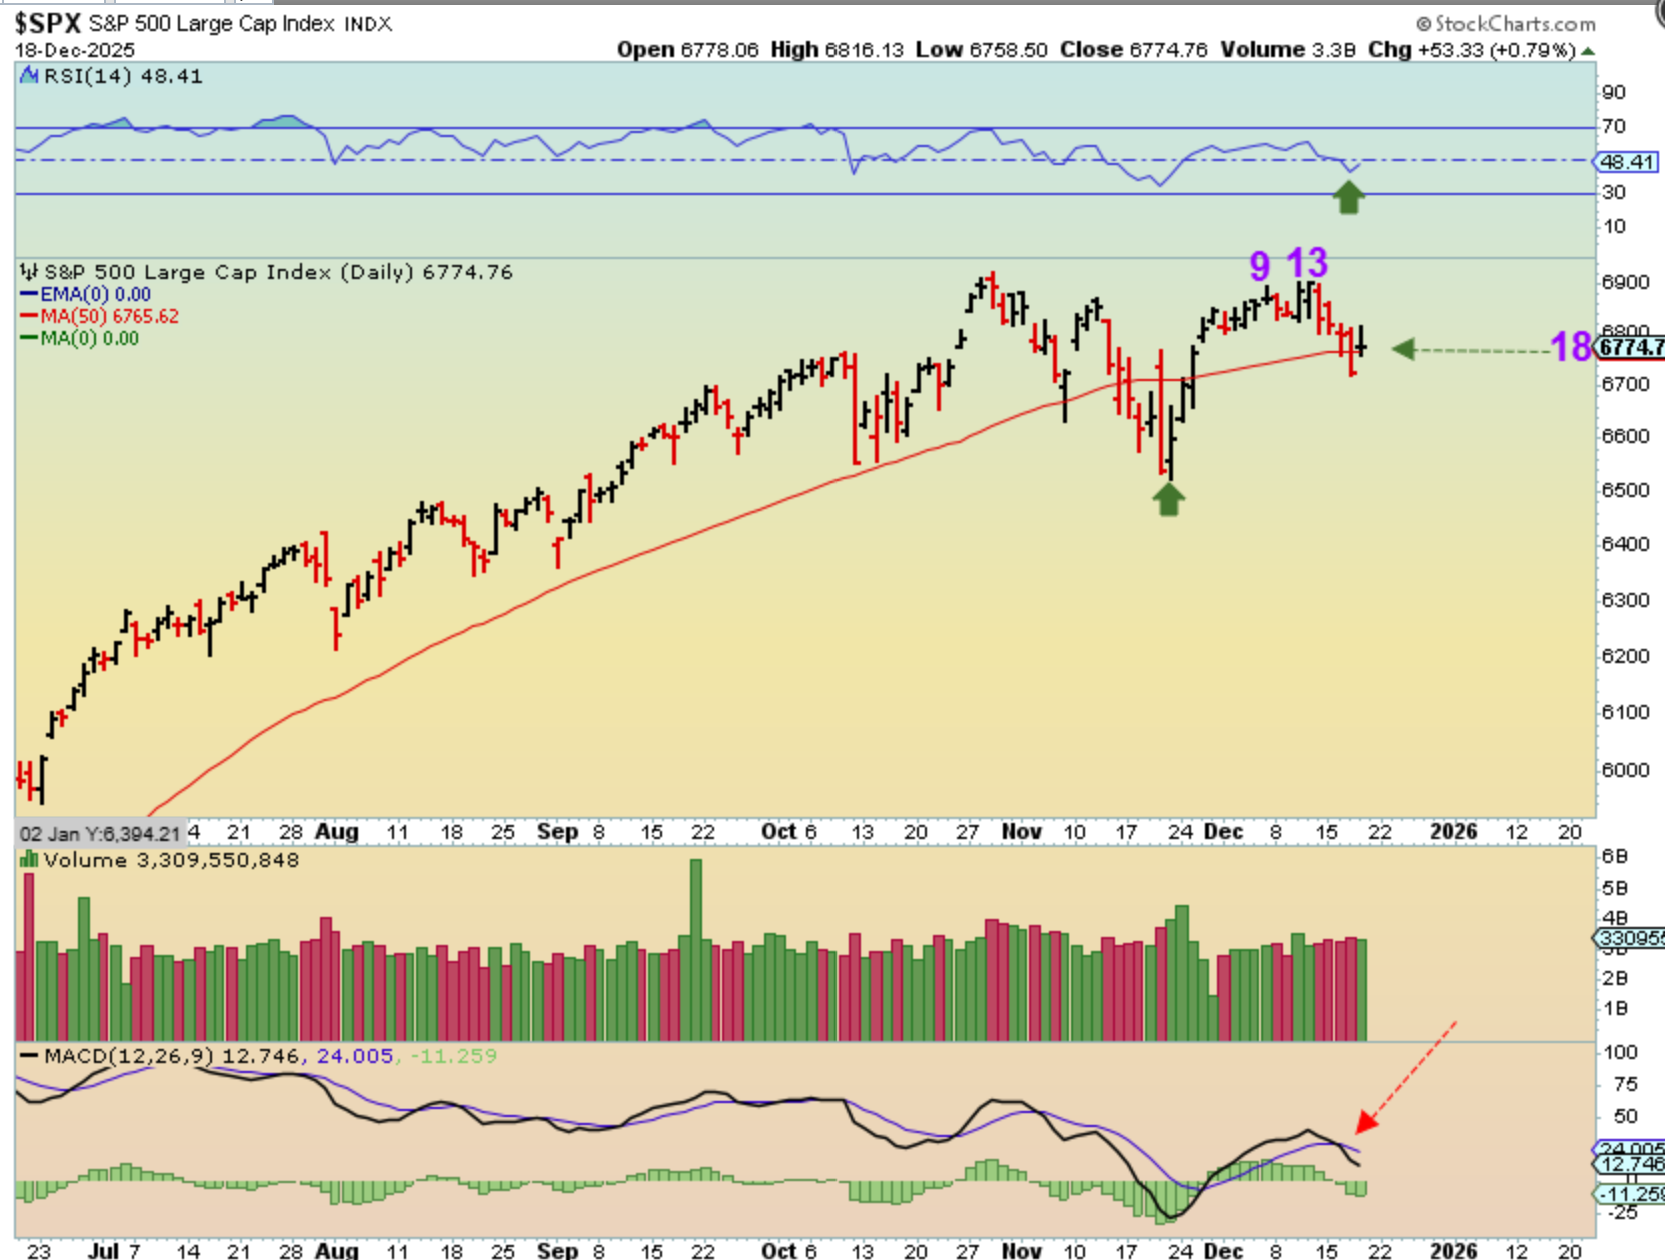
We saw the markets sell off and get choppy as the day went on, but we did still see The SPX close up 53 points, and now I’d like to see it hold that 50sma into the close on Friday. It is still ‘o.k.’ if it doesn’t hold the 50, but much better if it does. At day 18, we may be seeing a half cycle low.
.
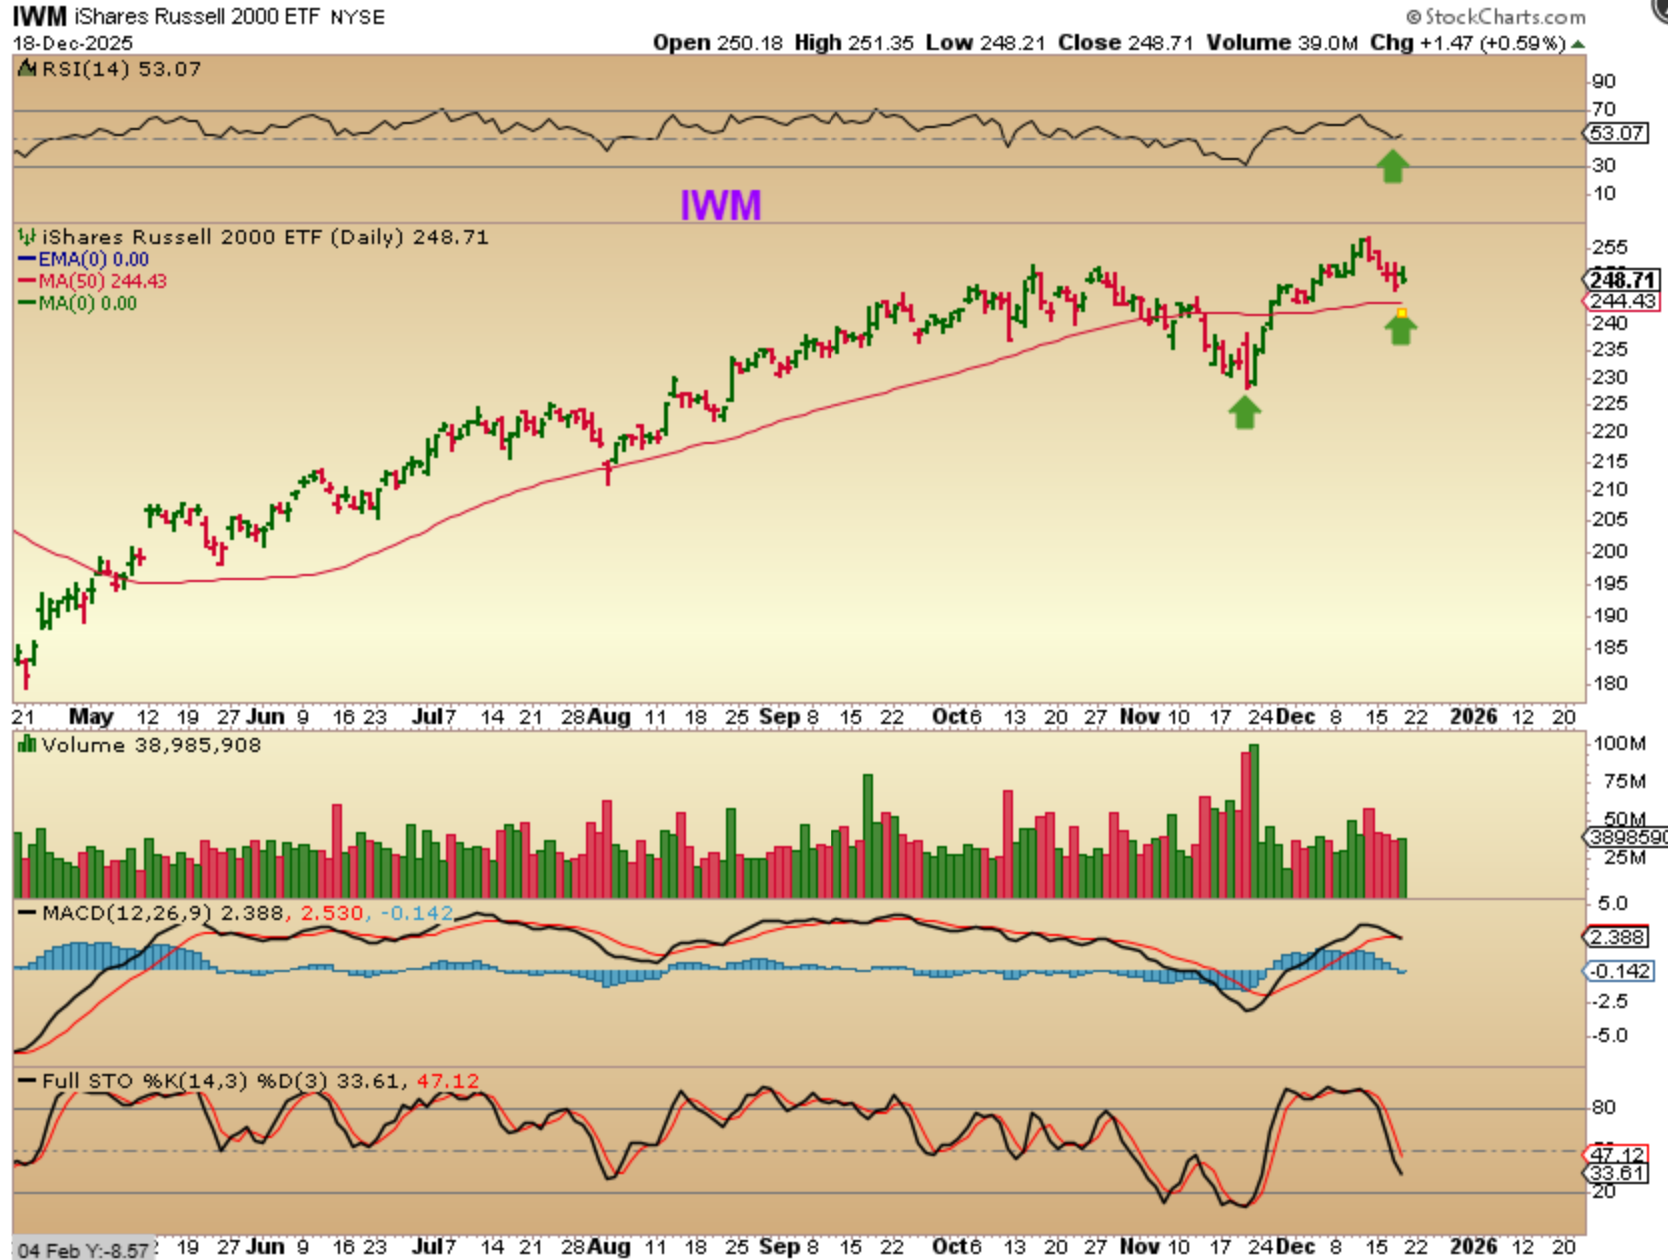
I wanted to pint out The IWM:
The SPX & NADAQ lost their 50sma, but notice that the IWM looks much more bullish, so keep that in mind as we move forward. I showed yesterday that some companies like NFLX & NVDA seem to be weak, but others appear strong. Apparently the Small Caps seem to be rather strong on this pullback.
.
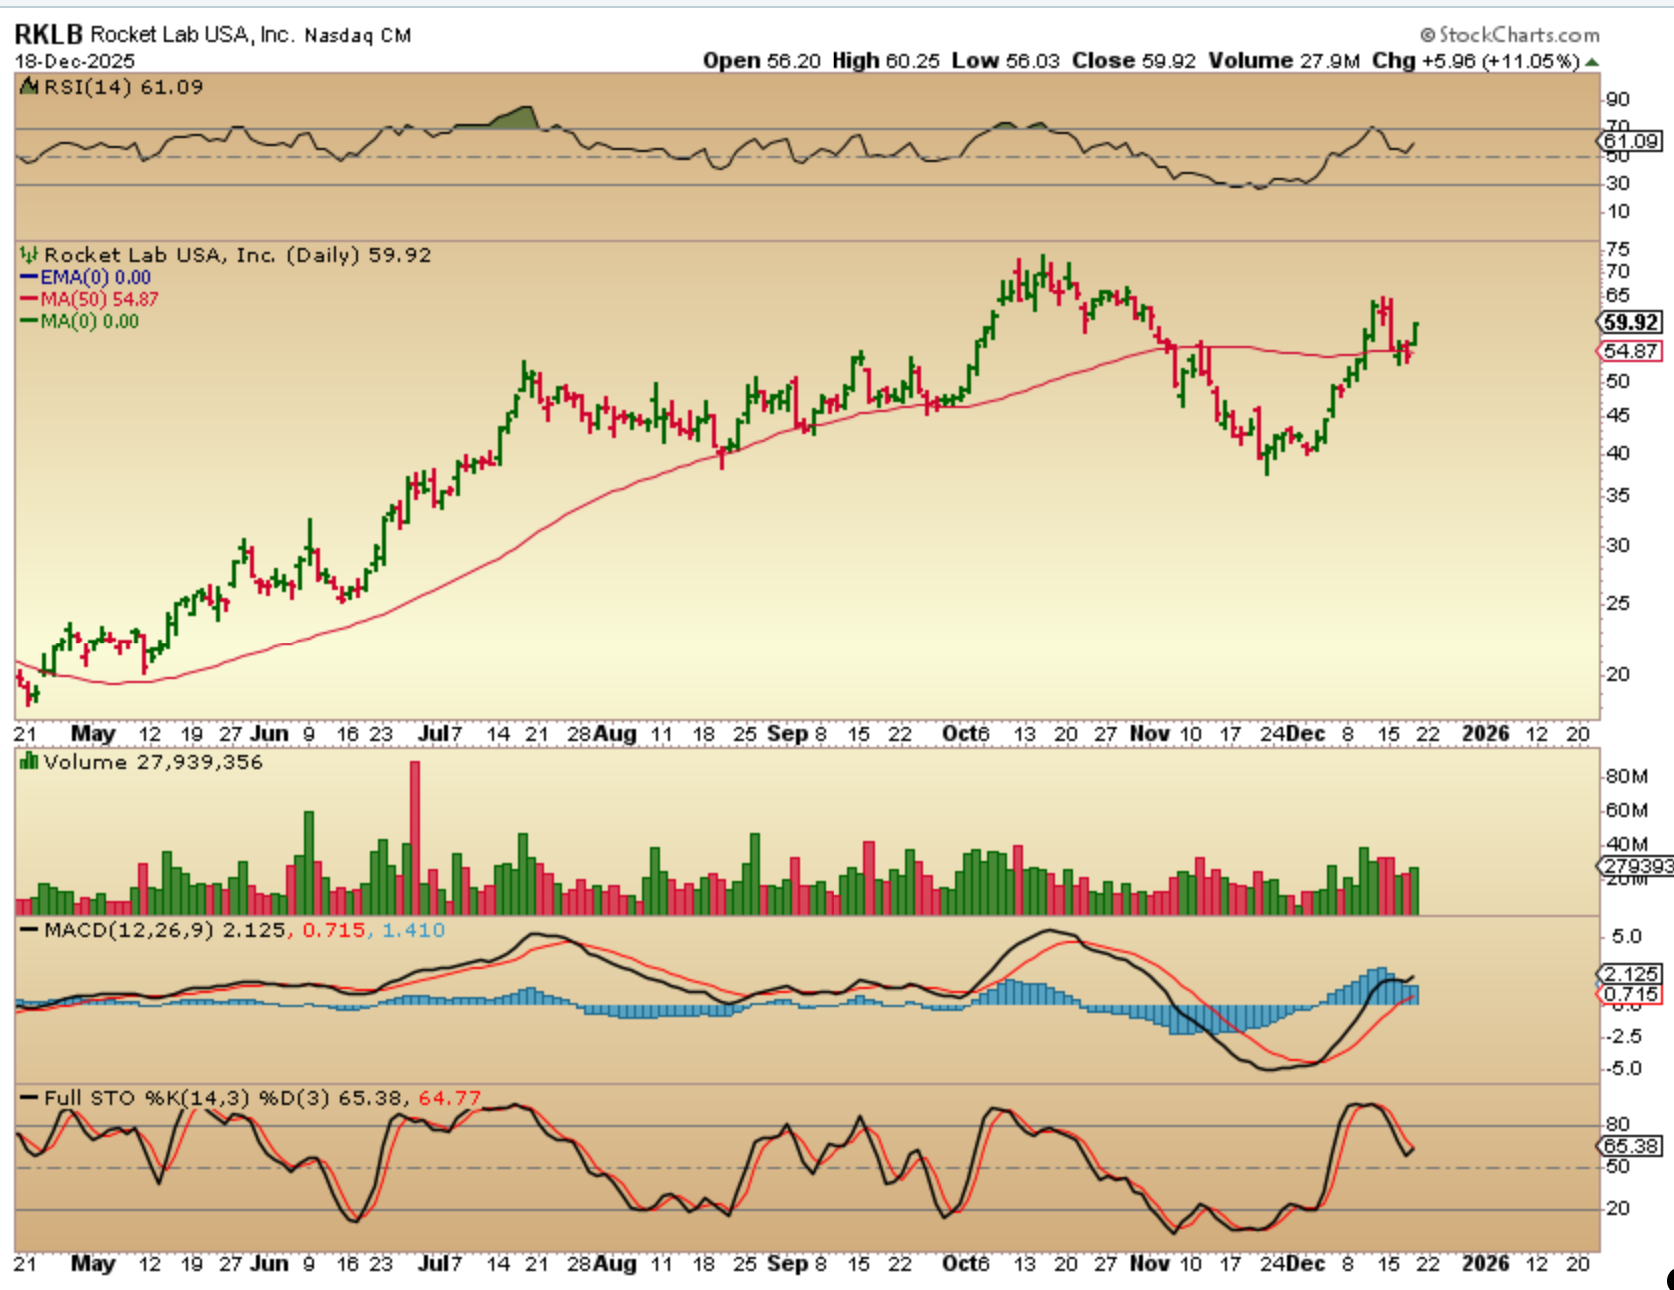
I also pointed out that some of our favorites may outperform, and I showed RKLB as having moved up almost 80% out of the recent low. Well, it was up 11% Thursday and is back above the 50sma cleanly. There are others too.
.
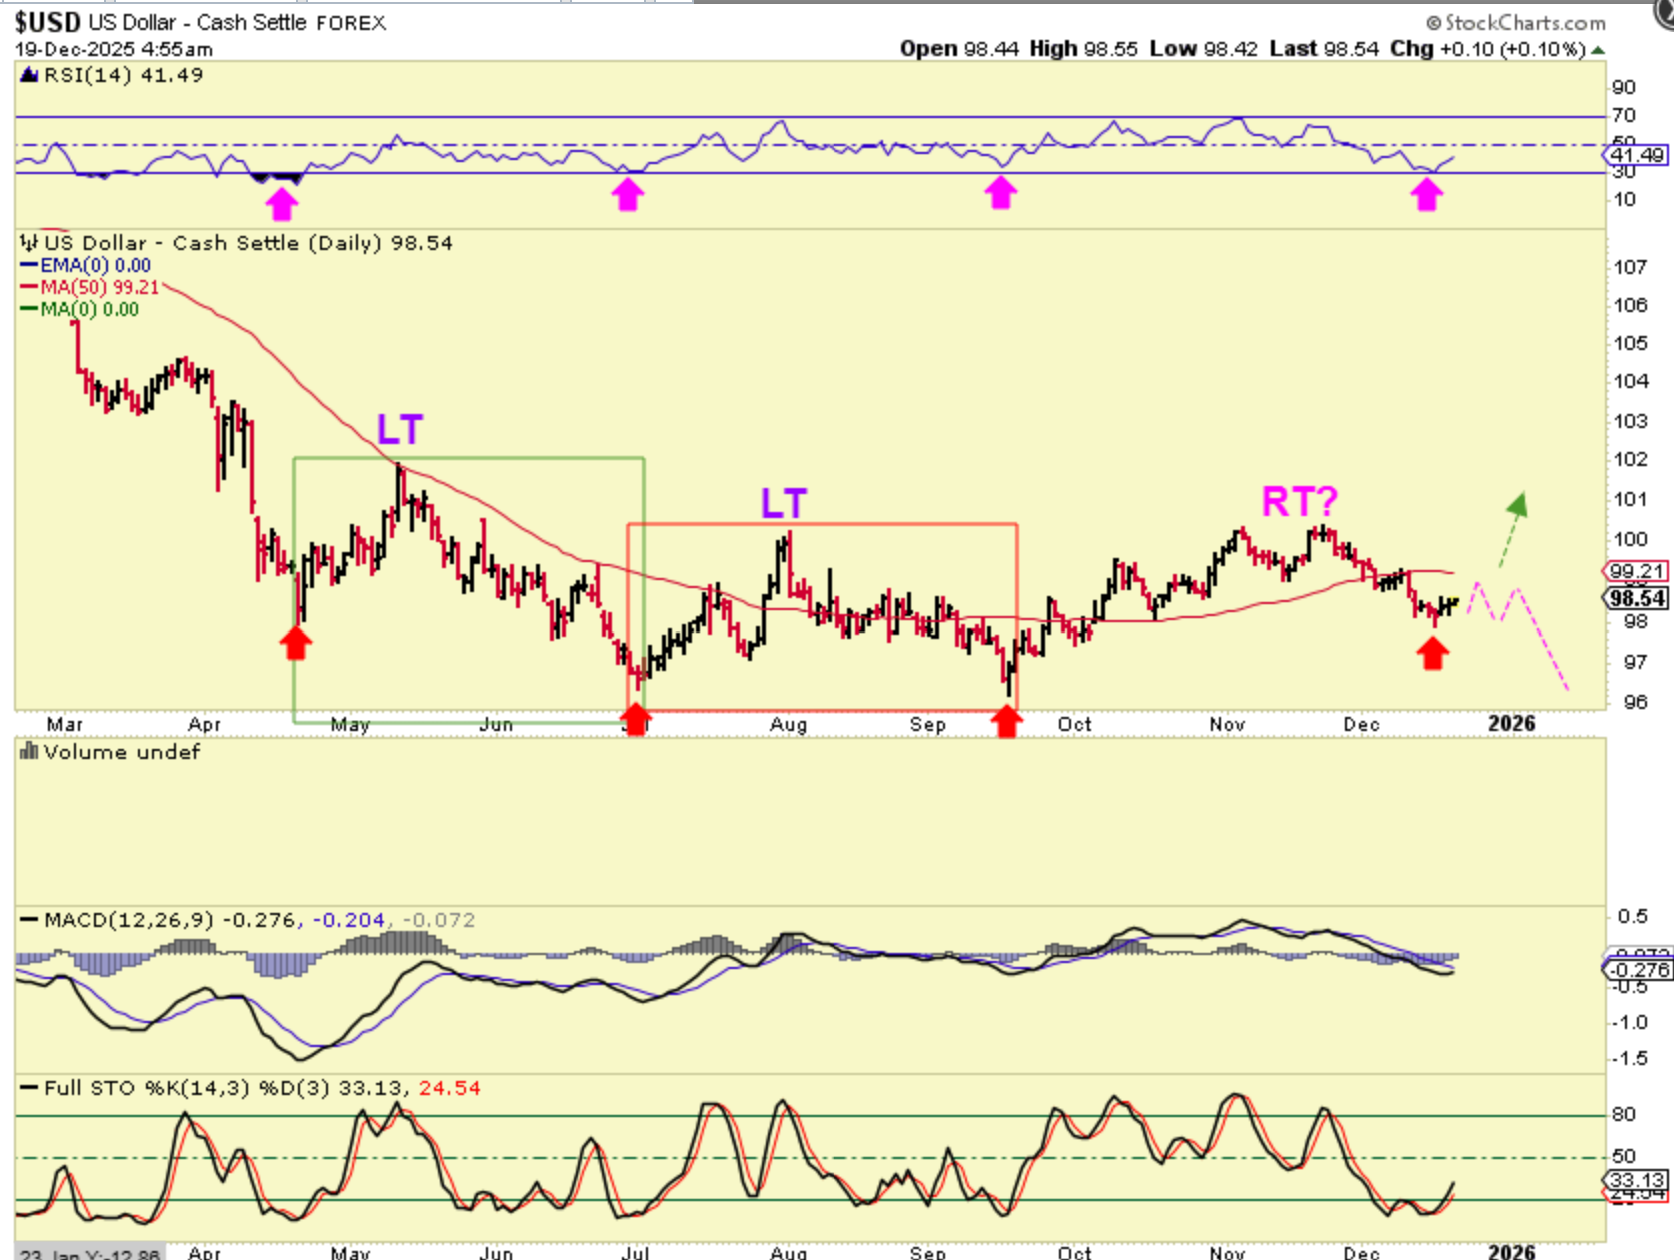
THE USD is putting in a bounce, and the timing seems right for a dcl. Now we’ll see if it drops again and continues as weak, or can it muster up some strength. You can see that the RSI ARROWS line up with the deeper lasting lows, so this might be a low that gets a good bounce, as seen with the green arrow. I tried…
.
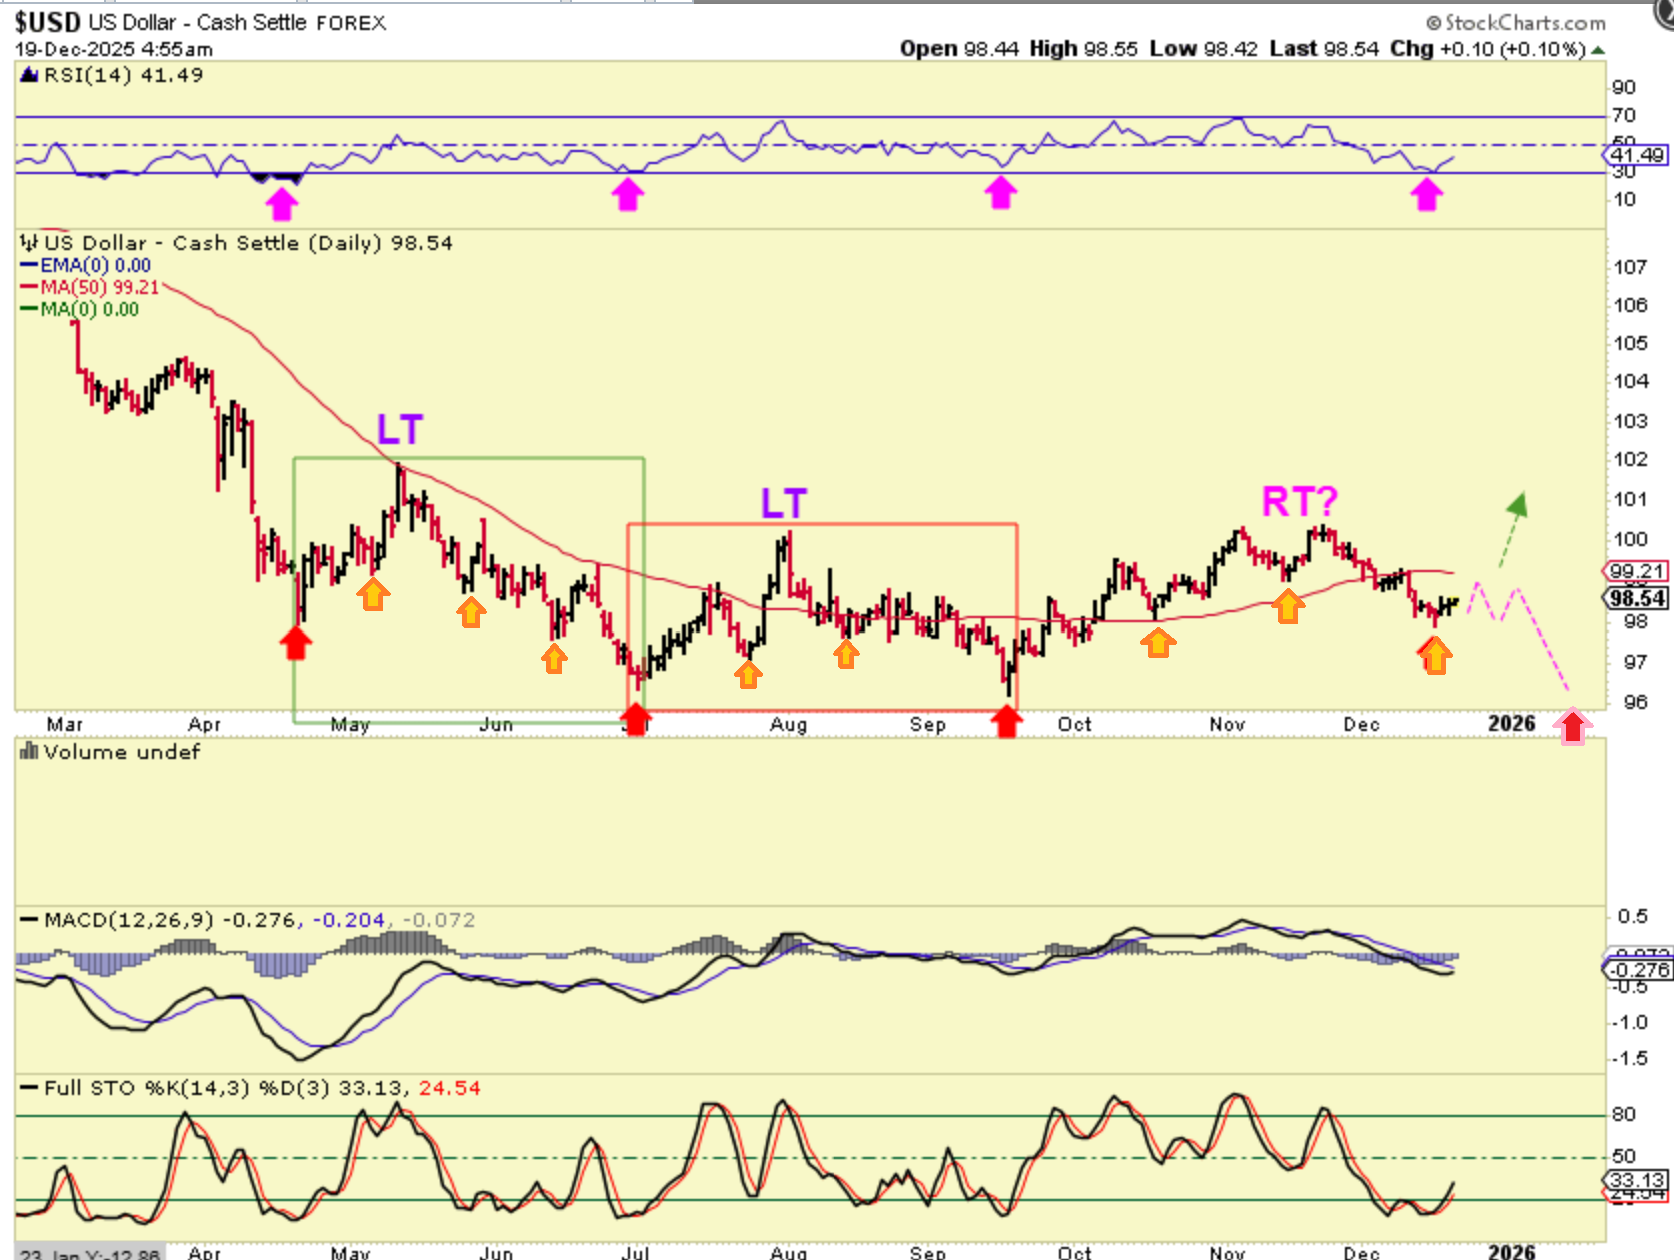
THE USD: I tried to mark dcls roughly here with orange arrows, but it was so choppy that some are hard to see. Some were short, others look to be long. That being said, we do look ready for a dcl right here, so we’ll see how this bounce plays out.
.
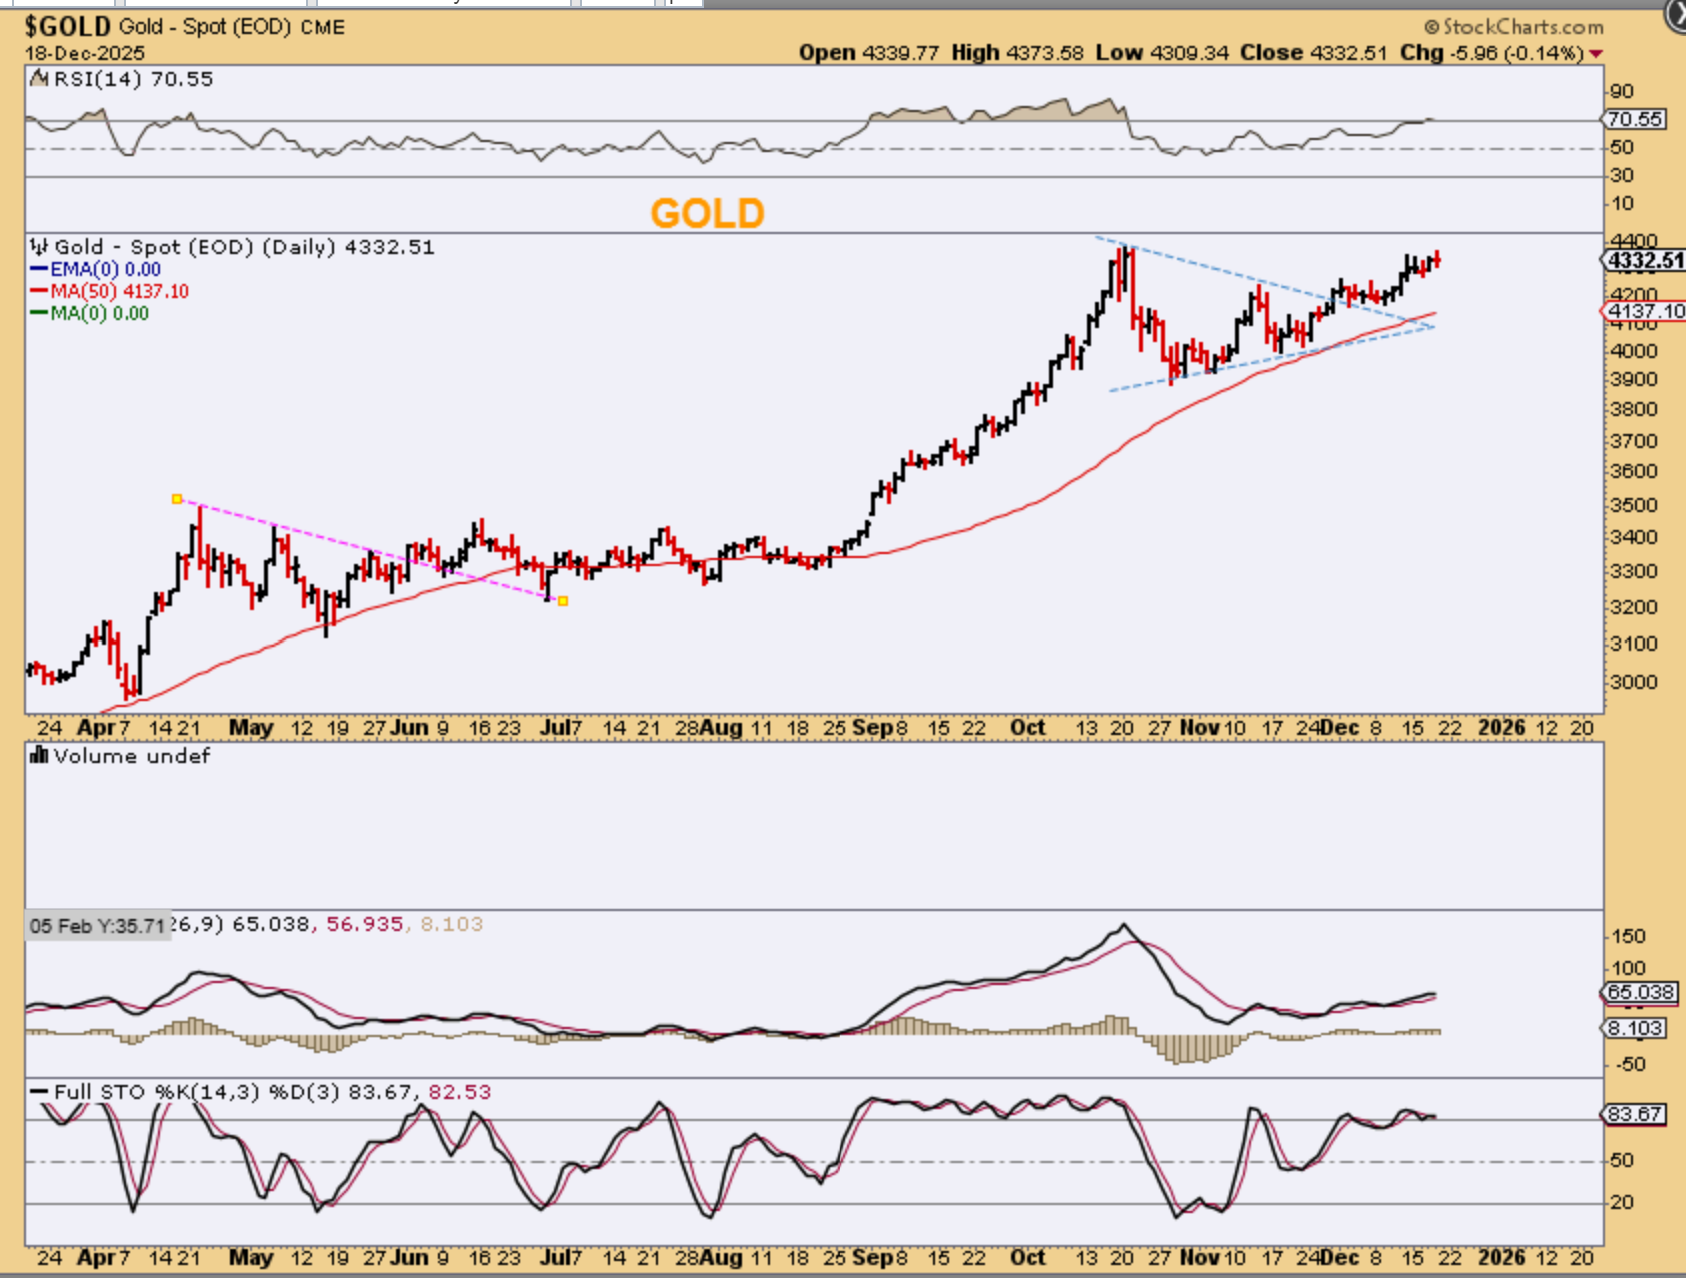
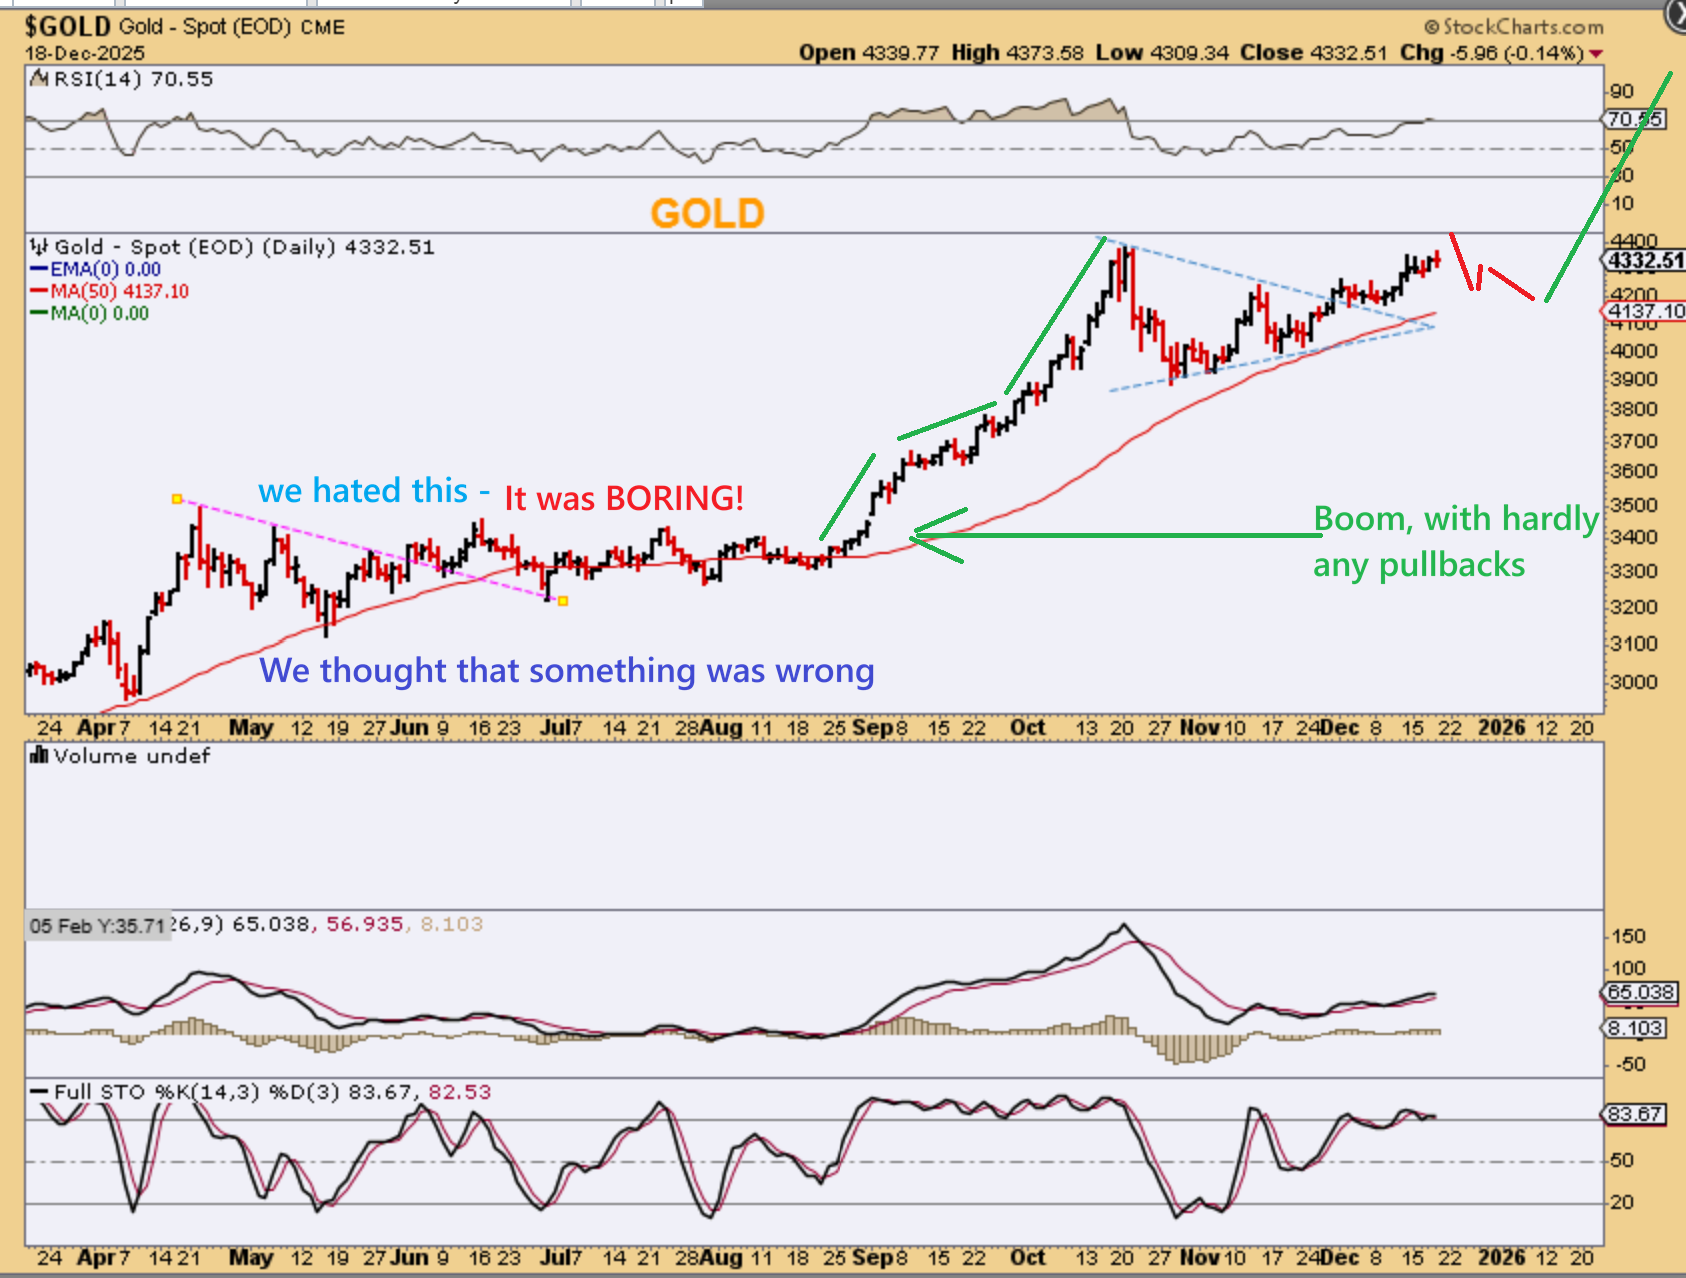
GOLD gave us a doji of indecision by the close.
The initial reaction of the CPI data was a rally in Gold and Silver and Miners (likely hinting that ‘low inflation numbers’ could lead to a January rate cut and then a March cut too). Then, as mentioned, some analysts started to question the inflation numbers, some feeling that they were inaccurate -and everything turned choppy again.
.
Consolidations can put you to sleep. Do you remember that sideways chop this year? It lasted for months, and we thought that Gold was just going to be lame. THEN IT TOOK OFF when we least expected it, so we want to keep that in mind. Silver still looks bullish.
.
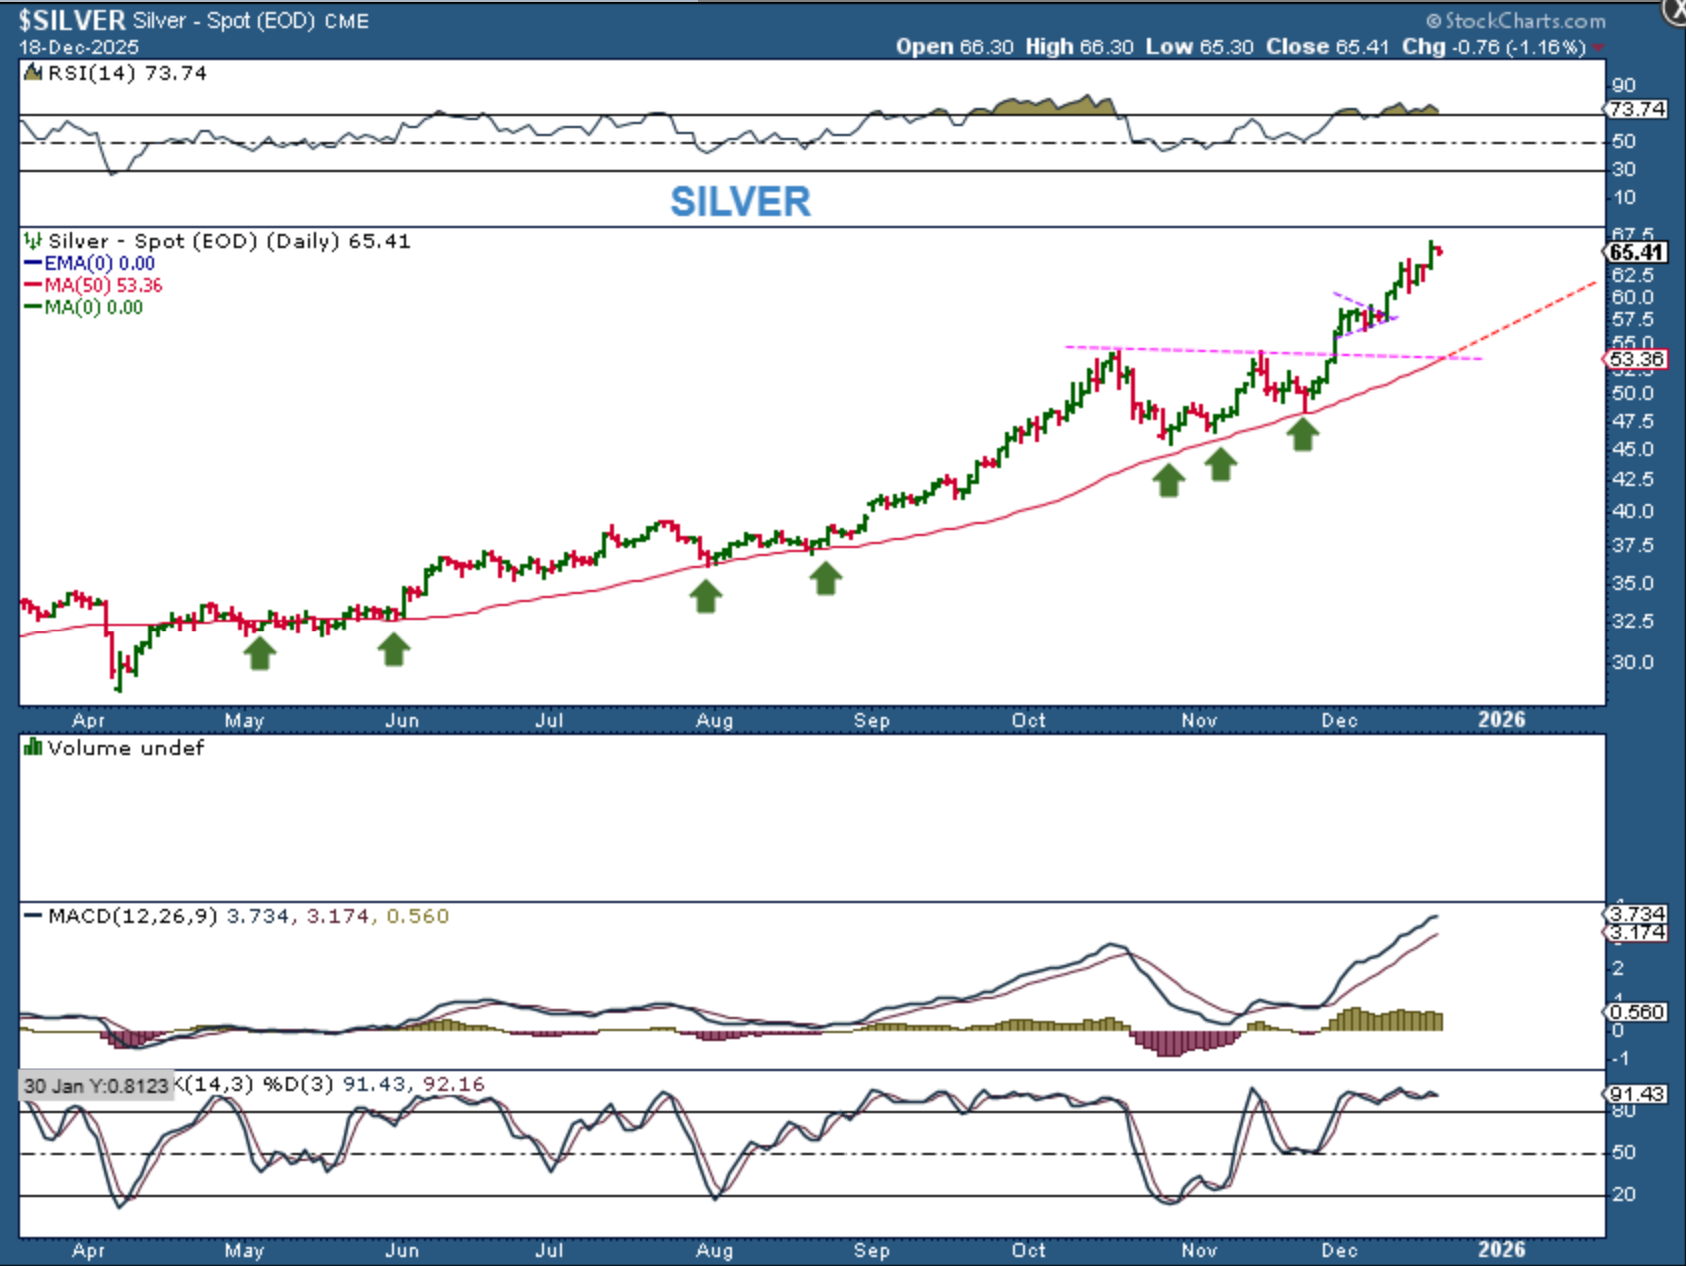
SILVER continues to run higher, but the Silver Miners continue to chop around.
.
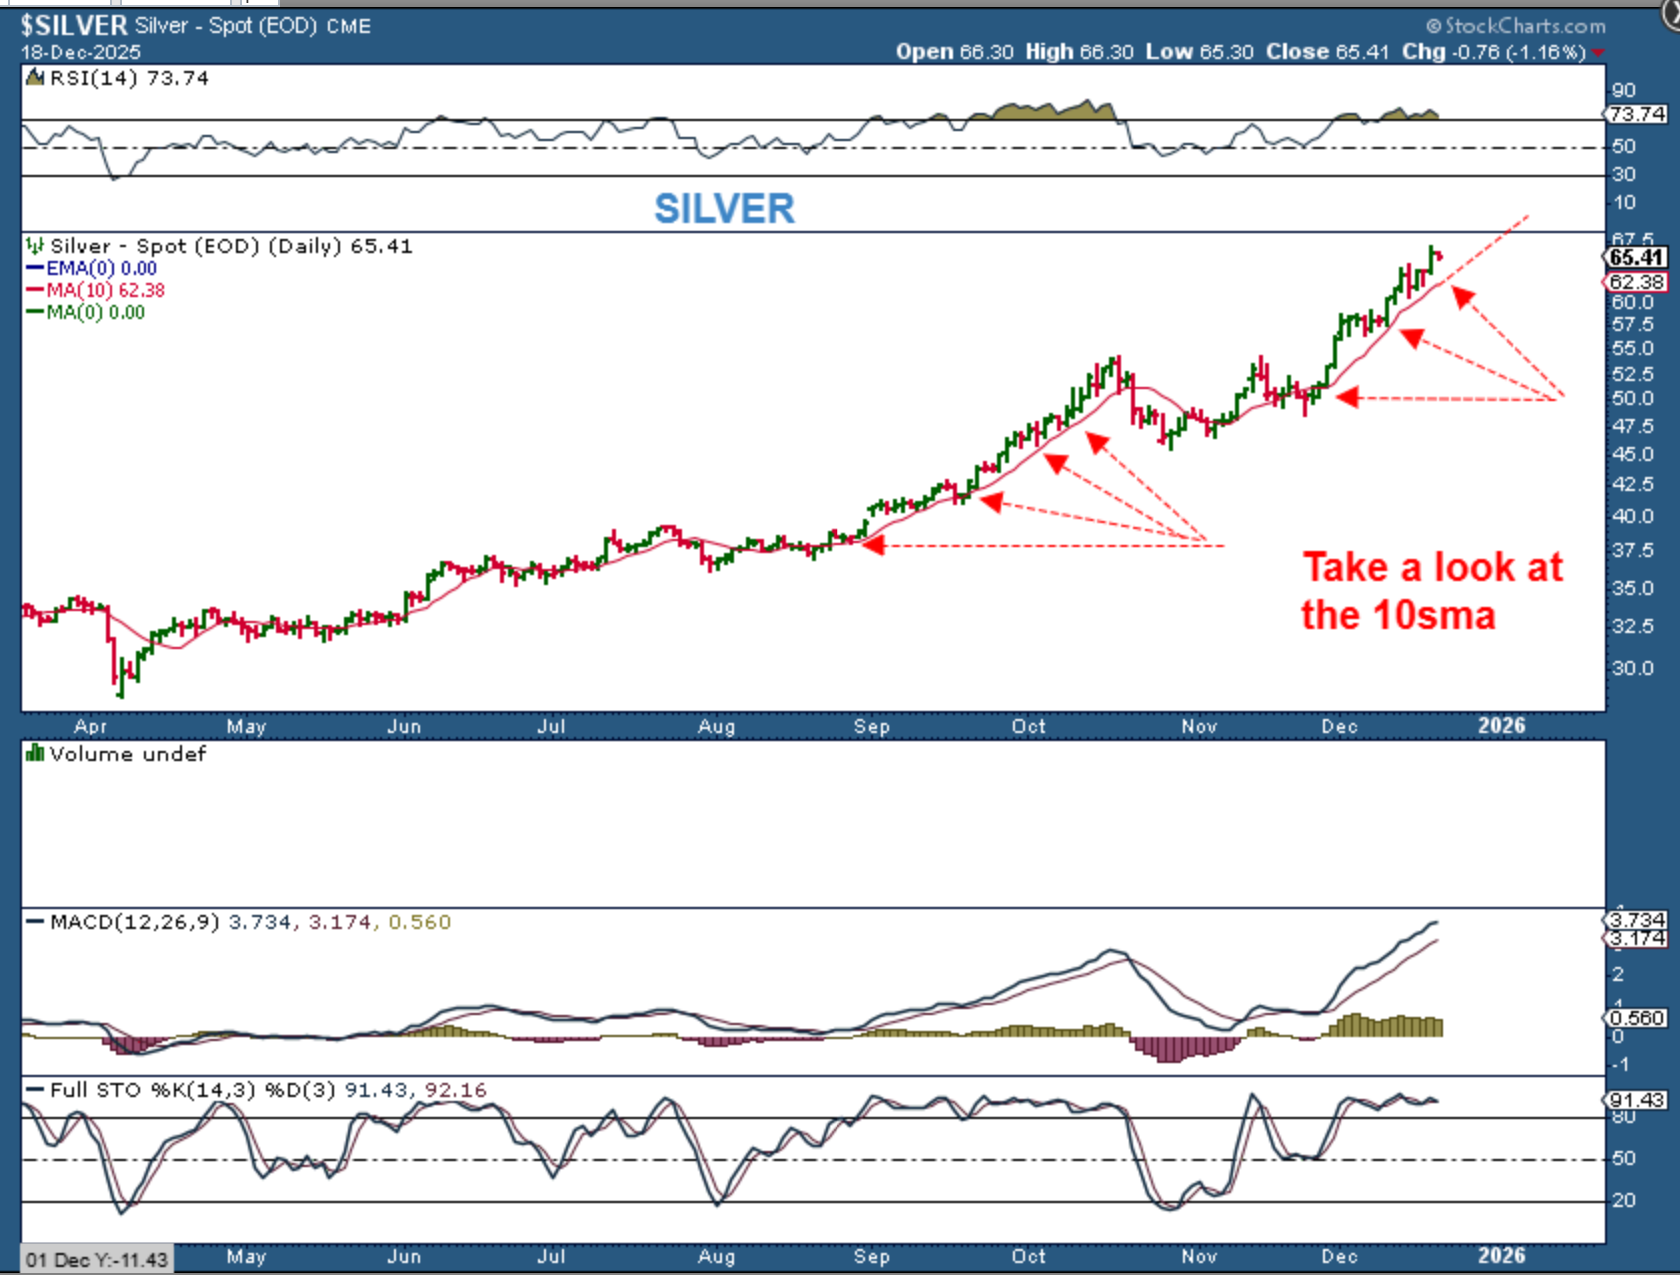
SILVER rode that 10 sma very tightly on the August to October rally, and that is a bullish run. It looks to be doing that again.
.
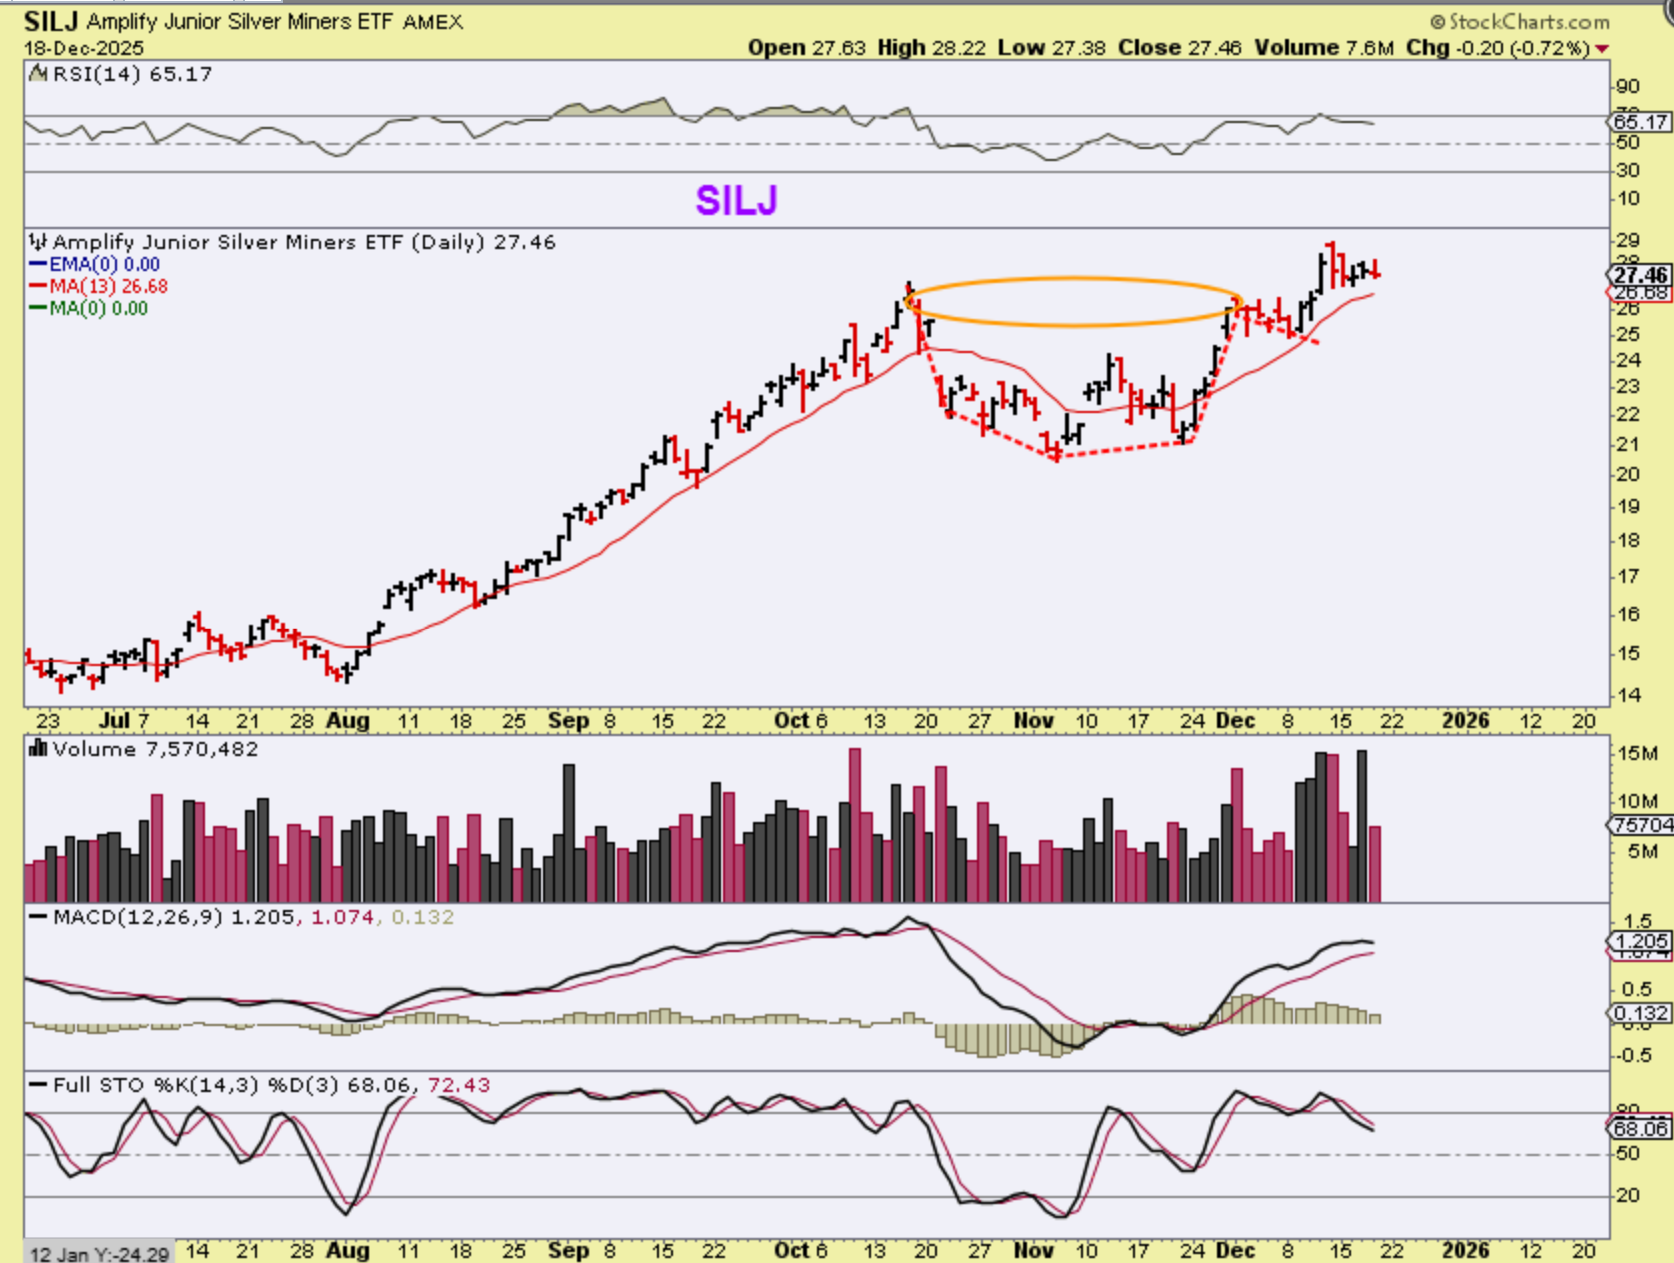
SILJ is NOT a bad chart, it remains bullish, but it is NOT following the rally in Silver yet.
The rally out of the August lows was exceptional, and it then formed a cup as a consolidation. Silver formed a cup too, but it sprinted higher, so hopefully Silver Miners will start to move steadily higher soon. It really is a bit puzzling, but $21 to $29 is a good run, it just isn’t continuing the way Silver did. One thing that we do know however, is that if Silver Miners wanted to play catch up, they could quickly sprint higher.
.
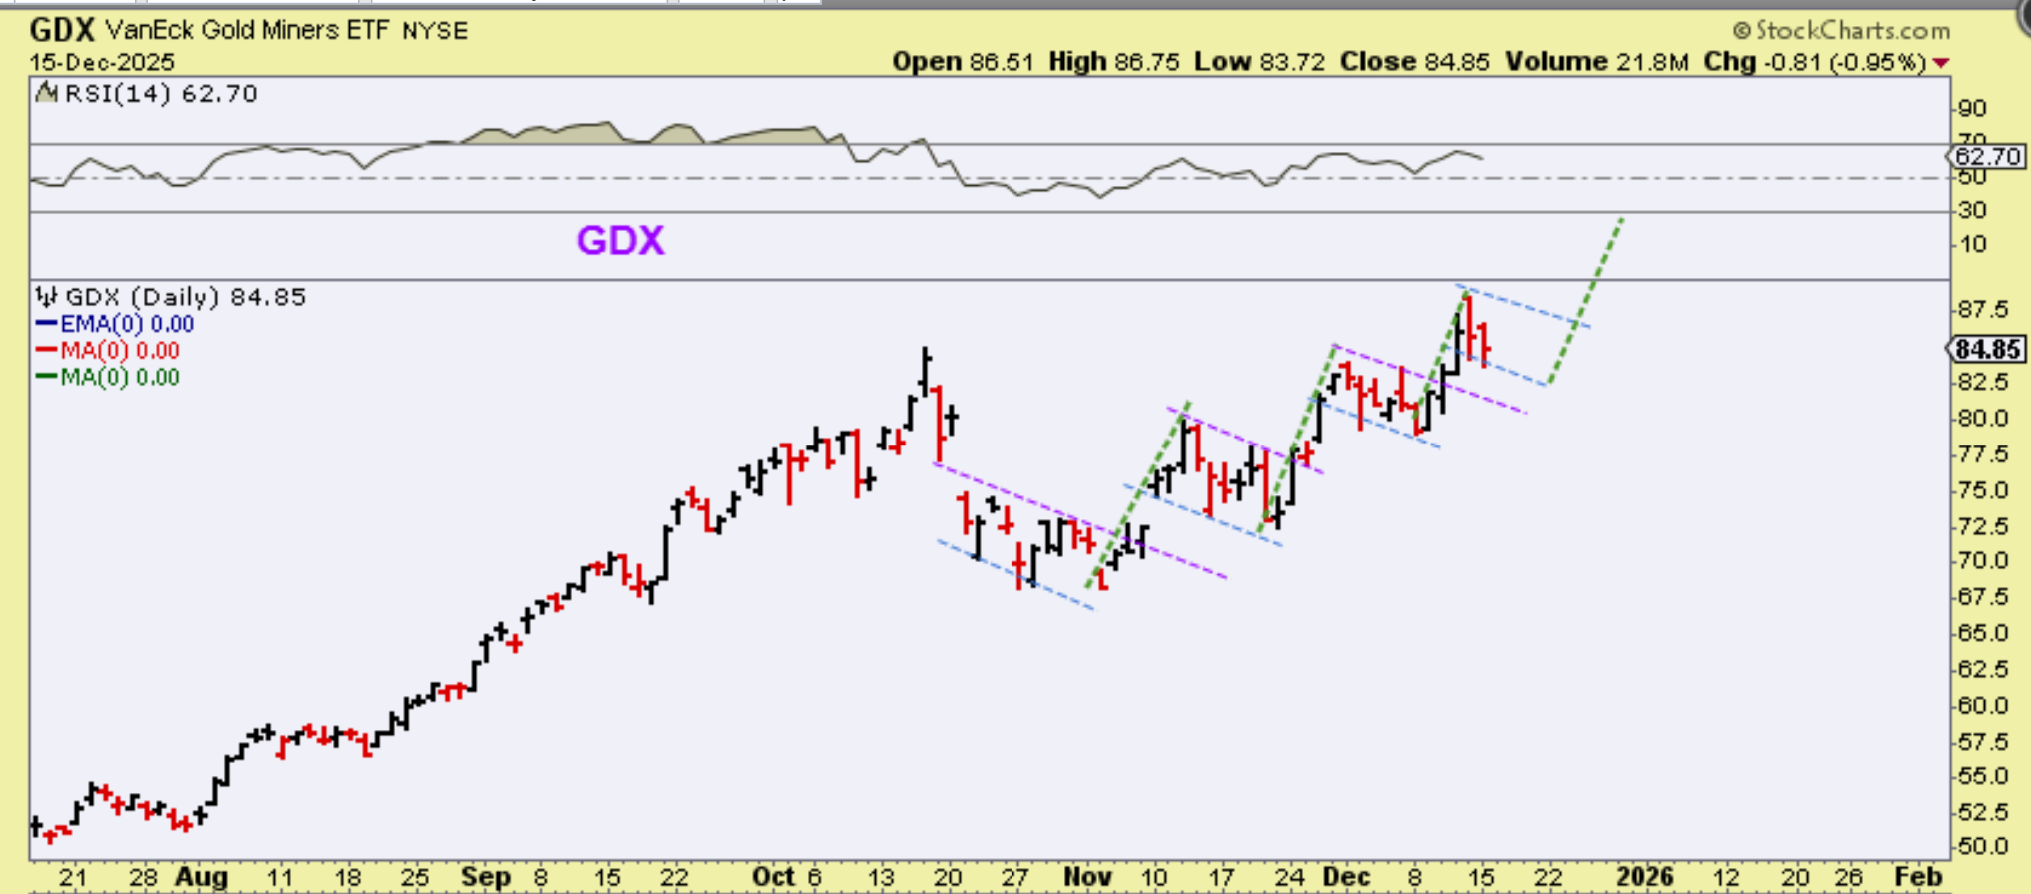
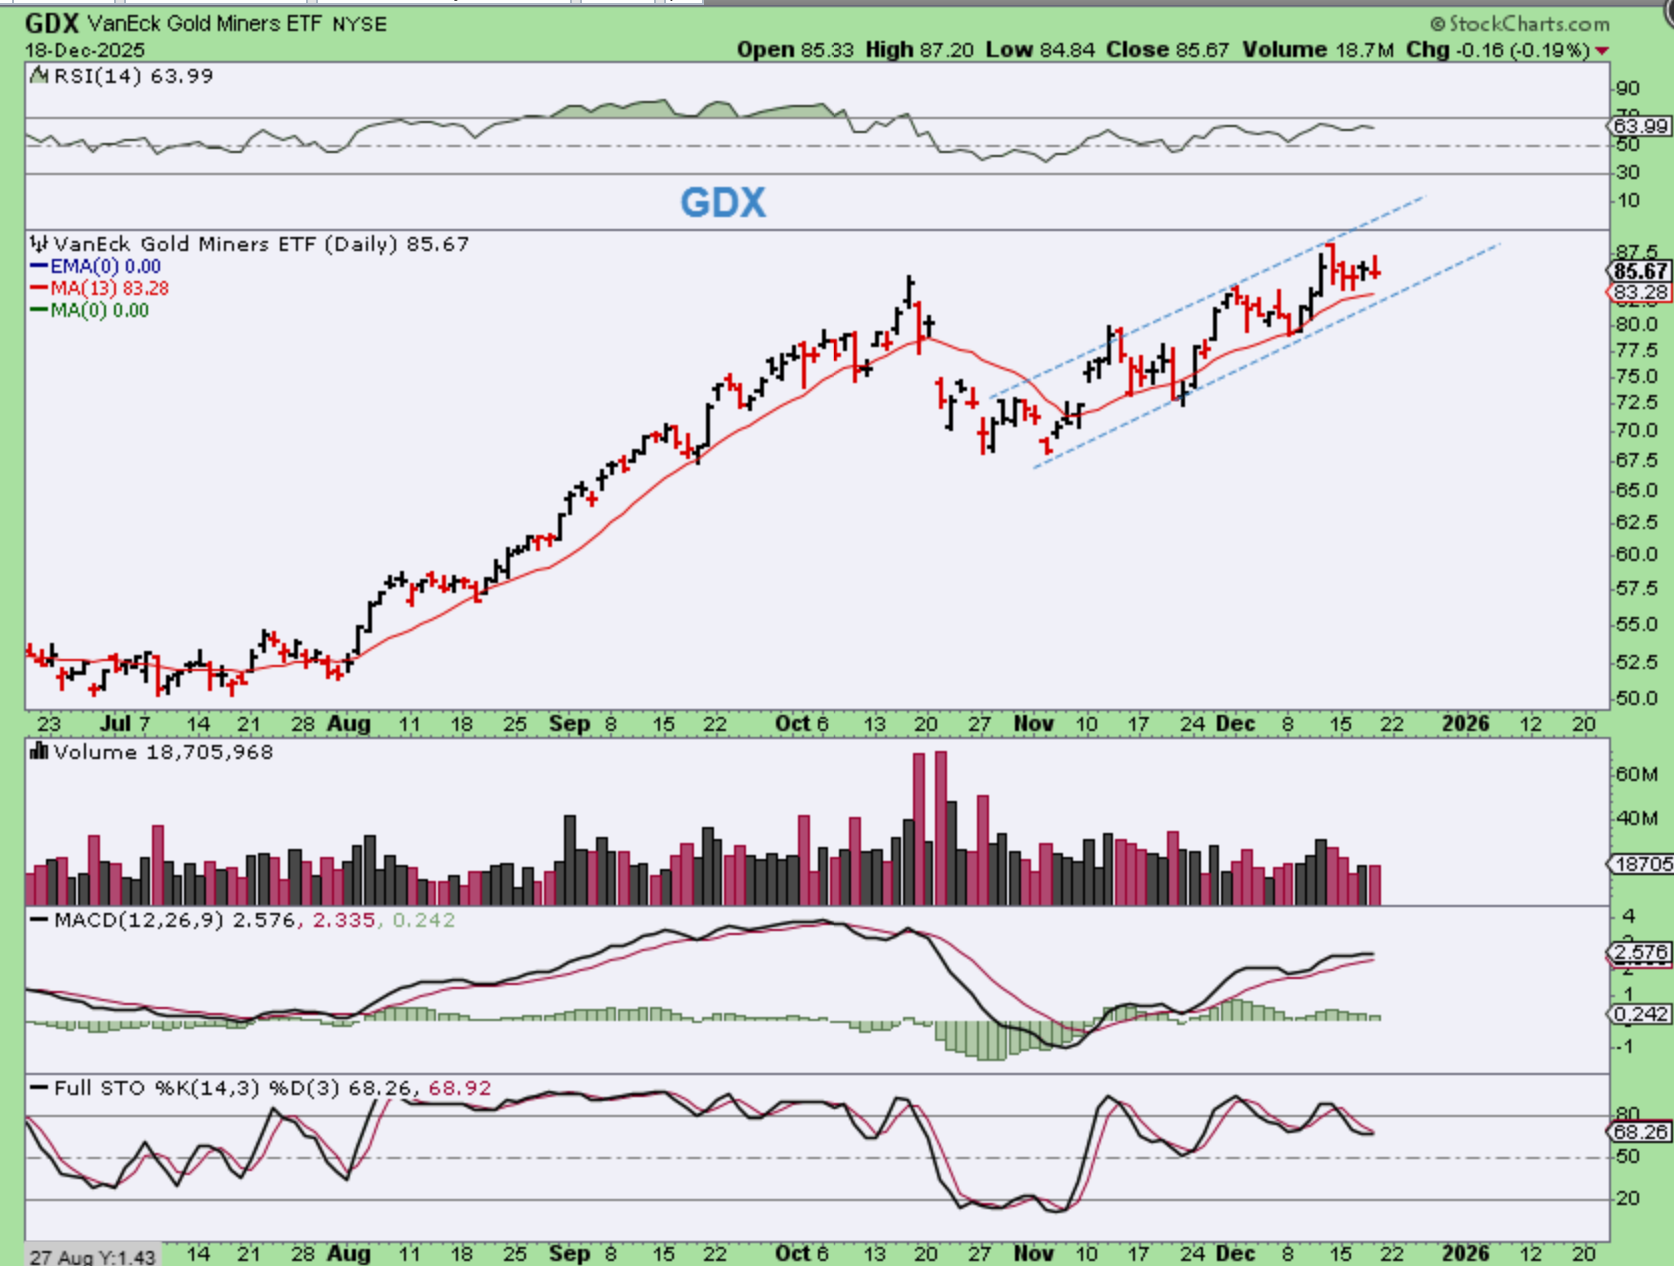
When I drew this chart of GDX on December 15, it would indicate that GDX could just churn sideways again, before running higher.
I said:
‘Another way to look at this could be that is runs straight up for several days (green line) and then consolidates sideways for over a week. I do see that repeatedly. Once it breaks to new highs, it could then rally in a stronger manner, like we saw on the left side July-October.’
.
GDX has churned sideways again, and it looks to be close to finishing up.
.
Well, it is Friday and at this point the general markets have rallied out of the dcl, pulled back into day 18 (possible half cycle low) and then recovered yesterday. I’d love to see the markets stay above that 50sma, but as seen in todays report, the IWM looks pretty good as is. The Precious Metals are obviously the bull market that we hoped for, and Silver has the explosive rally that we hoped for, but the Miners? We had a good rally that then formed a cup consolidation, but that is where we currently are with GDX, GDXJ, SILJ, and even individual miners. When you look at the charts , Buy and Hold out of that dcl is still nicely profitable, but Silver blasting off and Silver miners taking a break is ‘uncomfortable’. We’ll just have to wait and see if those Silver stocks can catch fire and run soon. We may be seeing a dcl in Miners. Bitcoin is lagging, I’ll discuss it below. Enjoy your Friday trading!
.
Note: My balancing act was how heavily should I be invested heading into the weekend, especially since I will not be around today? I feel that the markets put in a half cycle low, so it seems ok to hold some positions, even if we lose that 50sma. The IWM is also added comfort. I’m also away for much of the weekend for a 30th wedding anniversary (not mine 🙂 ) and some other activities, so I may have the weekend report out late on Saturday or it may not be until Sunday early evening. Enjoy your weekend!
.
~ALEX
.
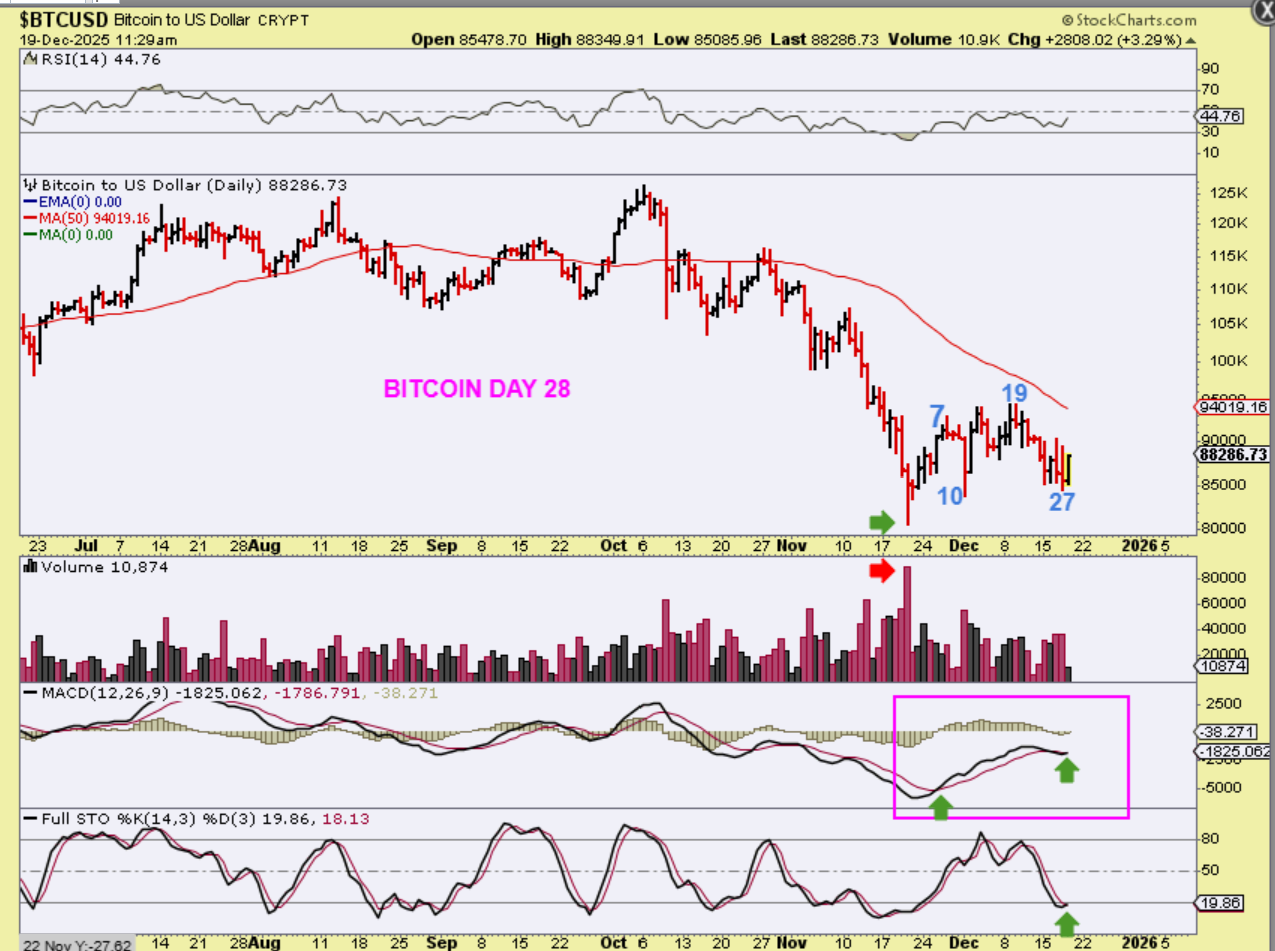
BITCOIN – I’m finally going to say that this set up with Bitcoin actually looks good (SHORT-TERM). I like the MACD set up and I think that the next upside targets will be the 50sma, the downtrend line in that same area, and if that can be overcome, the 200sma which is up near $108,000 right now. This finally does look like it can run higher, so let me show you how I am trying to picture this…

.
This finally does look like it can run higher, so let me show you how I am trying to picture this.
.
I could imagine this 60 day cycle as two 30-day cycles, where the first one almost back tested the low at day 27, and the 2nd one rallies. I DON’T KNOW IF THIS WILL PLAY OUT LIKE THIS FOR SURE, but the MACD looks fairly strong and we are oversold.
.
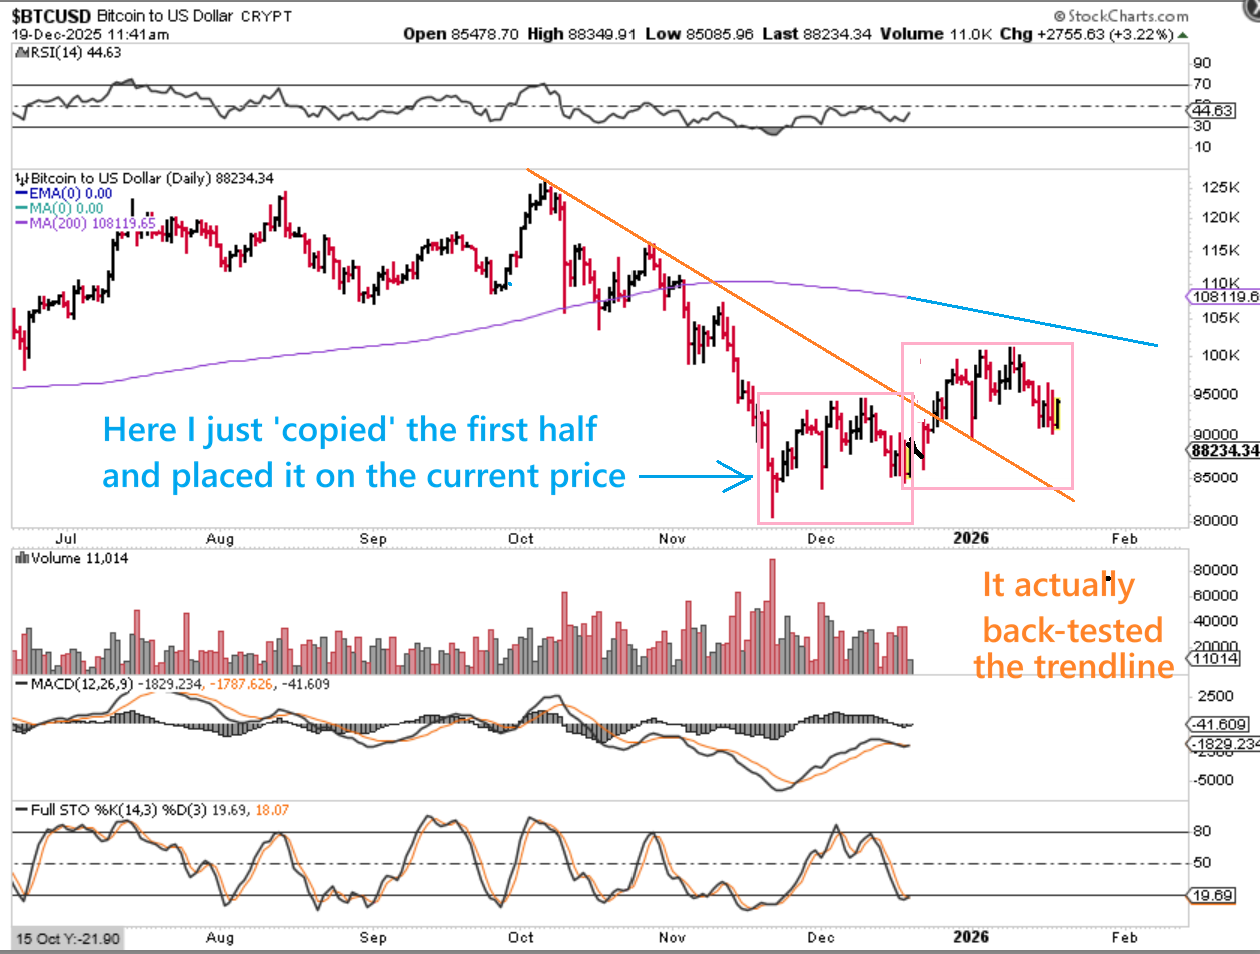
Bitcoin: When I copied the first half and added it to the 2nd half, we only reached $100,000, but again, we could see a run to the 200sma. It’s a total coincidence that when I overlaid it, the sharp dip in the first run ‘back-tested’ the trendline 🙂
Thursday December 18th – The Elephant in the Room 
 December 20 Weekend Report
Scroll to top