December 13th Weekend Report – A Health Check
.
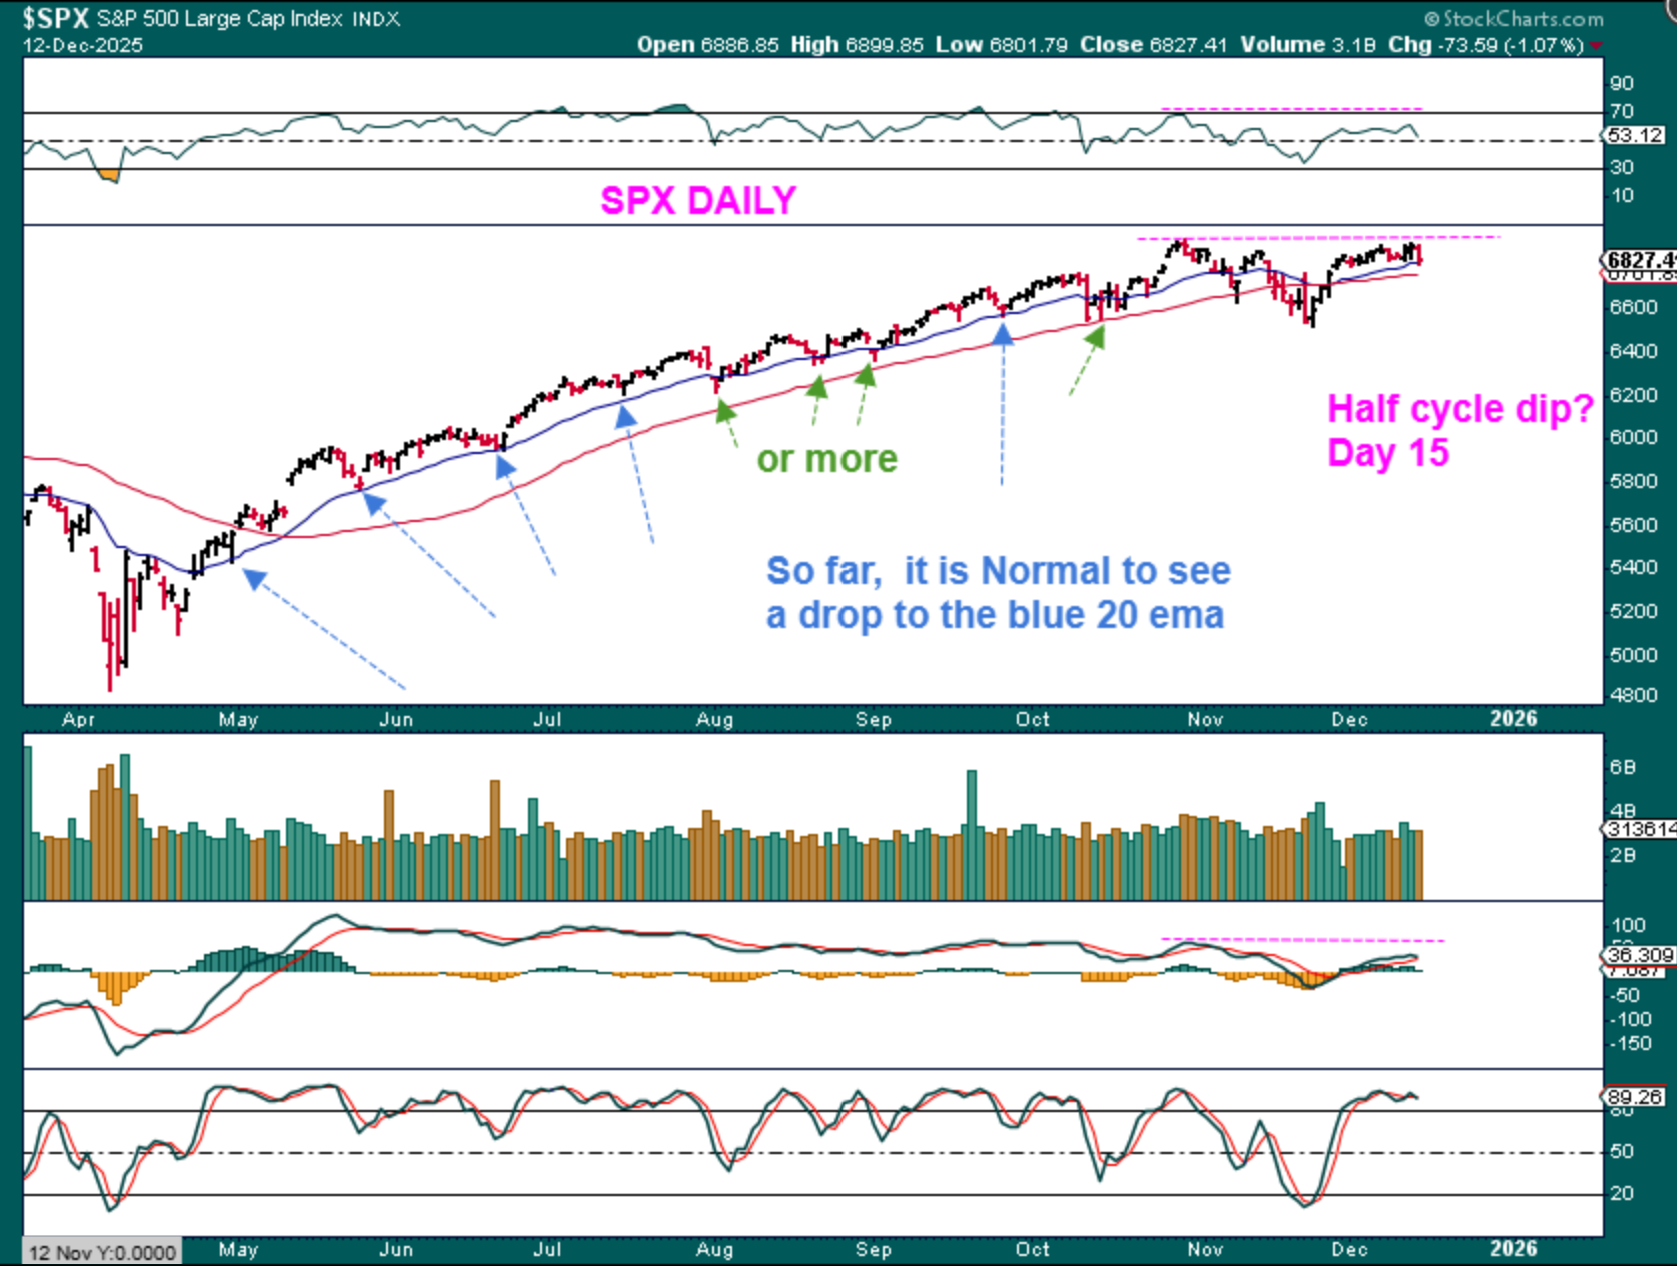
SPX Daily – On Friday the markets sold off, bounced back and then sold off again into the close. It felt uncomfortable, but from this chart we can see that no real damage was done. Price has often dropped to the blue line, and even below it, so this may be a half cycle dip around day 15. What about the weekly chart?
.
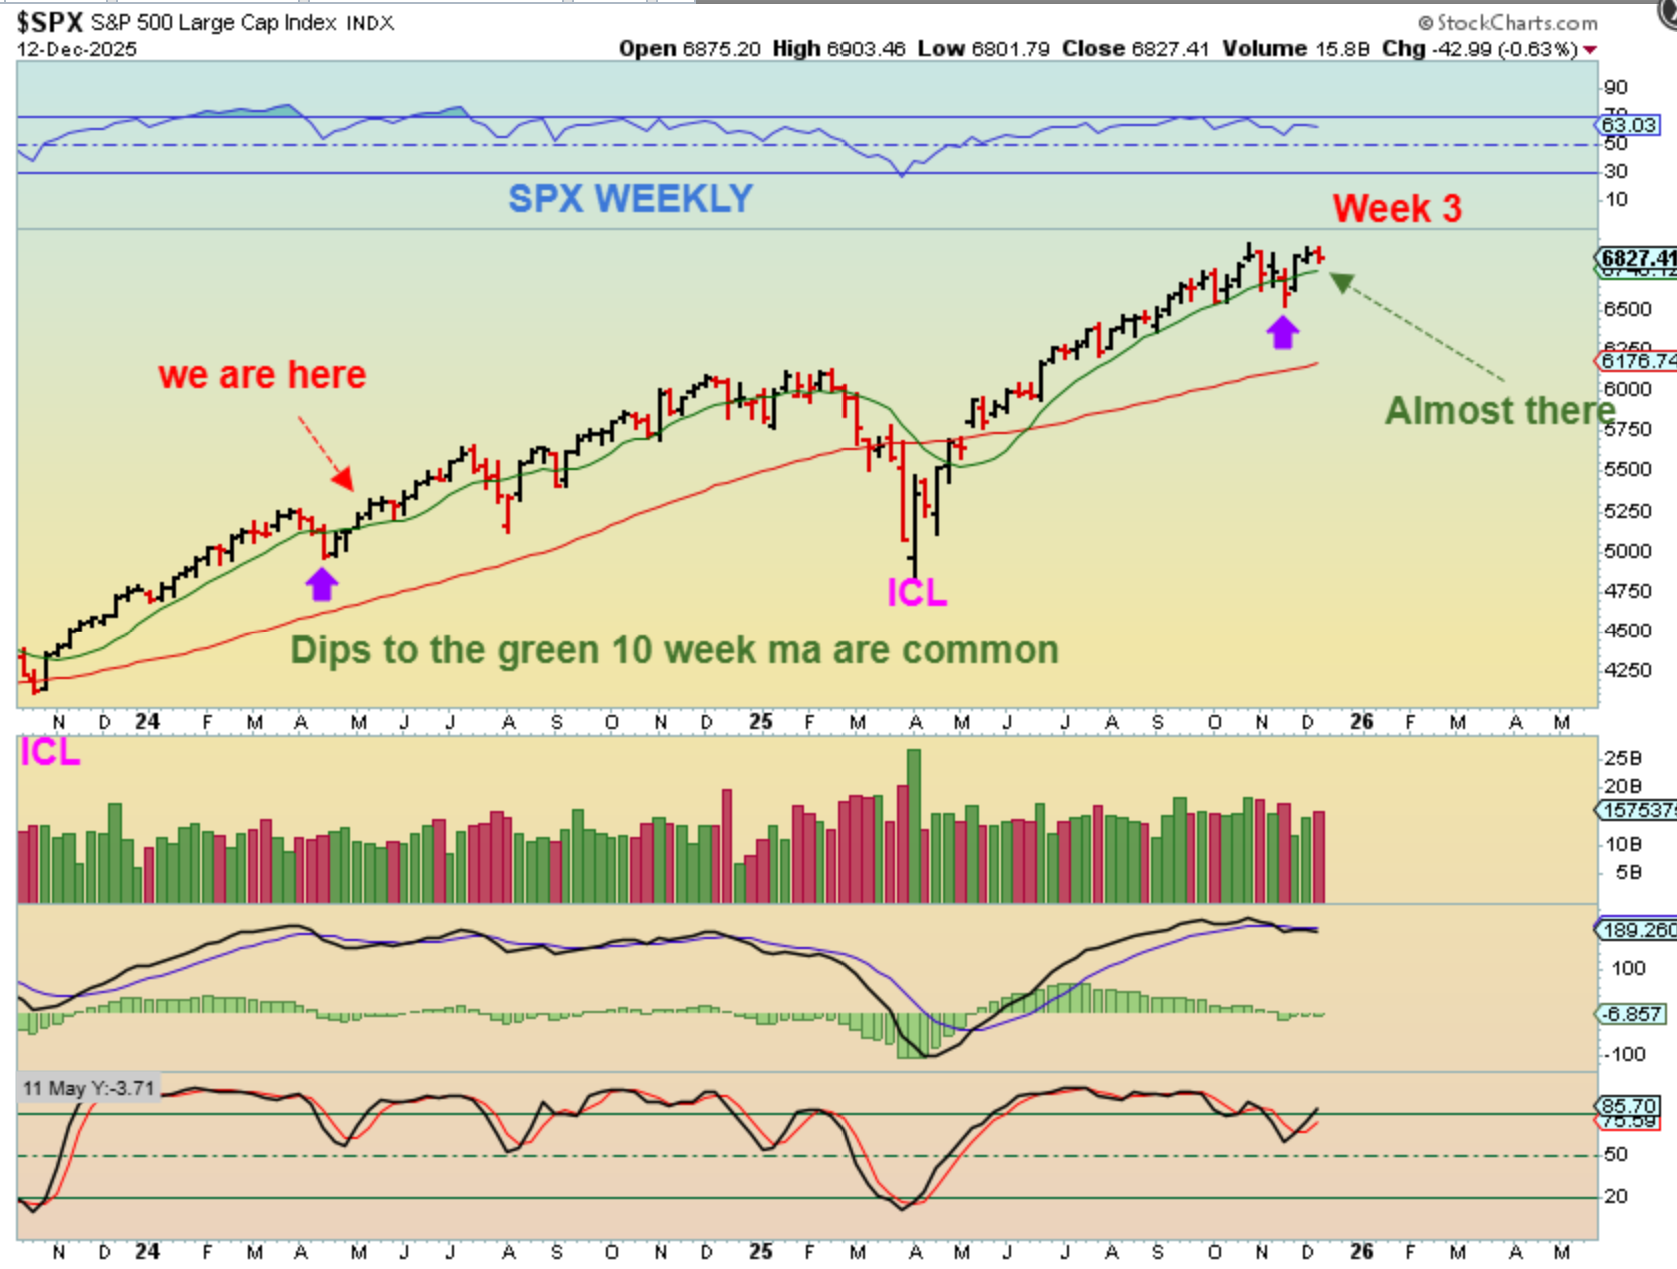
SPX WEEKLY – dips on the weekly chart can drop to the green line and we aren’t there yet, so this is also still a normal dip in a bull market. We are only on week 3. On this chart I have also compared the ICLs and then the run to the next deeper dip. Let me show you that on a NASDAQ chart…
.
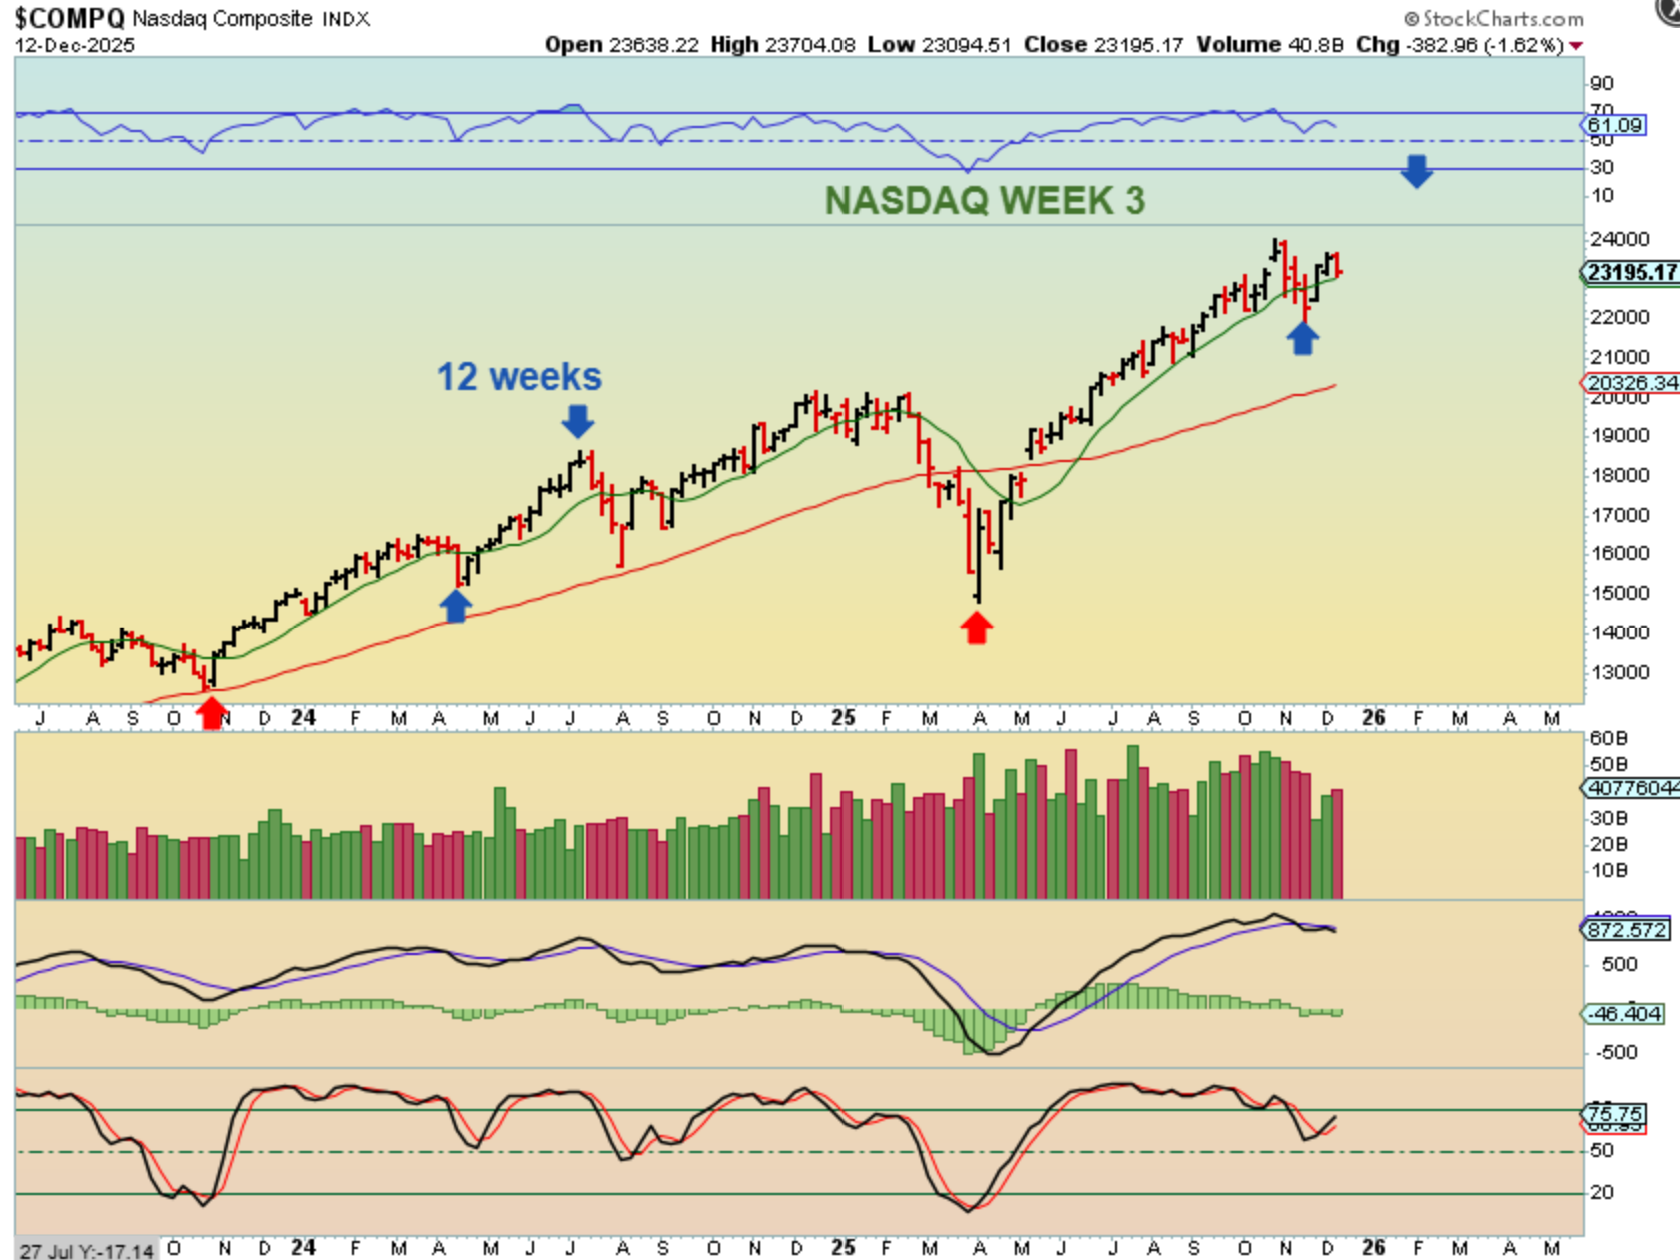
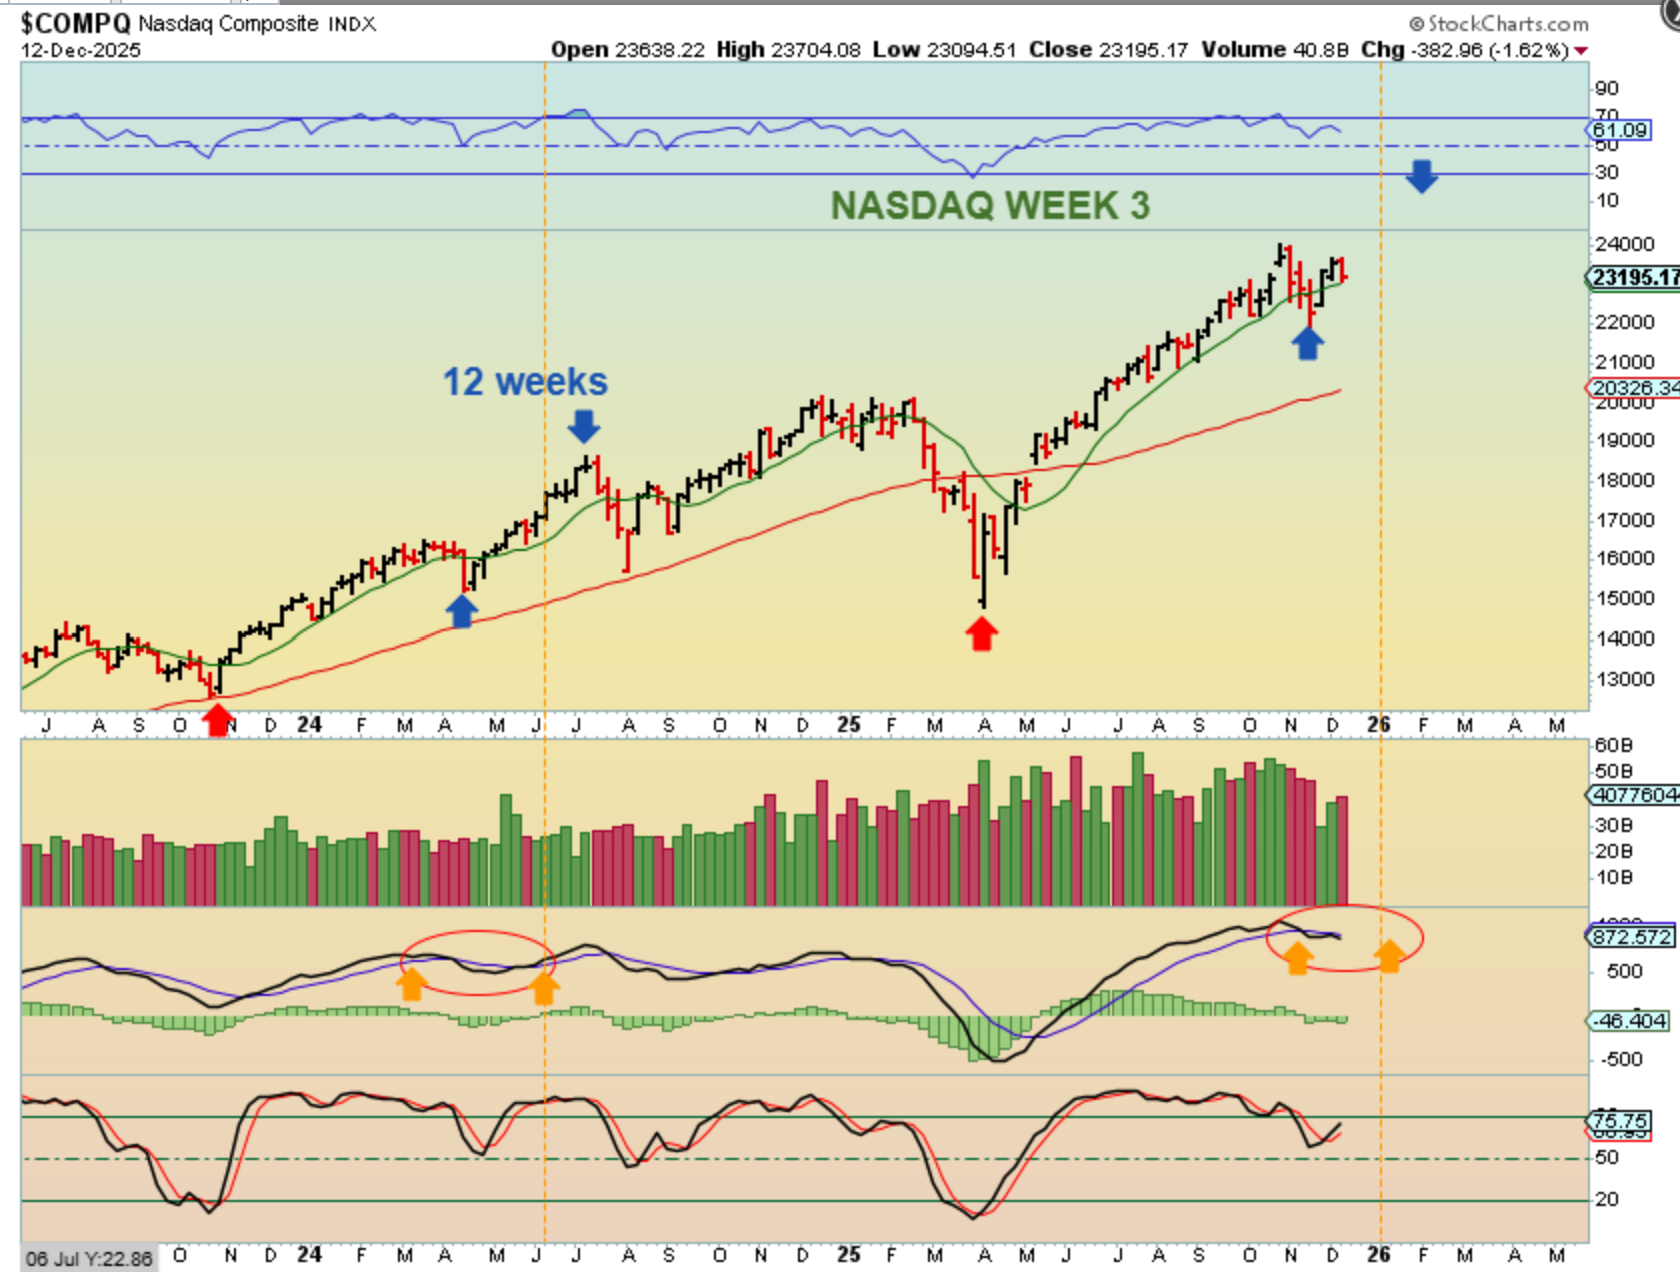
NASDAQ –
1. The deeper ICLS with the red arrows were both followed by strong runs.
2. They then dipped to the blue arrow (Next ICL) and the next run out of that low that came in 2024 ran for 12 weeks – which is almost 3 months. We are currently only on week 3, so we should see more upside (the so-called ‘Santa rally’) and the stochastics is not overbought.
.
NASDAQ – It also took 7 or 8 weeks for the MACD to correct itself, so I am not going to worry about that MACD divergence yet.
.
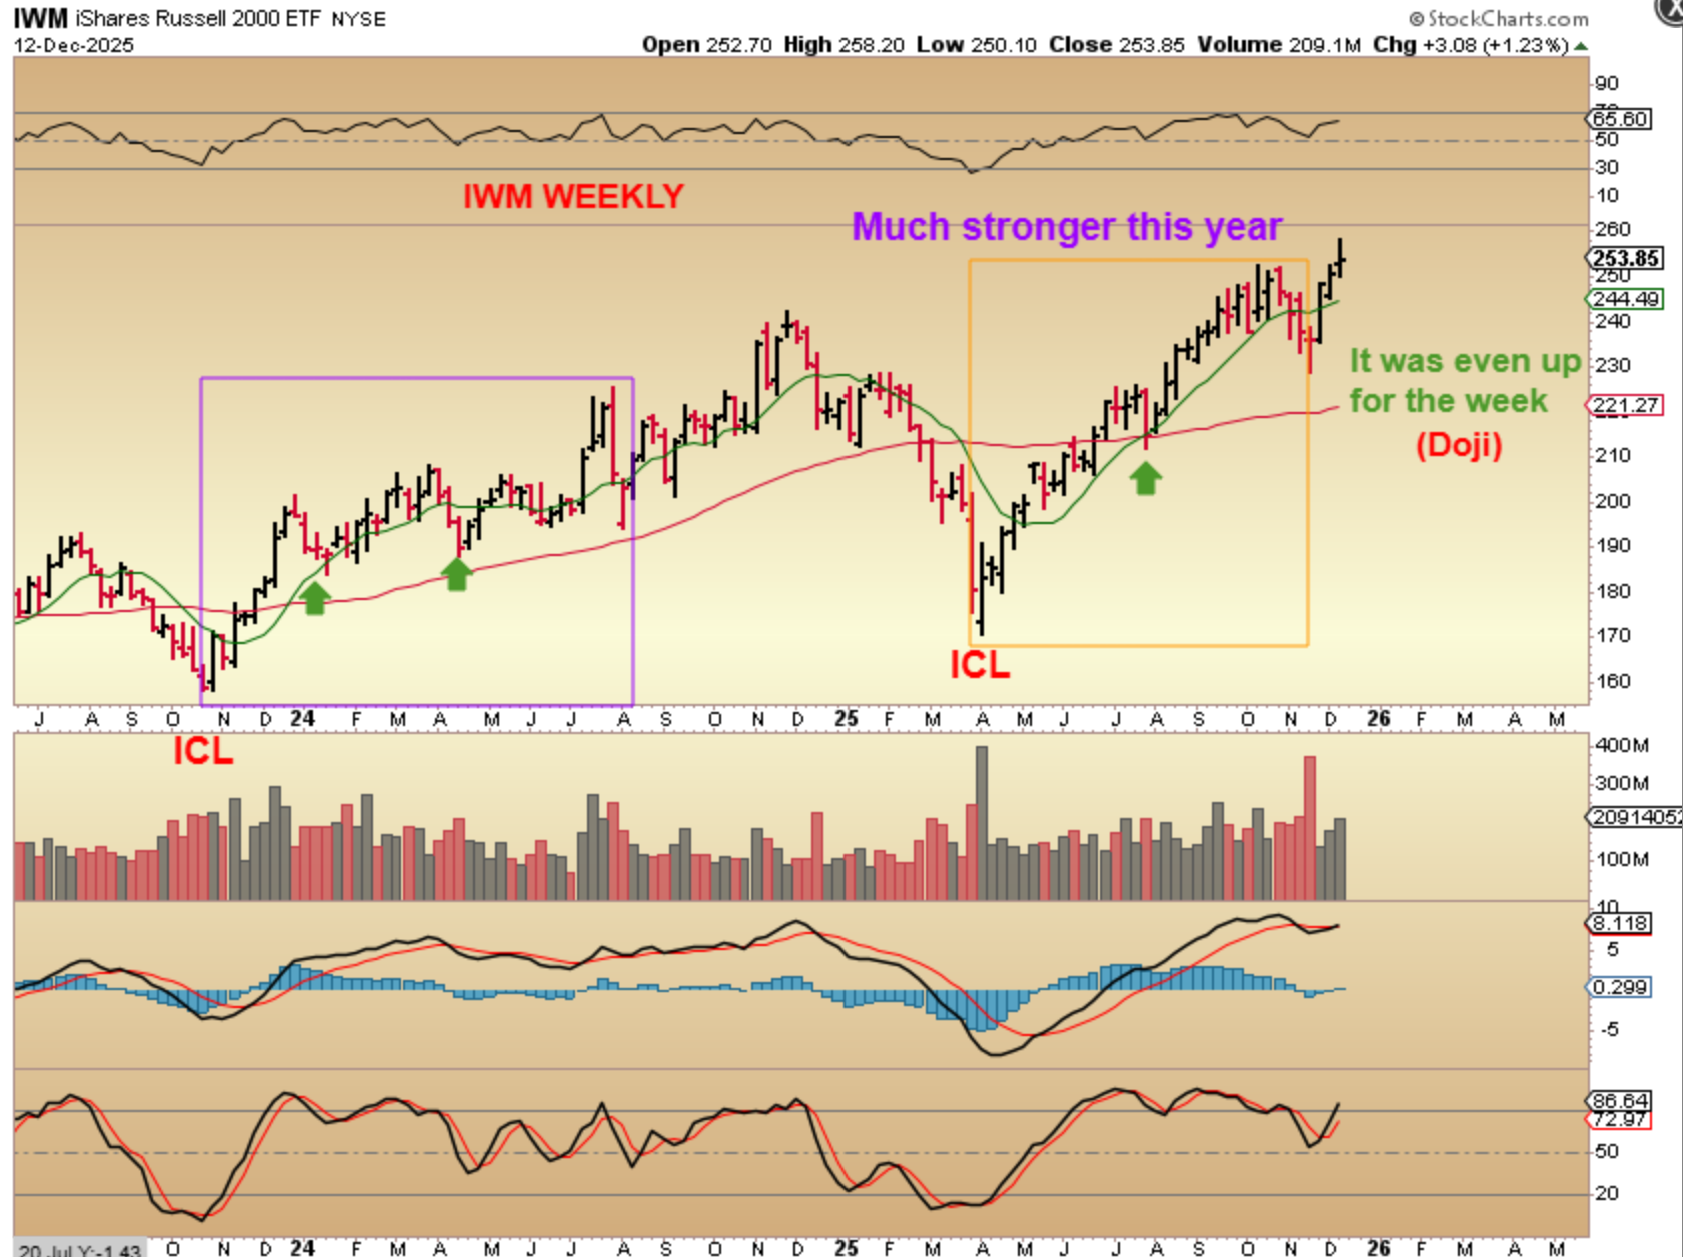
The IWM is already having a stronger run in 2025 than it did in 2024. It’s hard to compare them like I did with the SPX & NASDAQ, and the IWM even closed up for the week with a doji, so the small caps are outperforming and look good, despite Fridays selling.
.
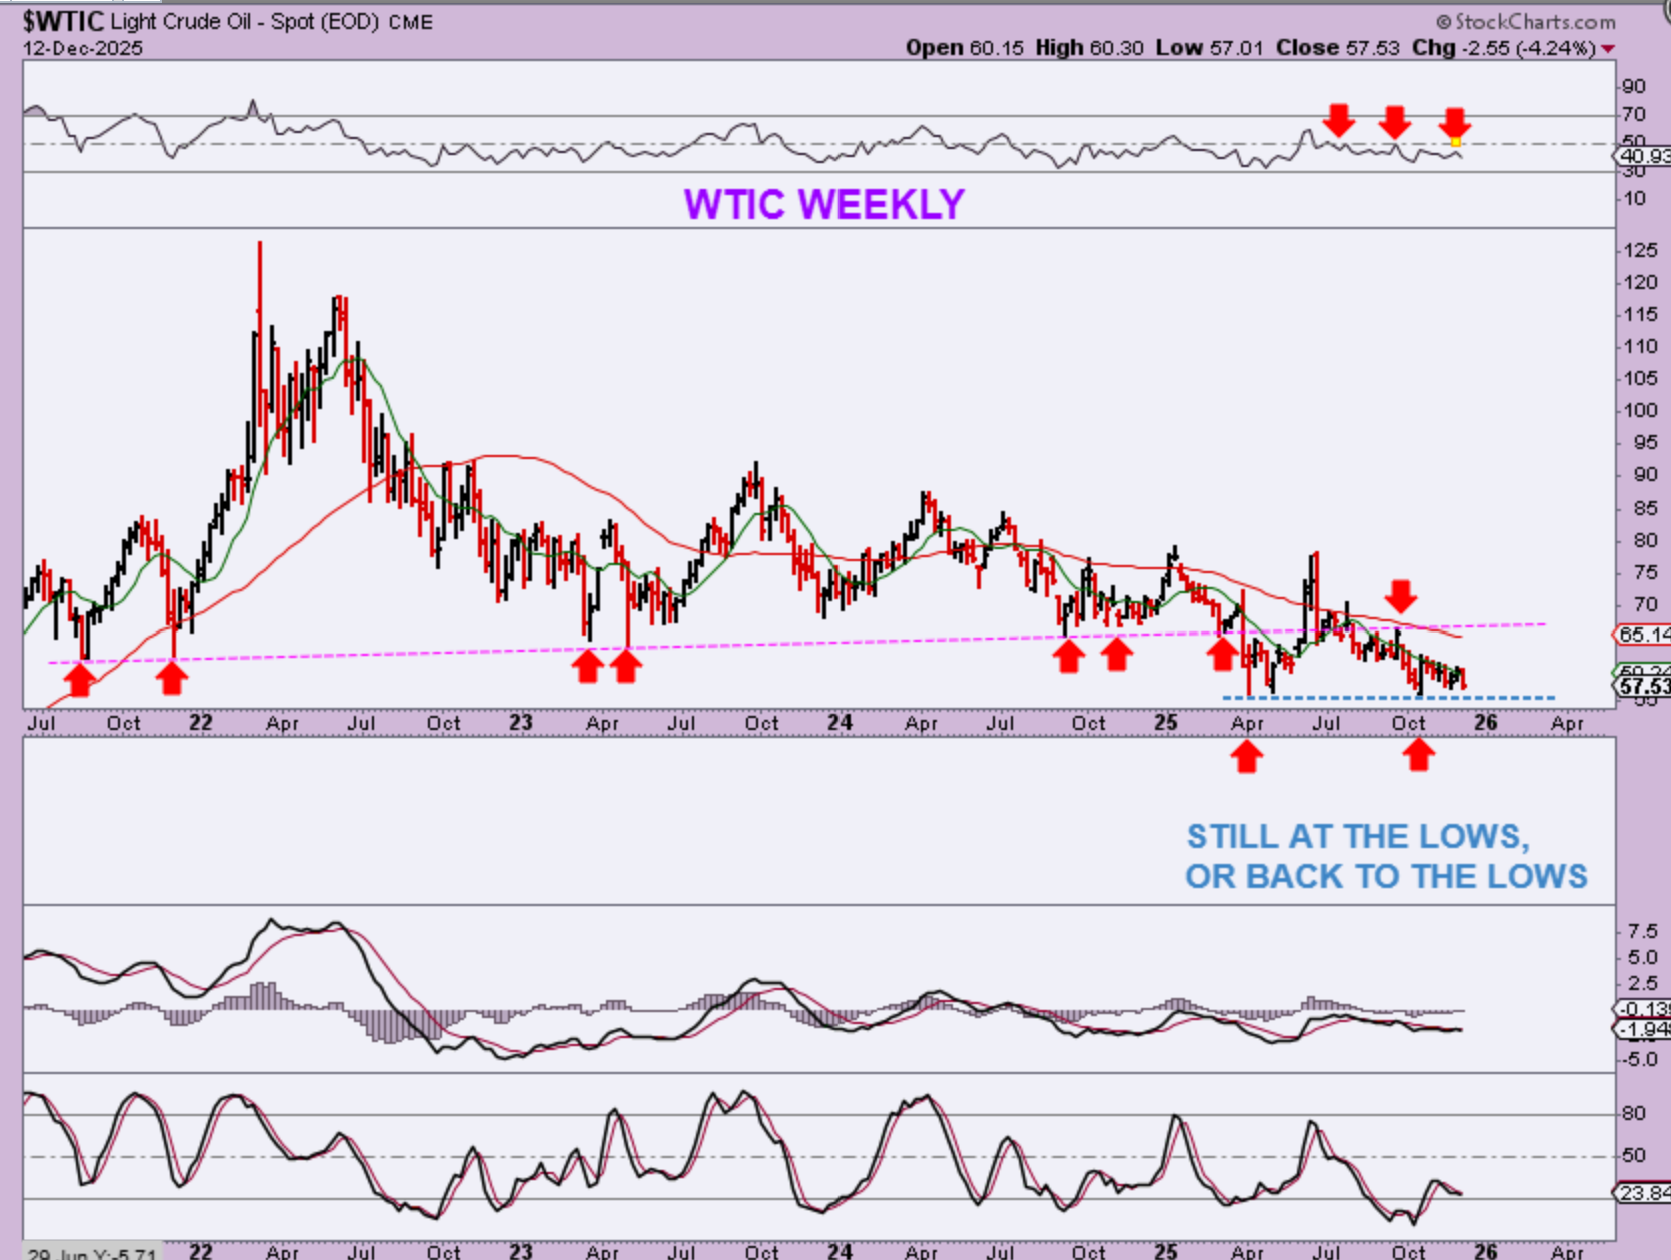
WTIC – What can I say about Oil that I haven’t already said? It closed at the lows again this week, and the RSI is trapped under the 50% line. Oil remains choppy, and Oil stocks do look better than Oil, but also remain choppy.
.
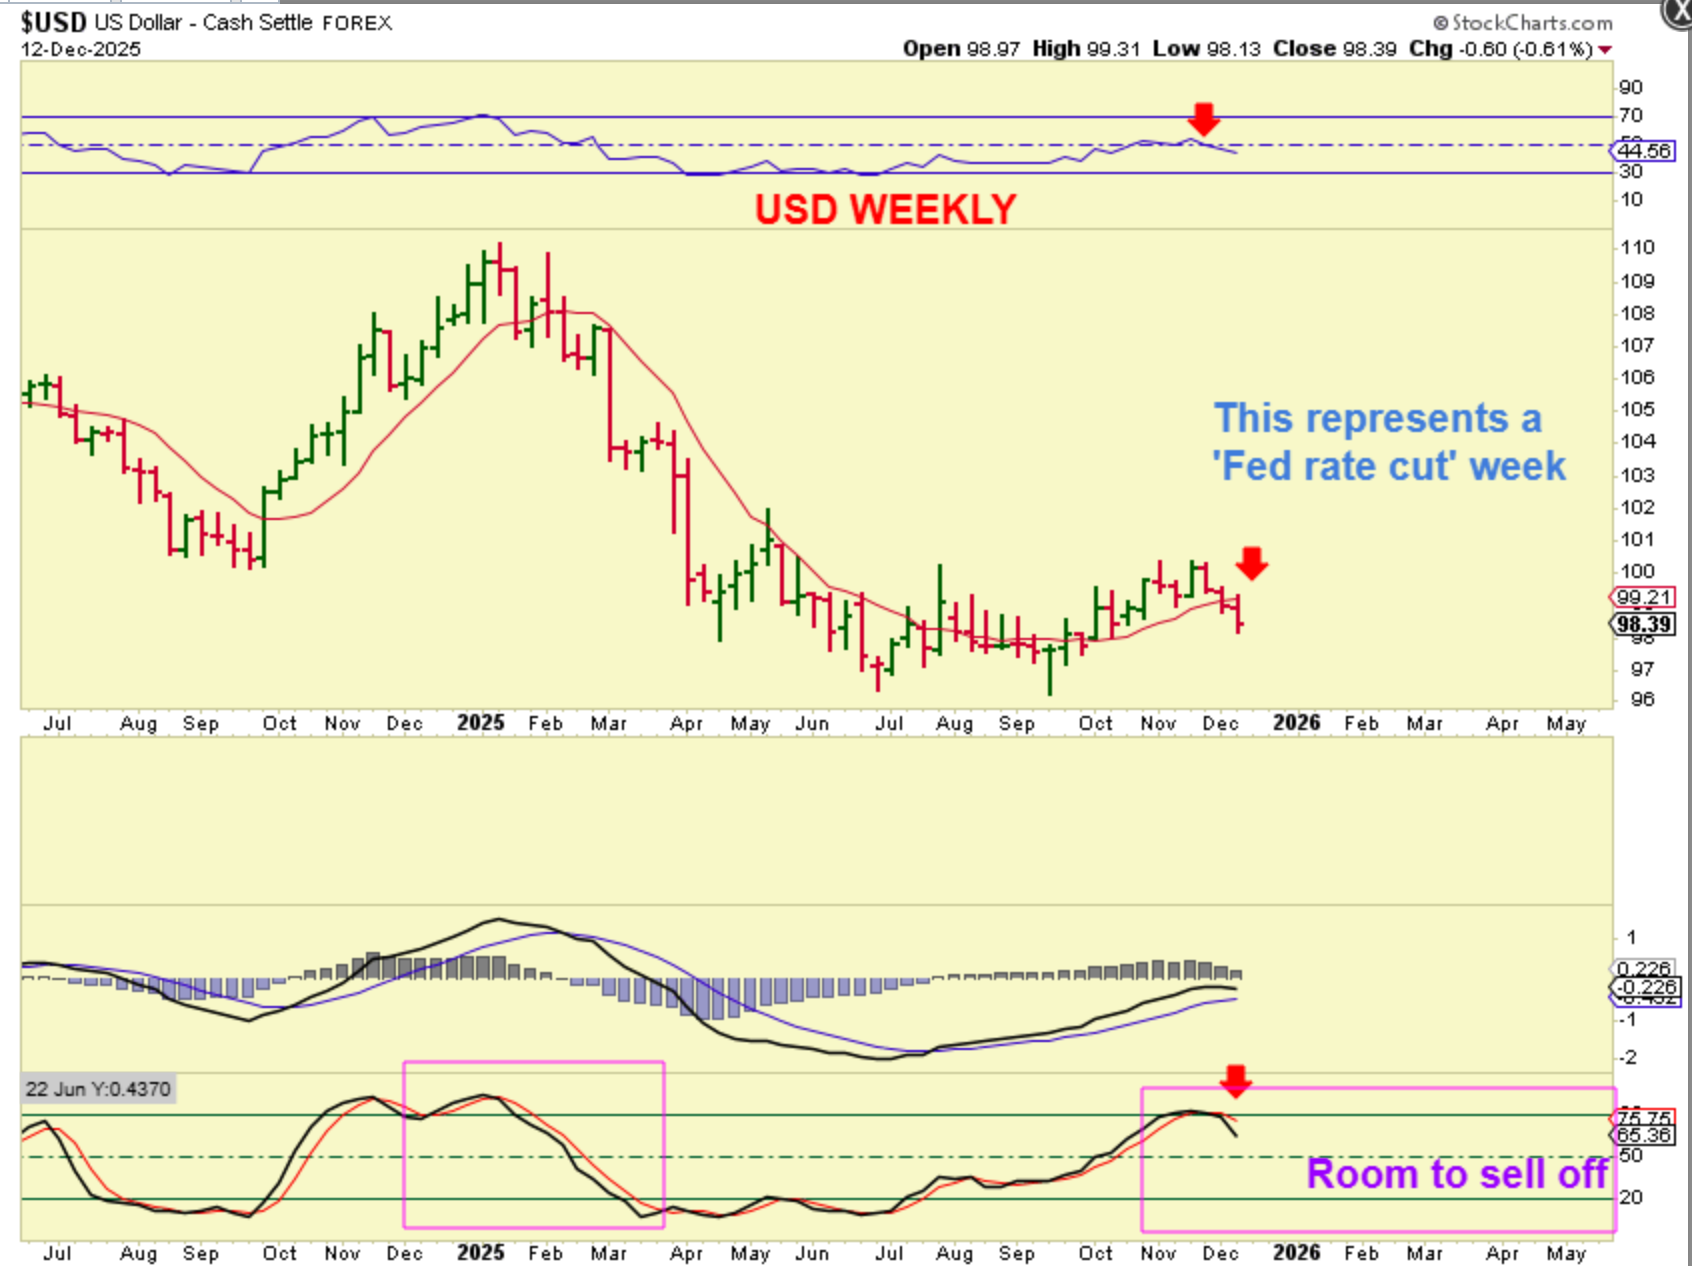
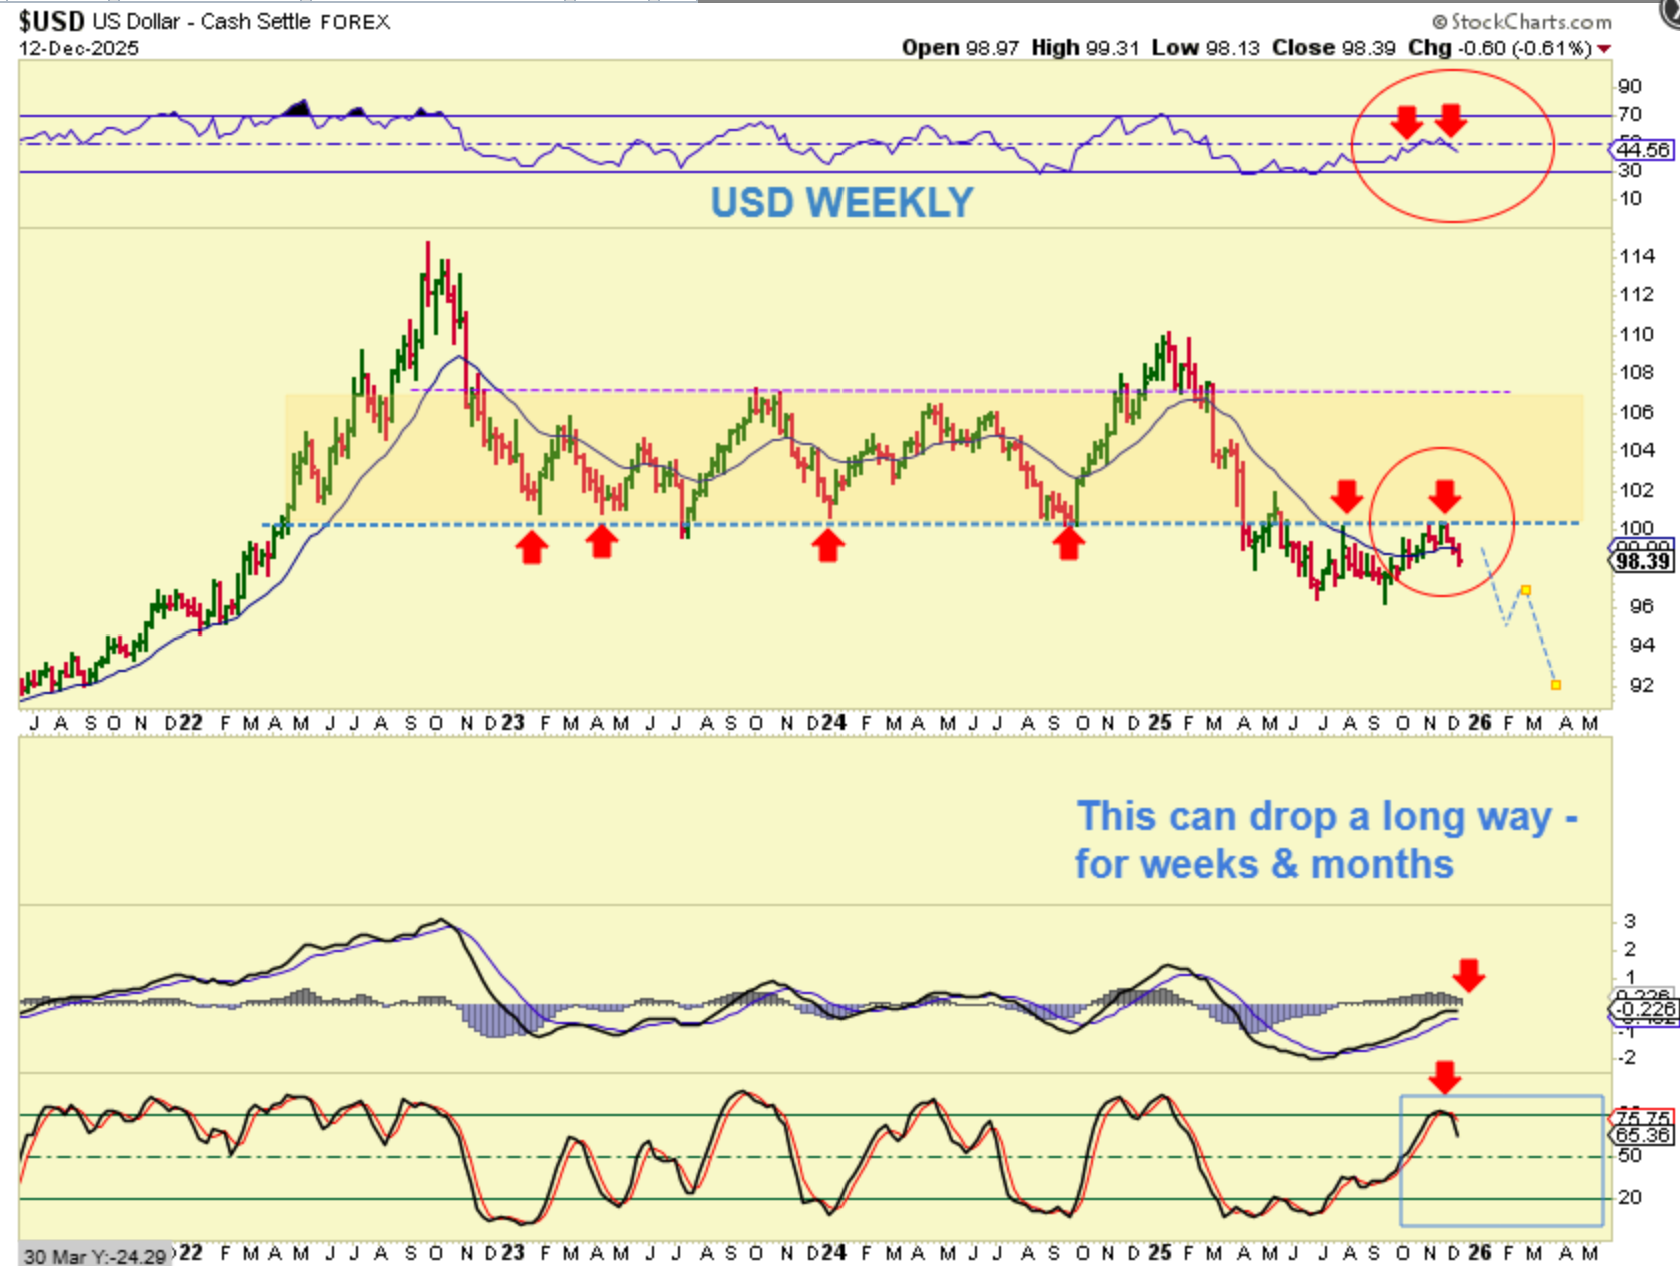
We got the Fed rate cut, and The USD did as expected.
It showed some strength when the rumor or talk was that we would NOT get a rate cut in December, but several Fed Spokespersons started to discuss in November that they would now vote to cut rates in December, and The USD became weak. The USD was rejected here at the support / resistance line of the 10 week ma. On the daily chart it was pinned under the 50sma and 200sma. Look at the weekly stochastics…
.
The Weekly USD stochastics is overbought, so this could sell off daily cycle after daily cycle (as drawn here). This could really help the precious metals bull run.
.
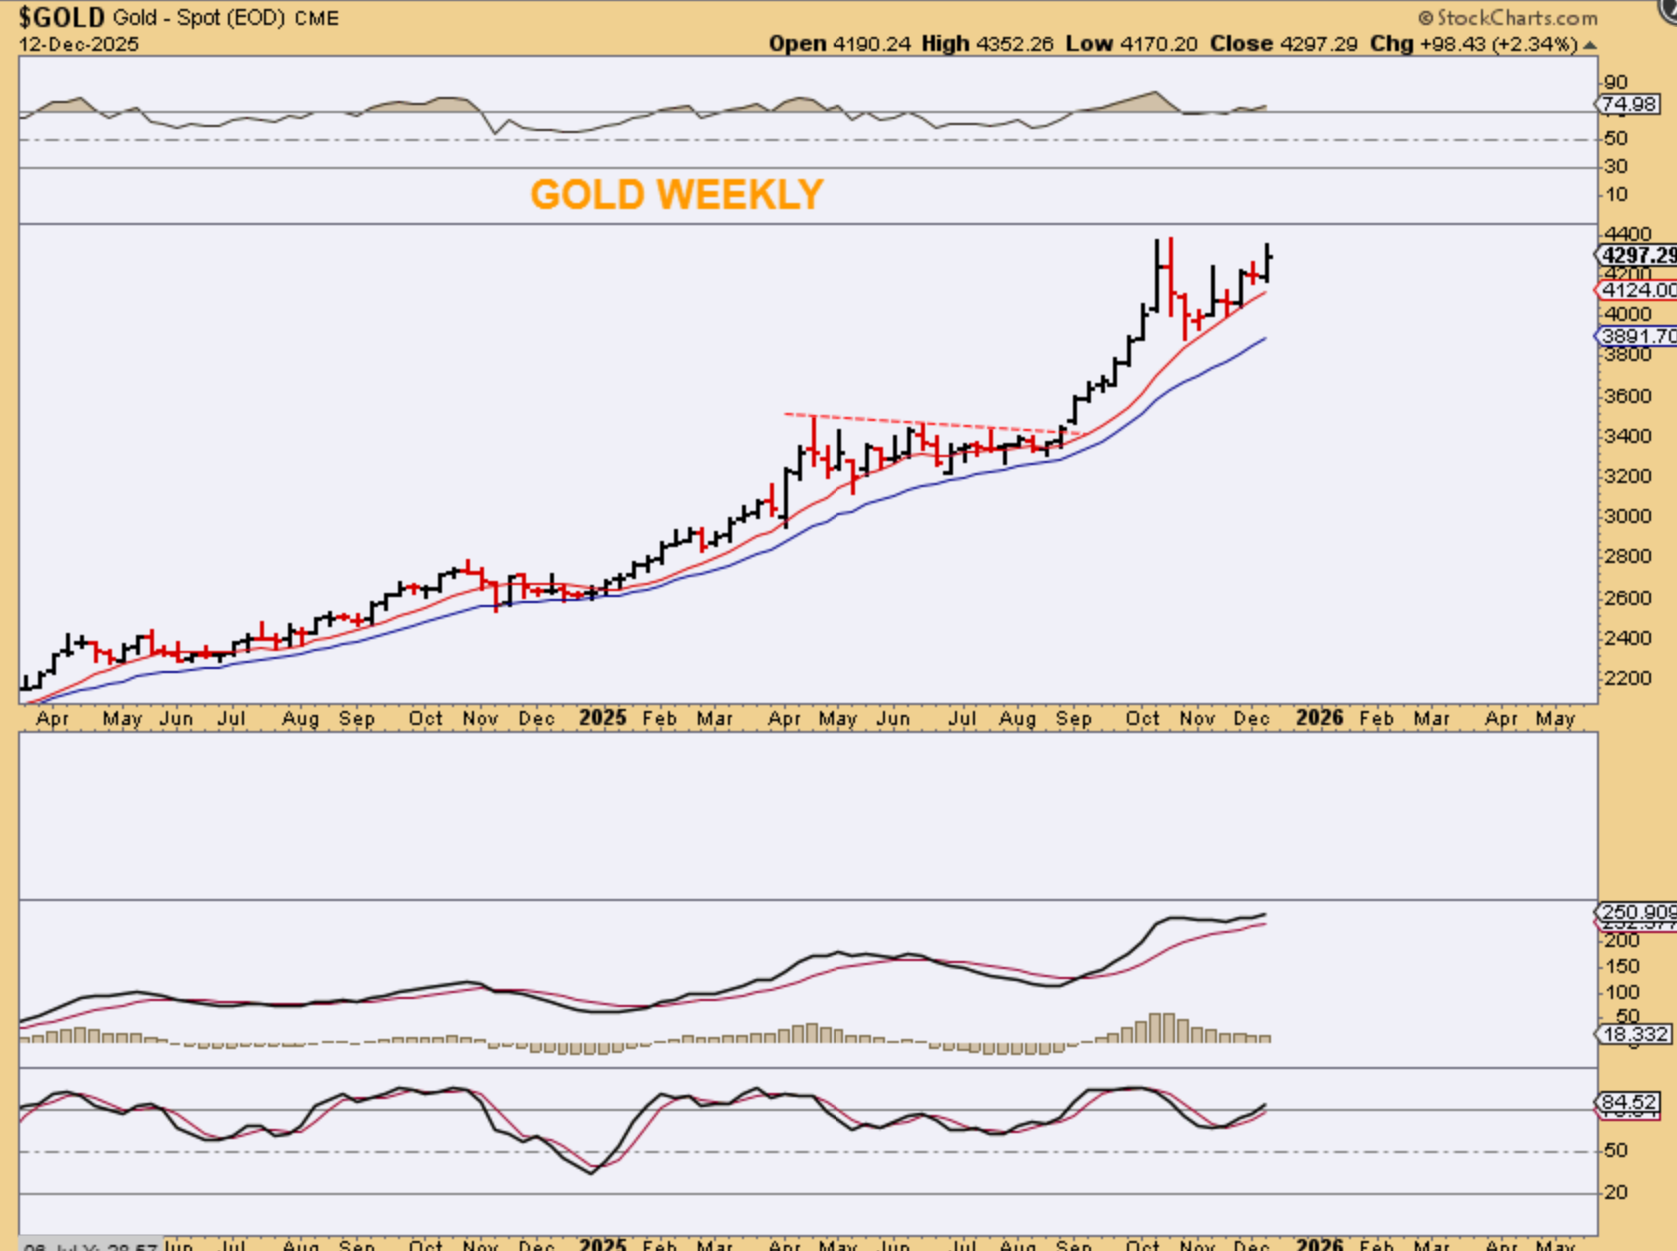
GOLD has been moving higher out of that Oct-Nov low. When people were discussing ‘no rate cut’ for December and the USD was gaining strength, I mentioned…
.
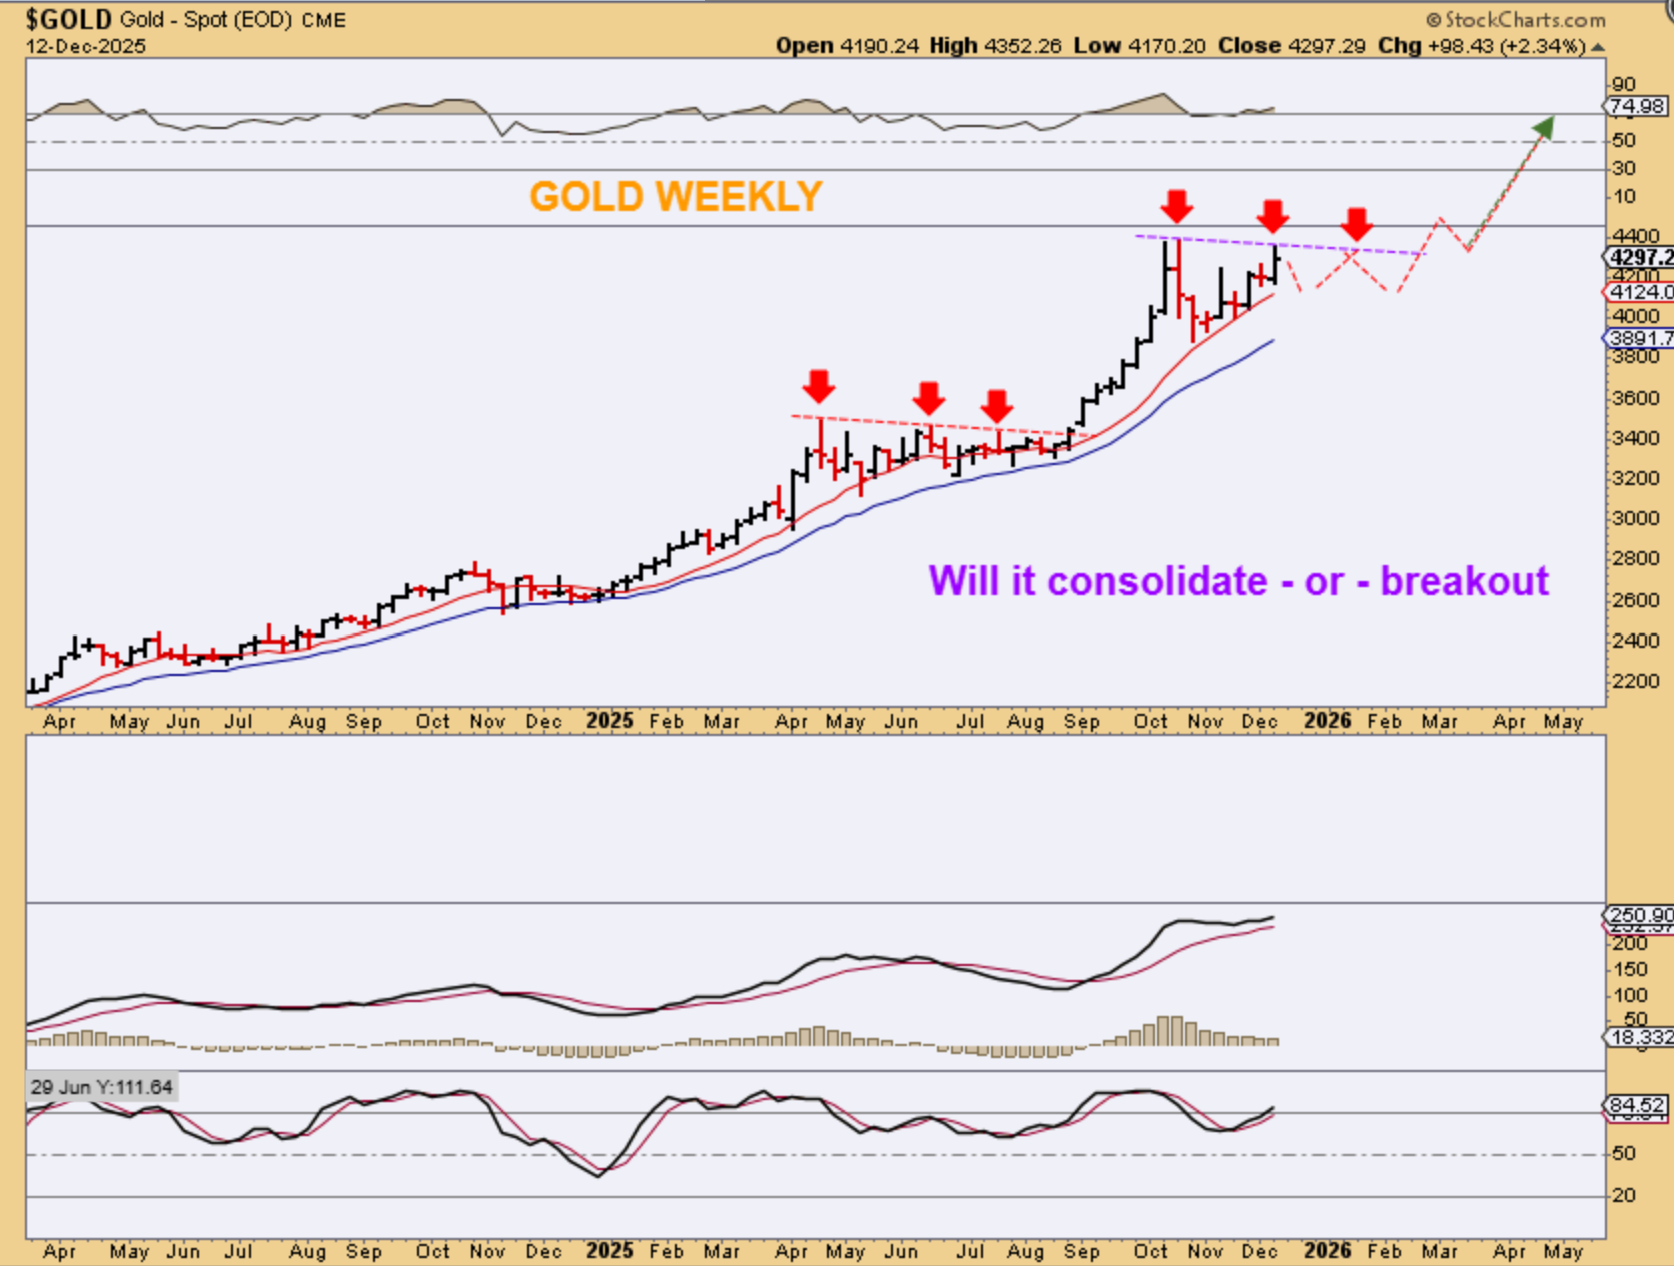
GOLD:
When people were discussing ‘no rate cut’ for December and the USD was gaining strength, I mentioned that we may see a sideways consolidation similar to what we saw in 2025. I have drawn that idea here again. It would show Golds strength, but it may not be able to break out yet. NOW THAT MAY HAVE CHANGED…
.
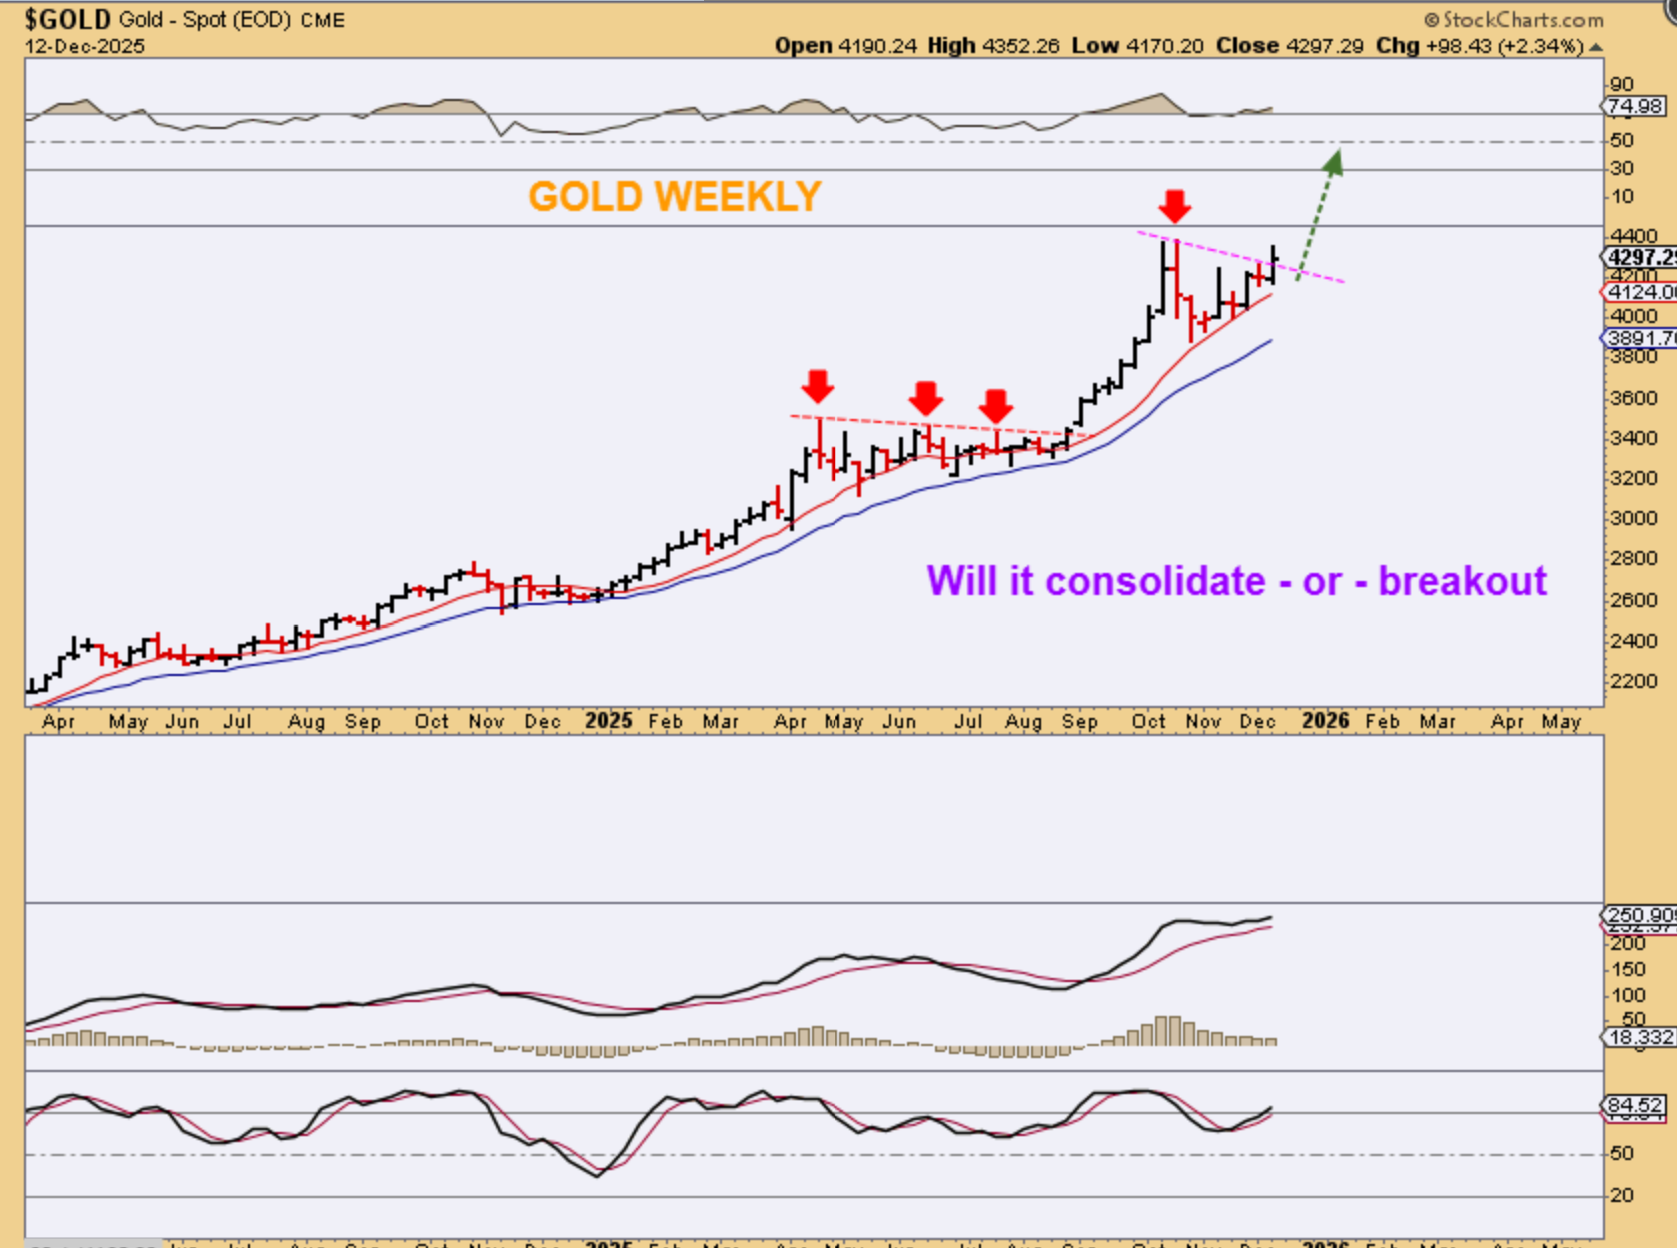
GOLD could just breakout and run like Silver has, now that we have the December rate cut and the USD is starting to drop. I have drawn that likelihood here.
.
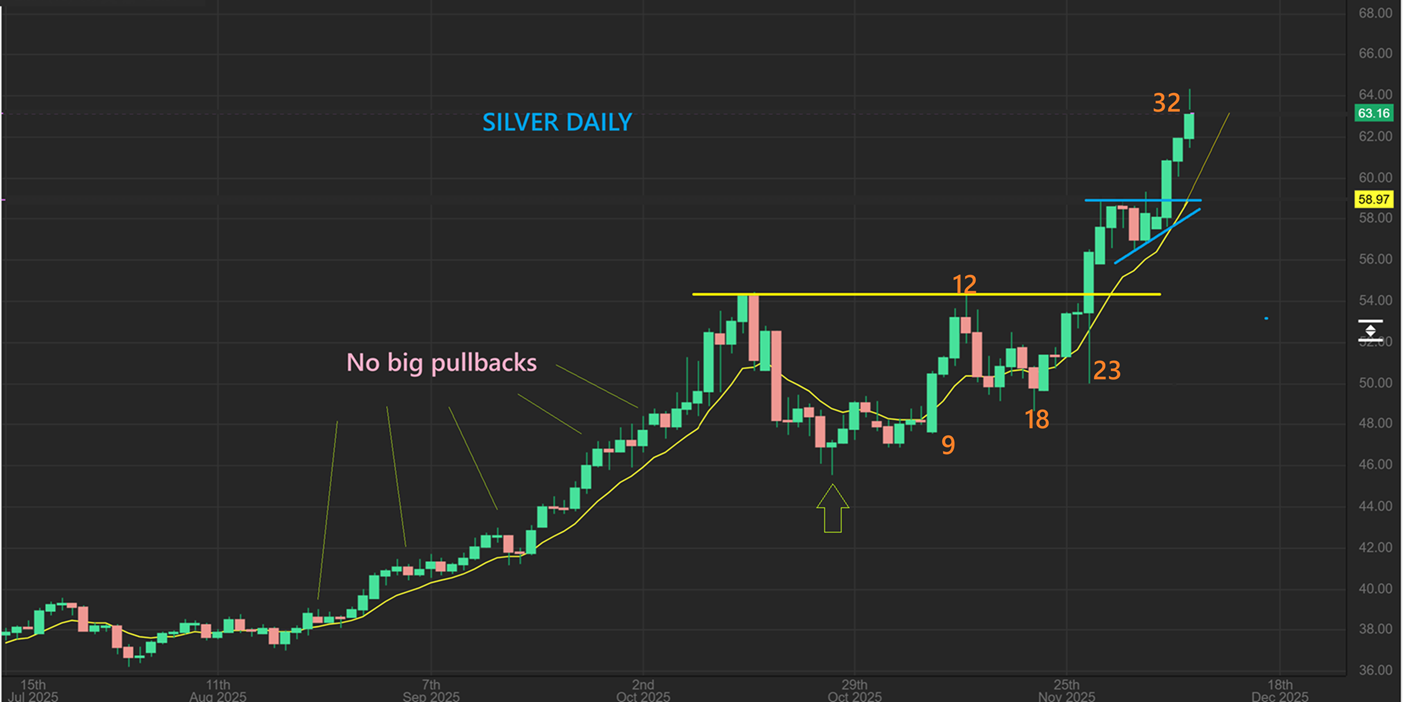
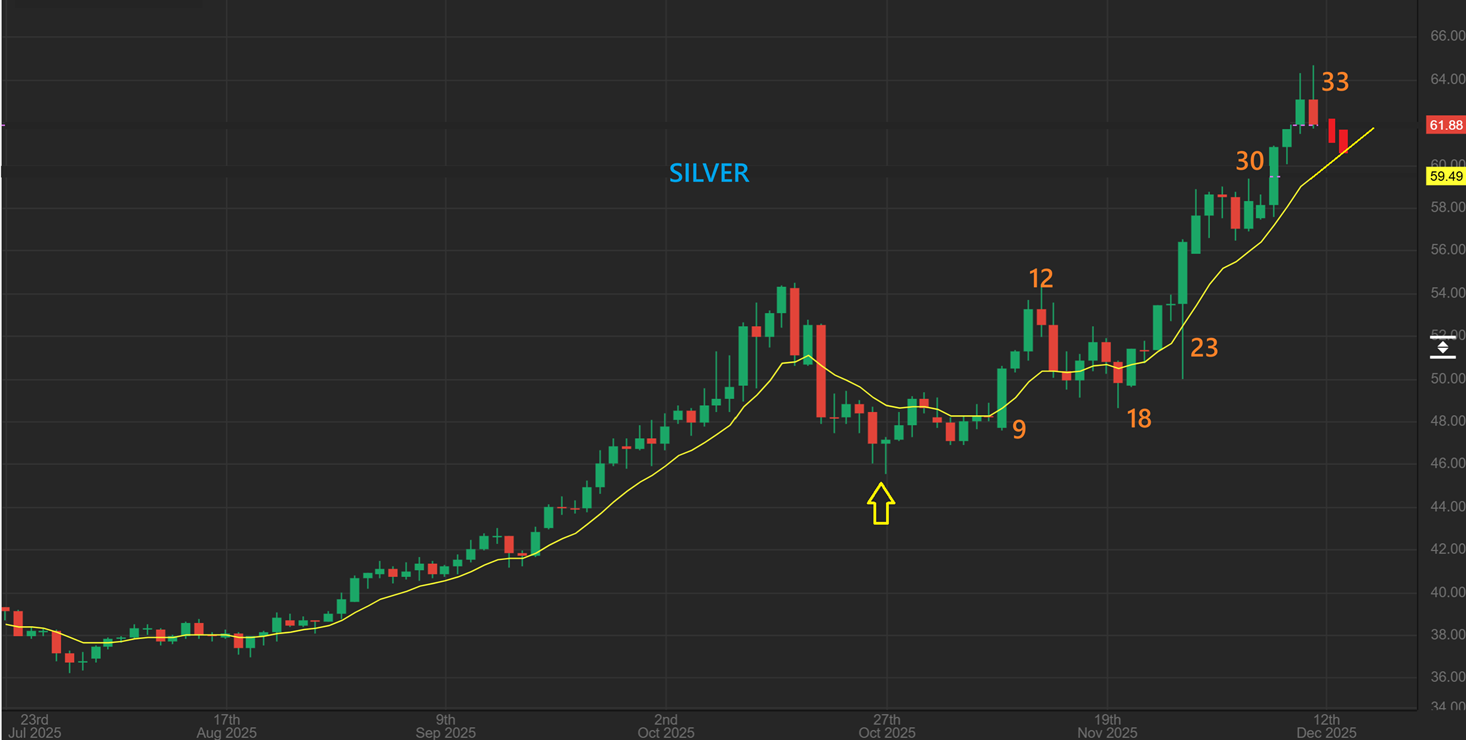
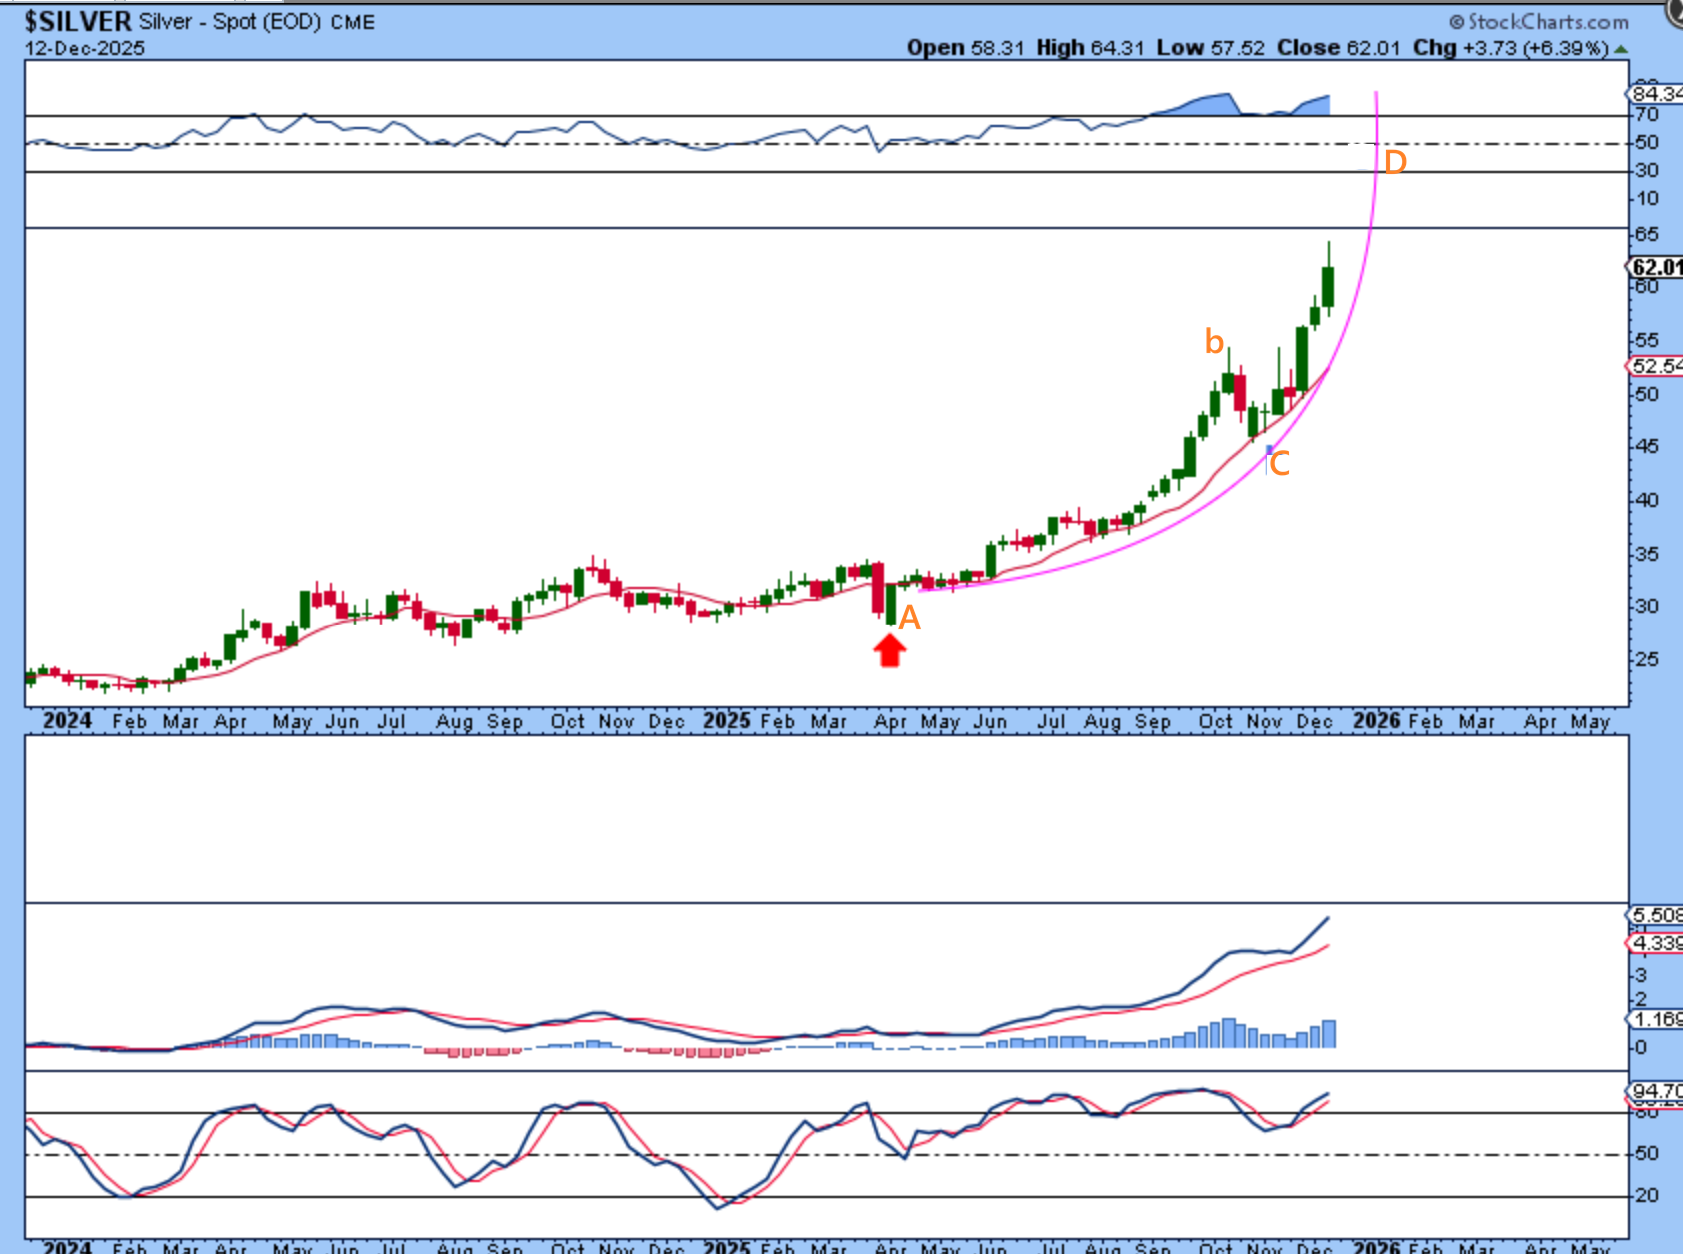
SILVER – Before Silver pulled back, I counted the days from the low and got 32, so Friday would have been day 33 (if we didn’t have a day 18 dcl) and Silver pulled back on Friday.
.
So, if that was a day 33 peak on friday, SILVER could drop to the yellow moving average as shown here in a day or 2.
.
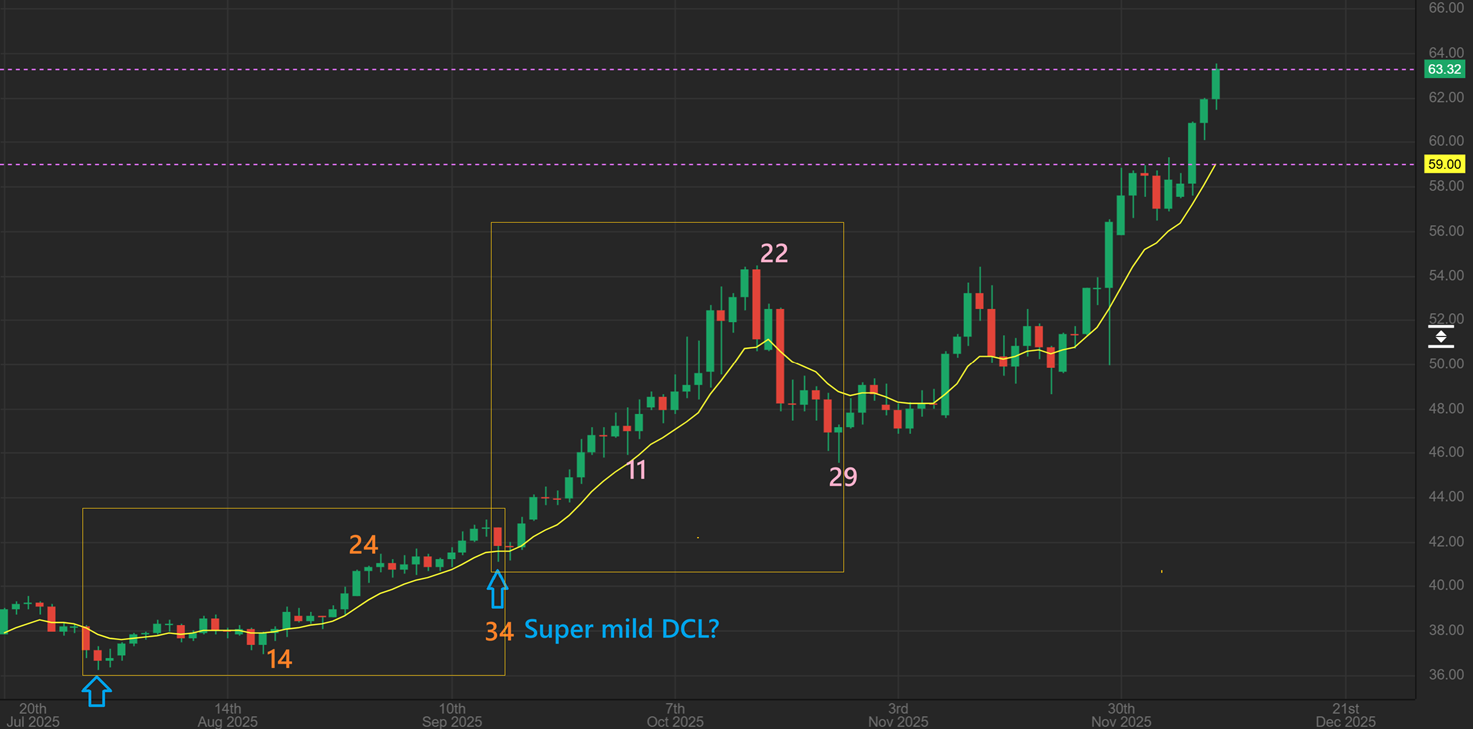
On the last SILVER Bull Run, notice that Silver did not pull back for many days, but it only had a red candle here and there. A possible day 34 dcl was just a 2 day dip and then it was off and running again.
.
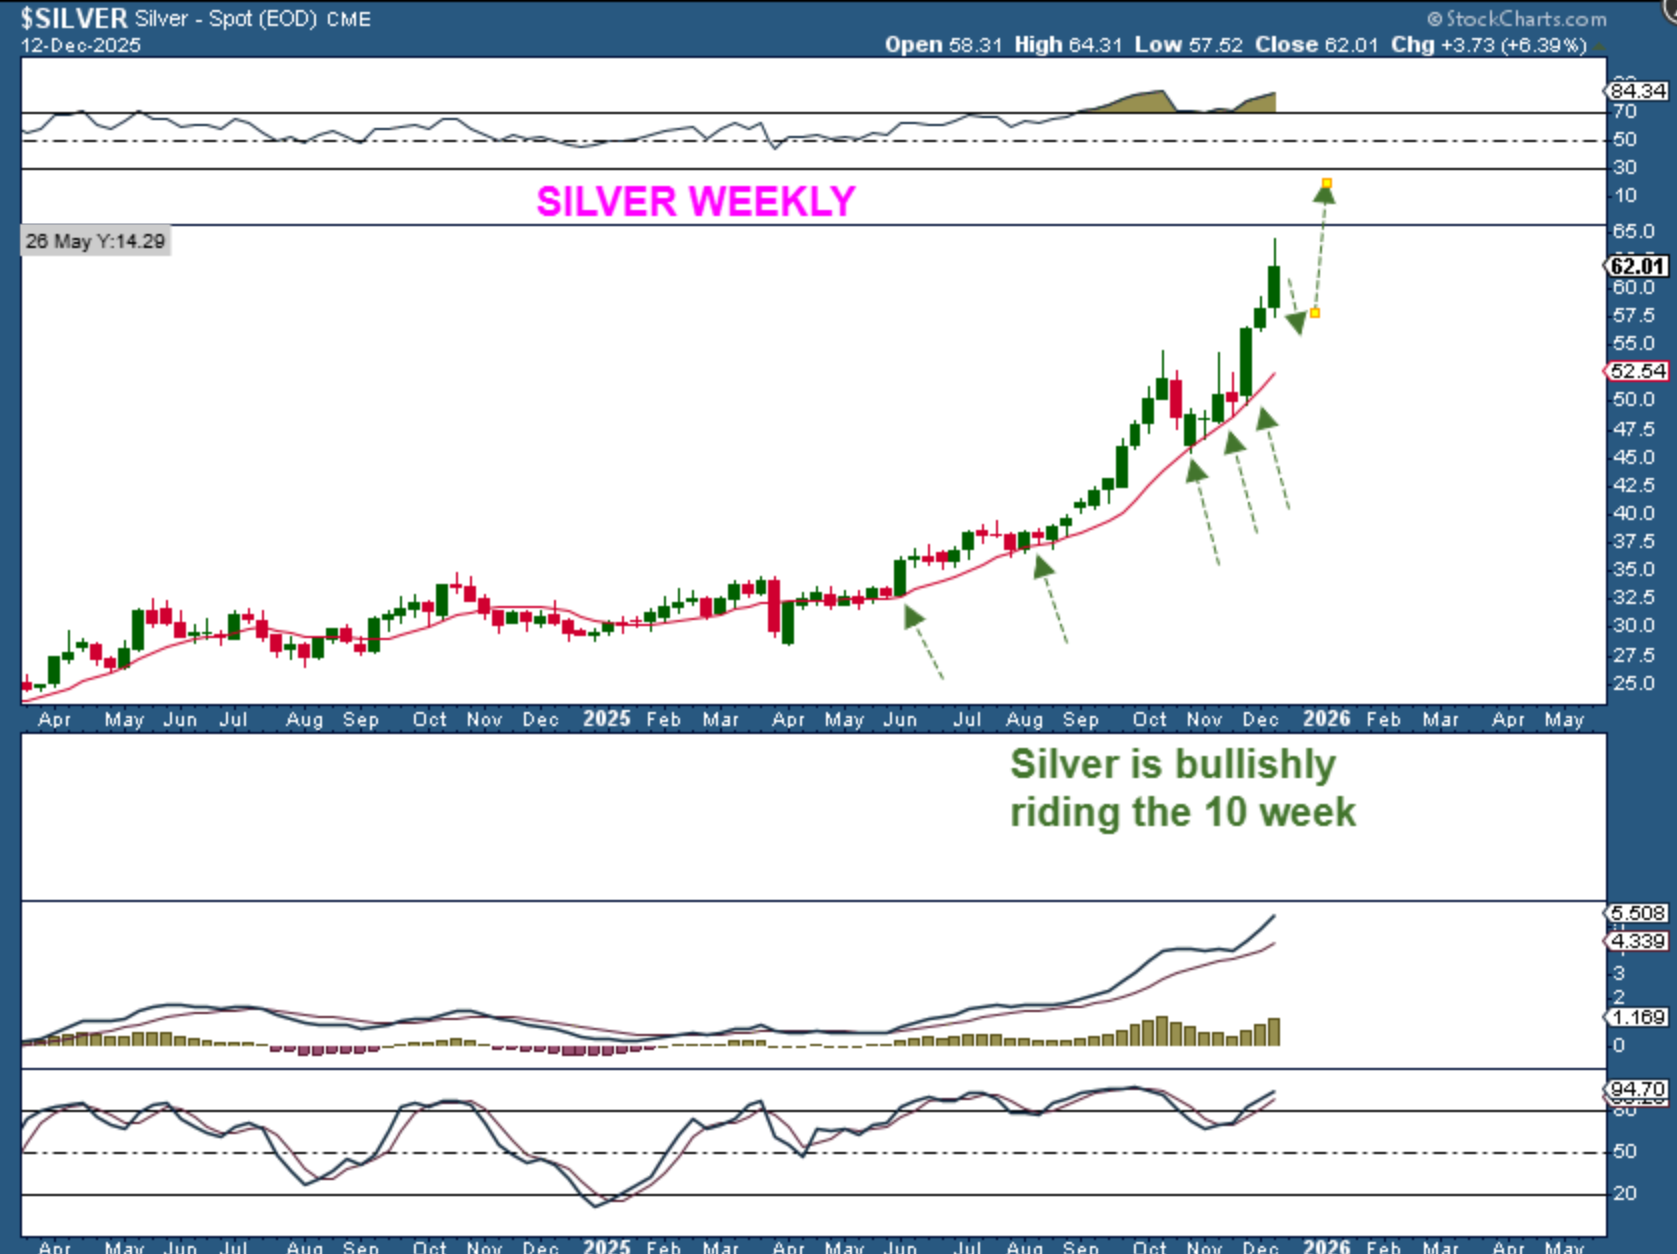
SILVER WEEKLY – Silver is also bullishly riding the 10 week ma.
.
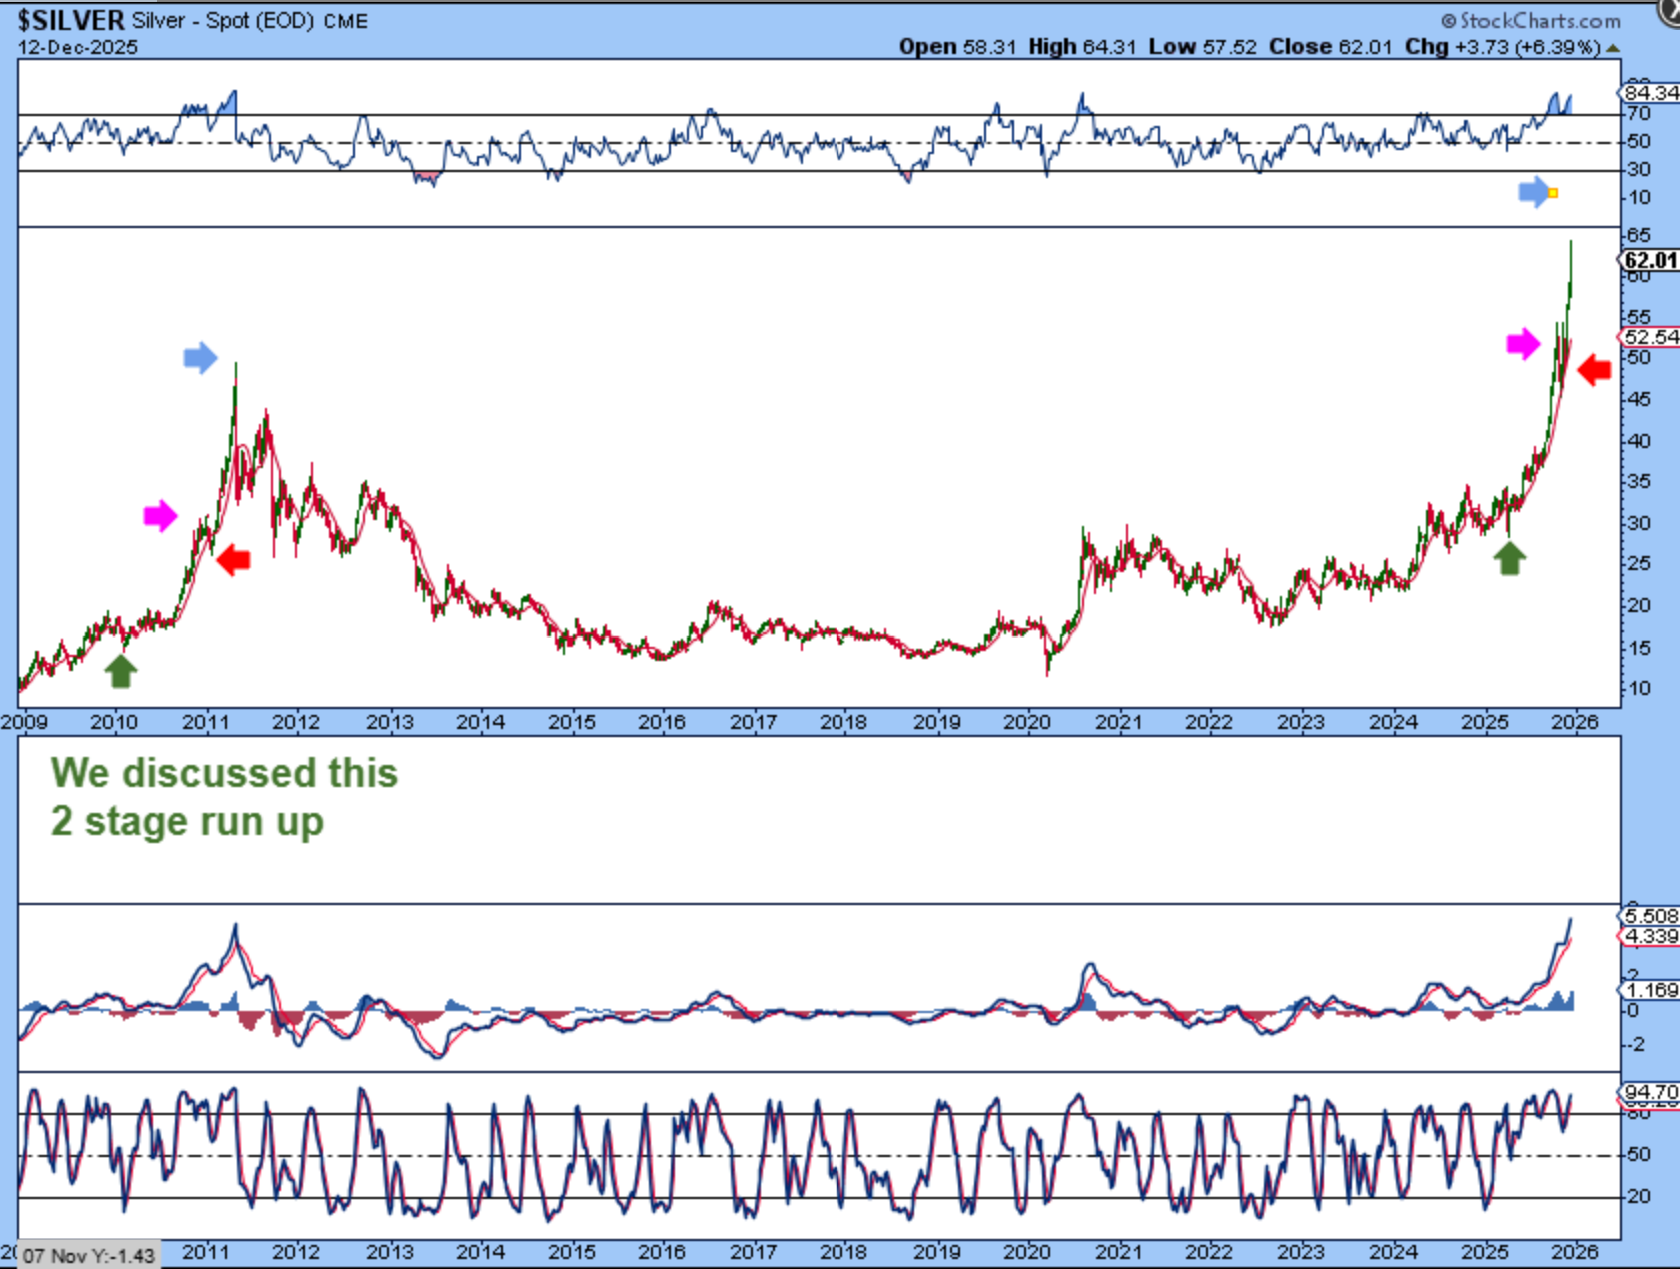
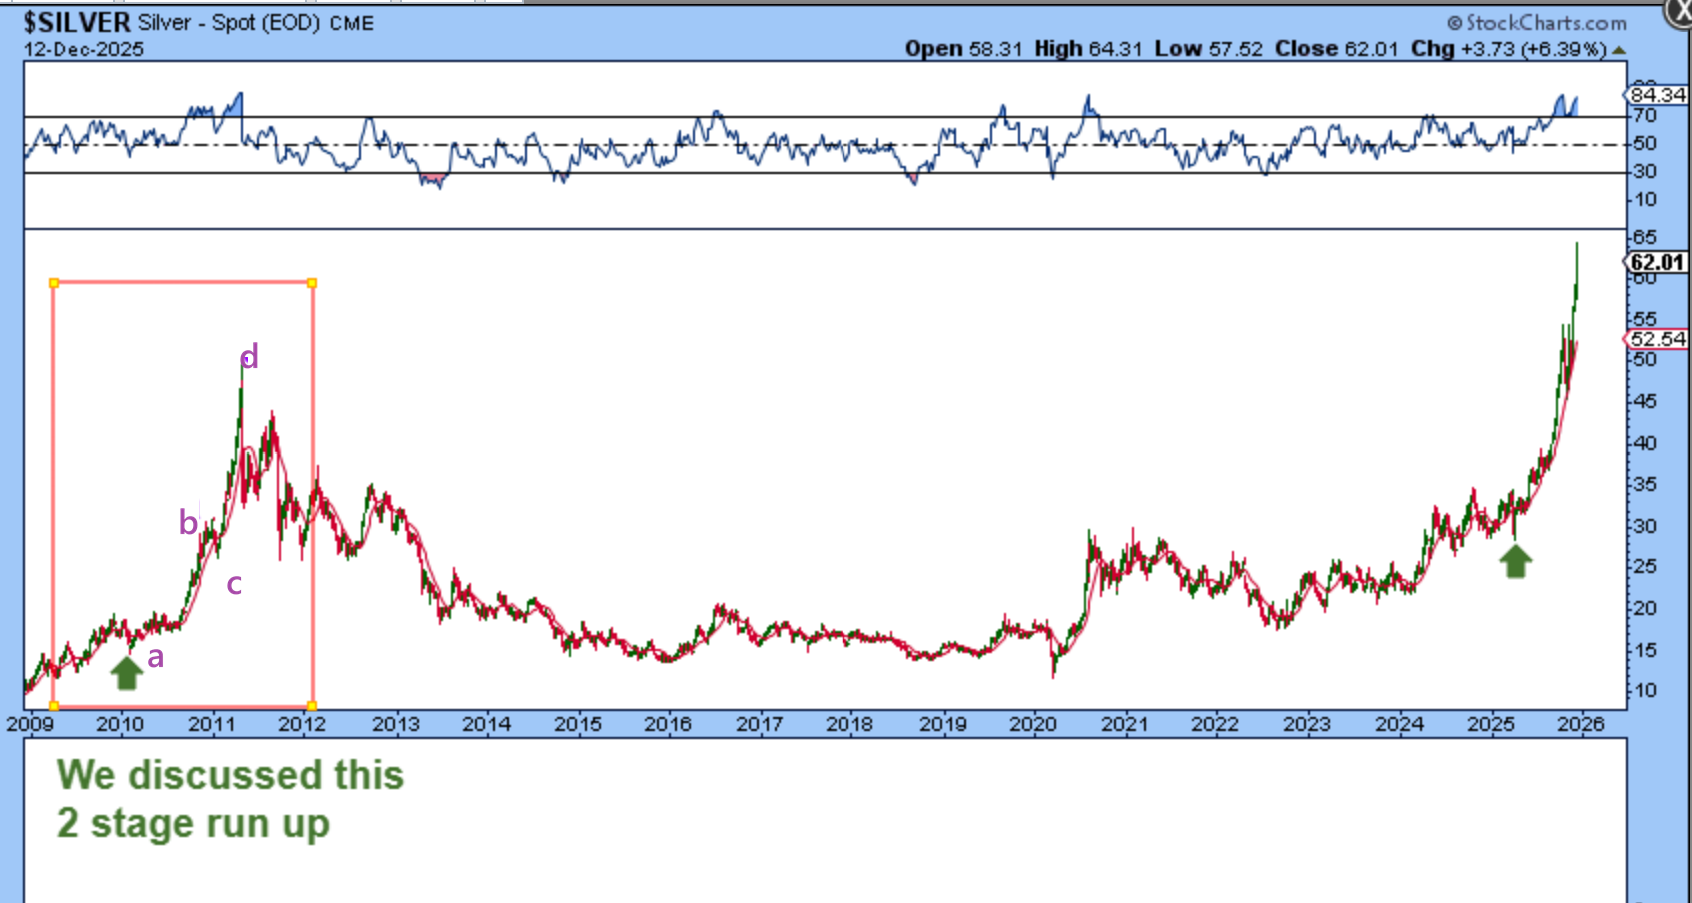
Is SILVER going parabolic? It may be, and as pointed out in prior reports, it does look similar to the 2010-2011 parabolic run.
.
In fact, take note of Silvers A-B = C-D pattern
.
SILVER also has a 2 stage rally here, where we could see A-B=C-D play out to a peak. As a weekly chart, this could have a few more weeks to go.
.
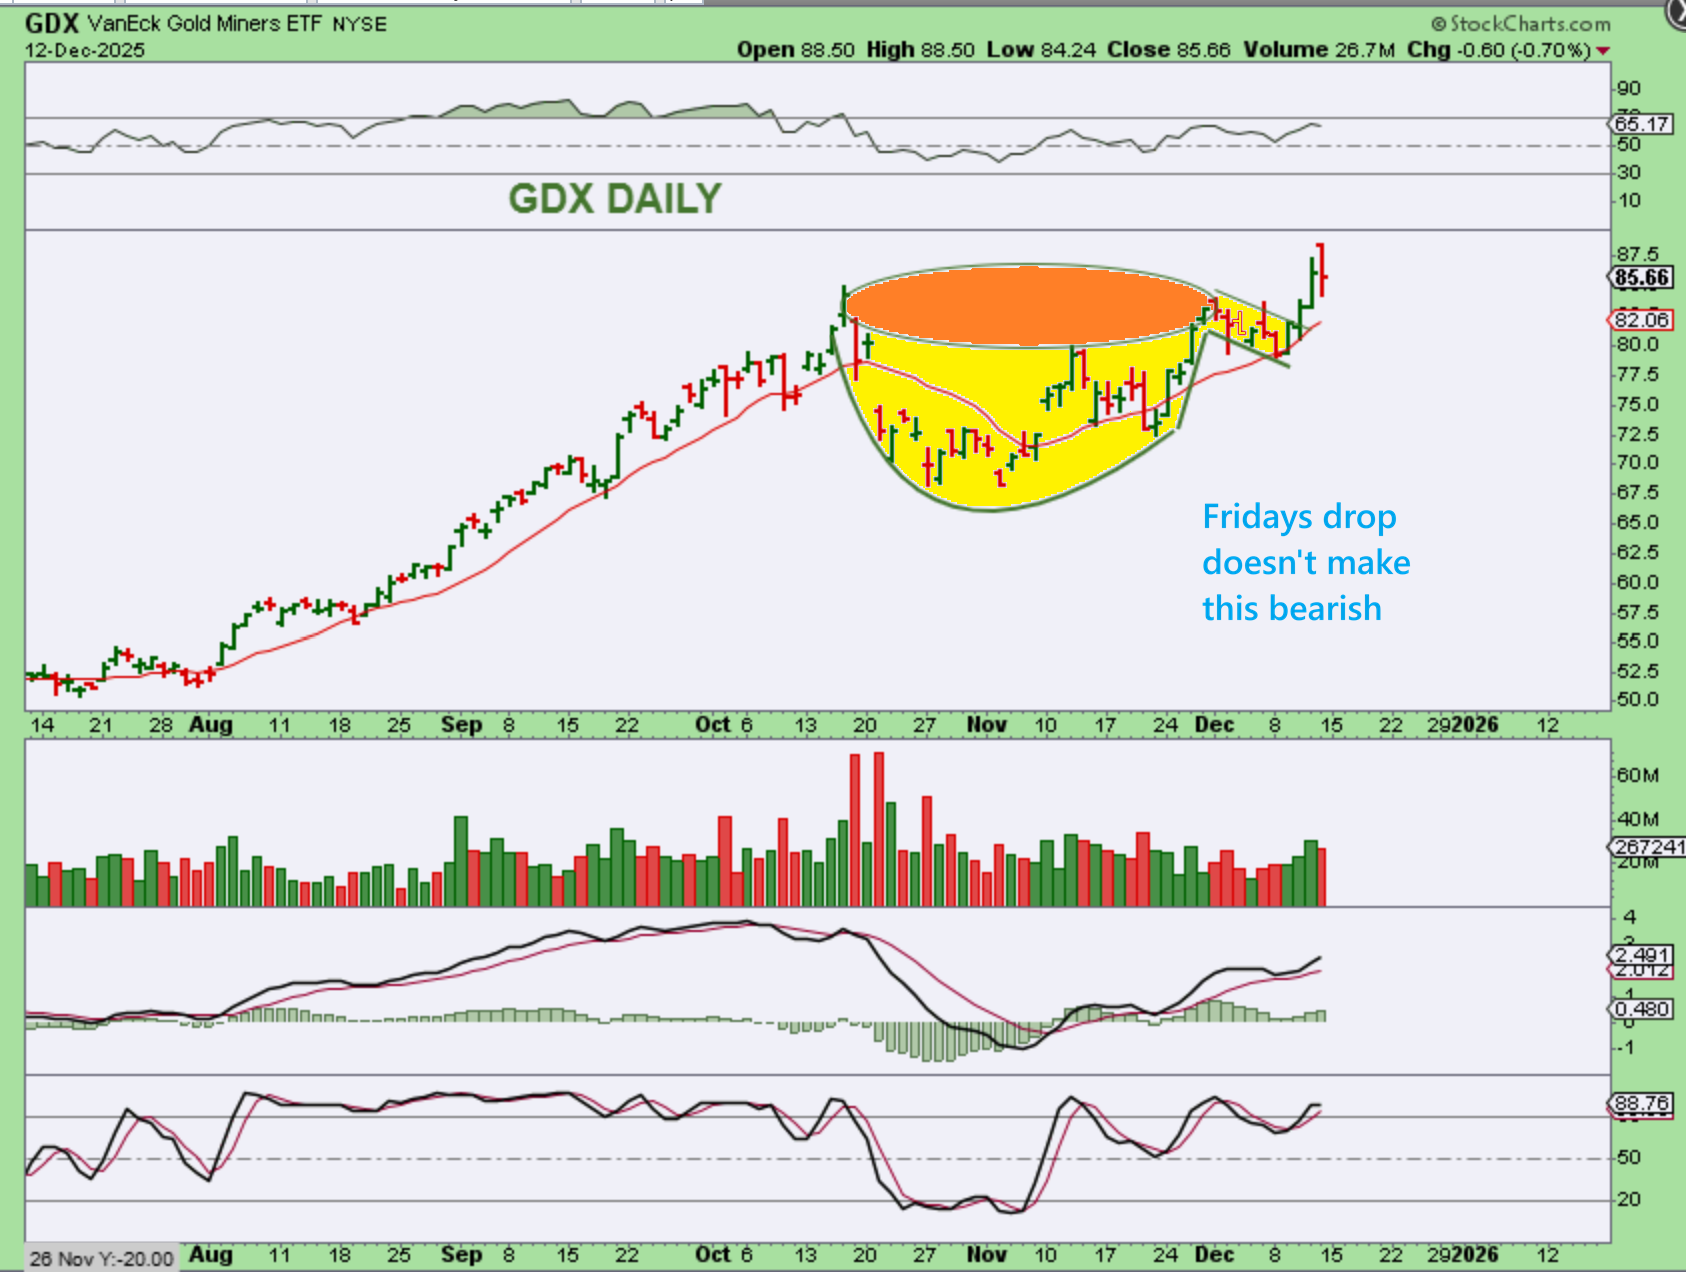
GDX gapped up higher and then sold off, but this remains a bullish set up.
.
So at this point, the markets look healthy, despite the pull back on Friday. The markets ran up heading into the Fed Mtg and then gave some back with some selling at the end of the week, but many individual charts still look bullish. The weekly charts also look bullish and would indicate that we started another intermediate cycle, so that should give us time for more upside. Bitcoin has remained weak so far, I will cover that below. Enjoy your Weekend!
.
~ALEX
.
BITCOIN DAILY- You’ll recall that Bitcoin had an extended sell off, showing extra weakness at that time. The count is now starting to reach that halfway point around day 30 out of the low, but so far Bitcoin has been unable to really surge higher.
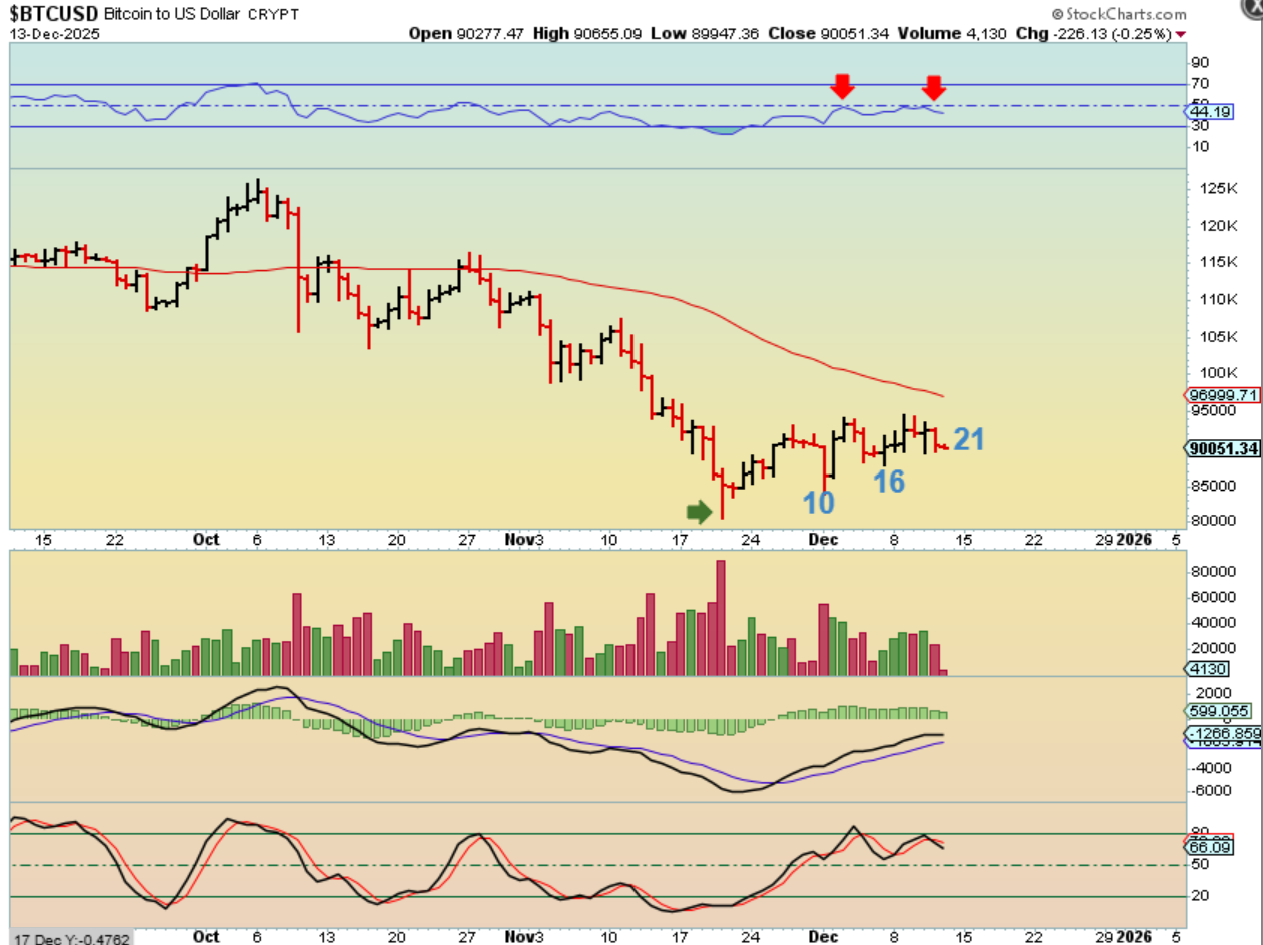
.
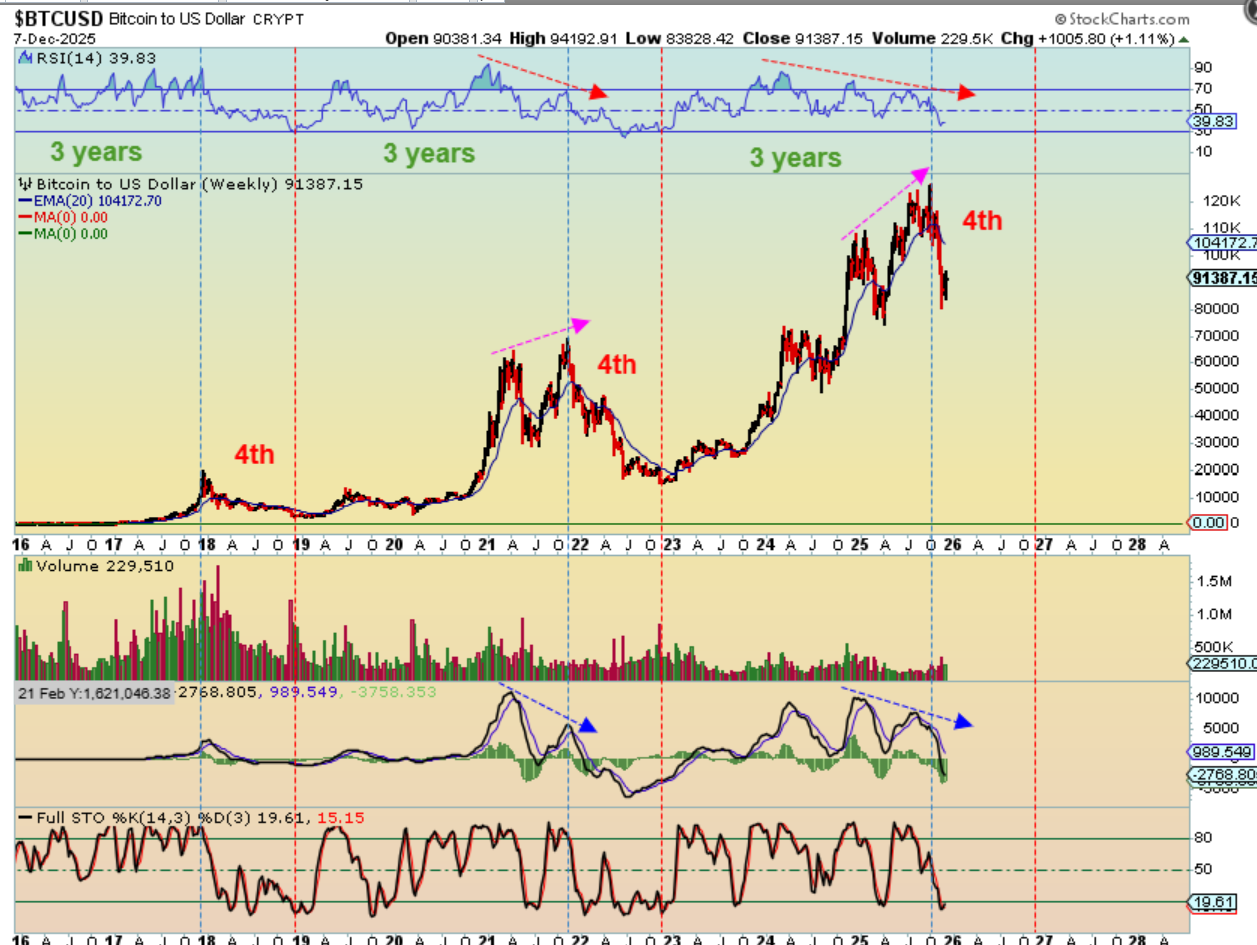
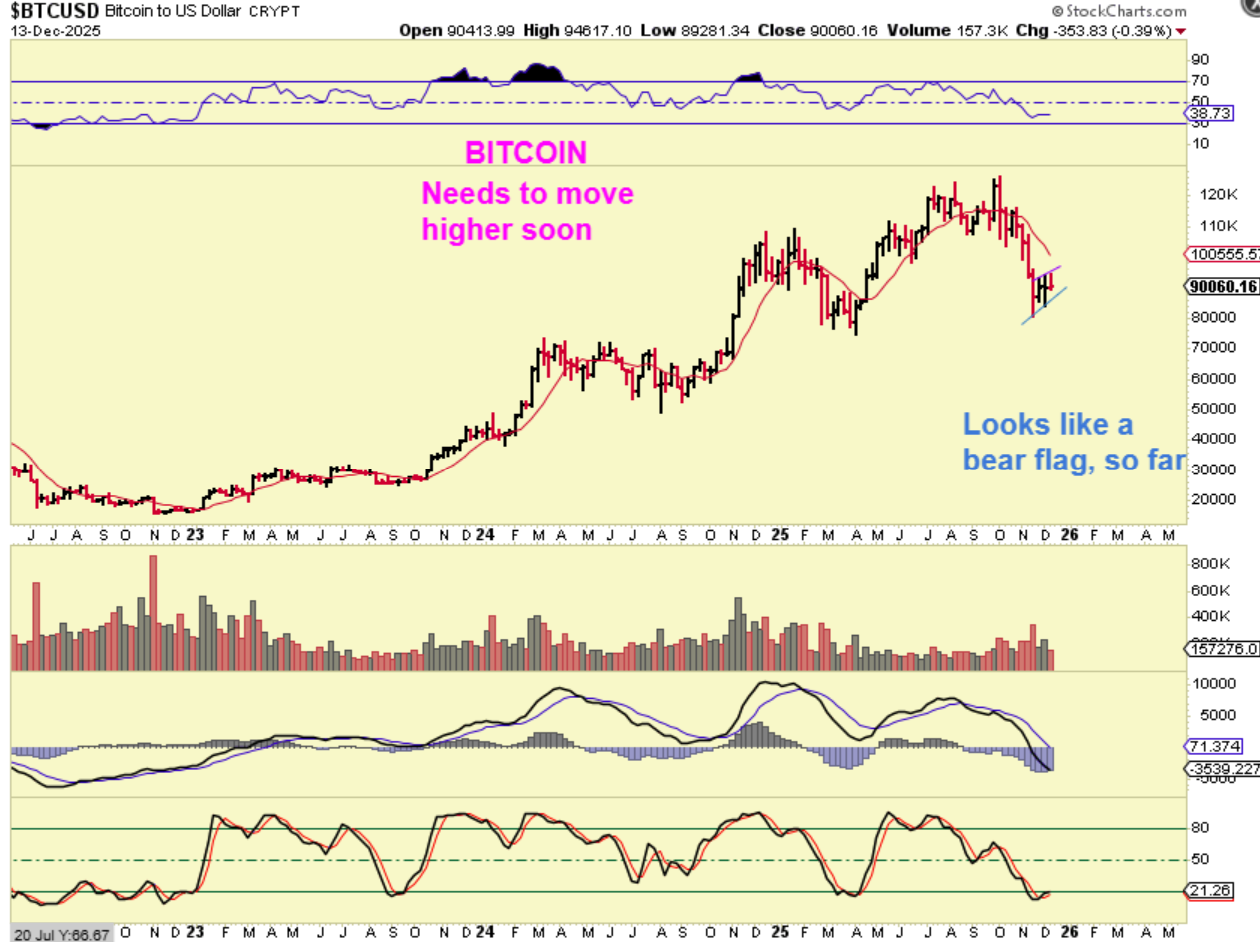
THE BITCOIN WEEKLY chart is starting to look like a bear flag, and this late in the 4 year cycle, we need to be cautious, because Bitcoin often sells off quickly in a 4th year of a 4 year cycle.
.
THE BITCOIN 4 year cycle: I drew this on Dec 7 th to show the bullishness in the first 3 years, and then suddenly Bitcoin crashes in the 4th year.