.
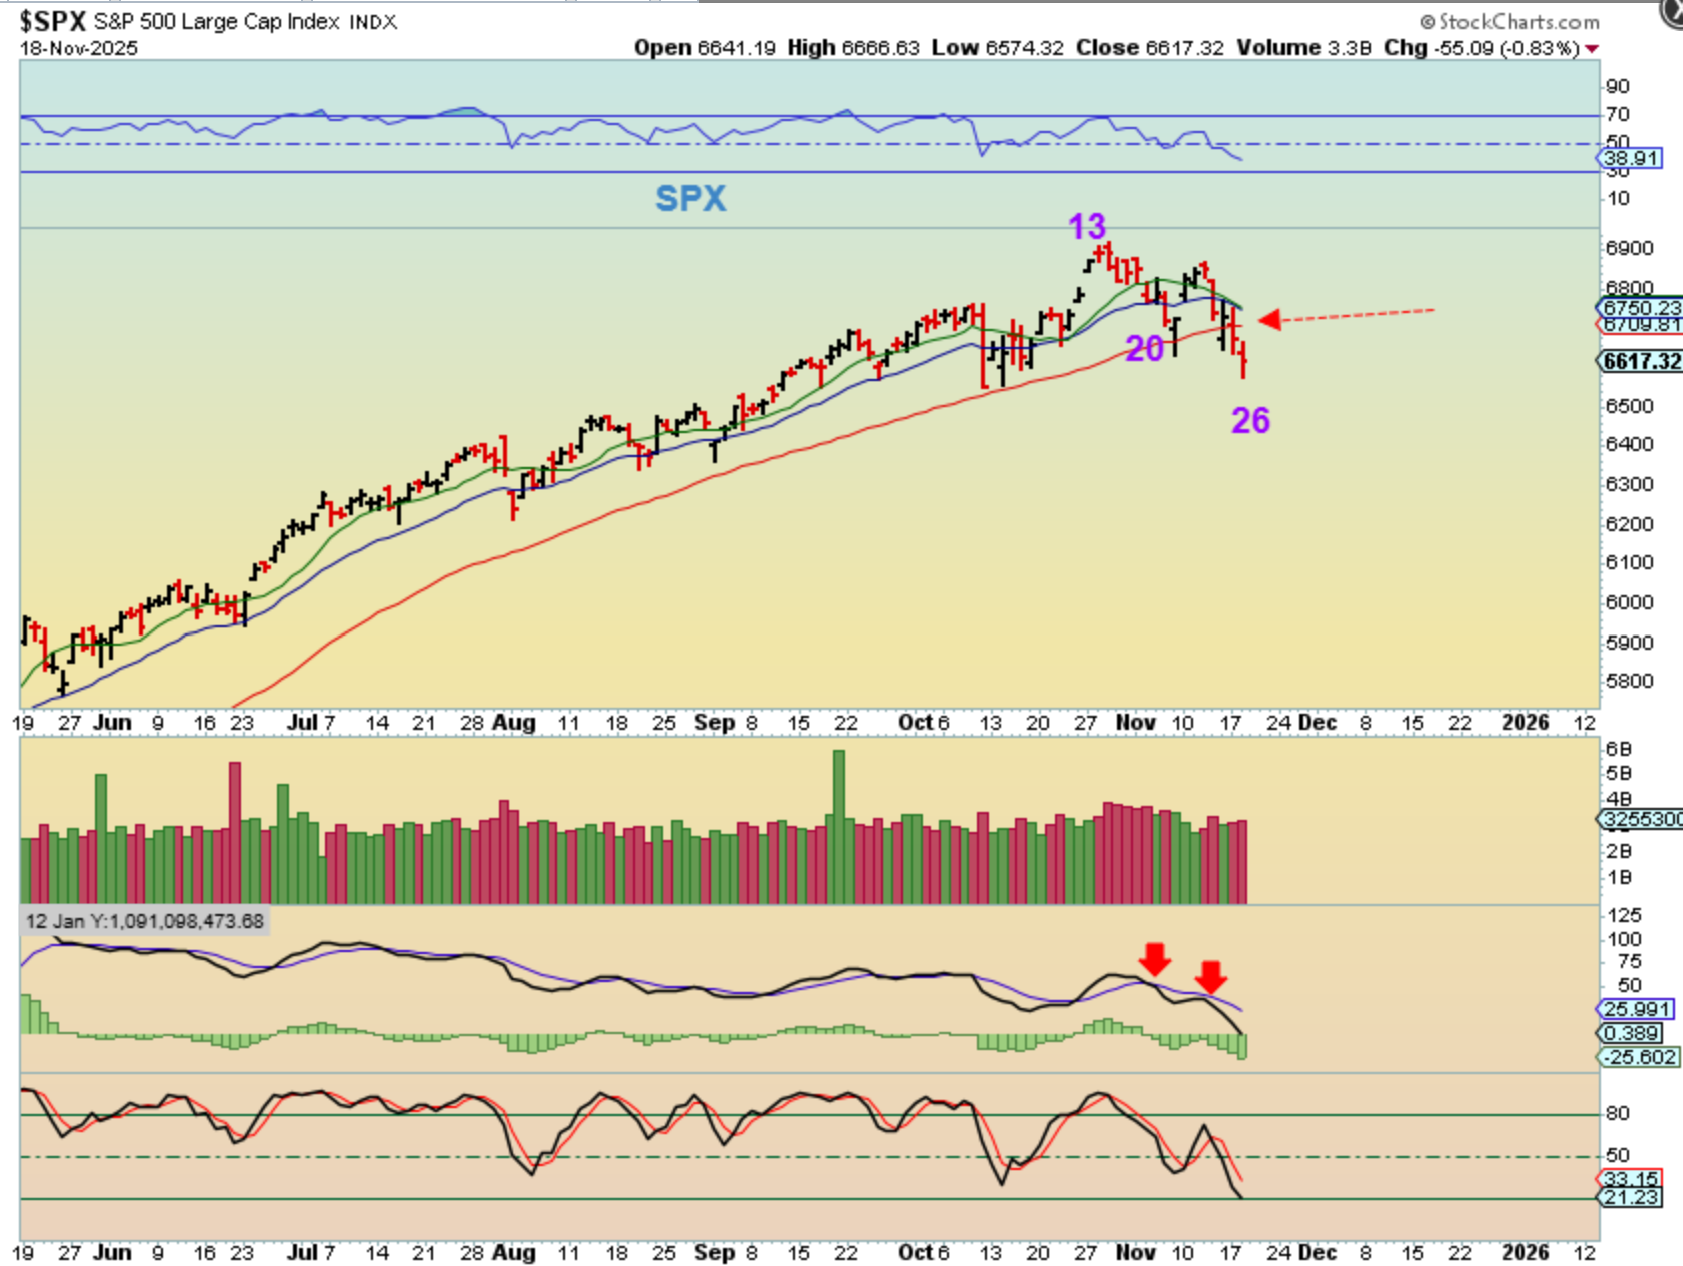
THE SPX was rejected at the 20ema on day 24 & 24 nd then lost the 50sma on day 25 & 26. Now we are getting Late in the daily cycle, but we still could have 10 days left or more, so the chances are that this could chop, maybe pop, but mostly drop for the next 10 days or so (day 36 low for example). If this bounces to the 20ema, I think that this would be an easy short, based on prior charts that I have drawn up…
.
If it bounces to the 20 ema, I’ll add to my short on a reversal lower. And that is based on prior charts that I have drawn up, like this one.
.
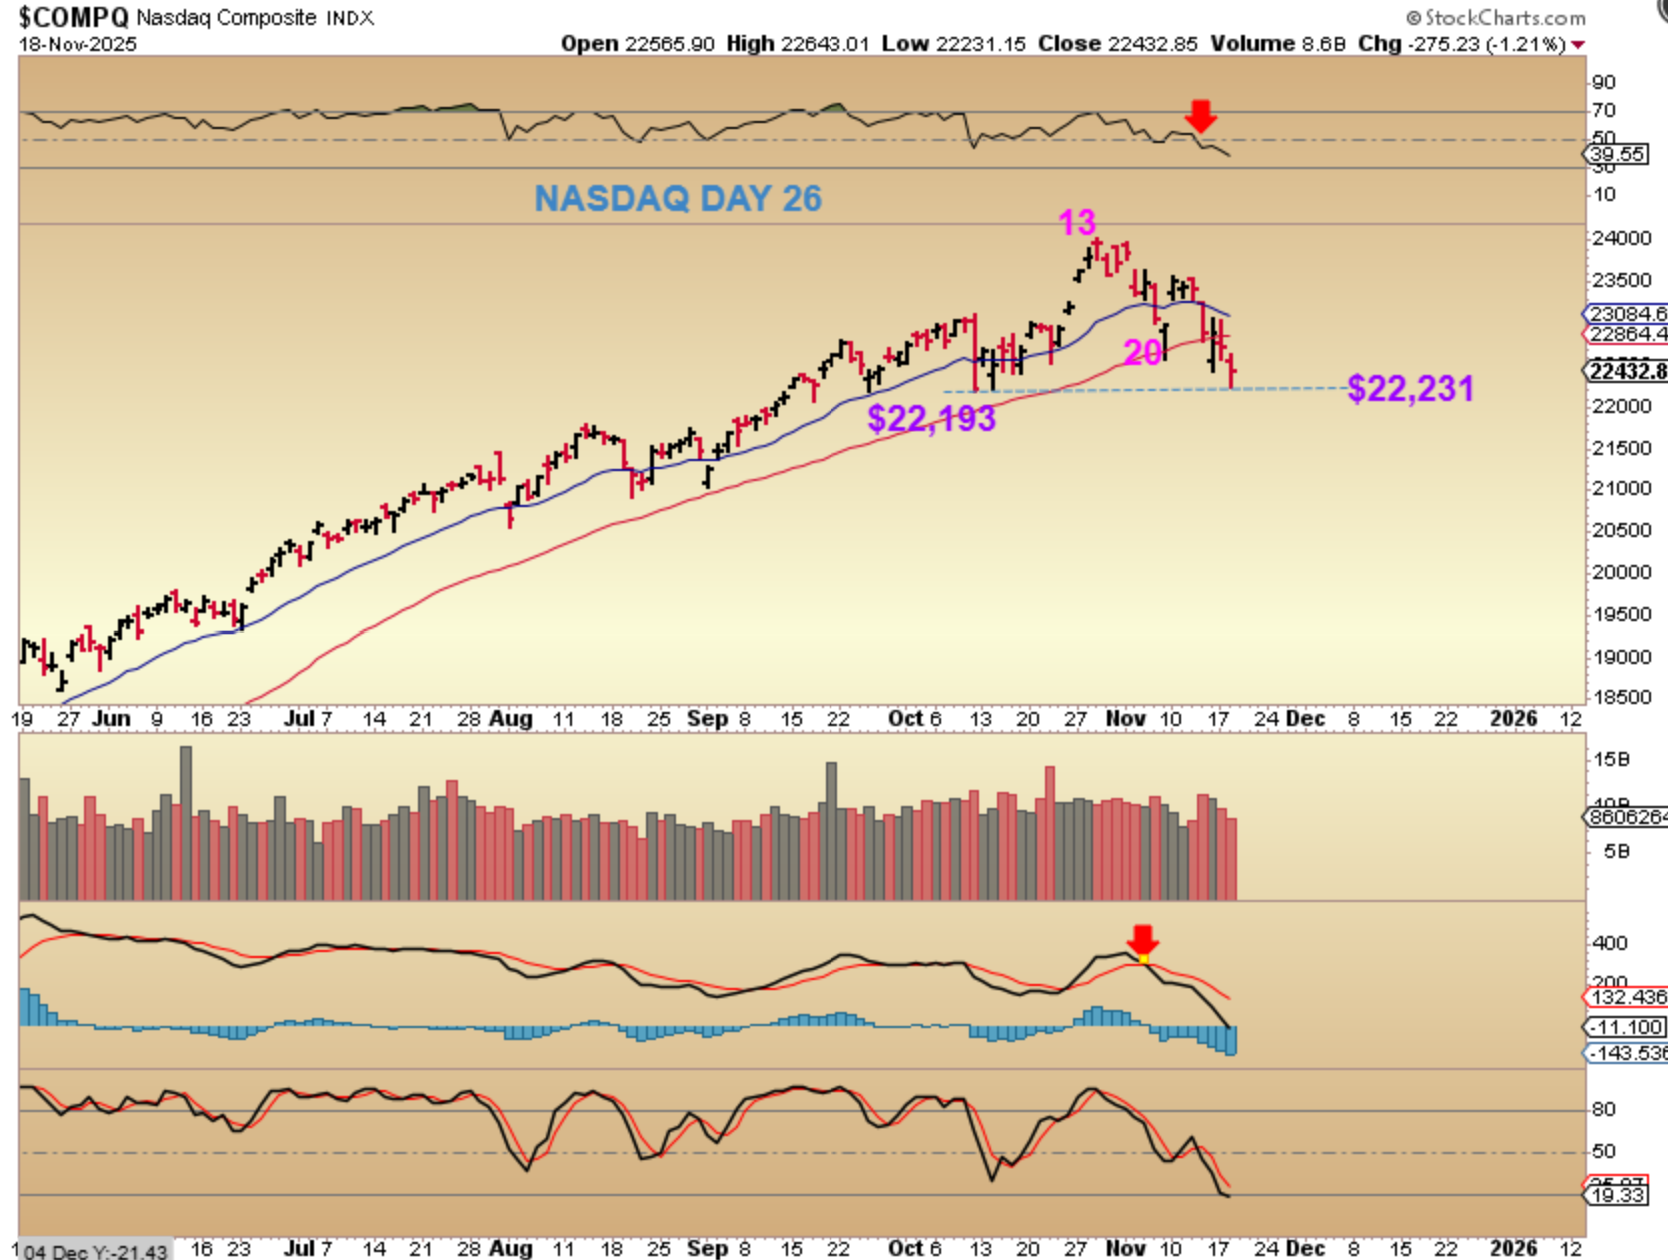
THE NASDAQ almost broke the lows and then bounced yesterday, but we still do not have a broken / failed daily cycle. It looks weak though right? Do we think that anyone else notices? Look at the MACD and RSI. Do you think that heavily invested smart money sees this rolling over? I think that people will start to see what we already know—this is eventually going to break down. Sellers might start to show up in earnest later this week or next week. I am starter short as of day 25 and will add on a bounce & reversal at this point.
.
THAT BEING SAID, SOME AREAS DO LOOK BULLISH:
.
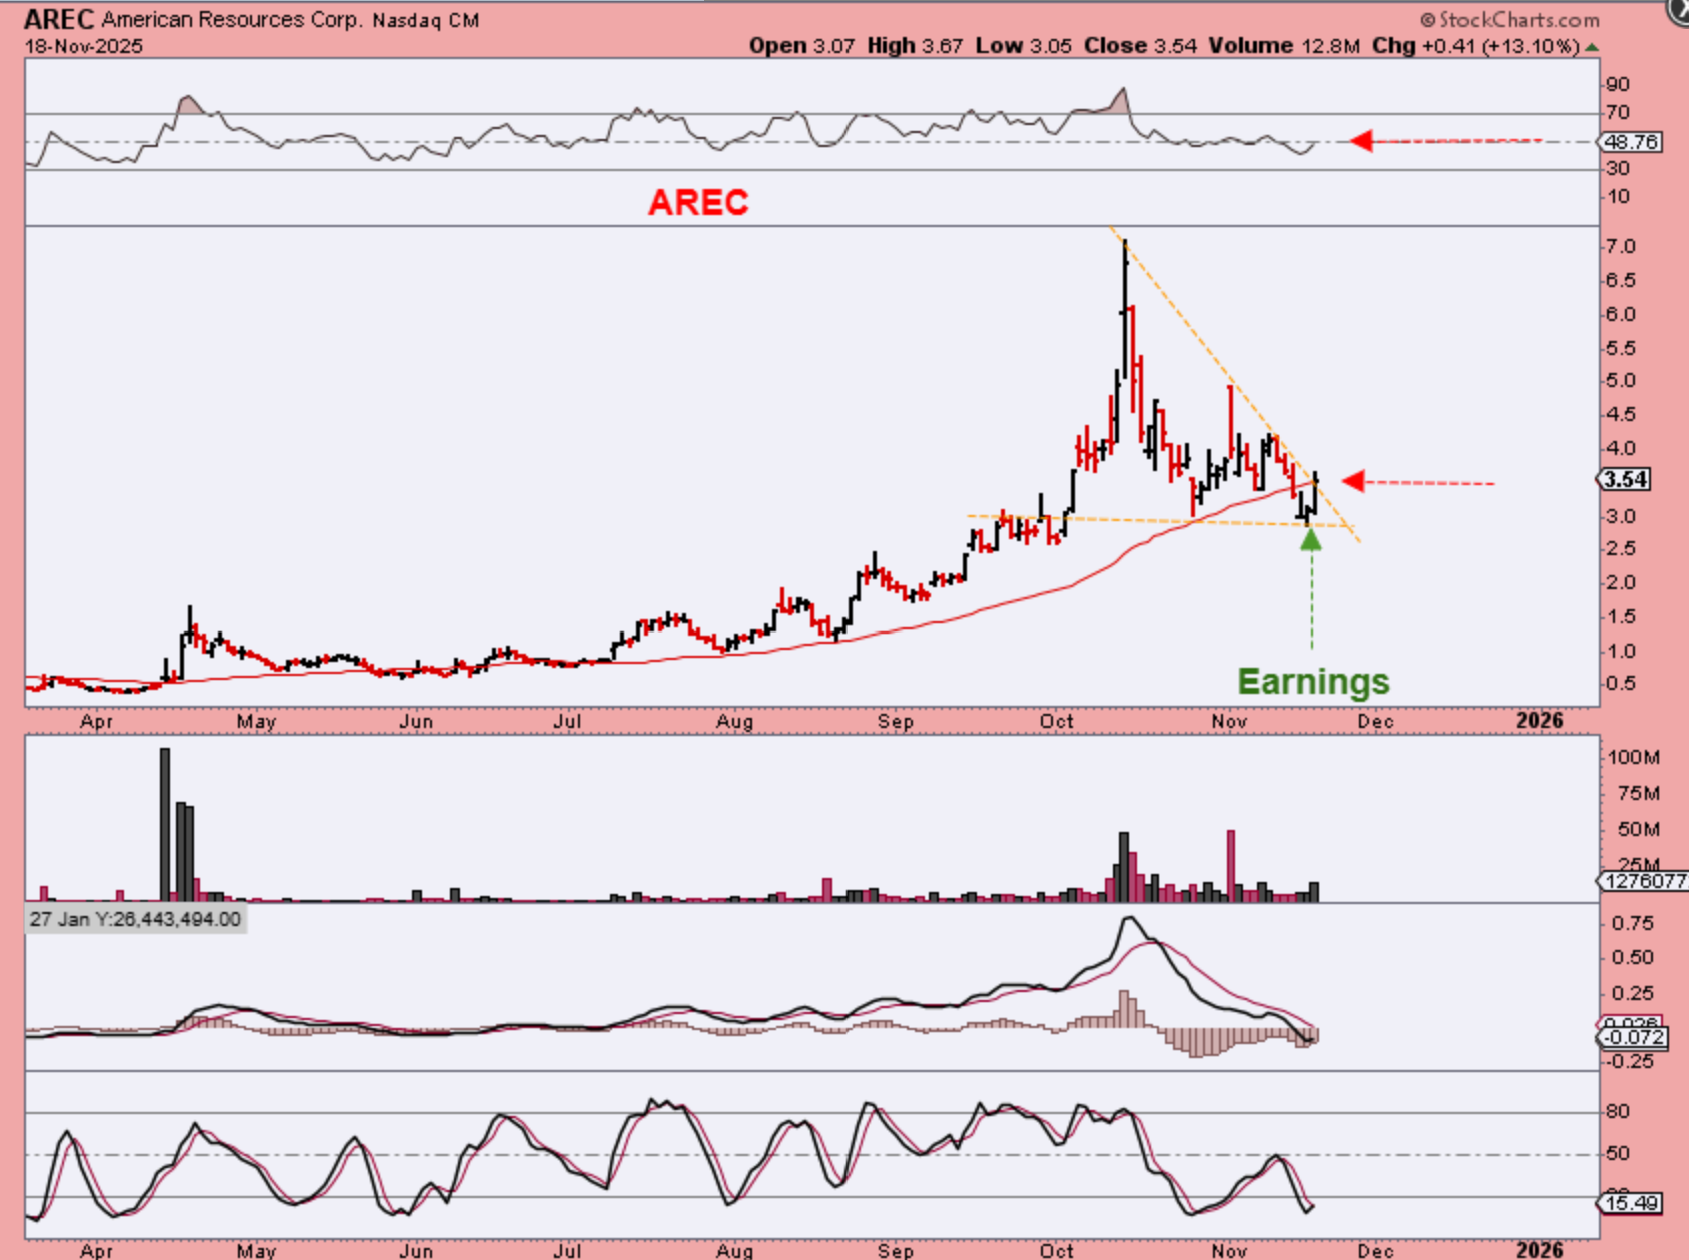
AREC (Rare Earth) released earnings and went green Monday and Tuesday. I didn’t buy this, but it regained the 50sma, so buying here gives you a good tight stop. I may buy this, after all, $3.50 back to the highs of $7 is a double. 🙂
.
Do you read the comments? *BeeKeeper has been mentioning maritime or shippers (thanks BeeKeeper!), and they have an interesting set up. Why?
I have a large watchlist of shippers and when I ran through the charts, I noticed that they seem to bottom in OCTOBER with OILS ICL. If that is THEIR ICL, then we are early in their intermediate cycle. I’ll show you some of my favorite looking charts…
.
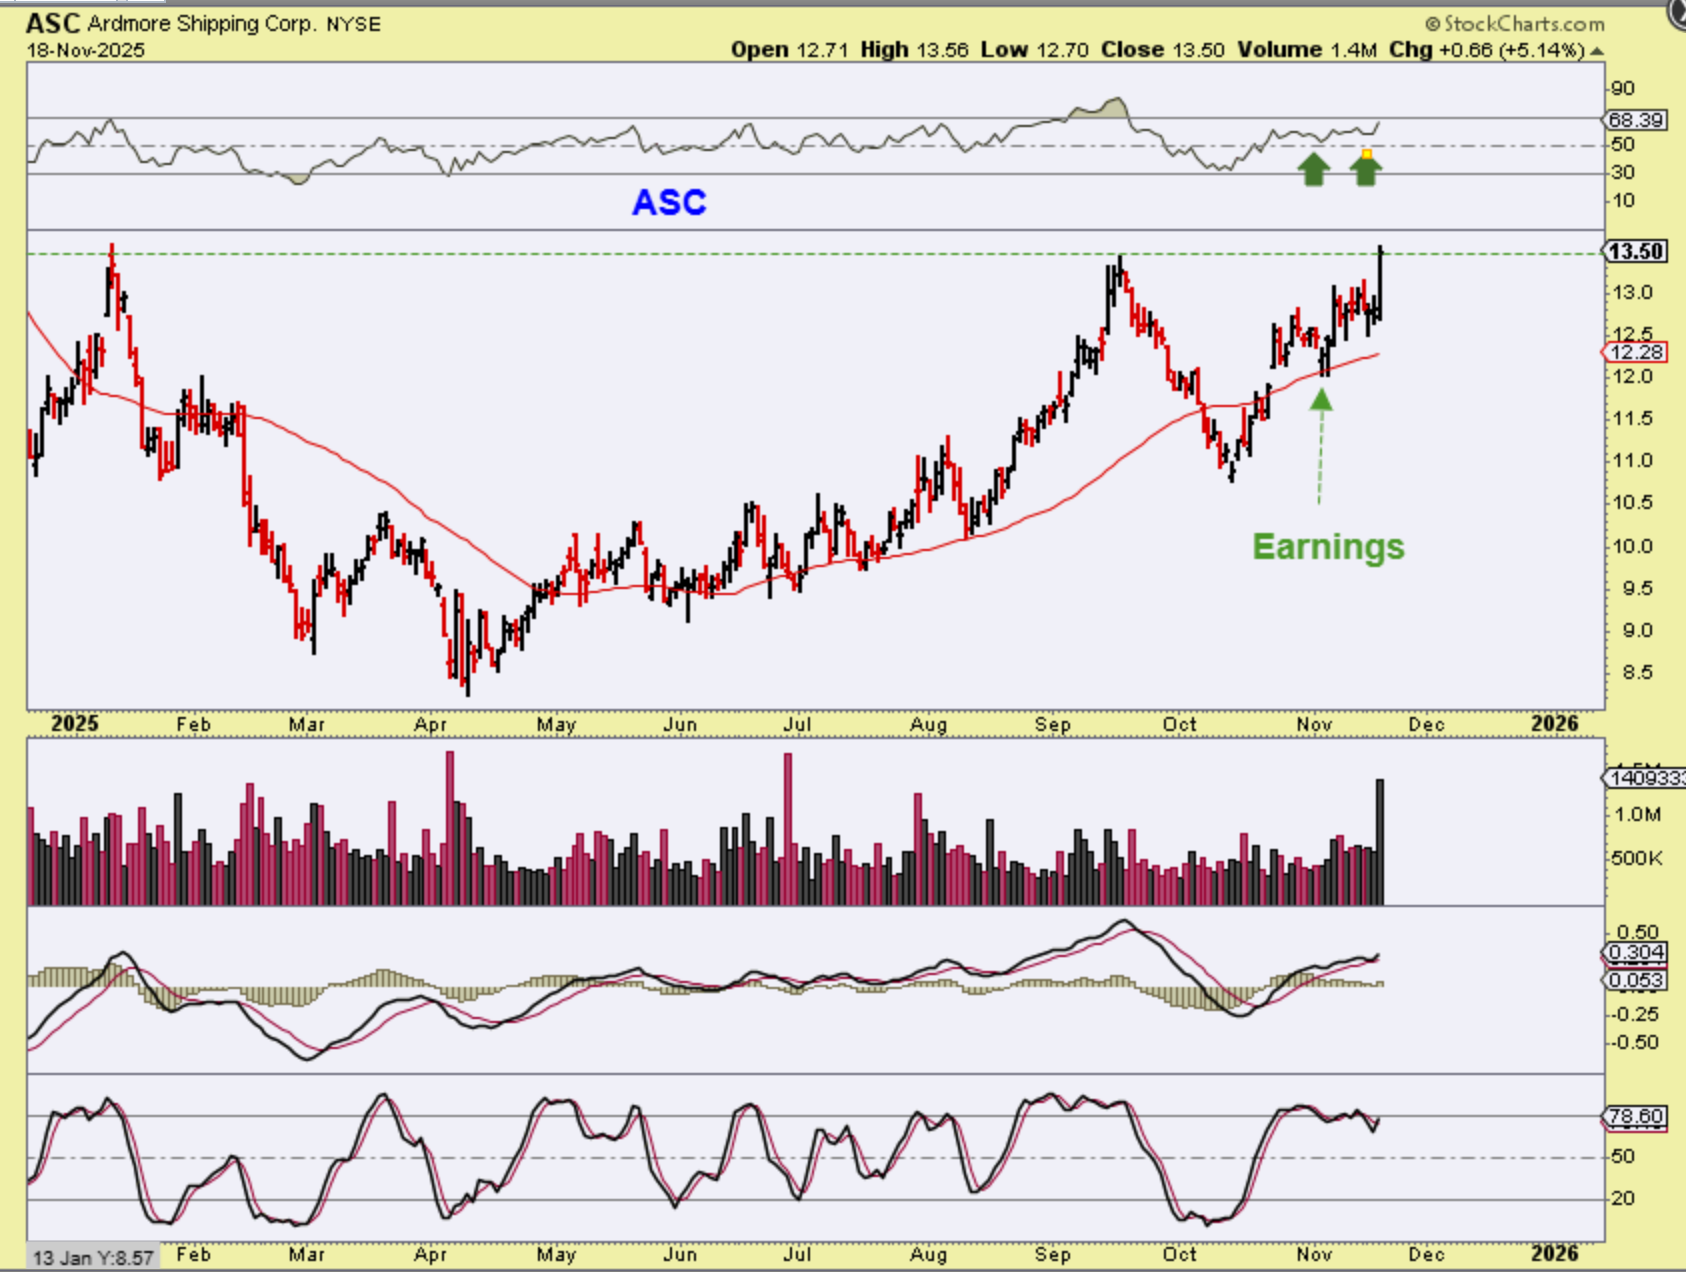
ASC was on my watchlist and it just released earnings and has been chopping higher ever since. The set up and this chart is bullish, so I wanted to step back and look at the bigger picture too.
.
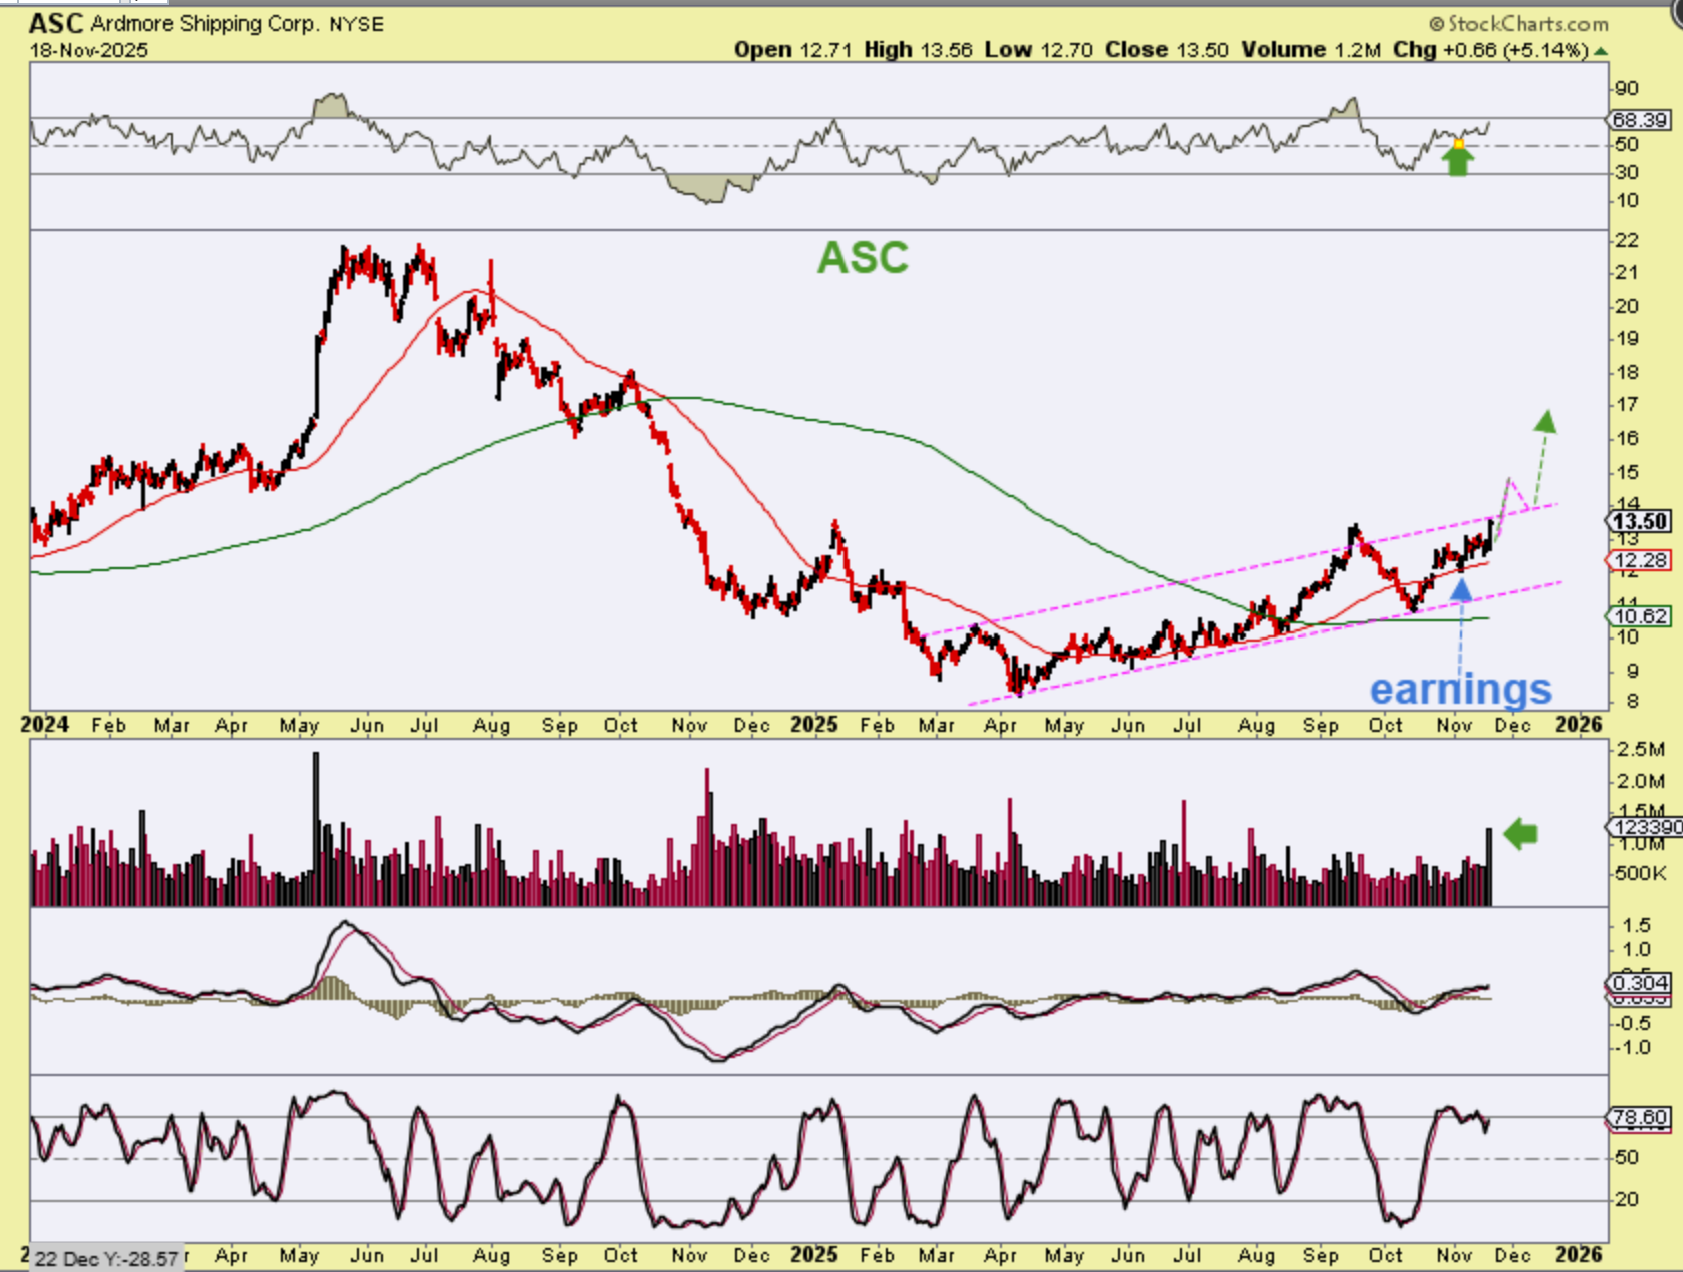
ASC has good upside potential. ASC is a transporter of petroleum products and dropped with Oil, but it is now in a base and breaking out from a base (oil is in a base too). The volume increased today, so it may be ready to break out. This is not selling off with the general markets.
.
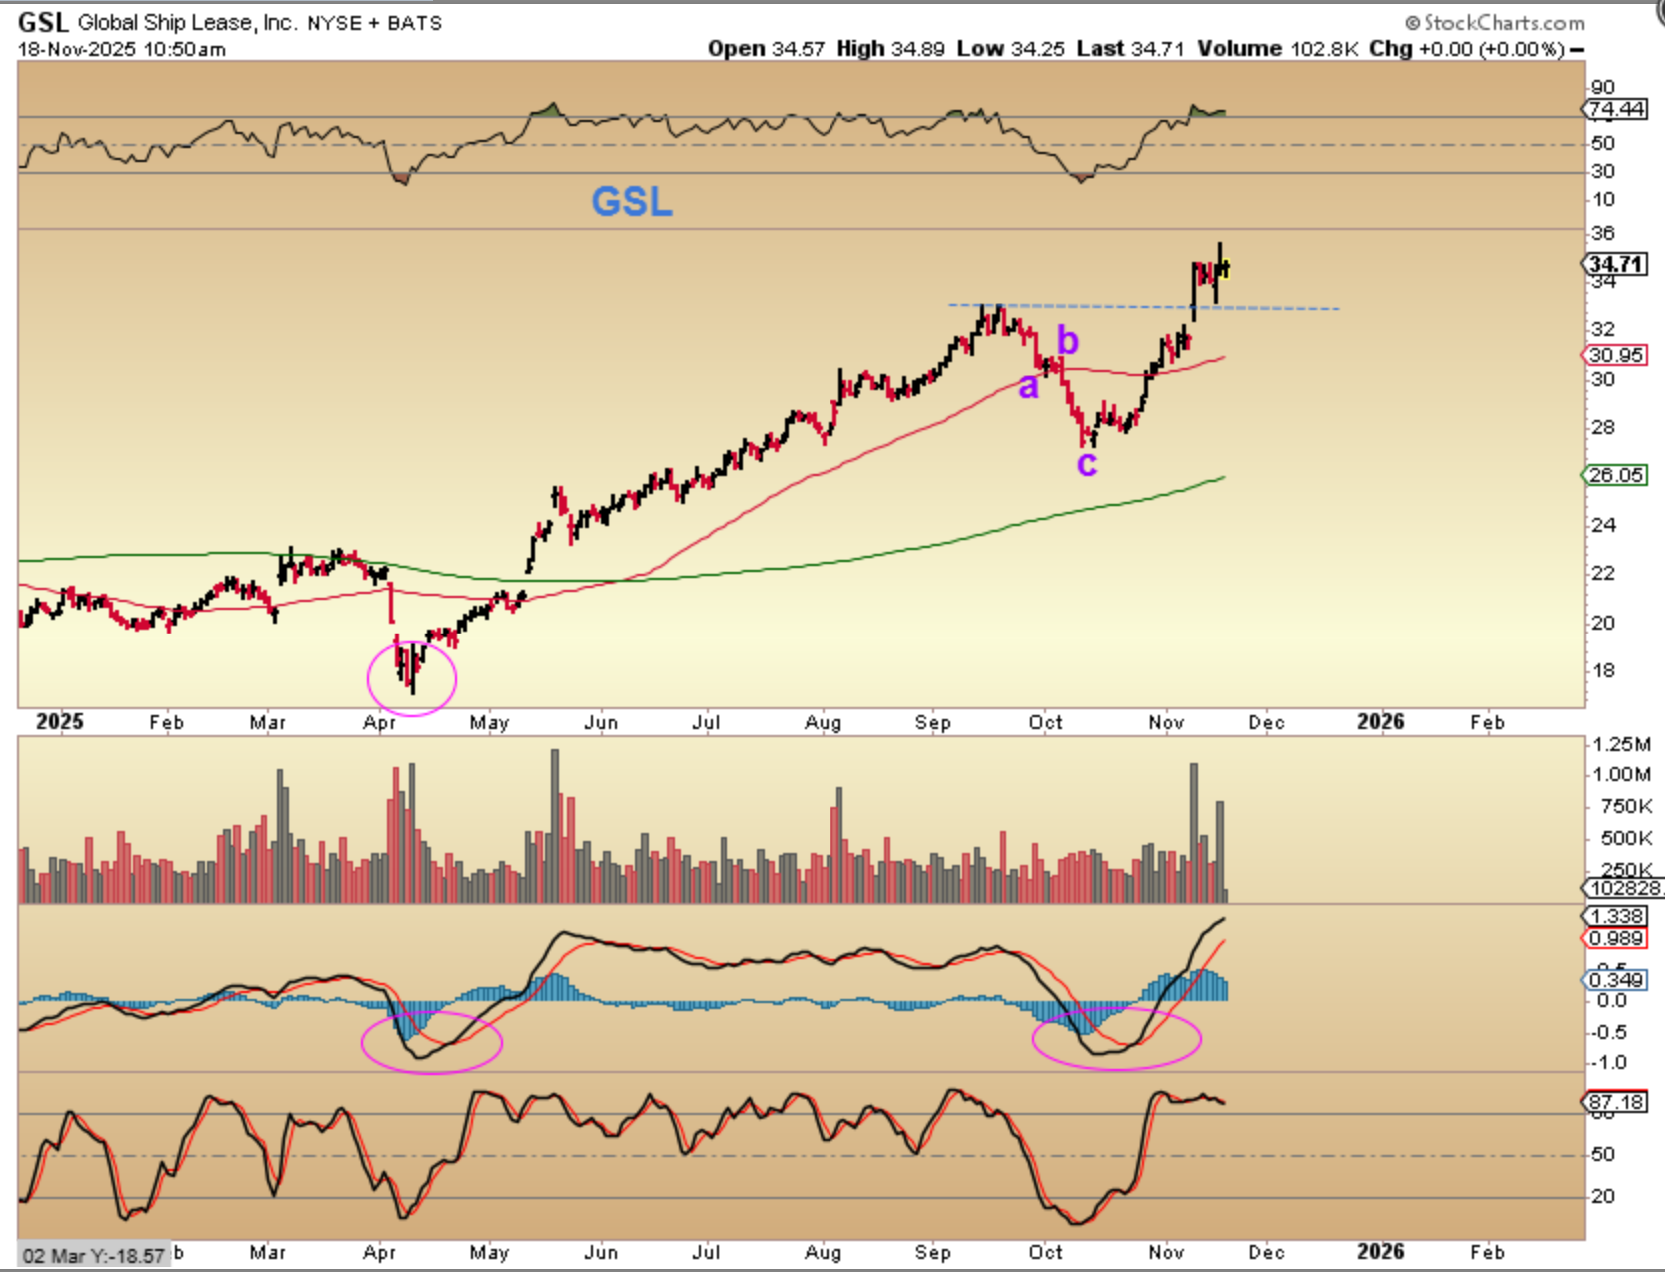
GSL looks like an a-b-c dip into an ICL may have taken place too. It then V-Bottomed and took off higher. Volume is spiking and it is pushing higher. It MIGHT pull back, because it has been running higher for a few weeks, but that also could continue, similar to what we saw with IAG, KGC, etc in the Precious Metals run. This is not selling off with the general markets.
.
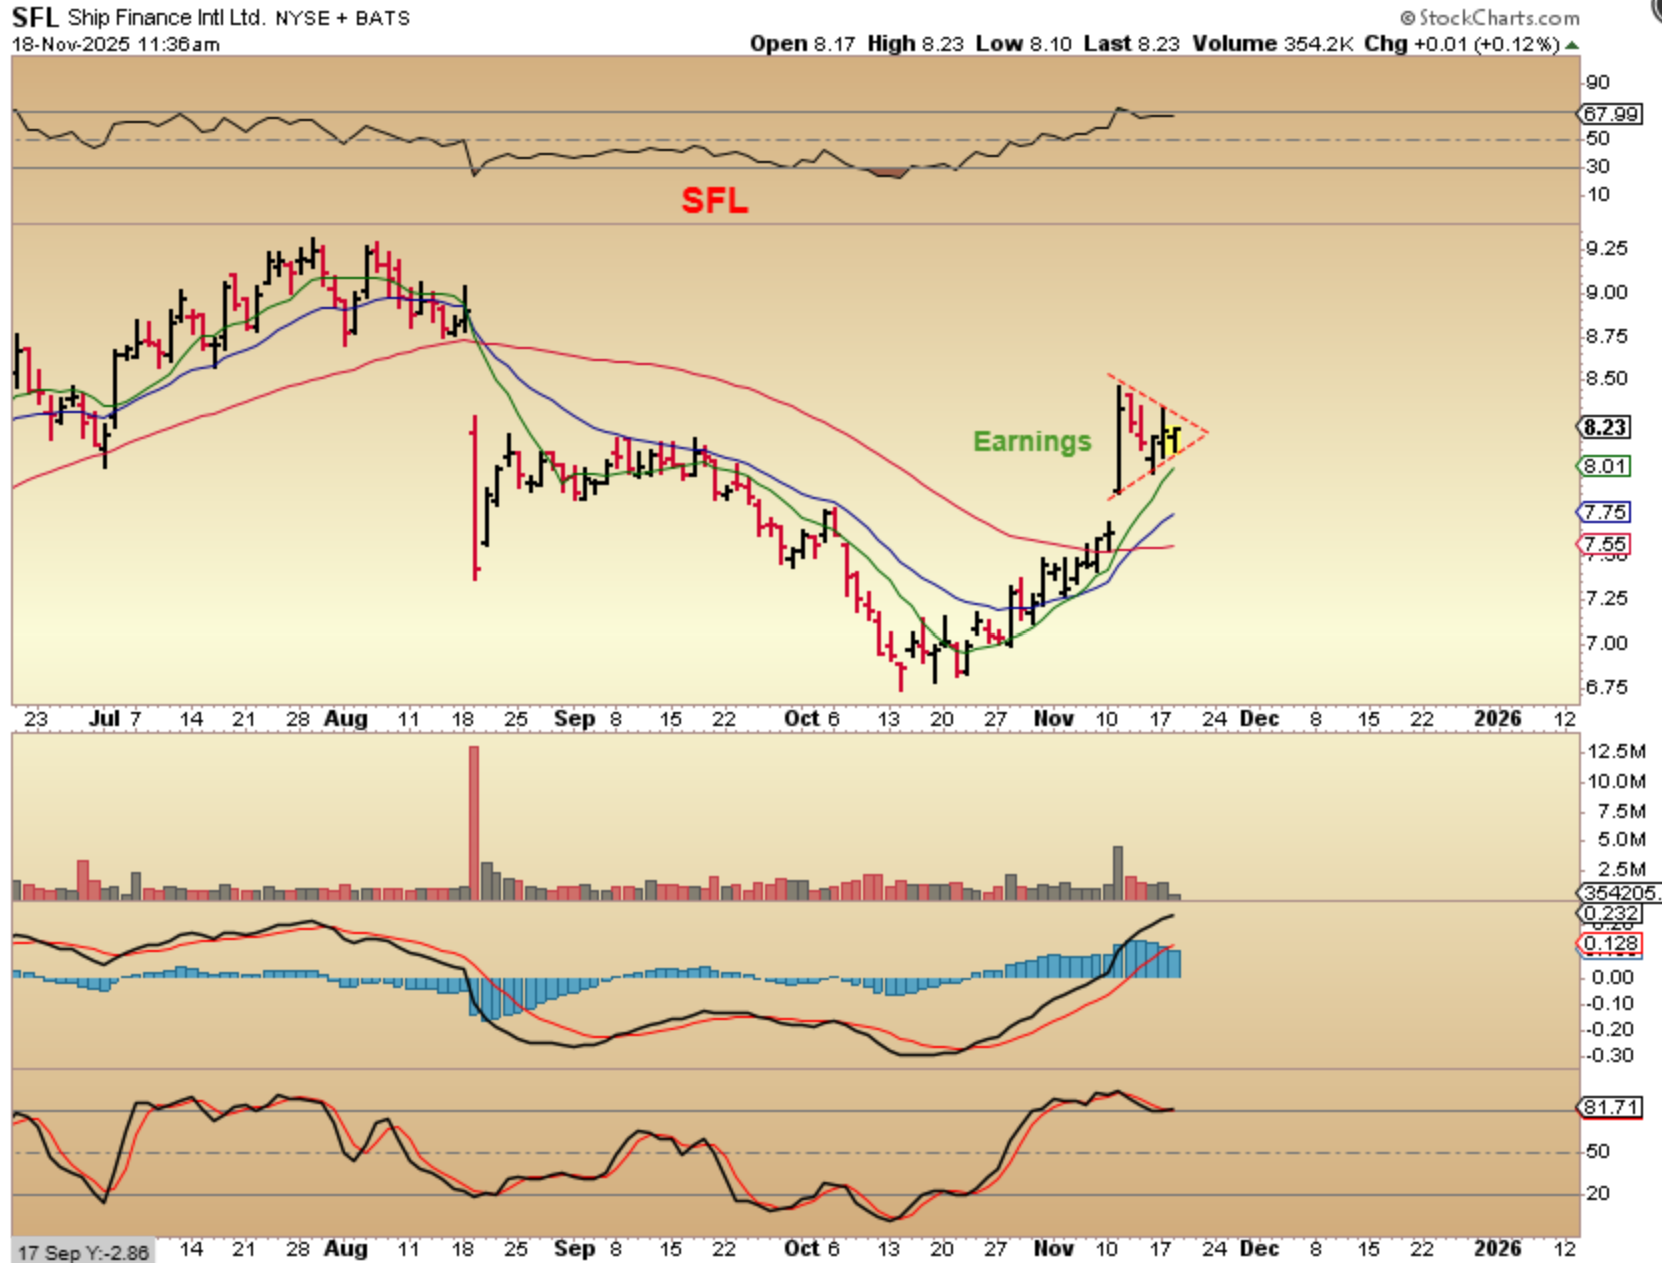
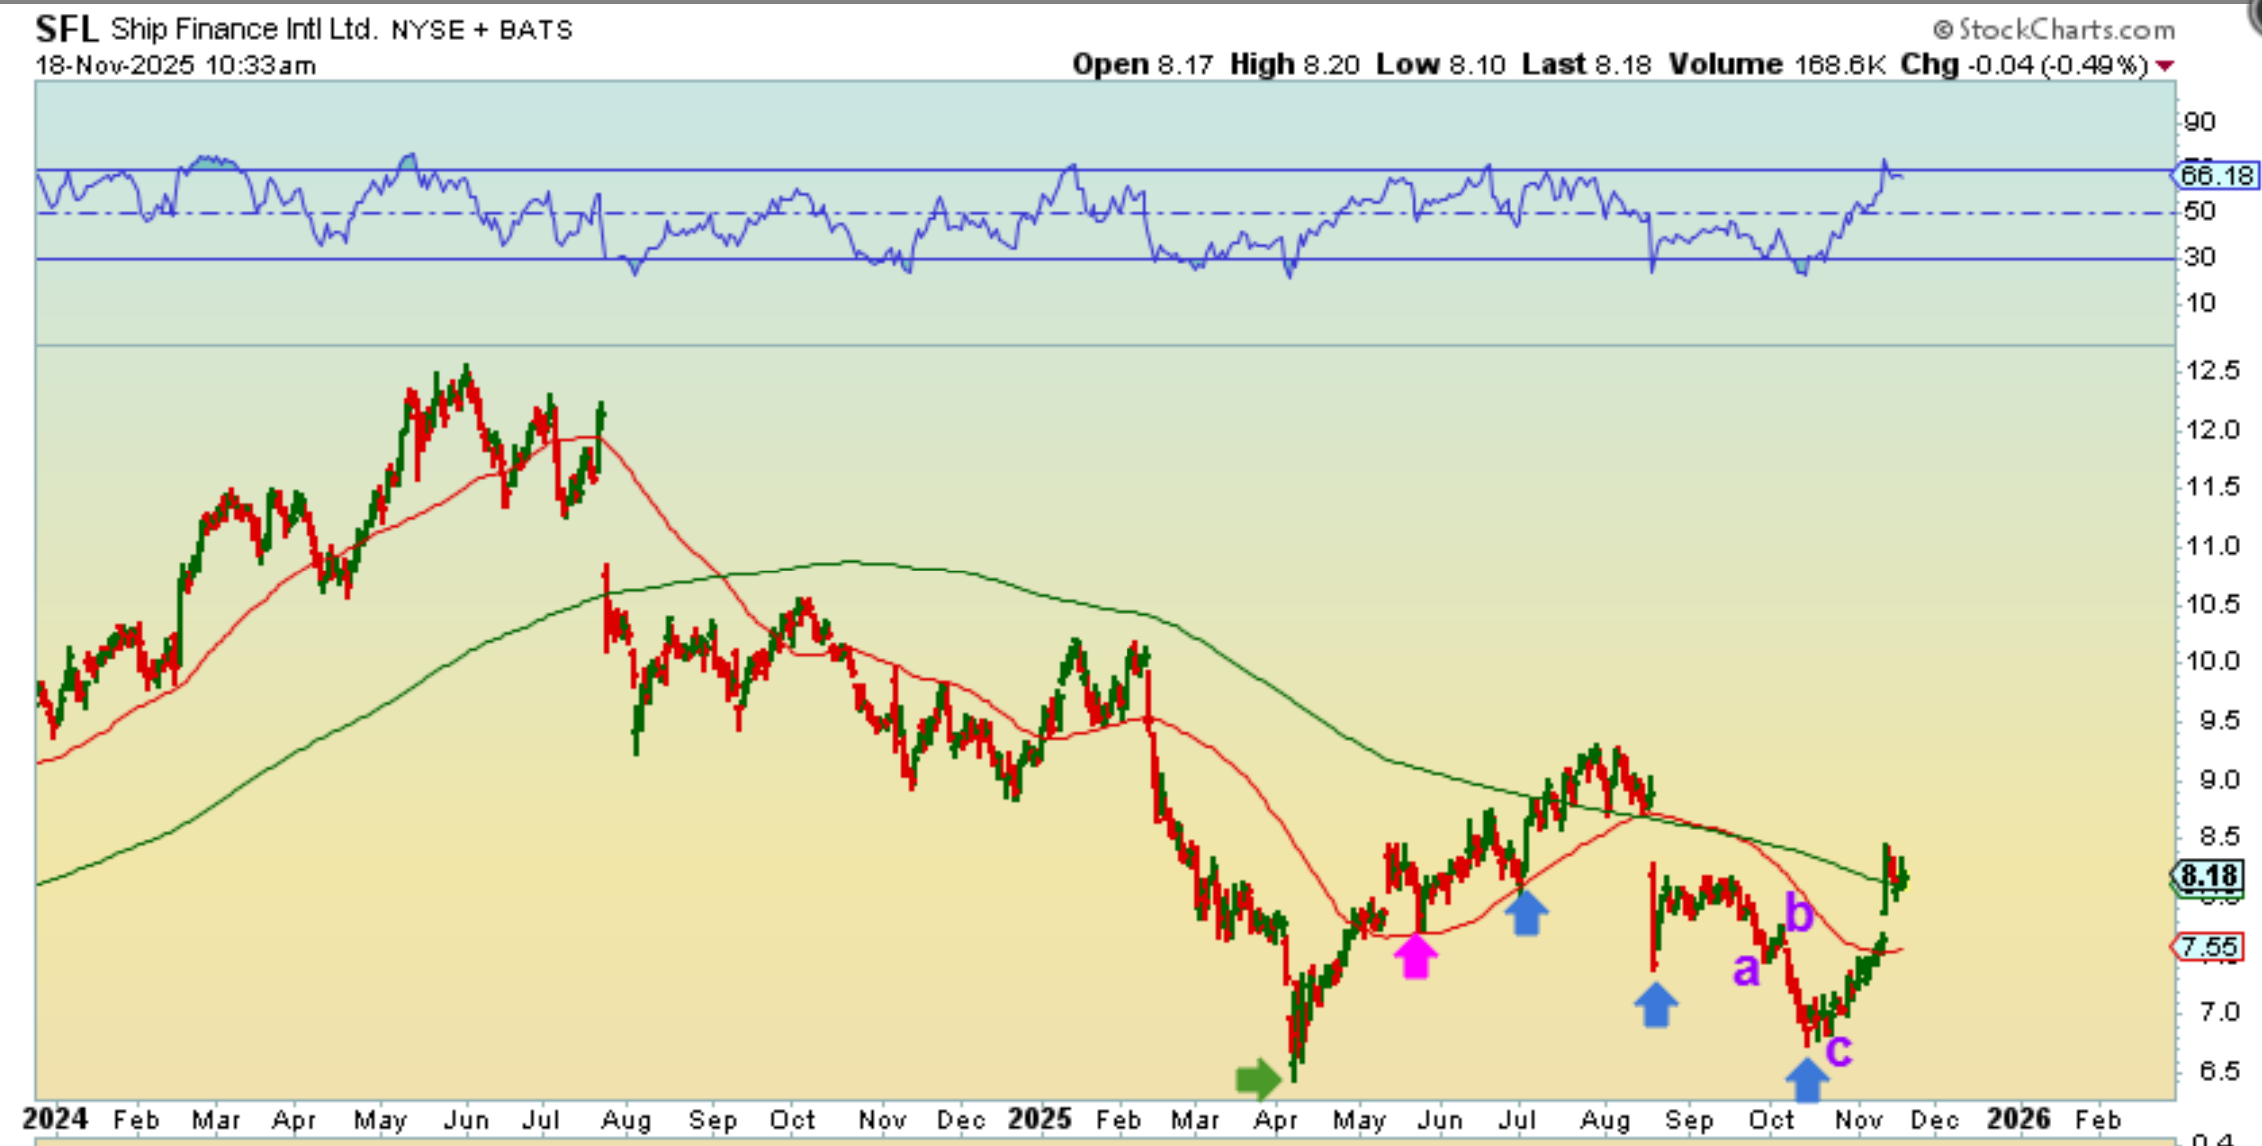
SFL has formed a triangle or pennant after an earnings Pop. Notice that this is not selling off with the general markets…
.
The bigger picture for SFL shows a long sell off (many did sell off like this), and now it is recovering the 200sma. I see a larger a-b-c drop or the smaller one that I pointed out, but I am thinking that many if these had their ICL with Oils last low in October.
.
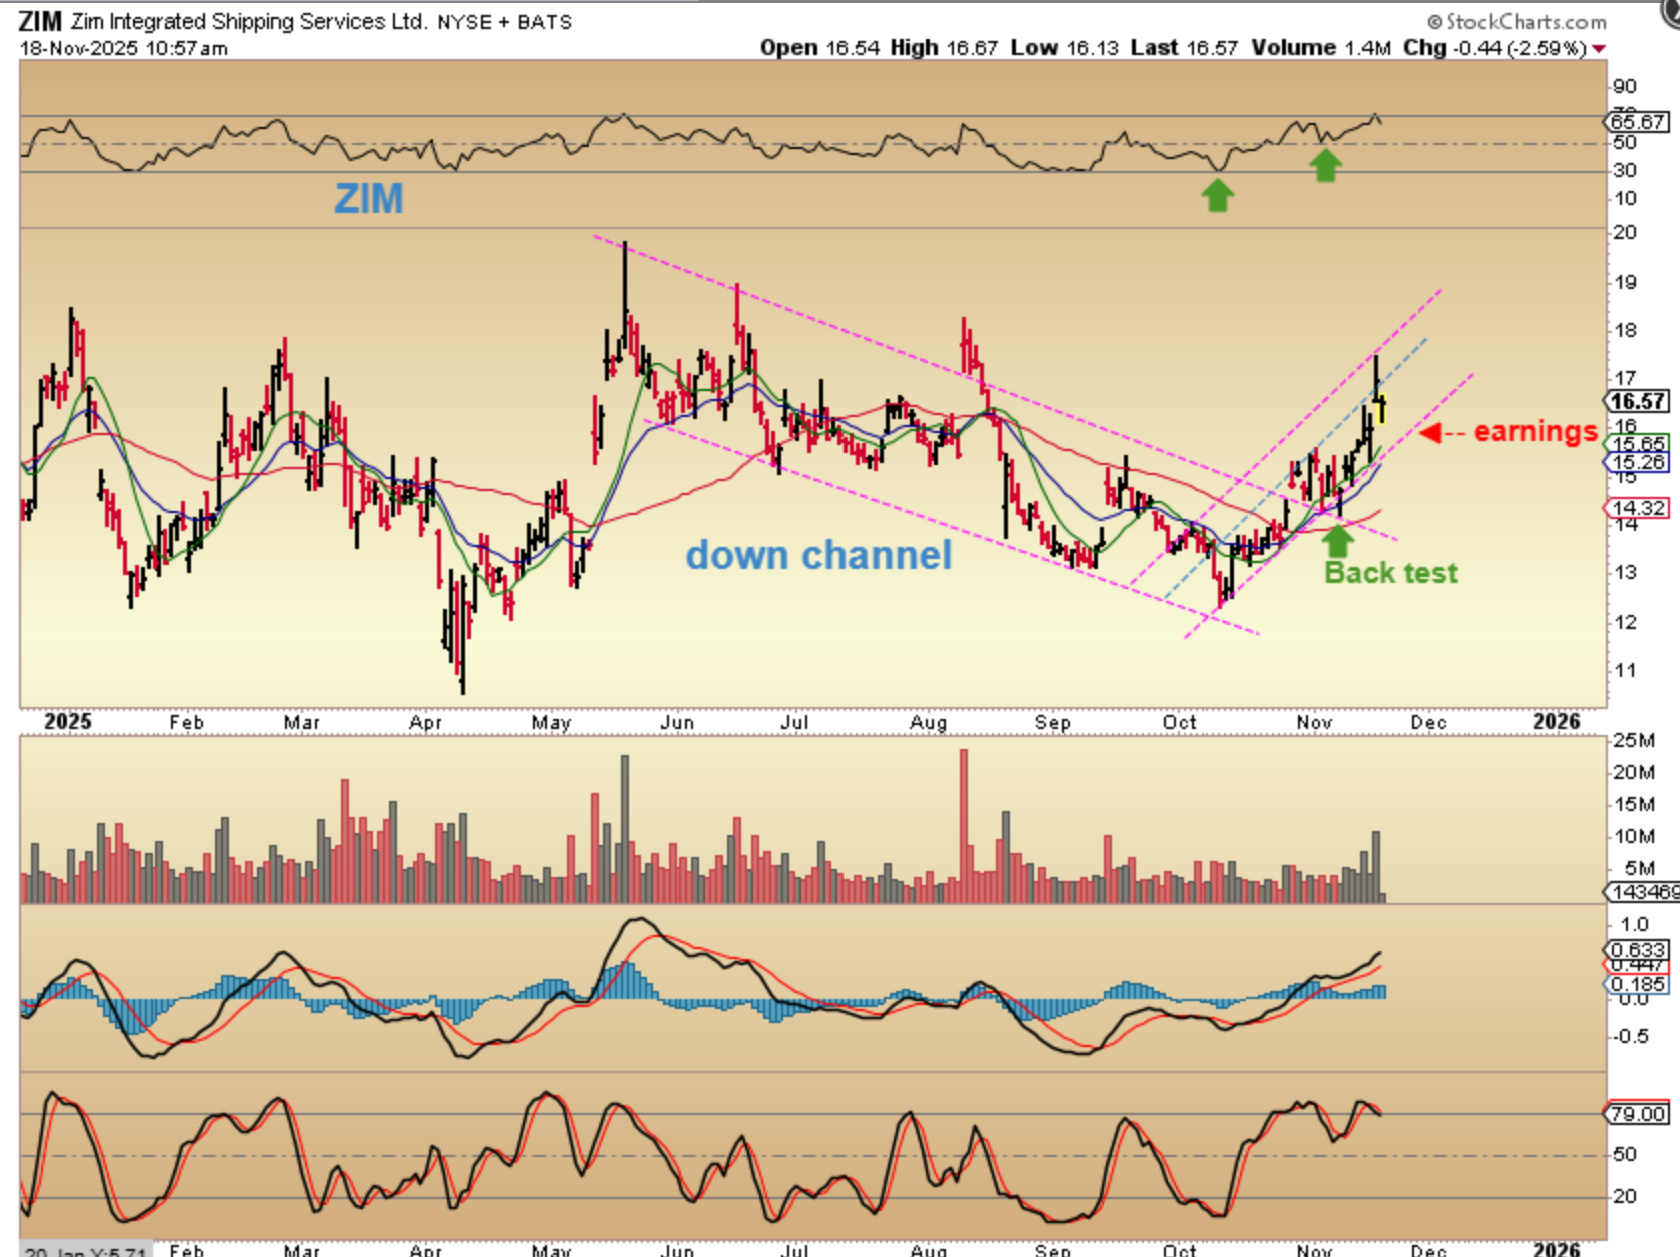
ZIM bottomed in October and has made good progress, ignoring the general market sell off. ZIM has earnings on Friday.
.
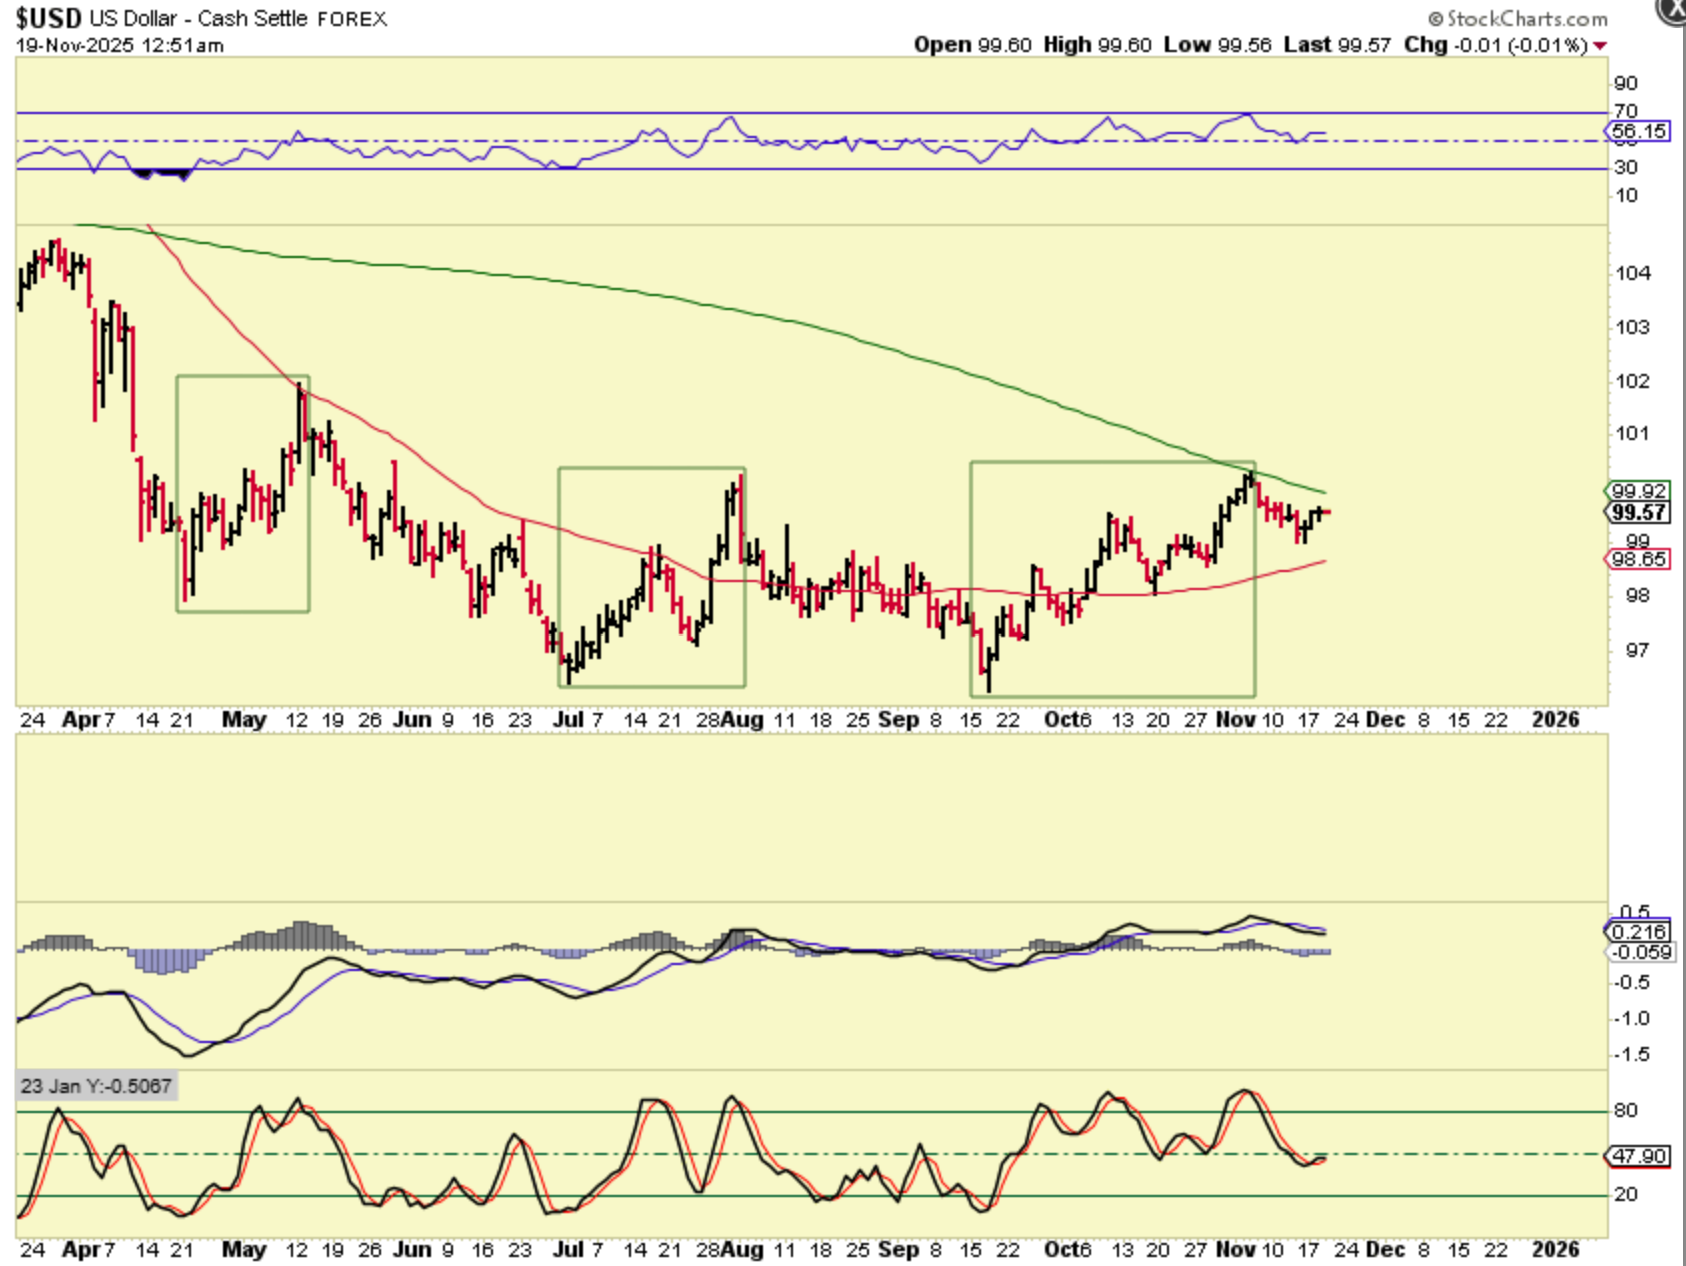
THE USD is still crawling along the 200sma.
.
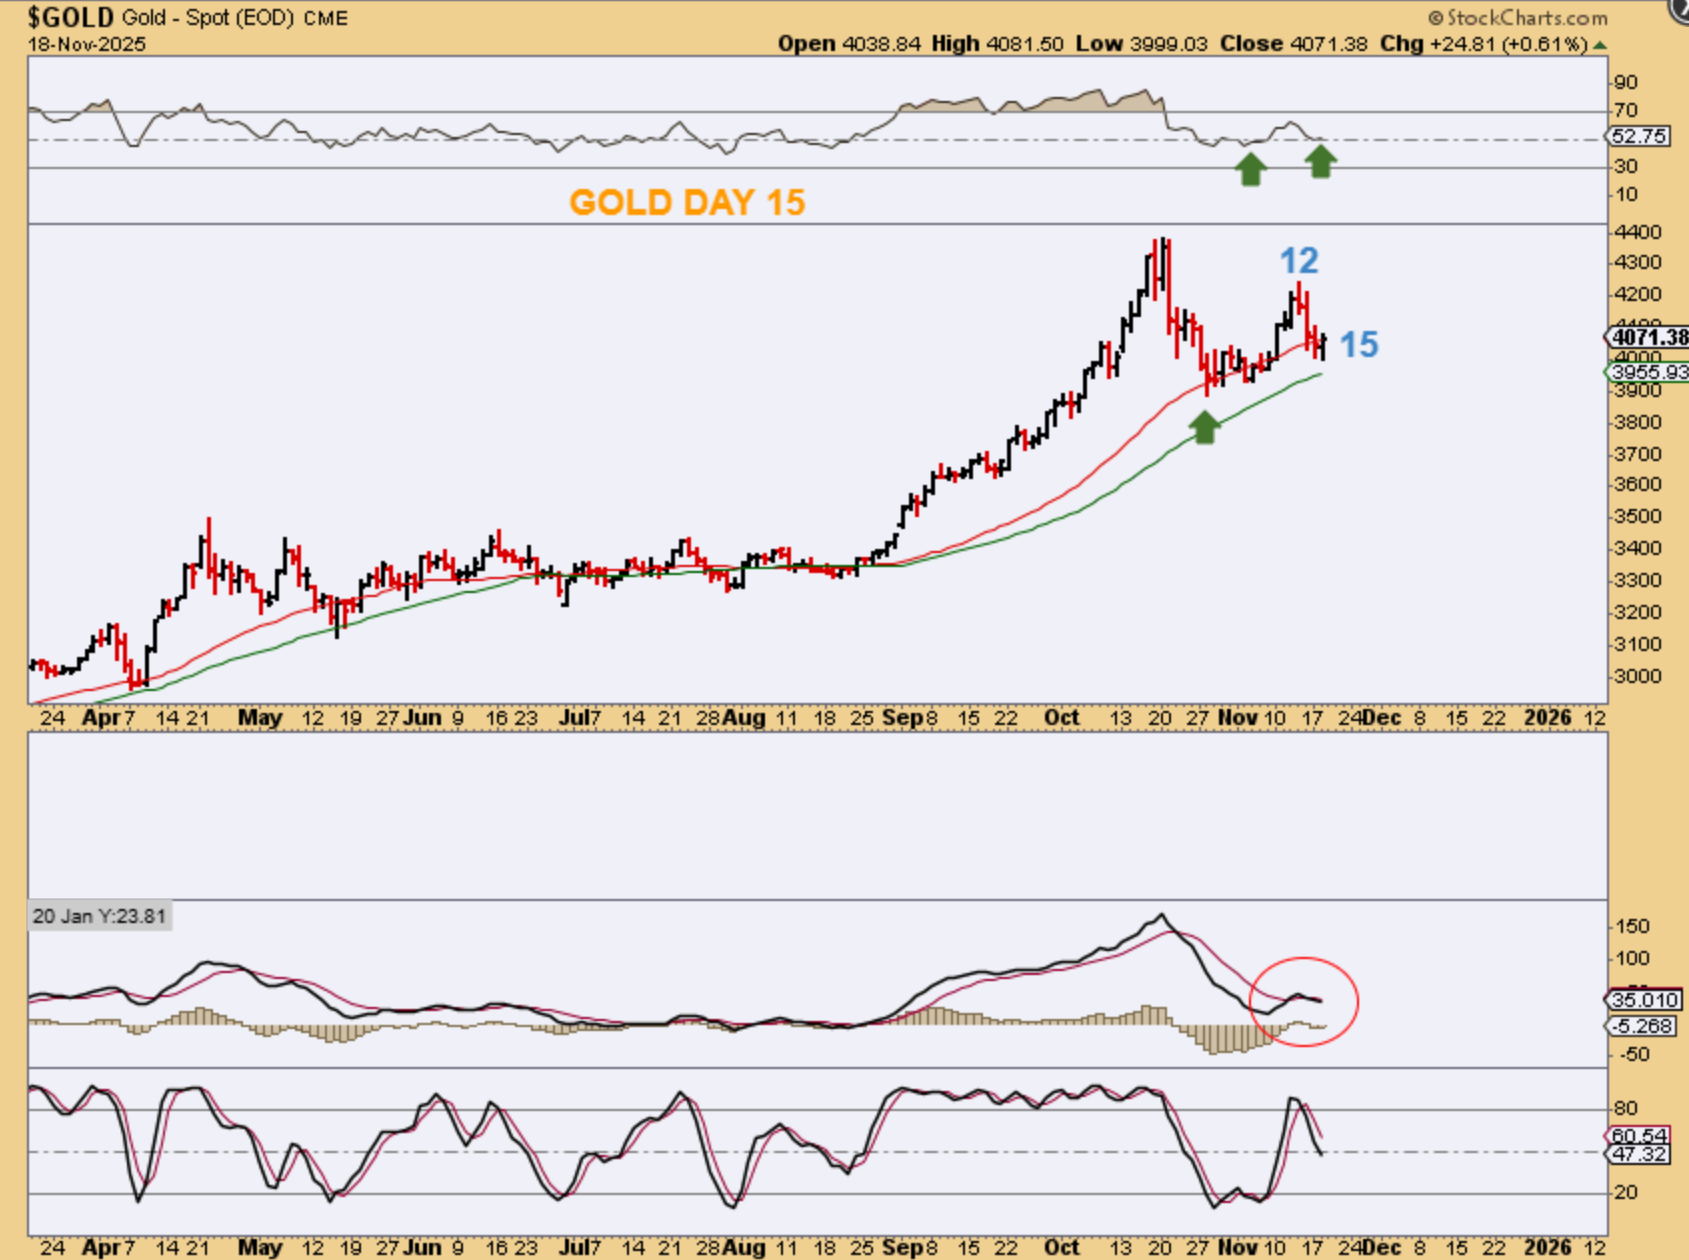
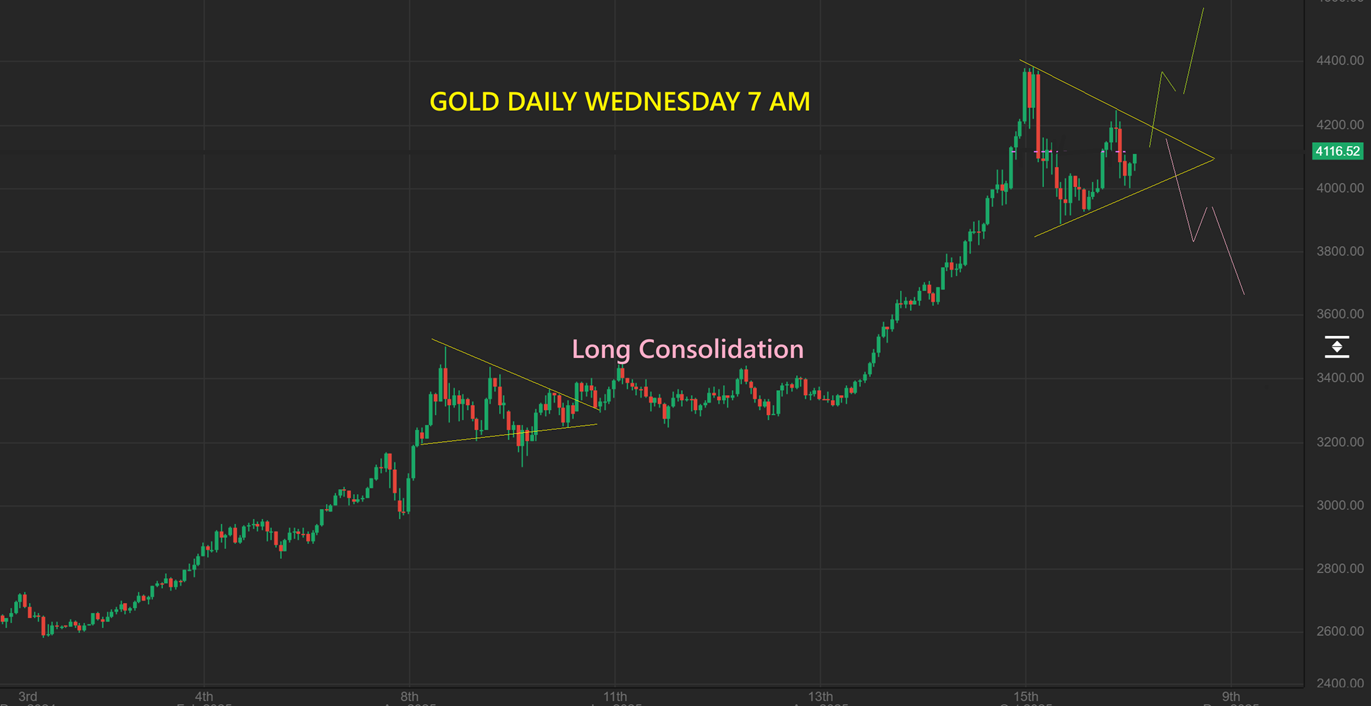
GOLD put in a reversal on day 15 and at a support area. The timing is that this could be a half cycle dip and now we watch to see if a strong run higher comes in (?) or do we get a weaker bounce and roll over like it did on day 12. A move above day 12 would make this R.T. and the RSI held up at the 50% line.
.
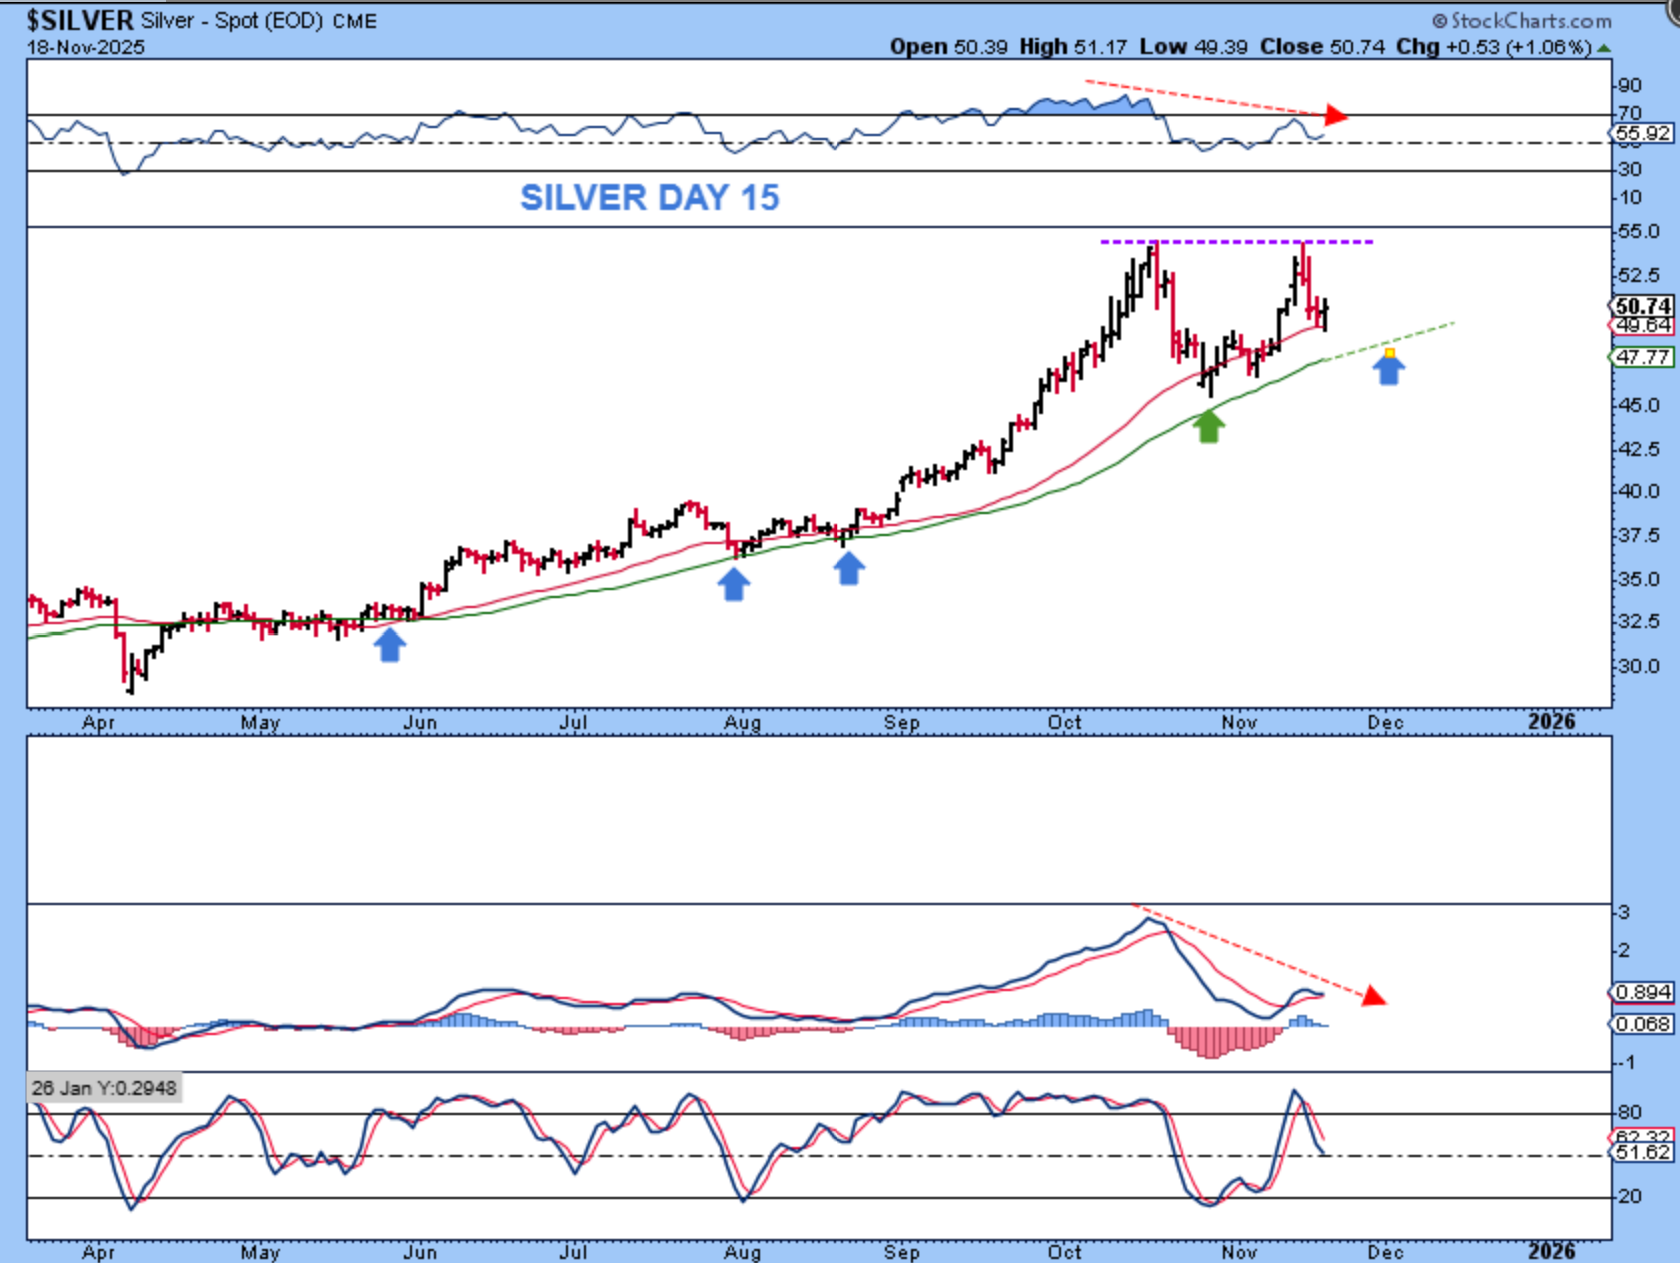
SILVER also reversed at support of the 34 sma and could put in a move higher now. We do see strong divergence, but price can still chop higher, so we’ll see if it takes out day 12 or not. The RSI for Silver is also still above 50%.
.
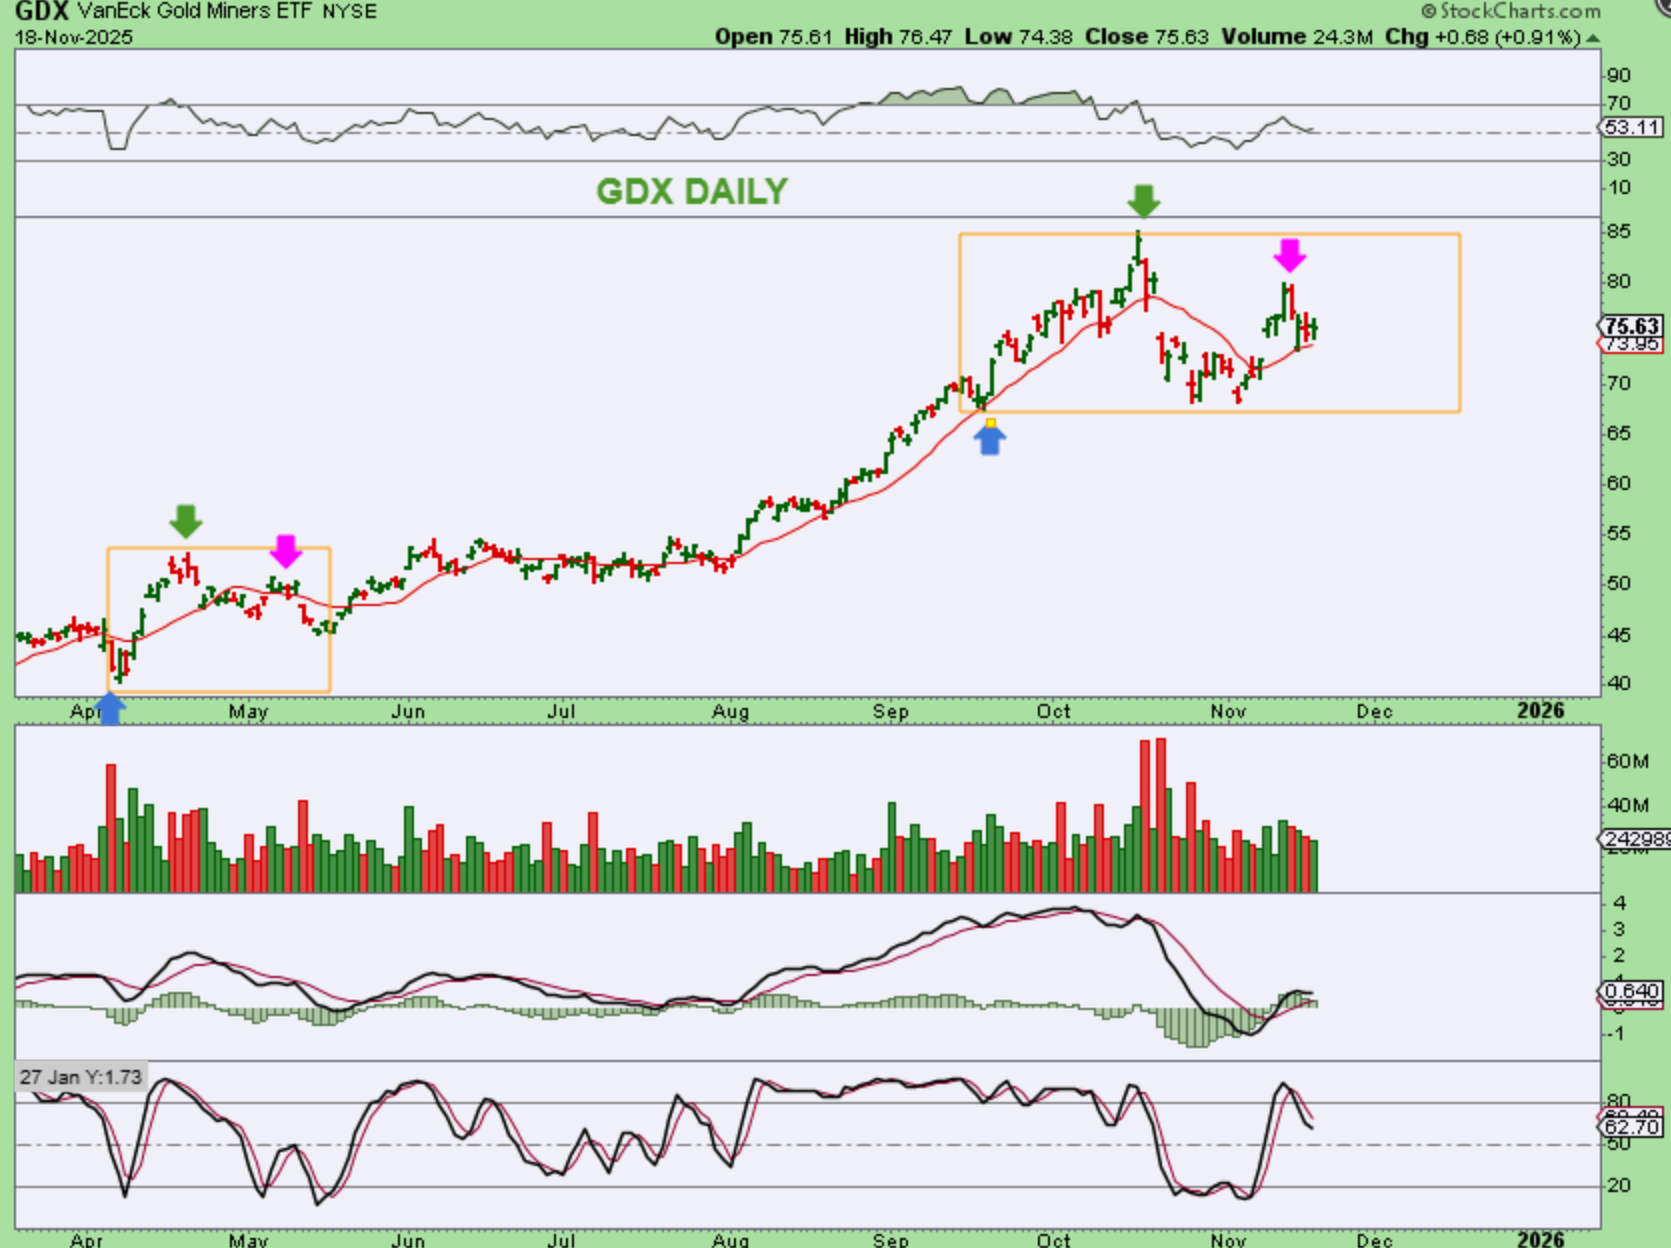
GDX should follow Gold and Silver from here. It also popped higher out of the recent dcl and landed on the 13sma shown, and the 50sma (not shown). So GDX landed on support with this half cycle low.
.
Yesterday I mentioned that some Miners still look good. I posted this chart in the cooments.
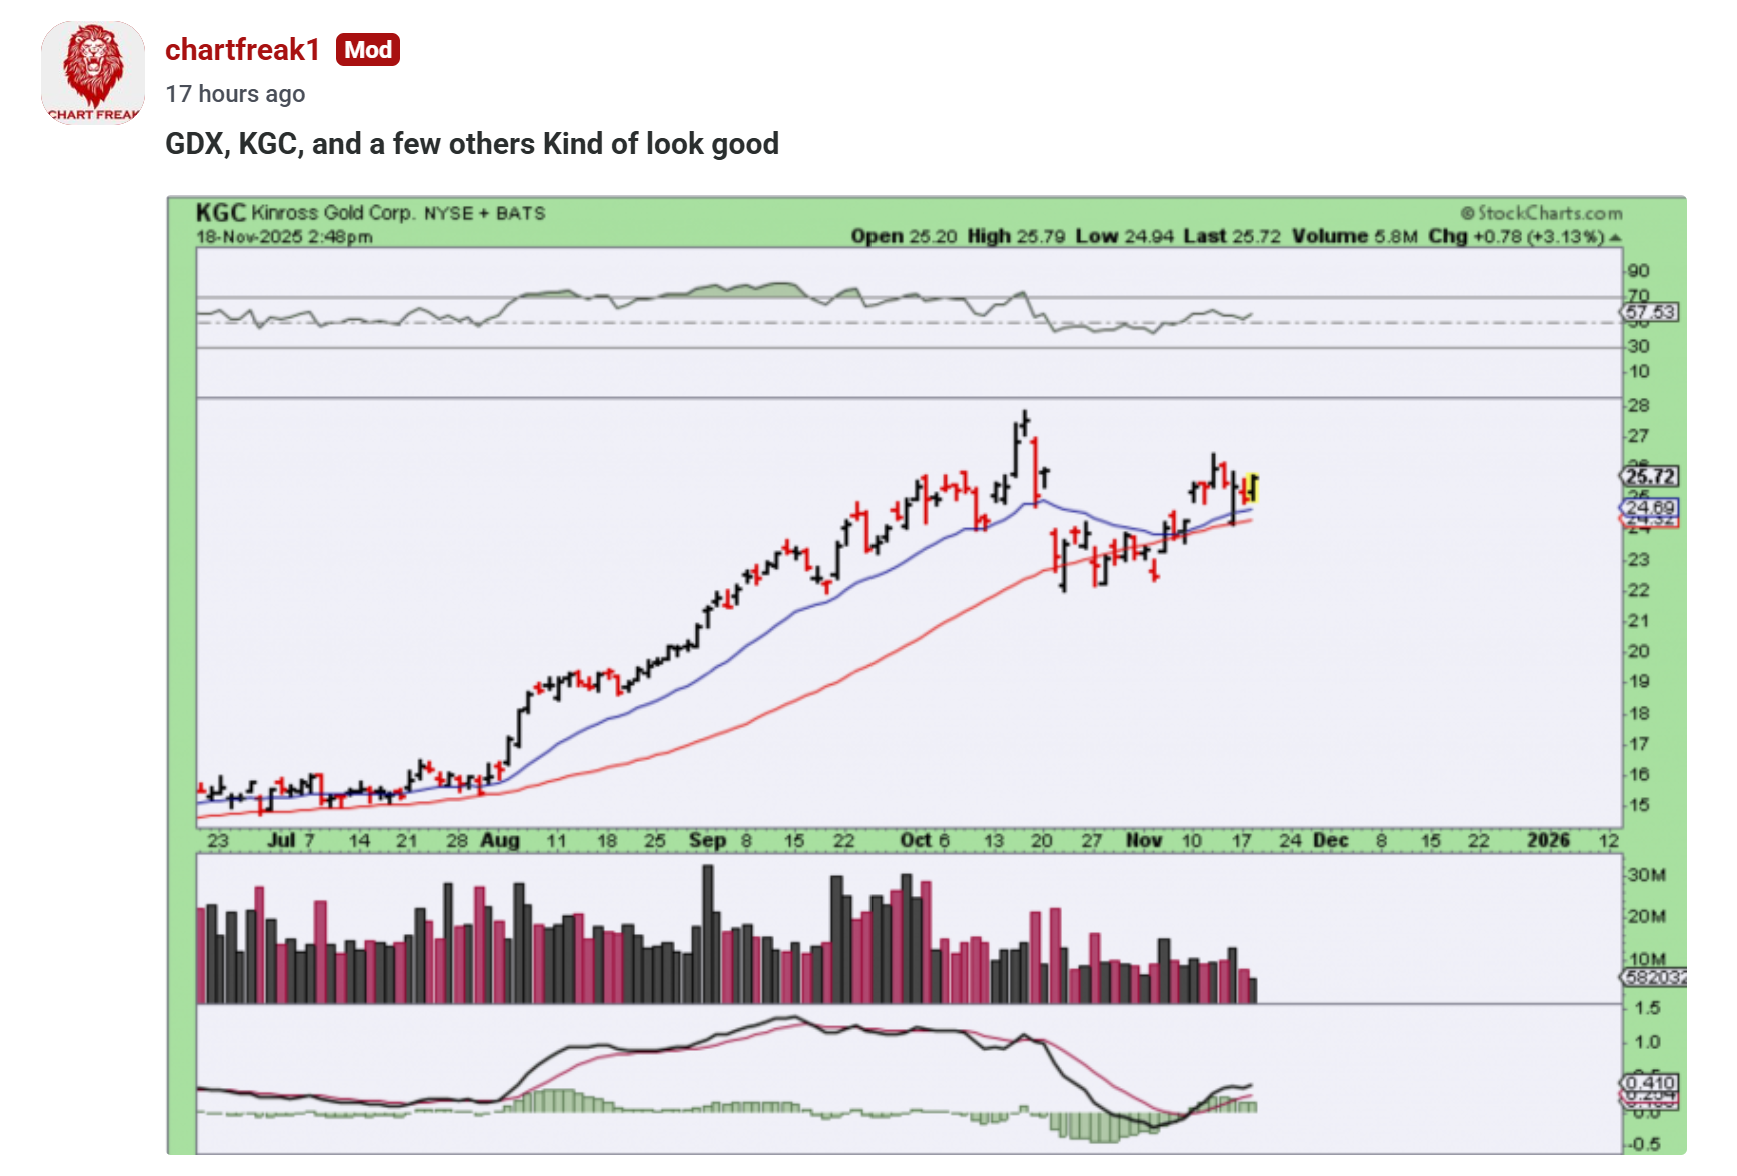
These charts and this report were mostly written on Tuesday evening, but when I got up to proofread it, I do see the futures for the general markets and Precious metals are green, so we can expect a bounce if that continues to the open and then we’ll see how it plays out going forward. I think that the General Markets are pretty clear. Recent selling lost the 50sma and it looks weak and is late in the daily cycle.
Gold and Silver bear watching, because we have had the 3 scenarios in front of us with that recent dcl.
1. It could still bounce and then break down and sell off into an ICL, or
2. Gold could rally one more time to a blow off top.
3. We could also just get another long choppy consolidation like we have had with past consolidations.
Advice was to buy the dcl and use a stop and watch how that daily cycle plays out. Right now, on day 16 today, we have seen a half cycle dip that looks ready to bounce. Enjoy your Wednesday trading!
.
~ALEX
.
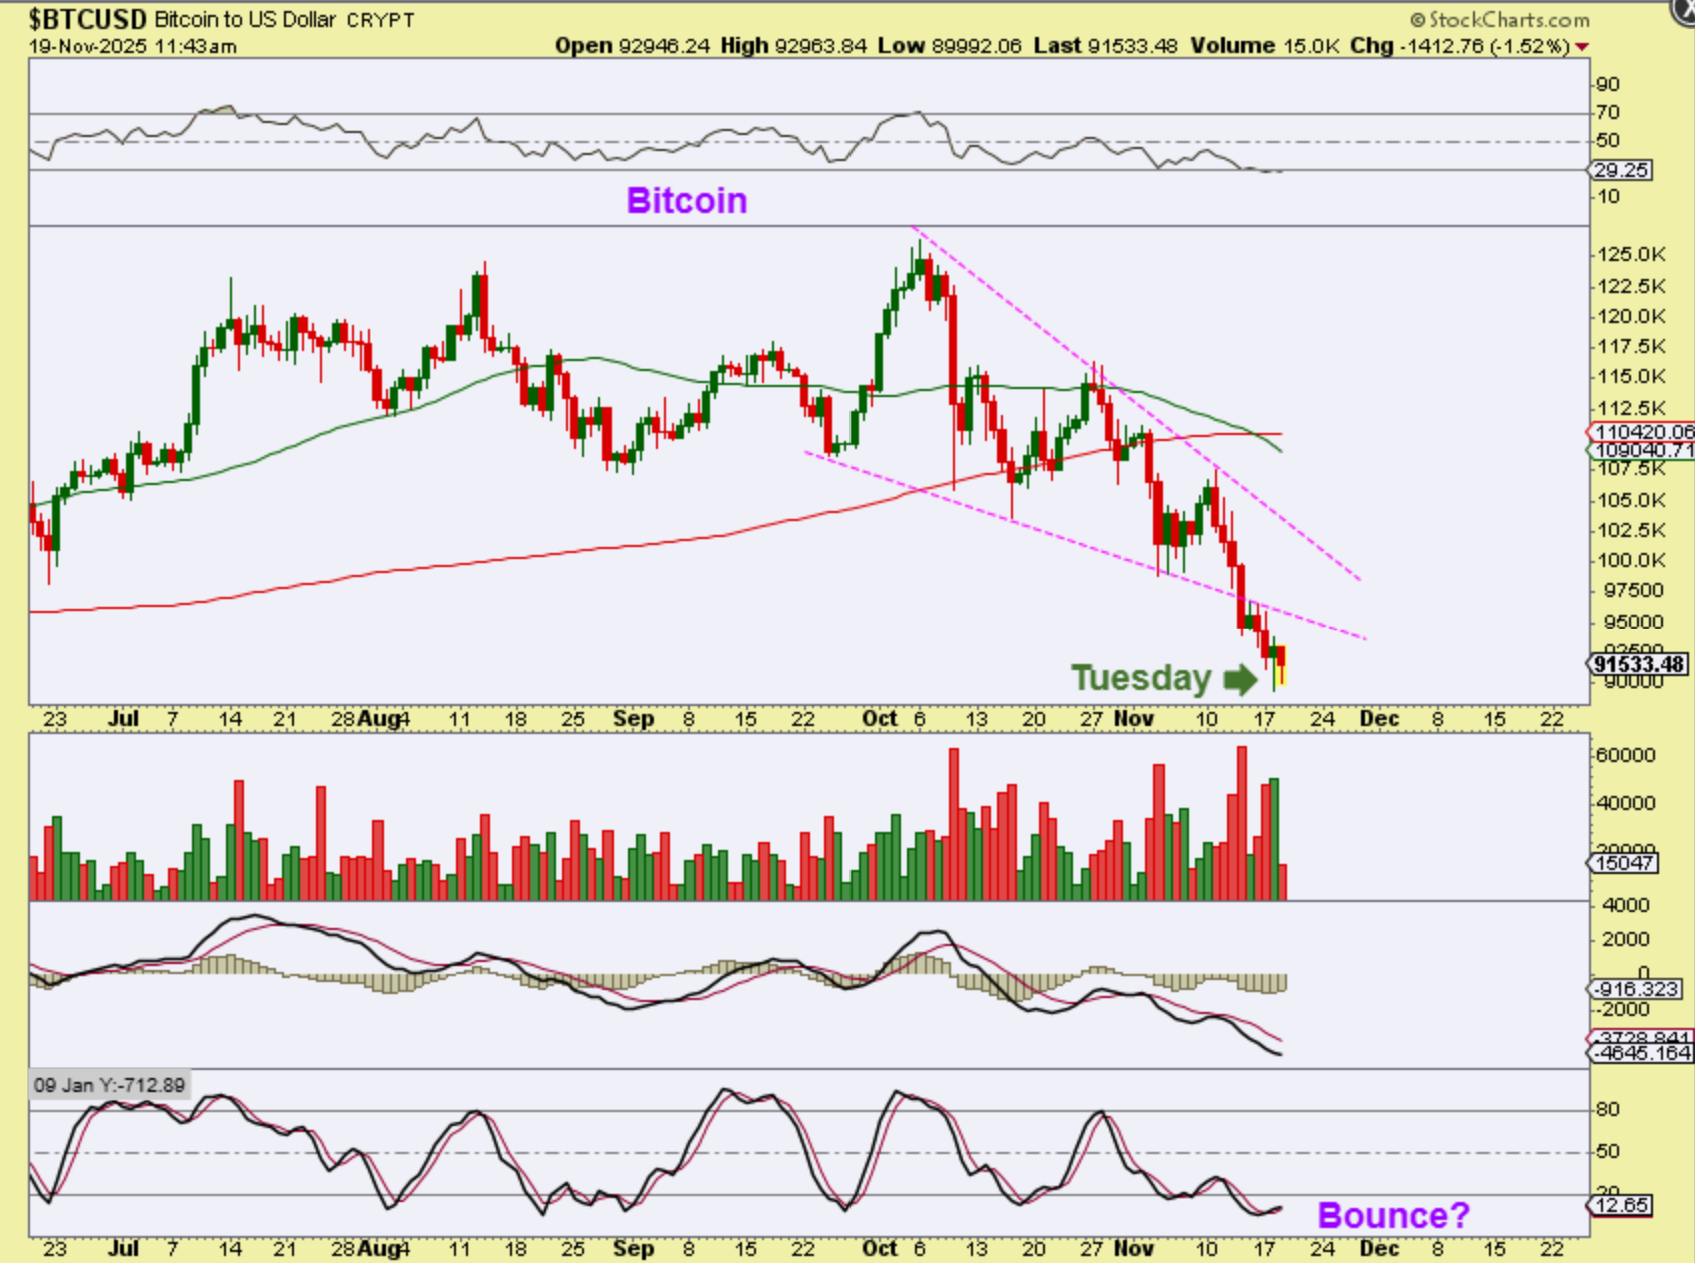
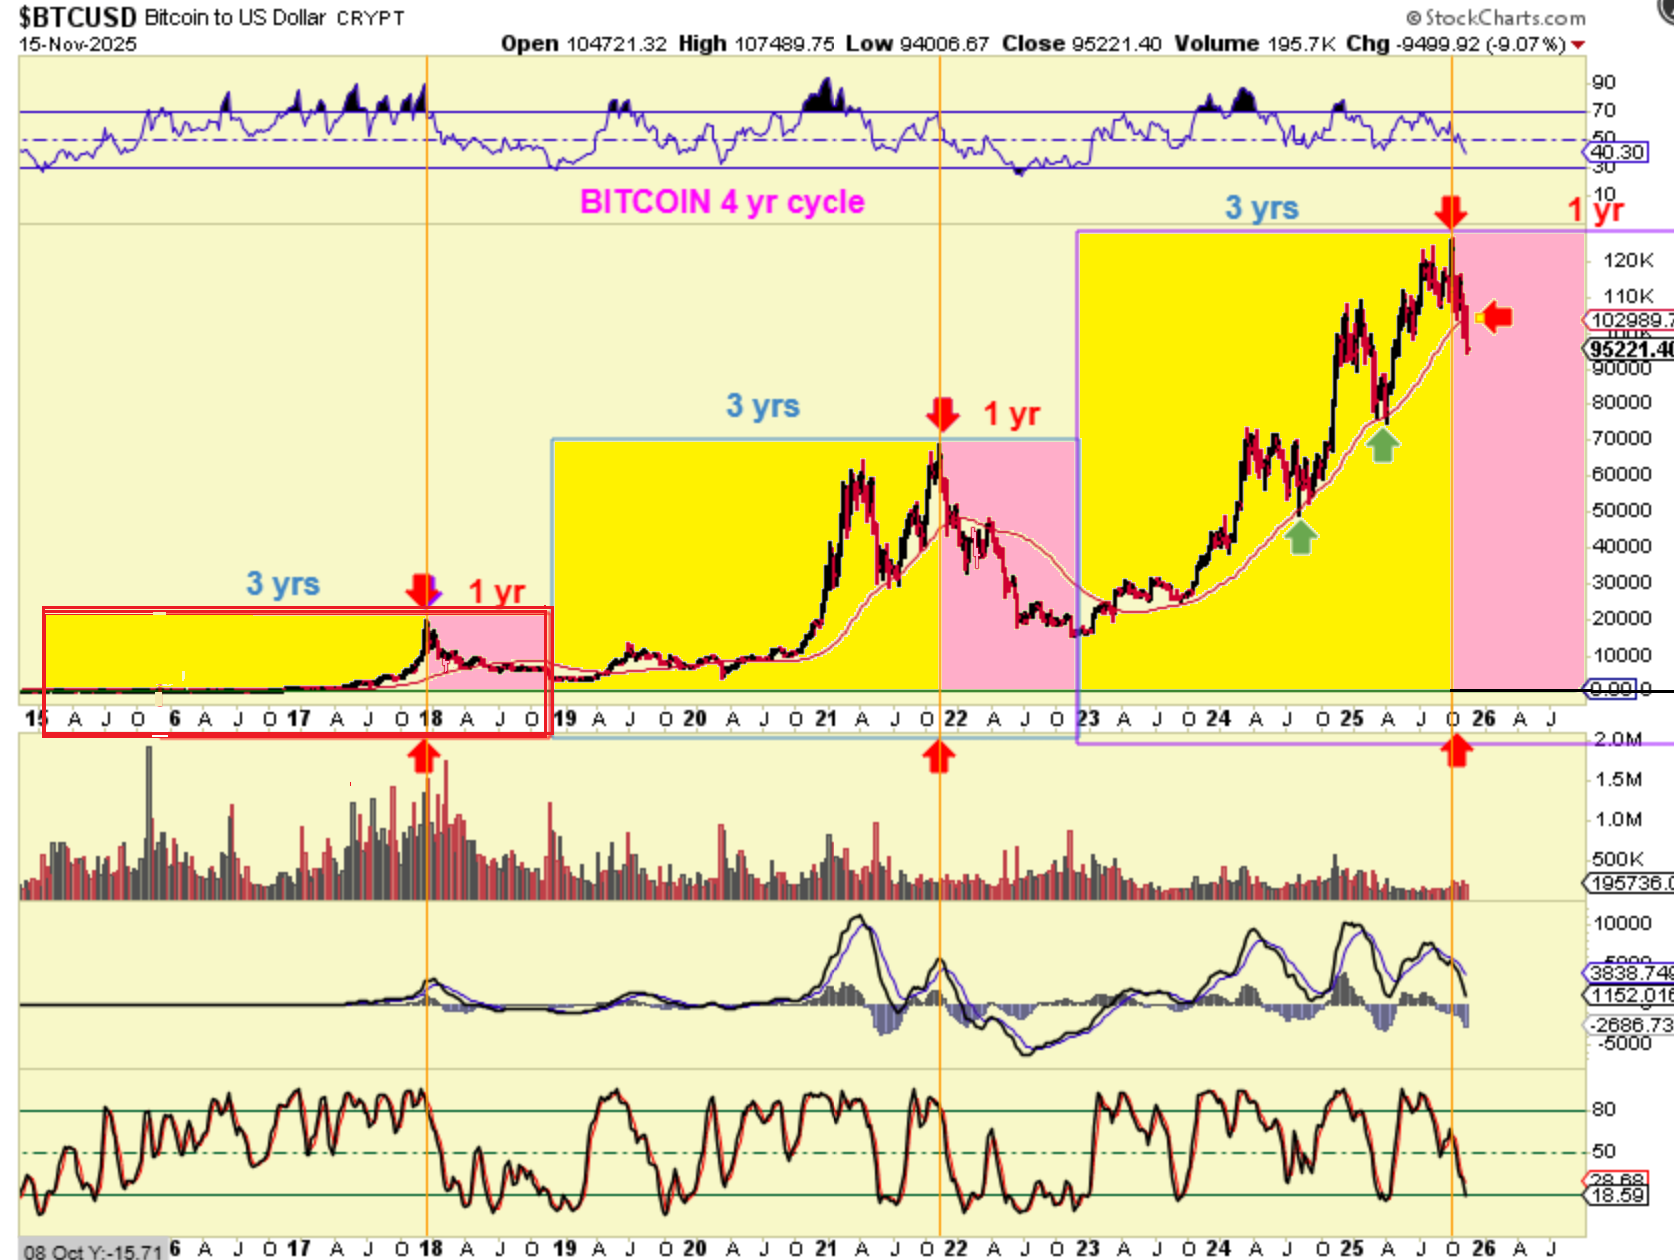
Bitcoin dropped to $89,289 and reversed. This morning it sold off again, but didn’t break that low and looks to be trying to reverse higher, but Bitcoin is very weak, compared to how it used to act. We are at the end of the 3rd year of a 4 year cycle, where the 4th year is usually a deep sell off or crash.
.
Bitcoin If Bitcoin bounces, it could be fairly decent, so we still want to keep that big picture in mind.
Tuesday November 18th – Temporary Moves 
 Thursday November 20th – JOBS REPORTS ARE BACK
Scroll to top