Tuesday November 18th – Temporary Moves
THIS WEEKEND I MENTIONED ‘TIMING’.
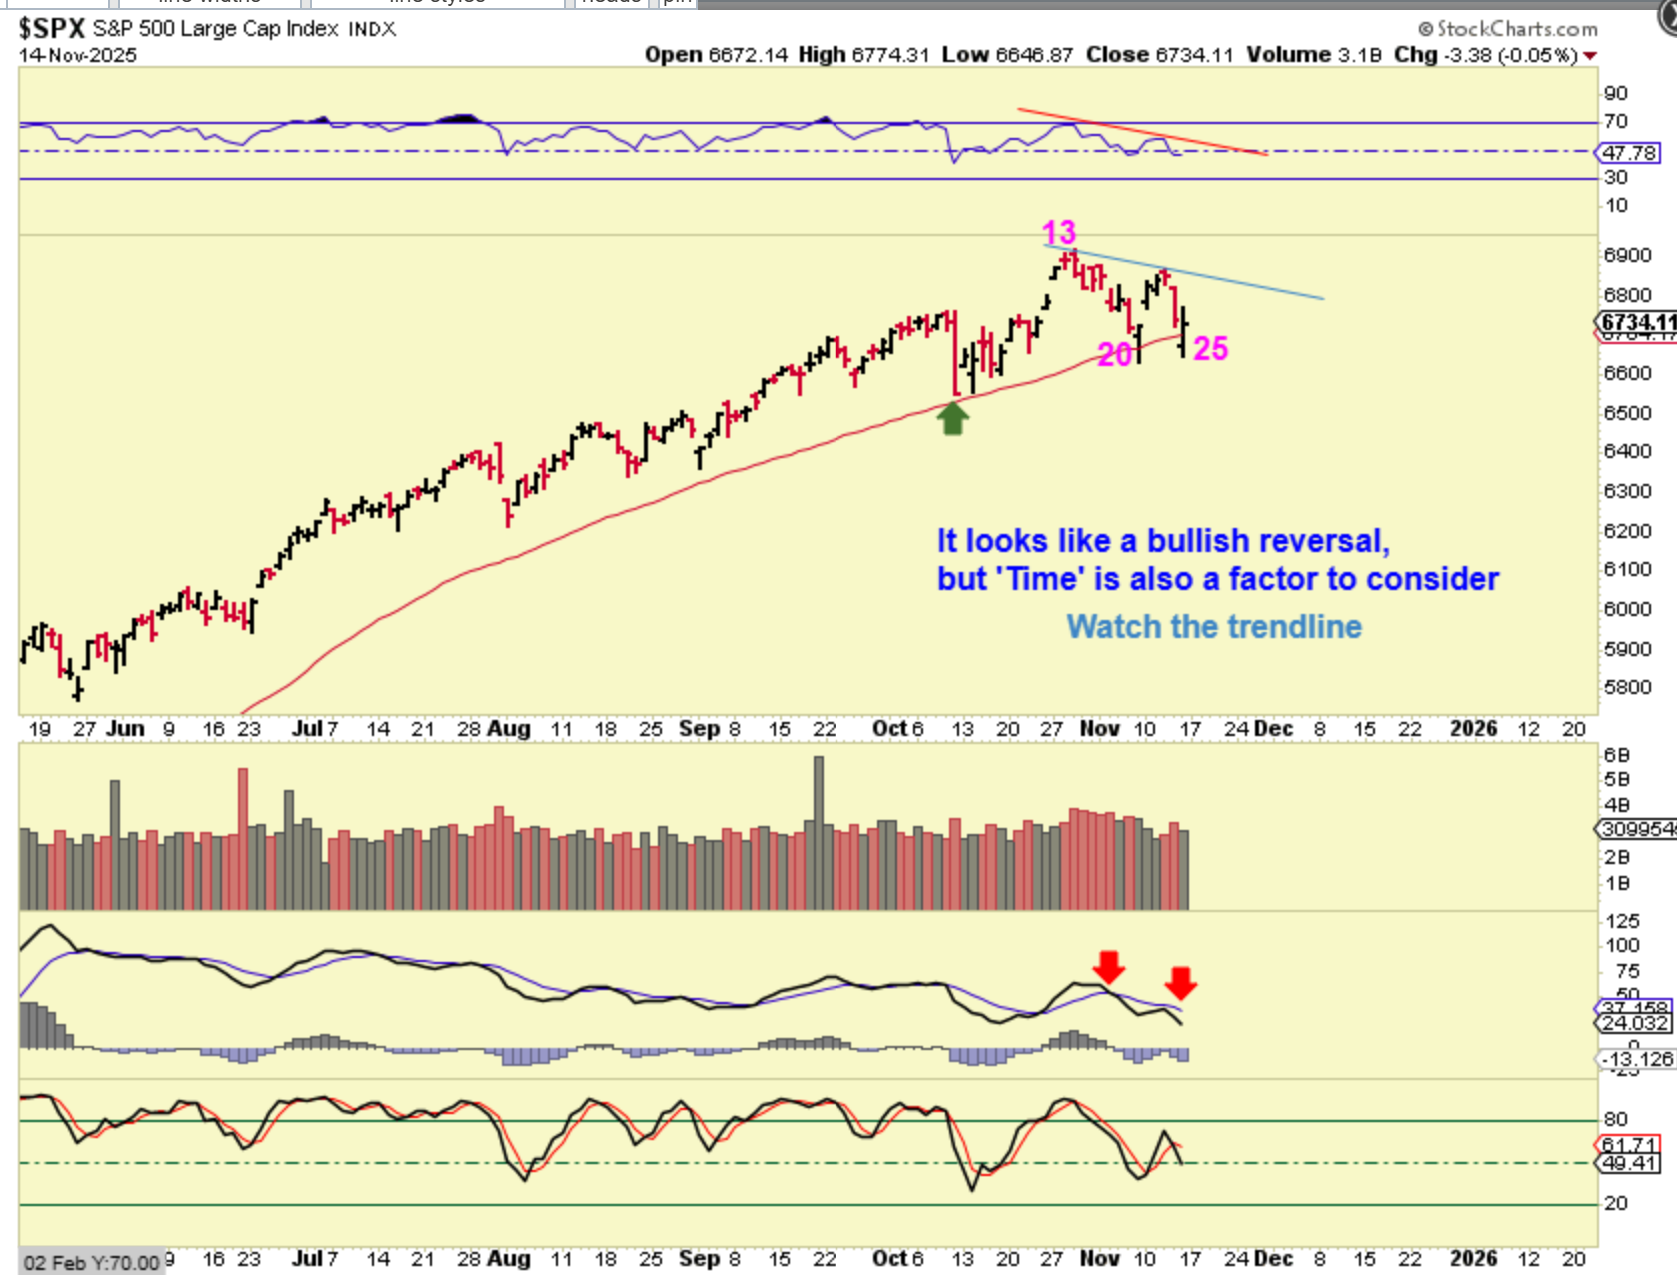
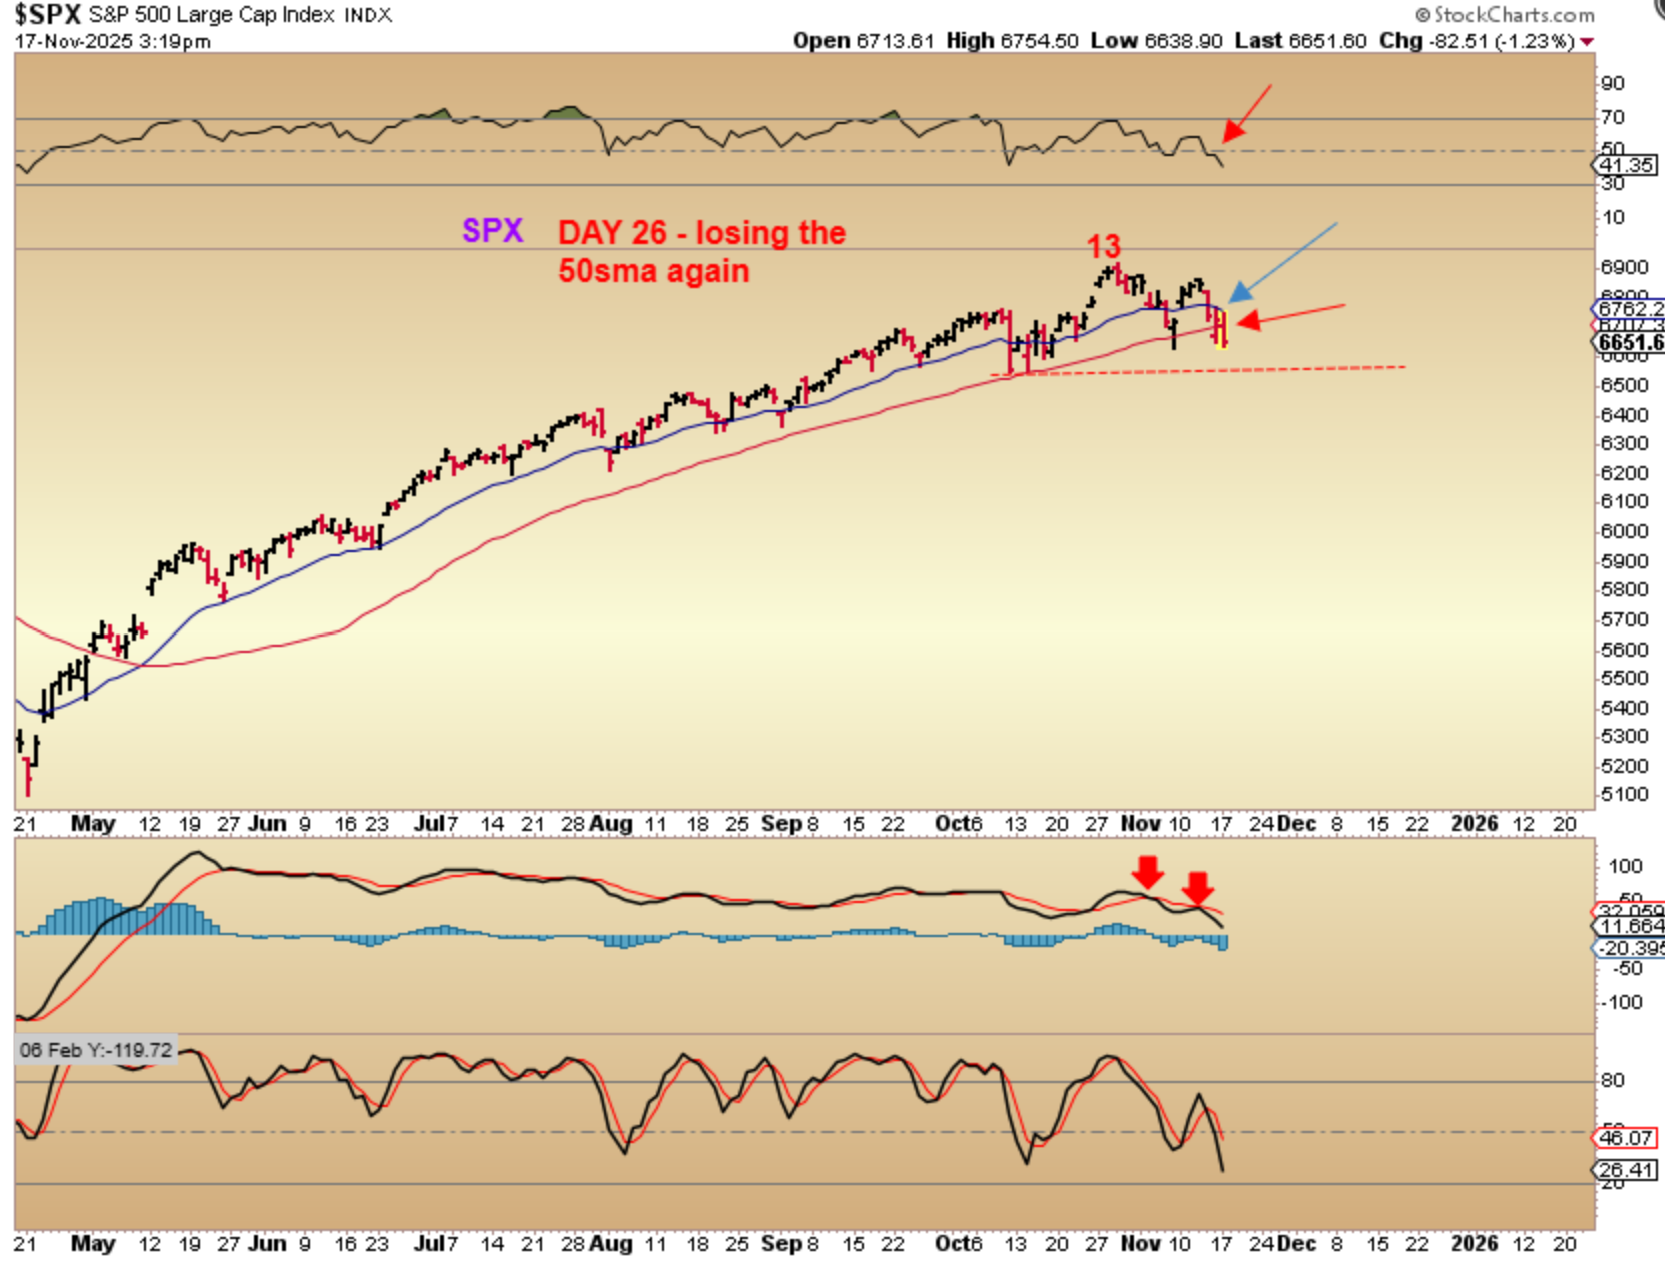
I said … “Time is a factor too. We are on the 7th month of the Intermediate cycle and we have a day 13 ‘peak’ on day 25. I think that we could bounce to the downtrend line and then roll over into an ICL drop. Look at the MACD weakness showing up too.”
.
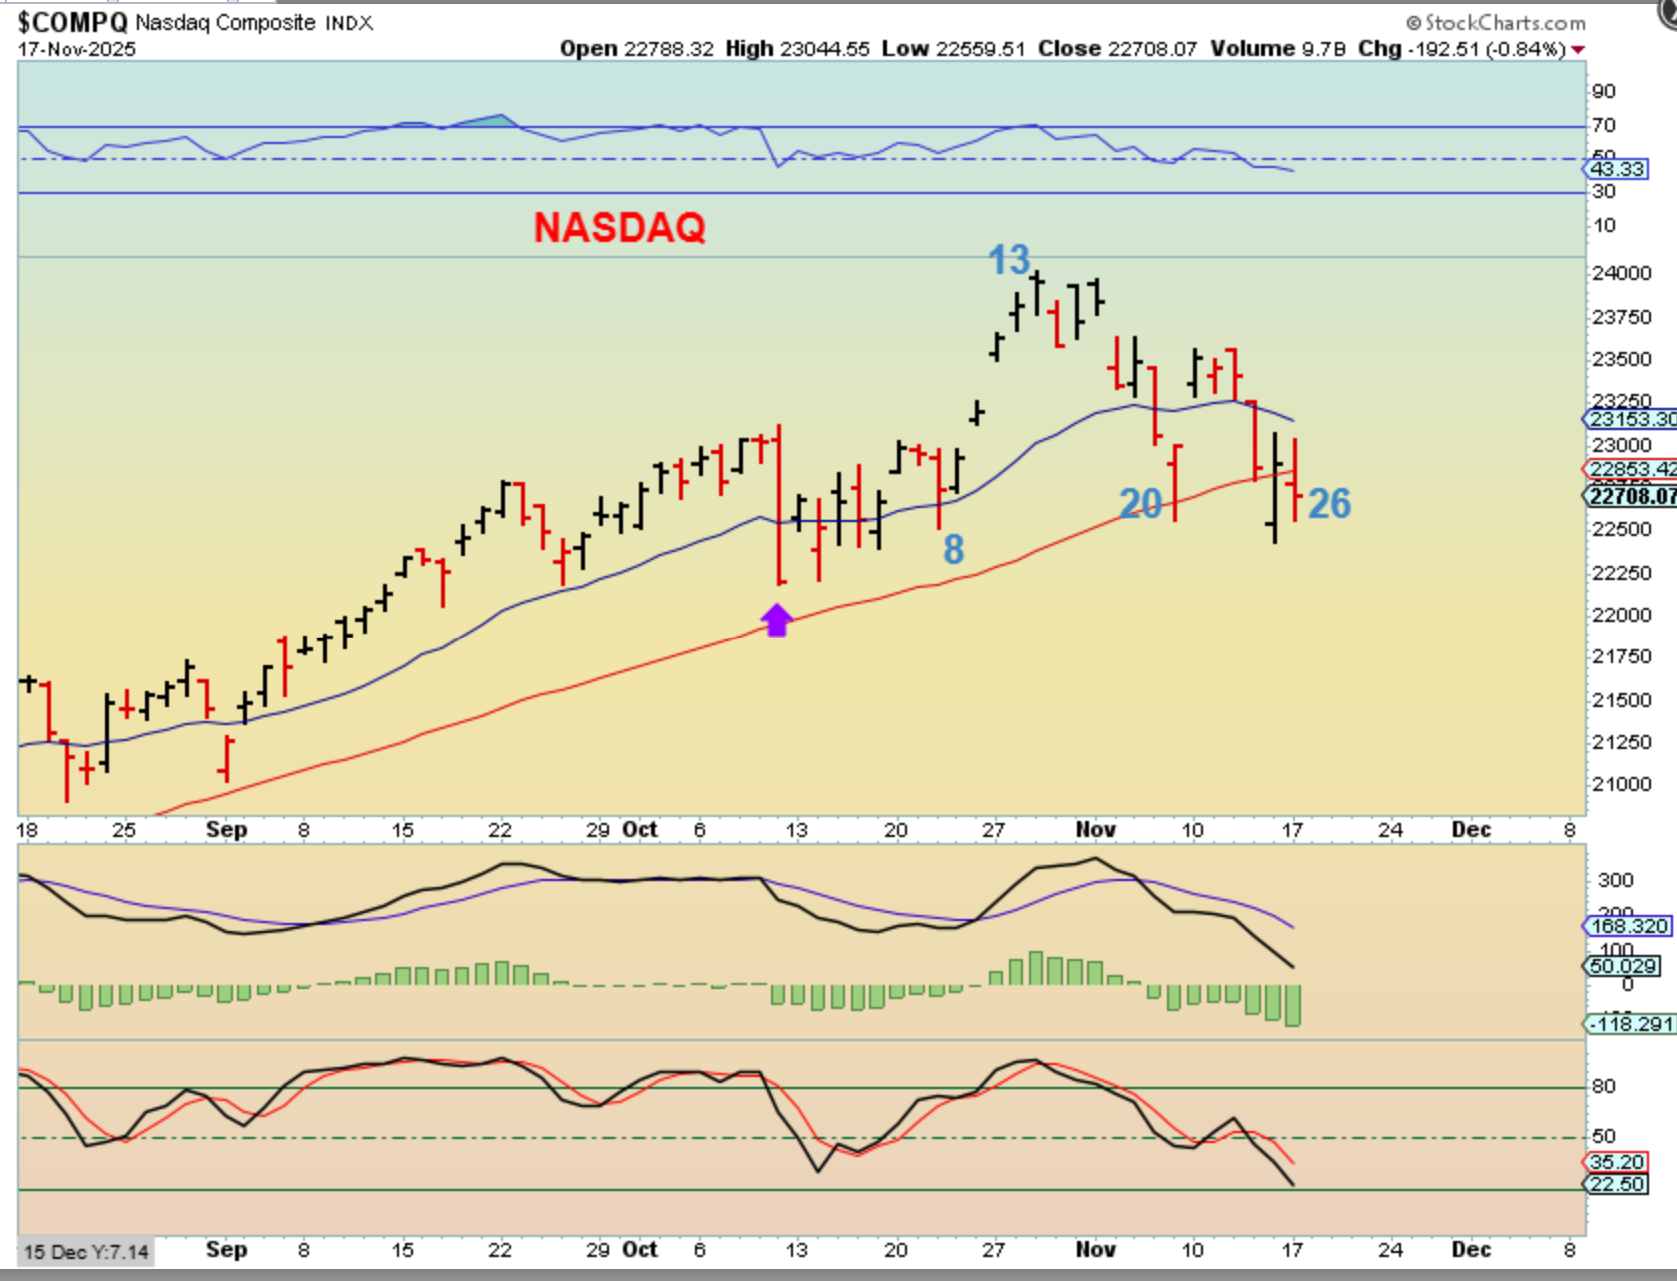
NASDAQ DAY 26 – We bounced in the morning, but sold off as the day went on. We are seeing the weakness in the markets now, as we see prices struggle to push higher, but unable to regain the former highs. We are not surprised at this weakness due to the markets ‘timing’, and we are on month 7, now expecting a drop into an ICL. THE NASDAQ LOST THE 50sma AGAIN TOO.
.
THE SPX rallied to the blue 20 ema yesterday but then sold off at the end of the day too. So on day 26 the SPX lost the 50sma again too. We haven’t lost the daily cycle low yet, but we will over time to cause this to be a failed daily cycle.
.
JUST AN IDEA
.
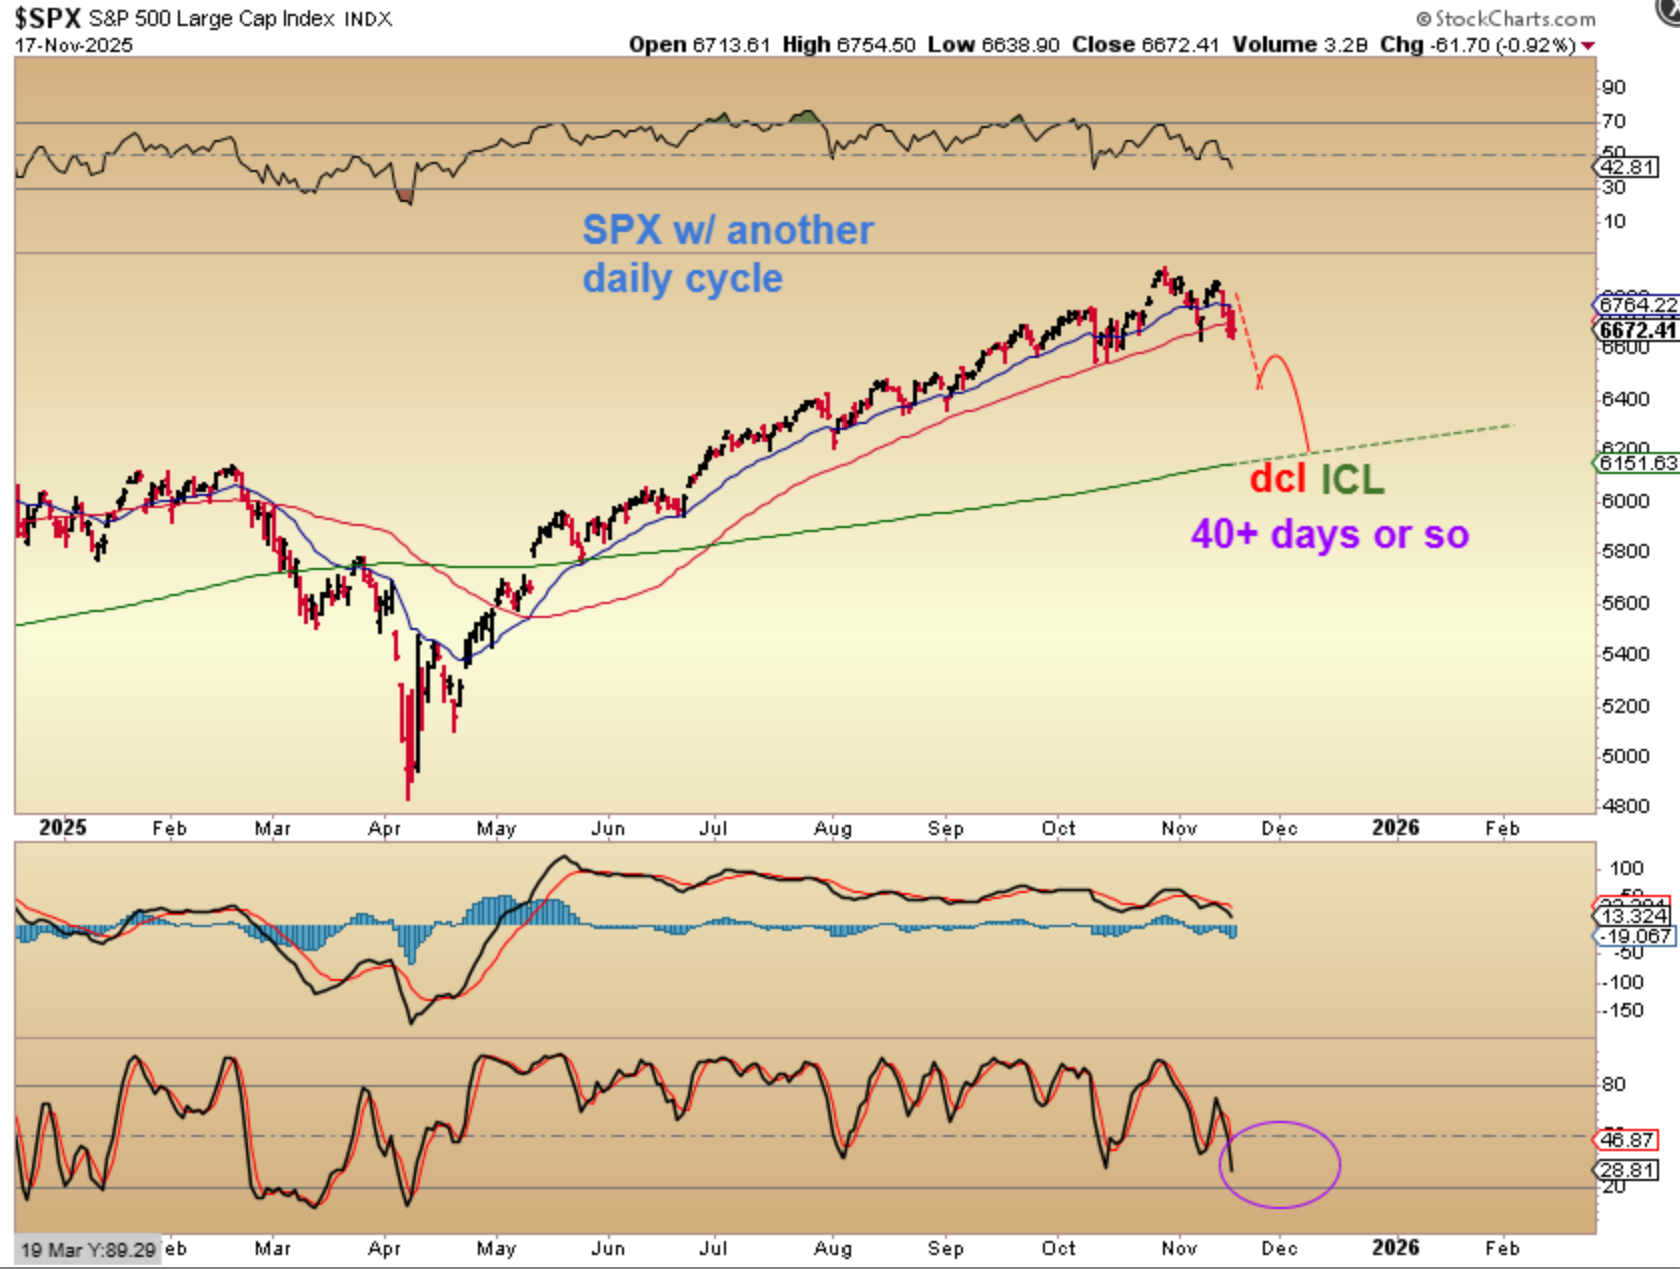
SPX – I’m just drawing a sharper drop and this should have said that this could happen without another daily cycle. It could include a drop with a ’45-5o day daily cycle’. A different view is one with another complete daily cycle and that is the next chart…
.
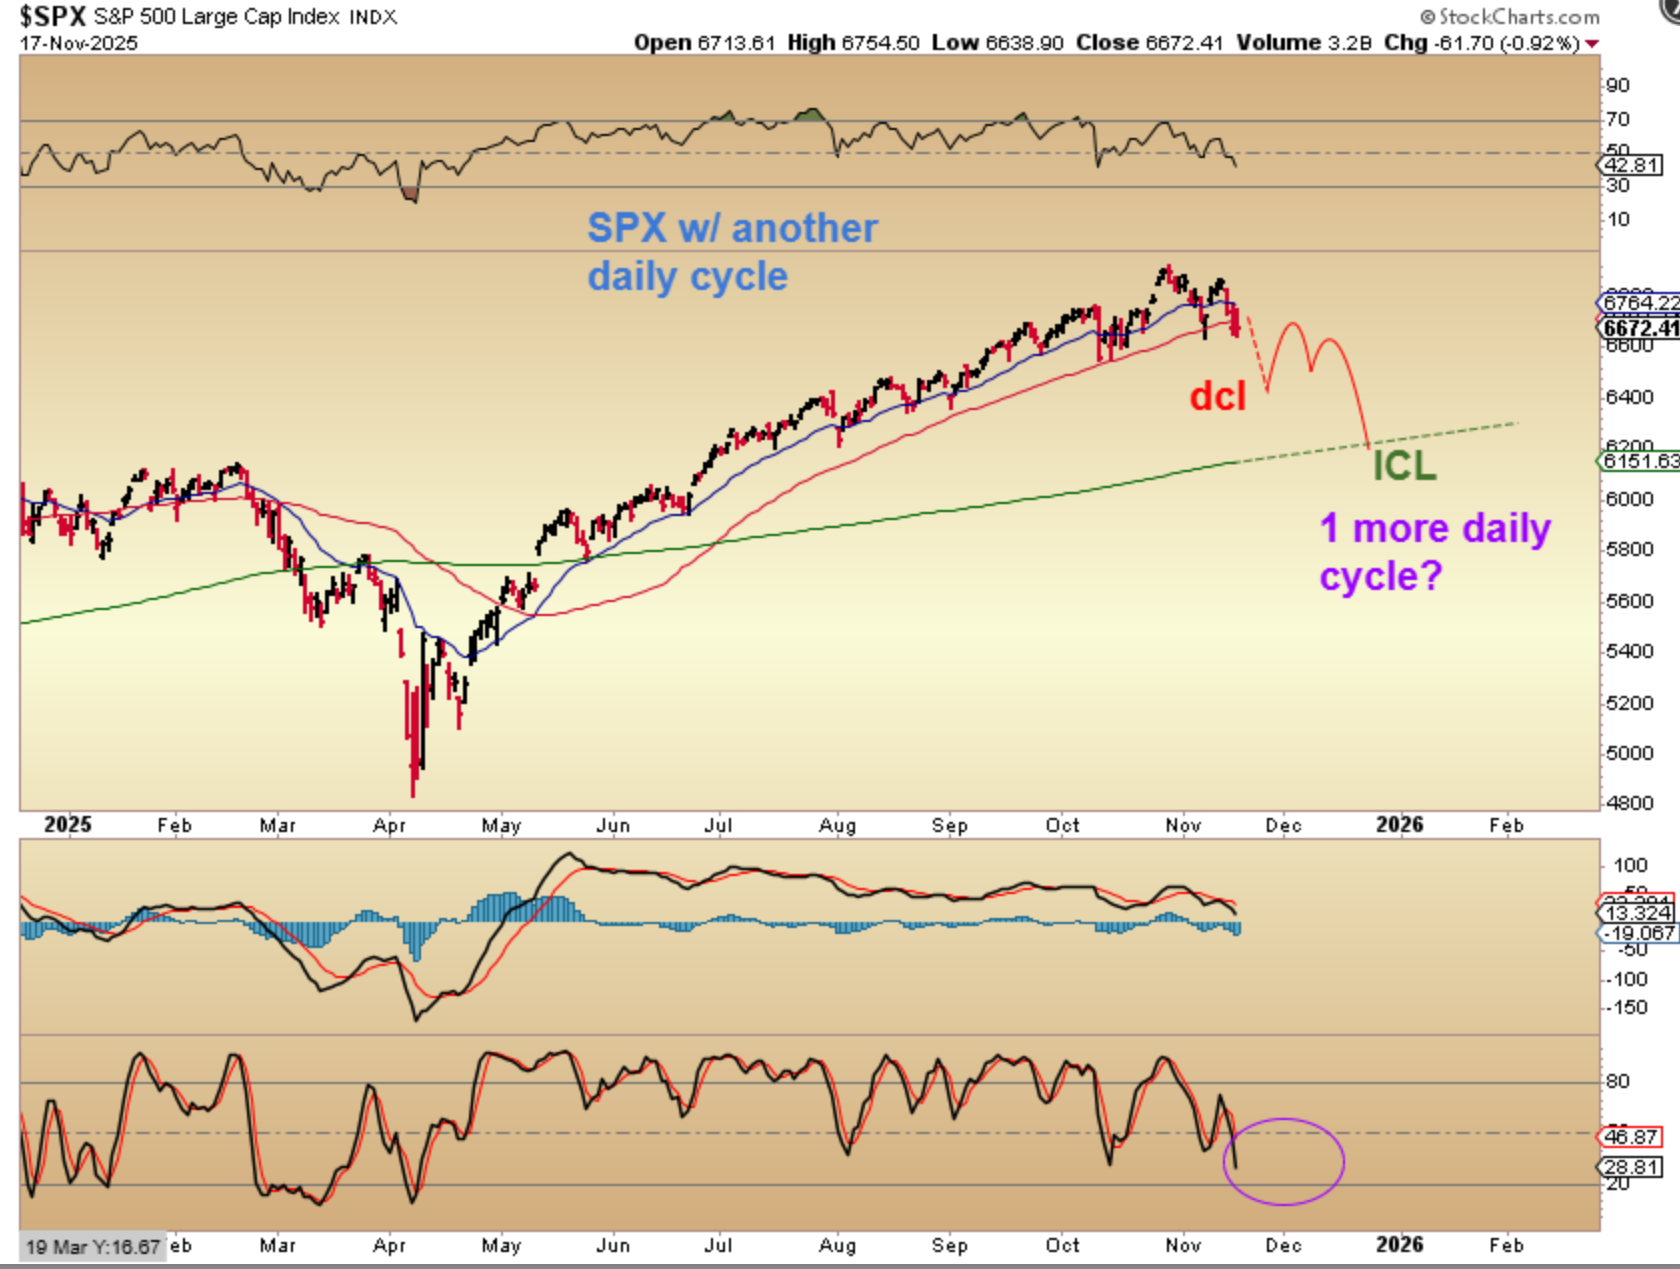
So this would be The SPX that has 1 more daily cycle after the current one.
1. It would drop into a dcl now, maybe by day 35 and then
2. It bounces for a while forming a new daily cycle as L.T.
3. That final daily cycle would then also roll over as L.T. into a final dcl/ICL in December.
.
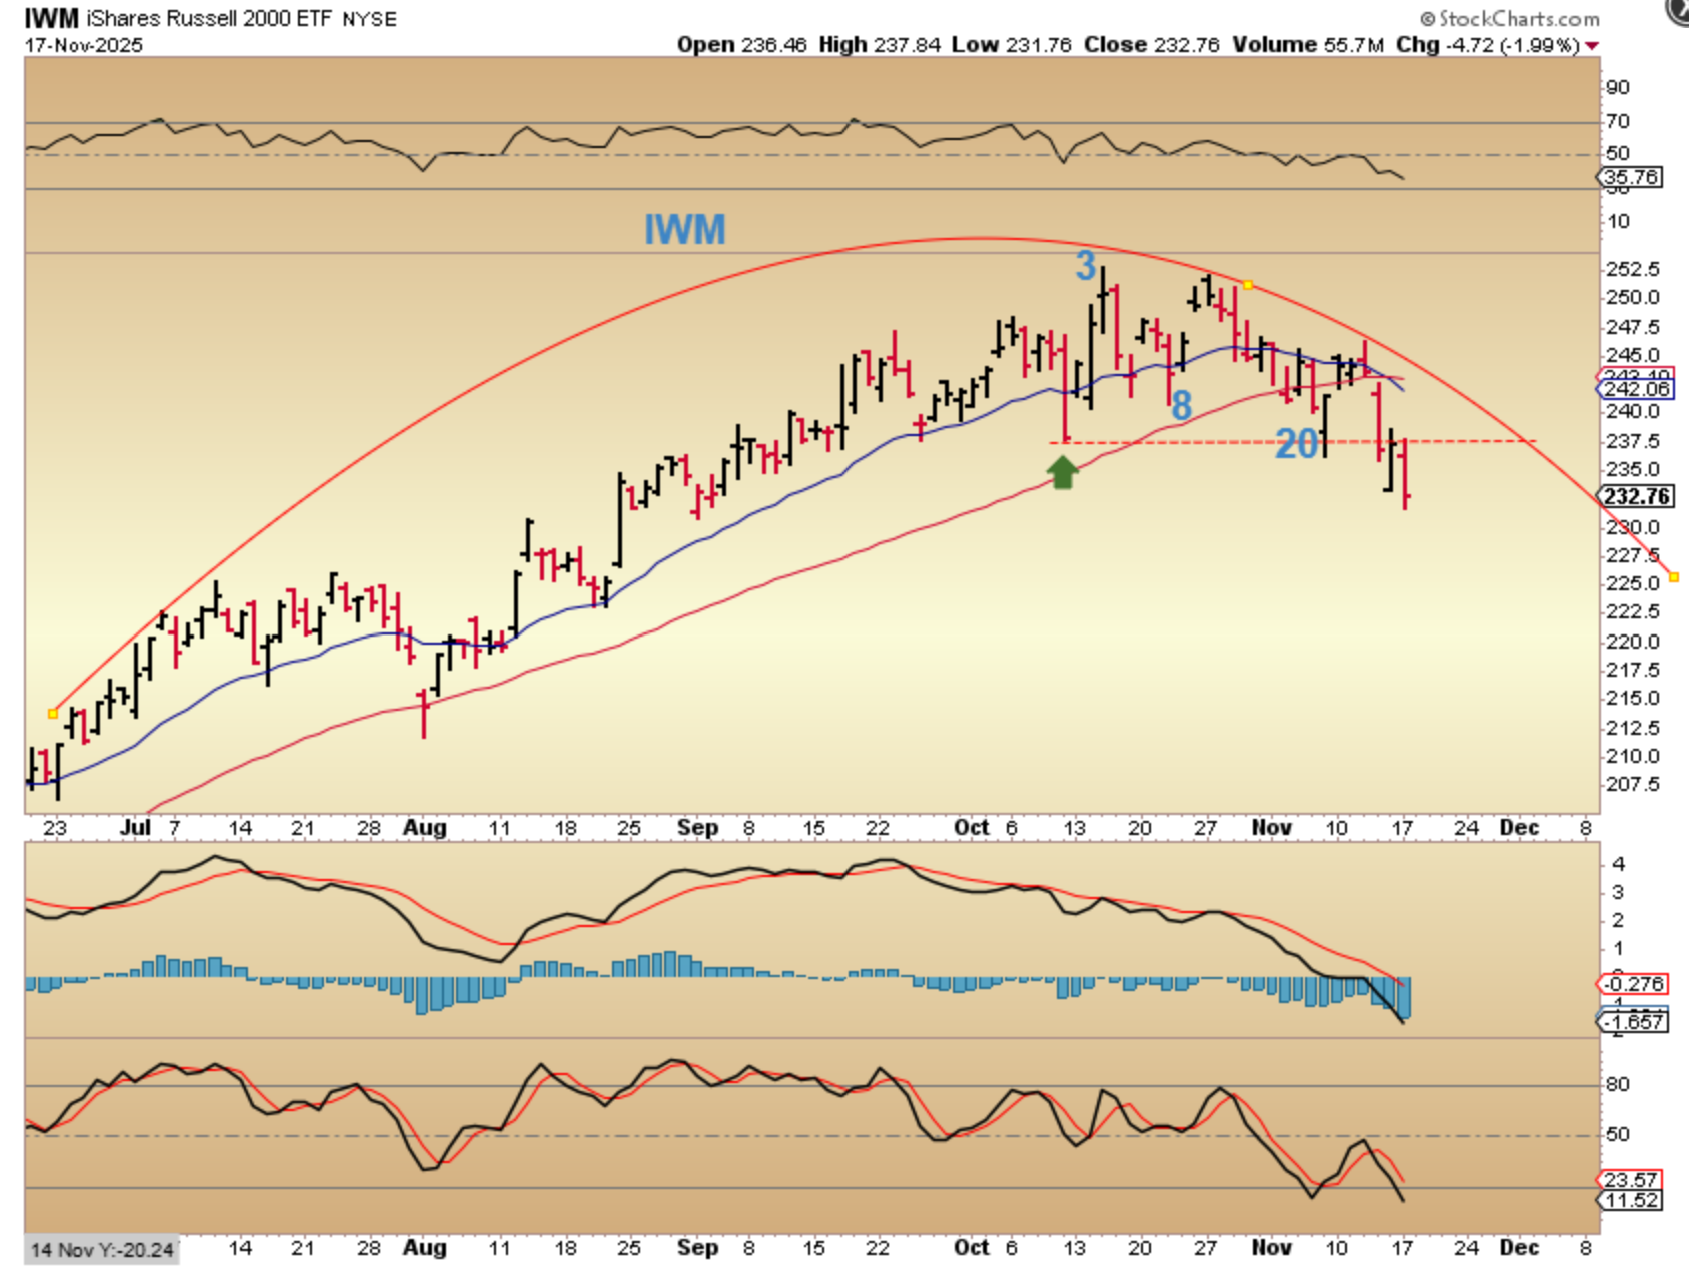
IWM – As pointed out a while ago, the Russell 2000 is the weaker area, since it already broke the dcl on day 20 and is failing. It resembles a rounding top and yesterday it made a new low.
.
I have been seeing biotech and pharma continuing to do well. Yesterday in the comments I mentioned…
.
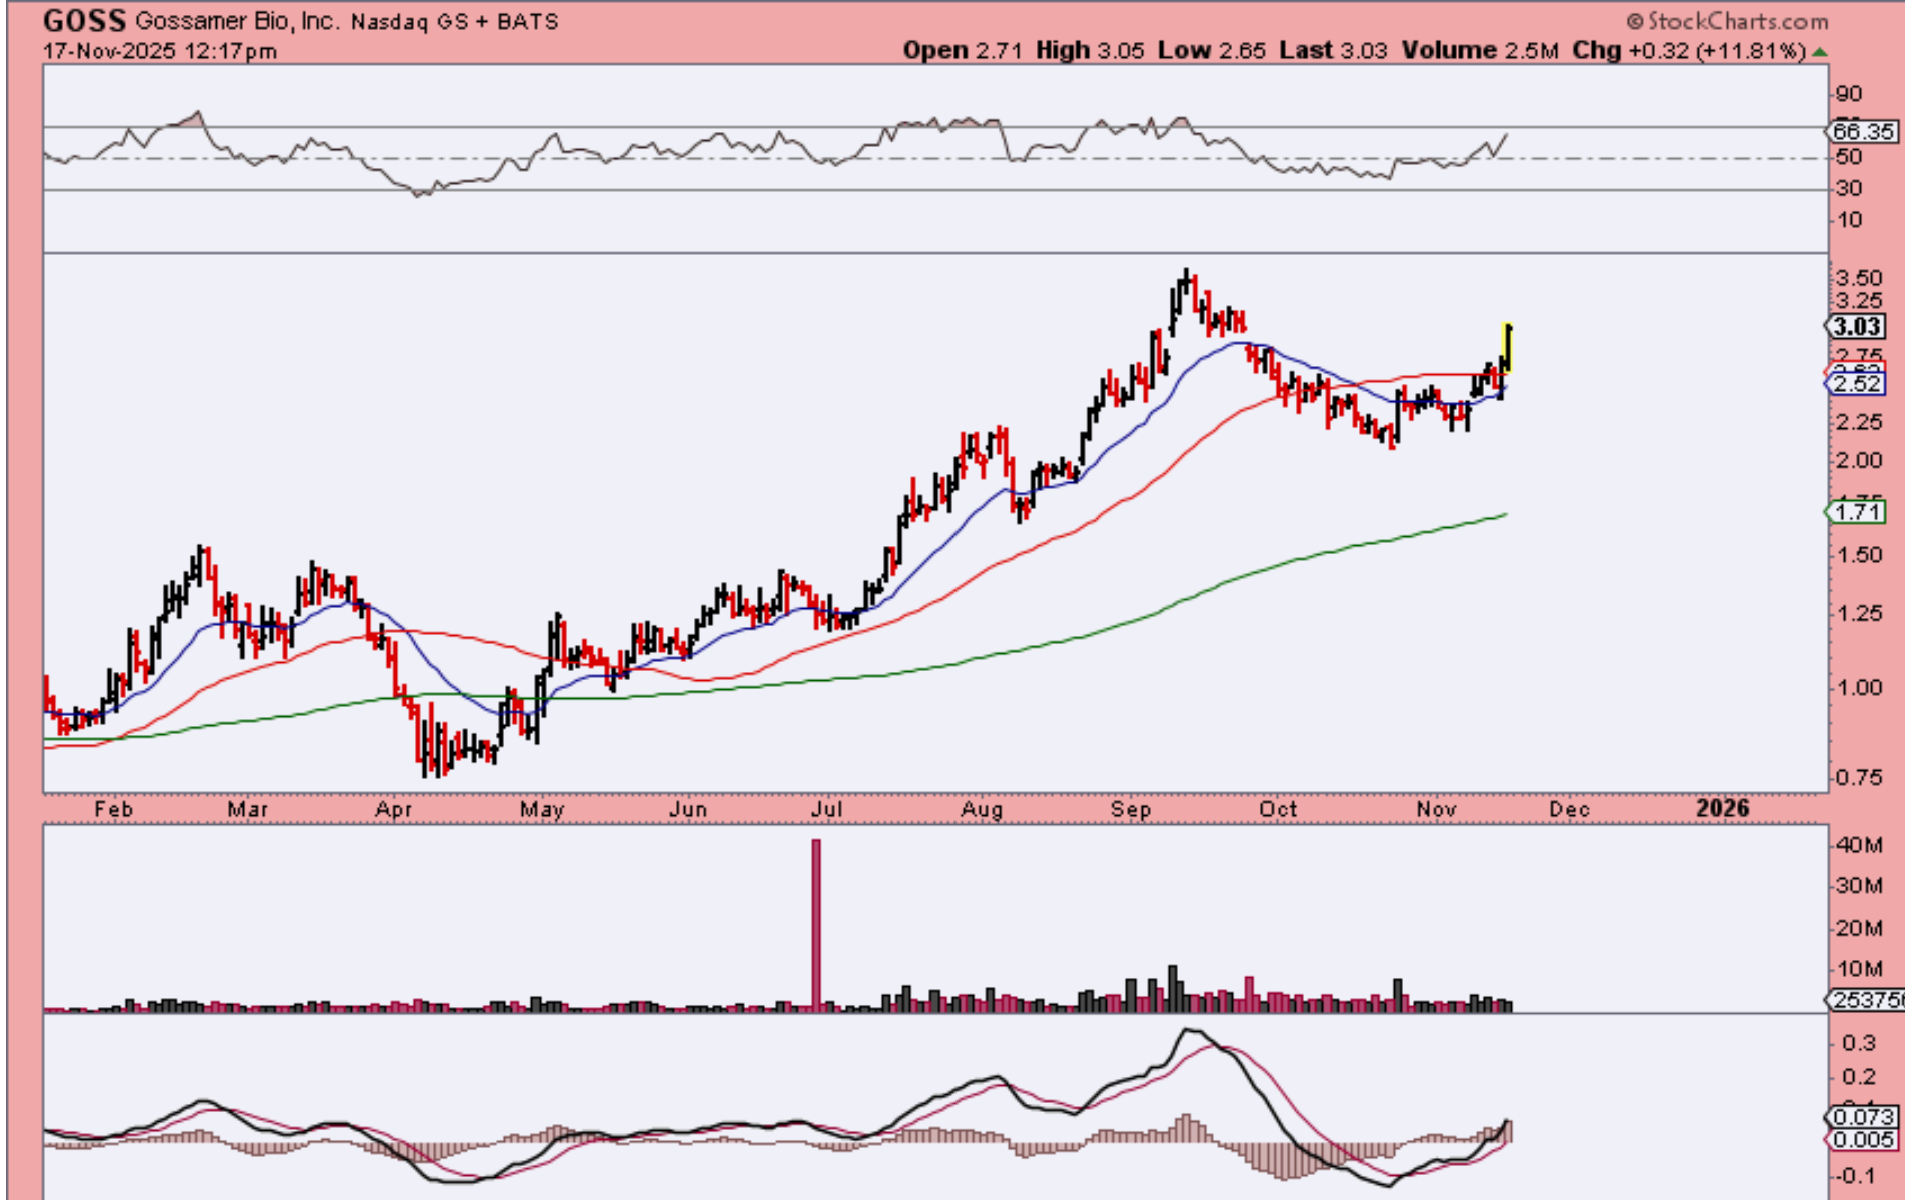
GOSS actually looks very good forming a cup and also ATNM, ERAS, OMER, VSTM, and others look good too. The hard part was that many were up 10-20 % already and with GOSS it was up near 10% 2 days in a row, so you risk buying and getting a pullback of 10% too.
.
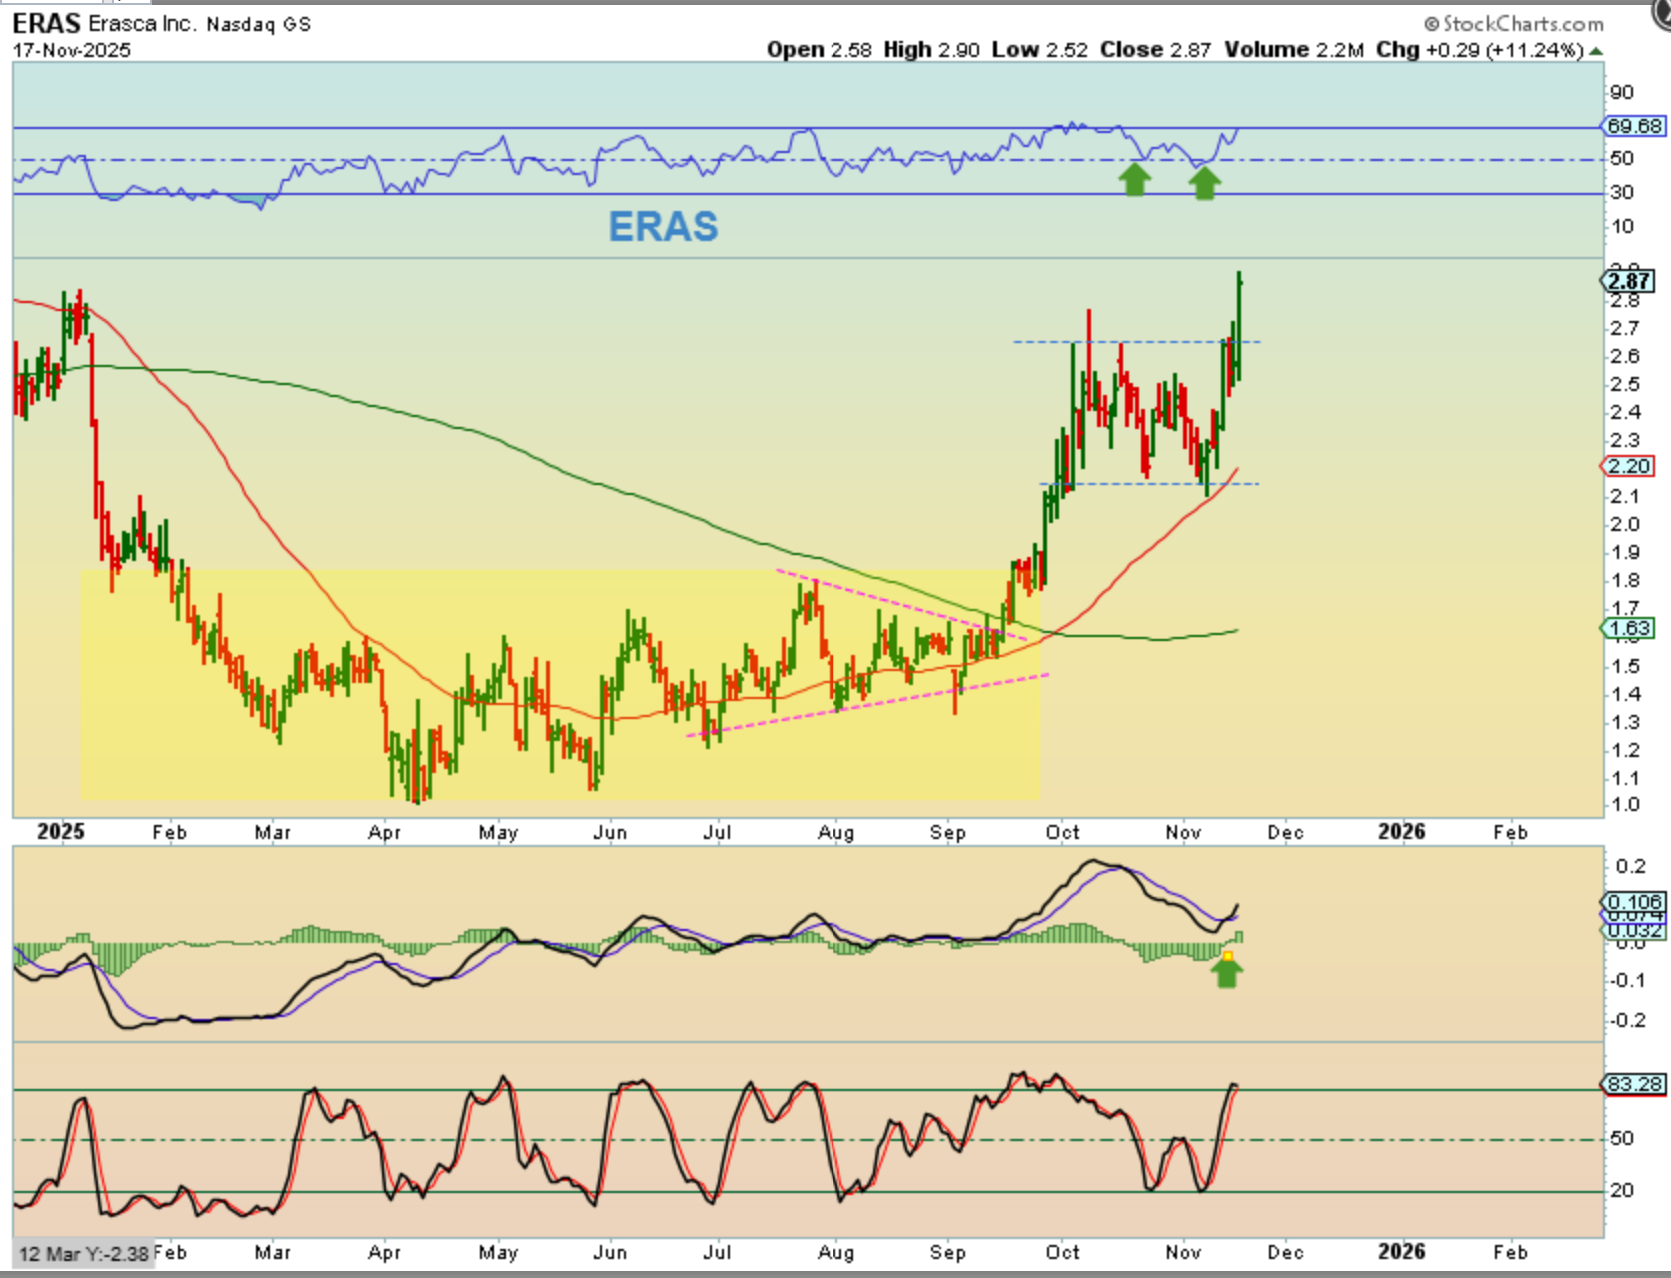
ERAS is another example of a bullish chart that is now at the recent highs despite the markets selling off, so this sector is still strong. I may check through my watch lists and see if there are laggers that are set up properly.
.
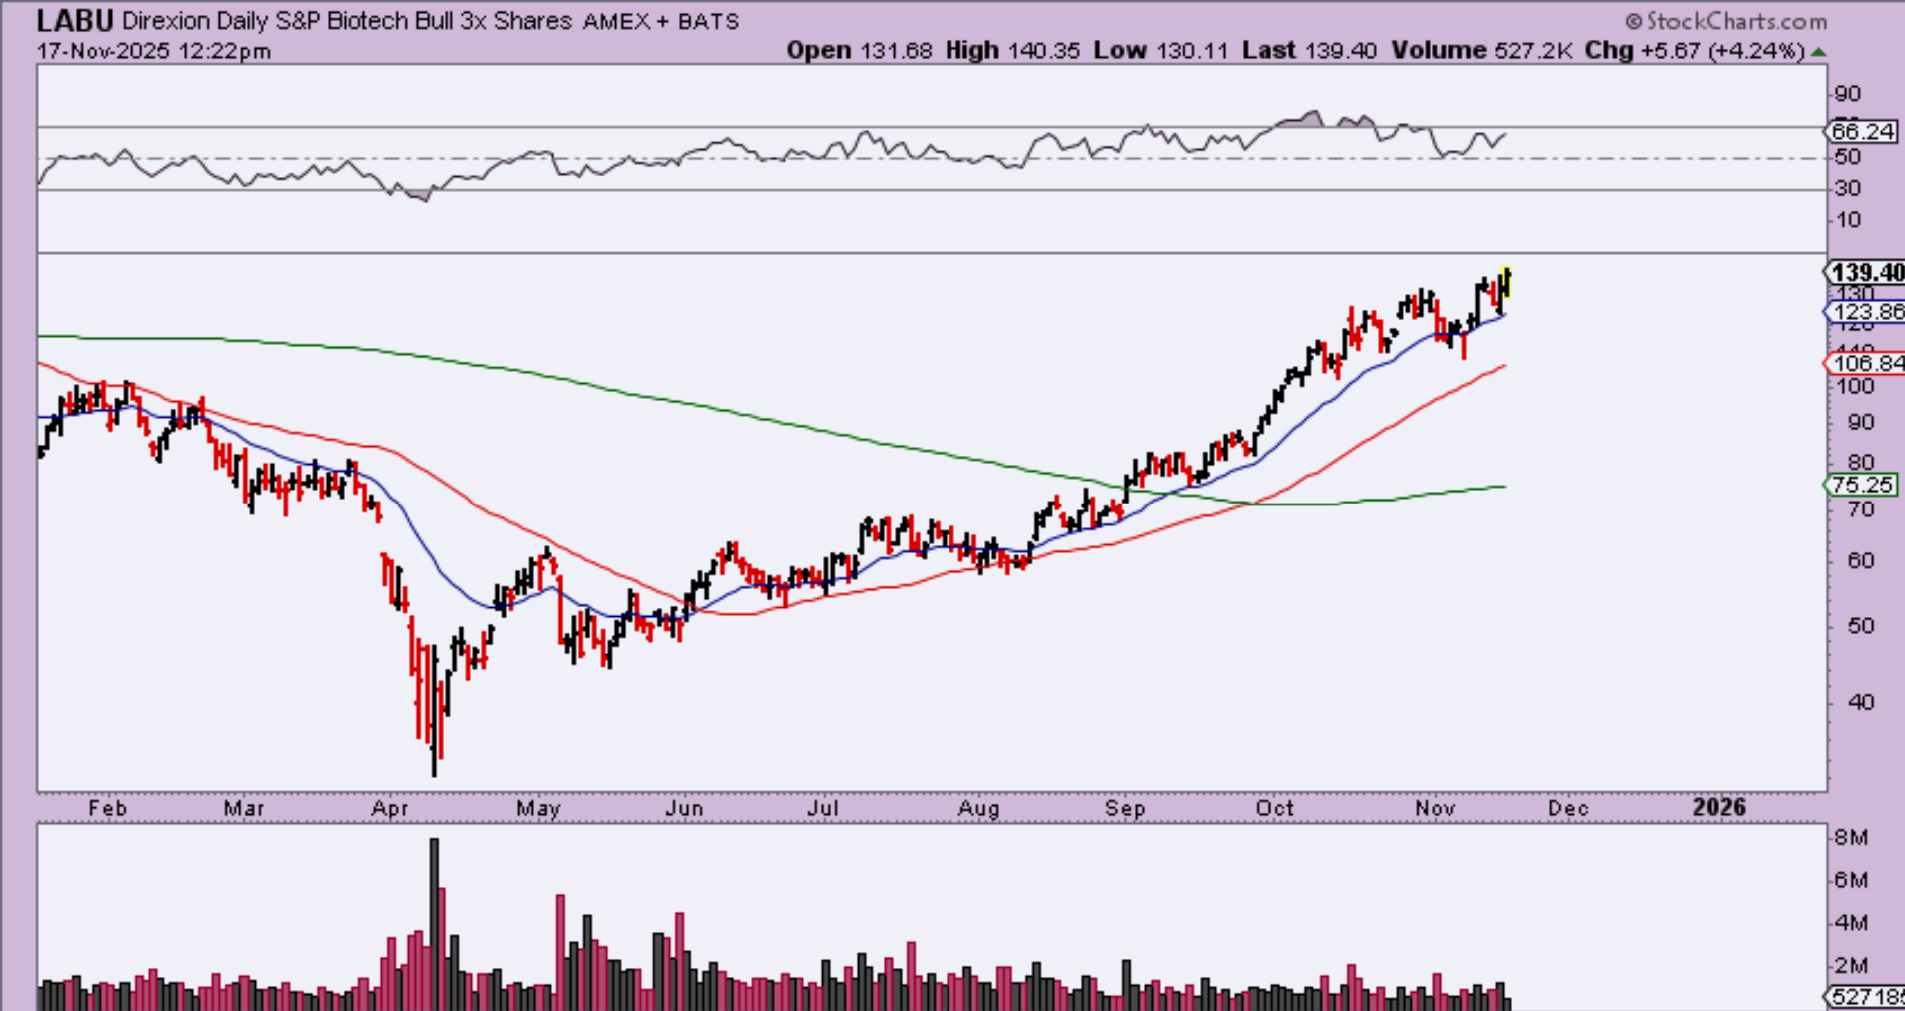
LABU (or IBB ) – You can see the steady run that moved out of the April ICL. It started a bit slower, chopping sideways forming a base into August, but then it broke and ran strong. I do wonder if it needs to put in an ICL soon or not, but so far the individual stocks have been doing well too.
.
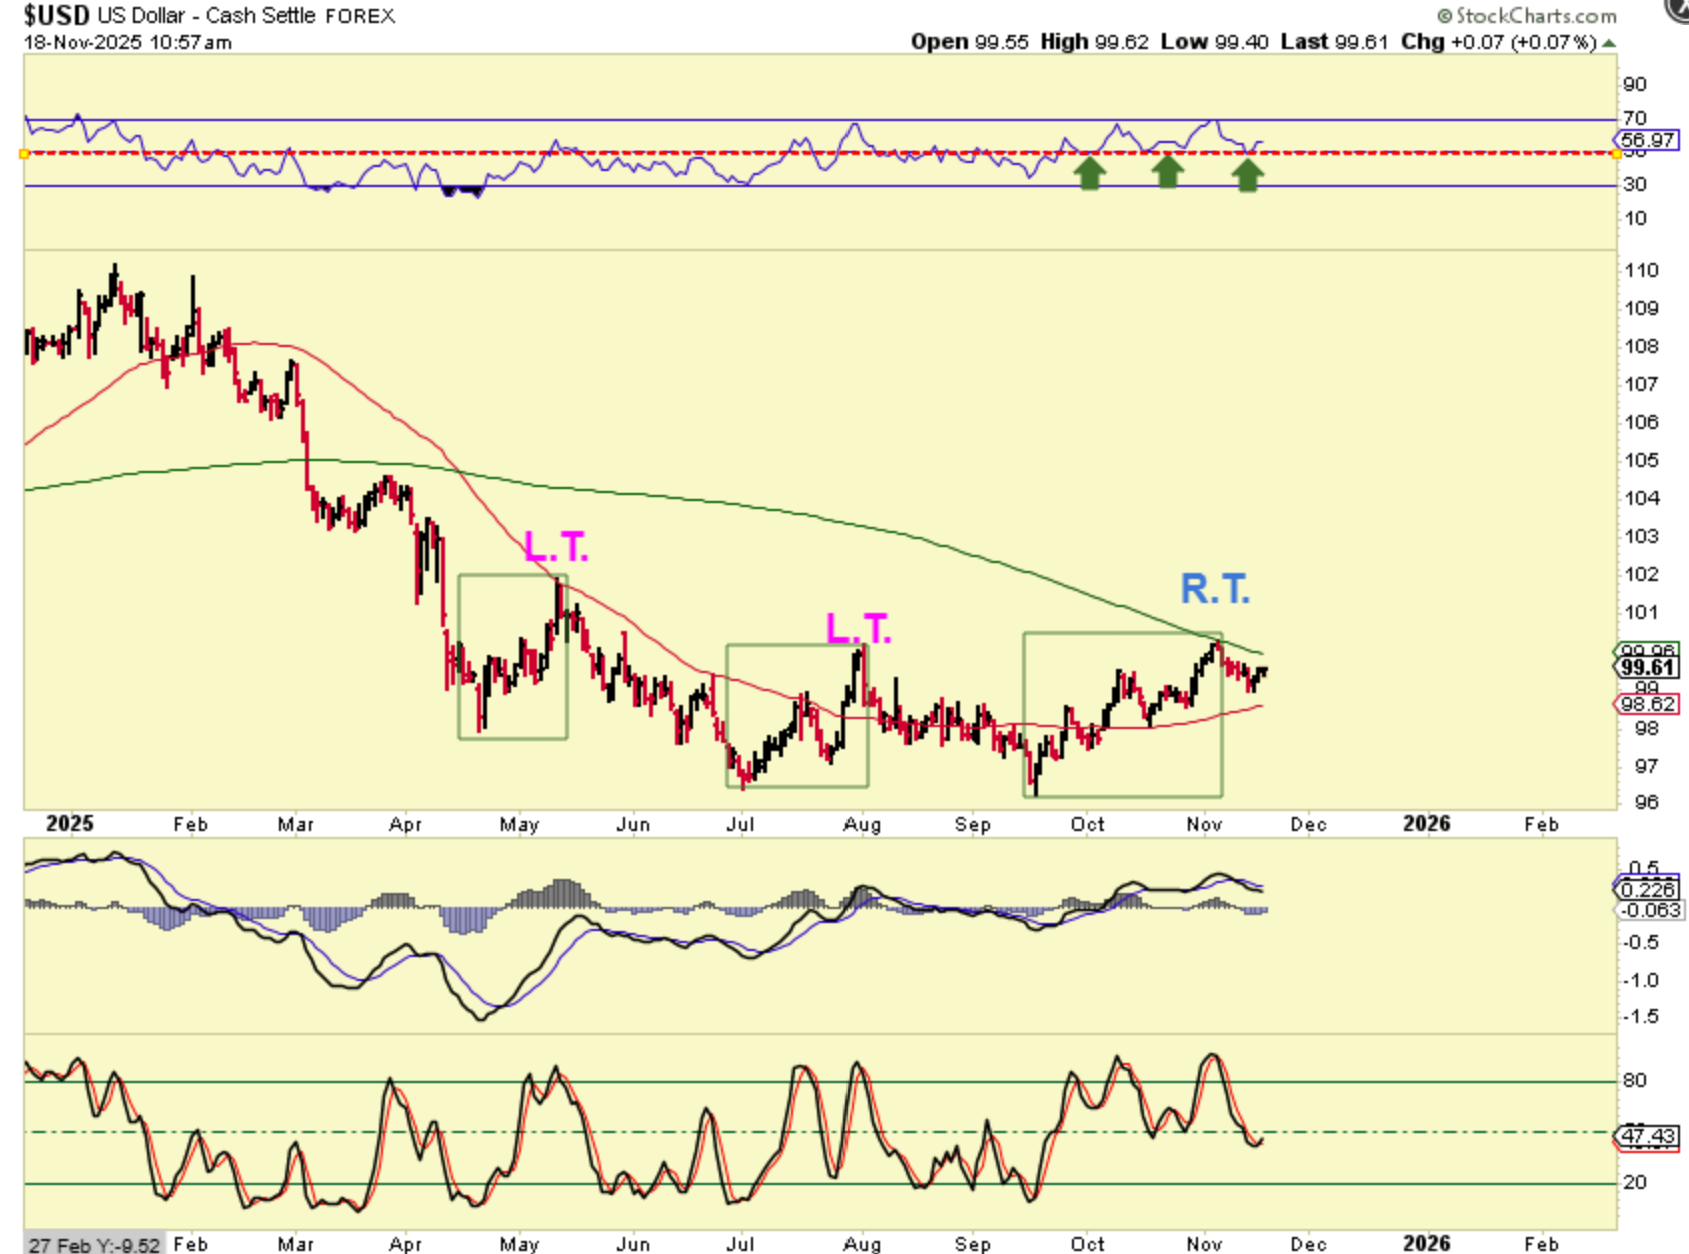
THE USD is crawling under the 50sma, but it is now forming R.T. daily cycles and indicates that an ICL is in place. That means that the USD should be able to break above the 50sma over time. It also makes me wonder about Gold and Silver being able to move against it or not?
.
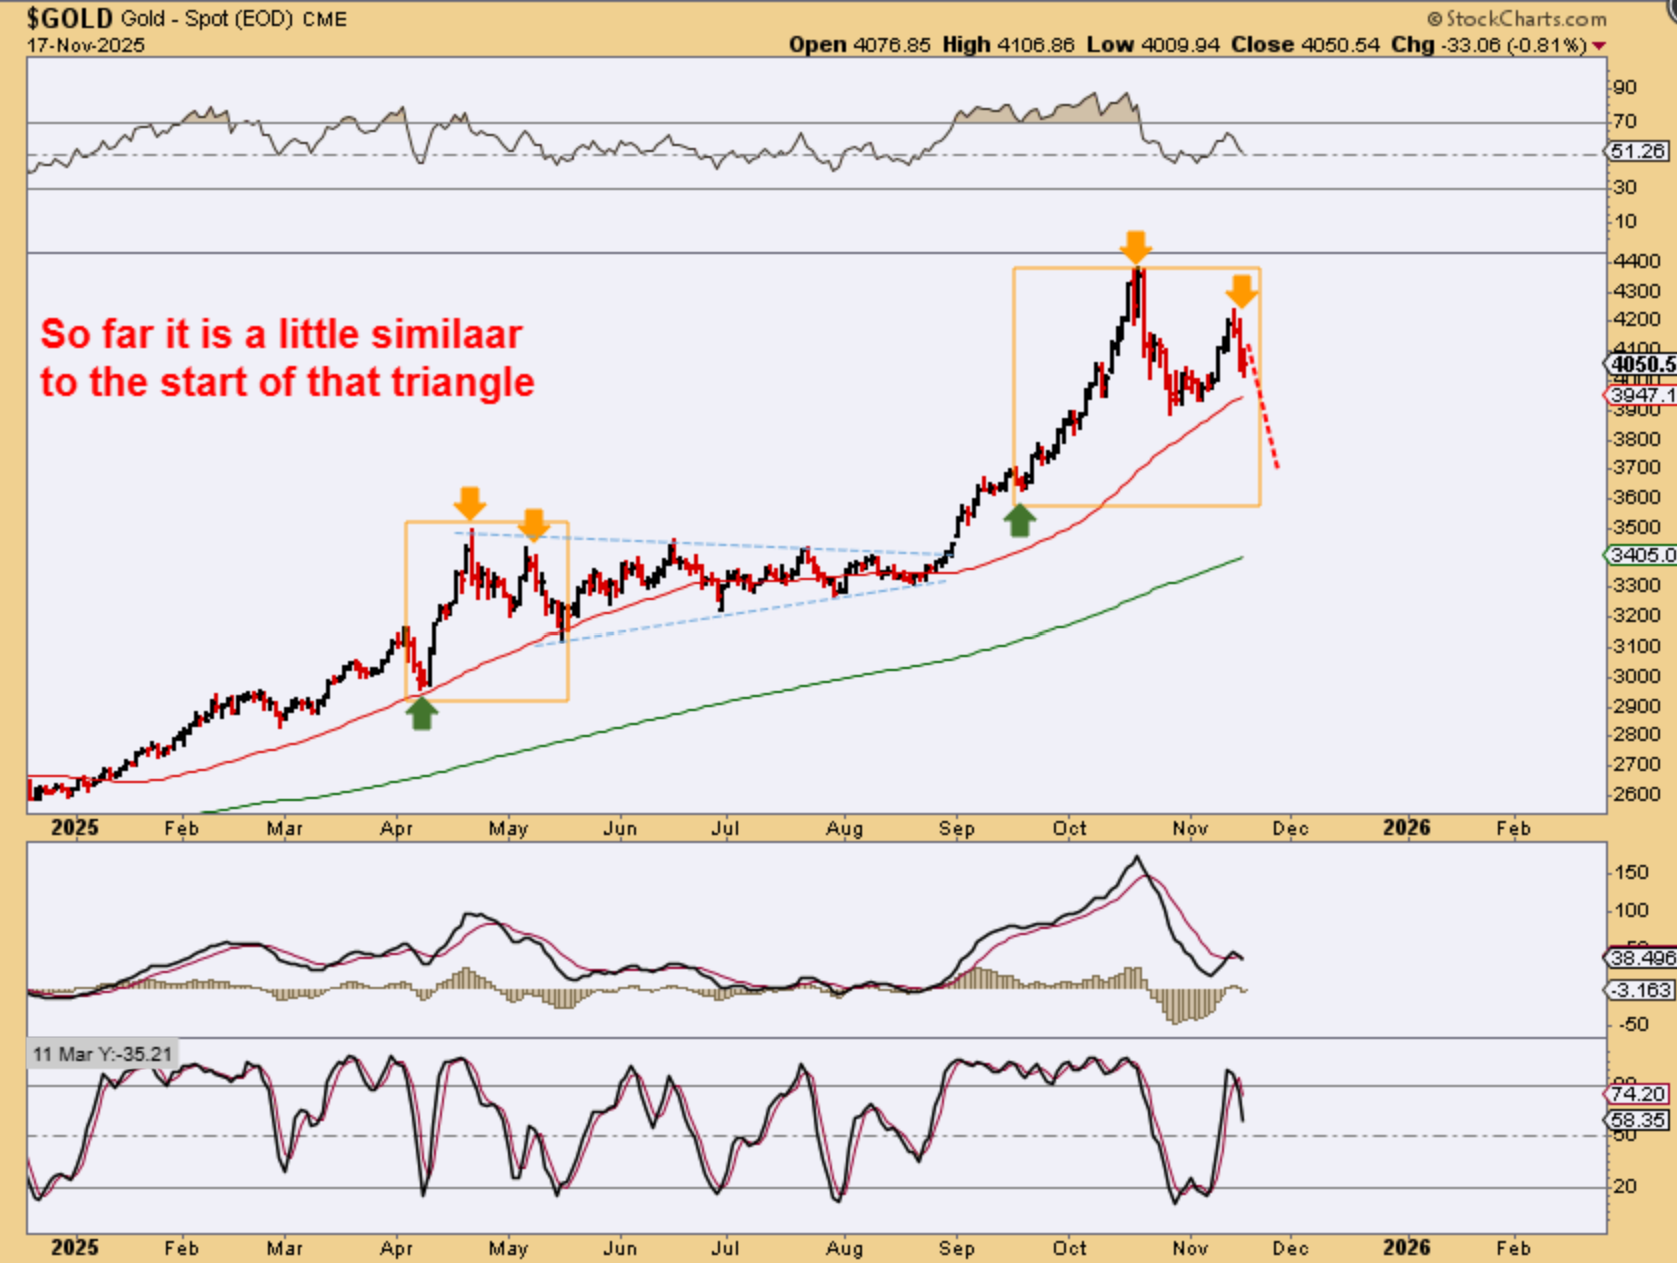
So far, Gold peaked in October and put in a dcl. We are seeing a peak on day 12 so far, and Monday was day 14 of possibly 25-35 days. Good news would be that it is similar to the ‘peak’ in April when it went on to consolidate and prepare to break higher over time. It also may be a double top though, and I have discussed that (similar to the Nasdaq bubble year 2000).
.
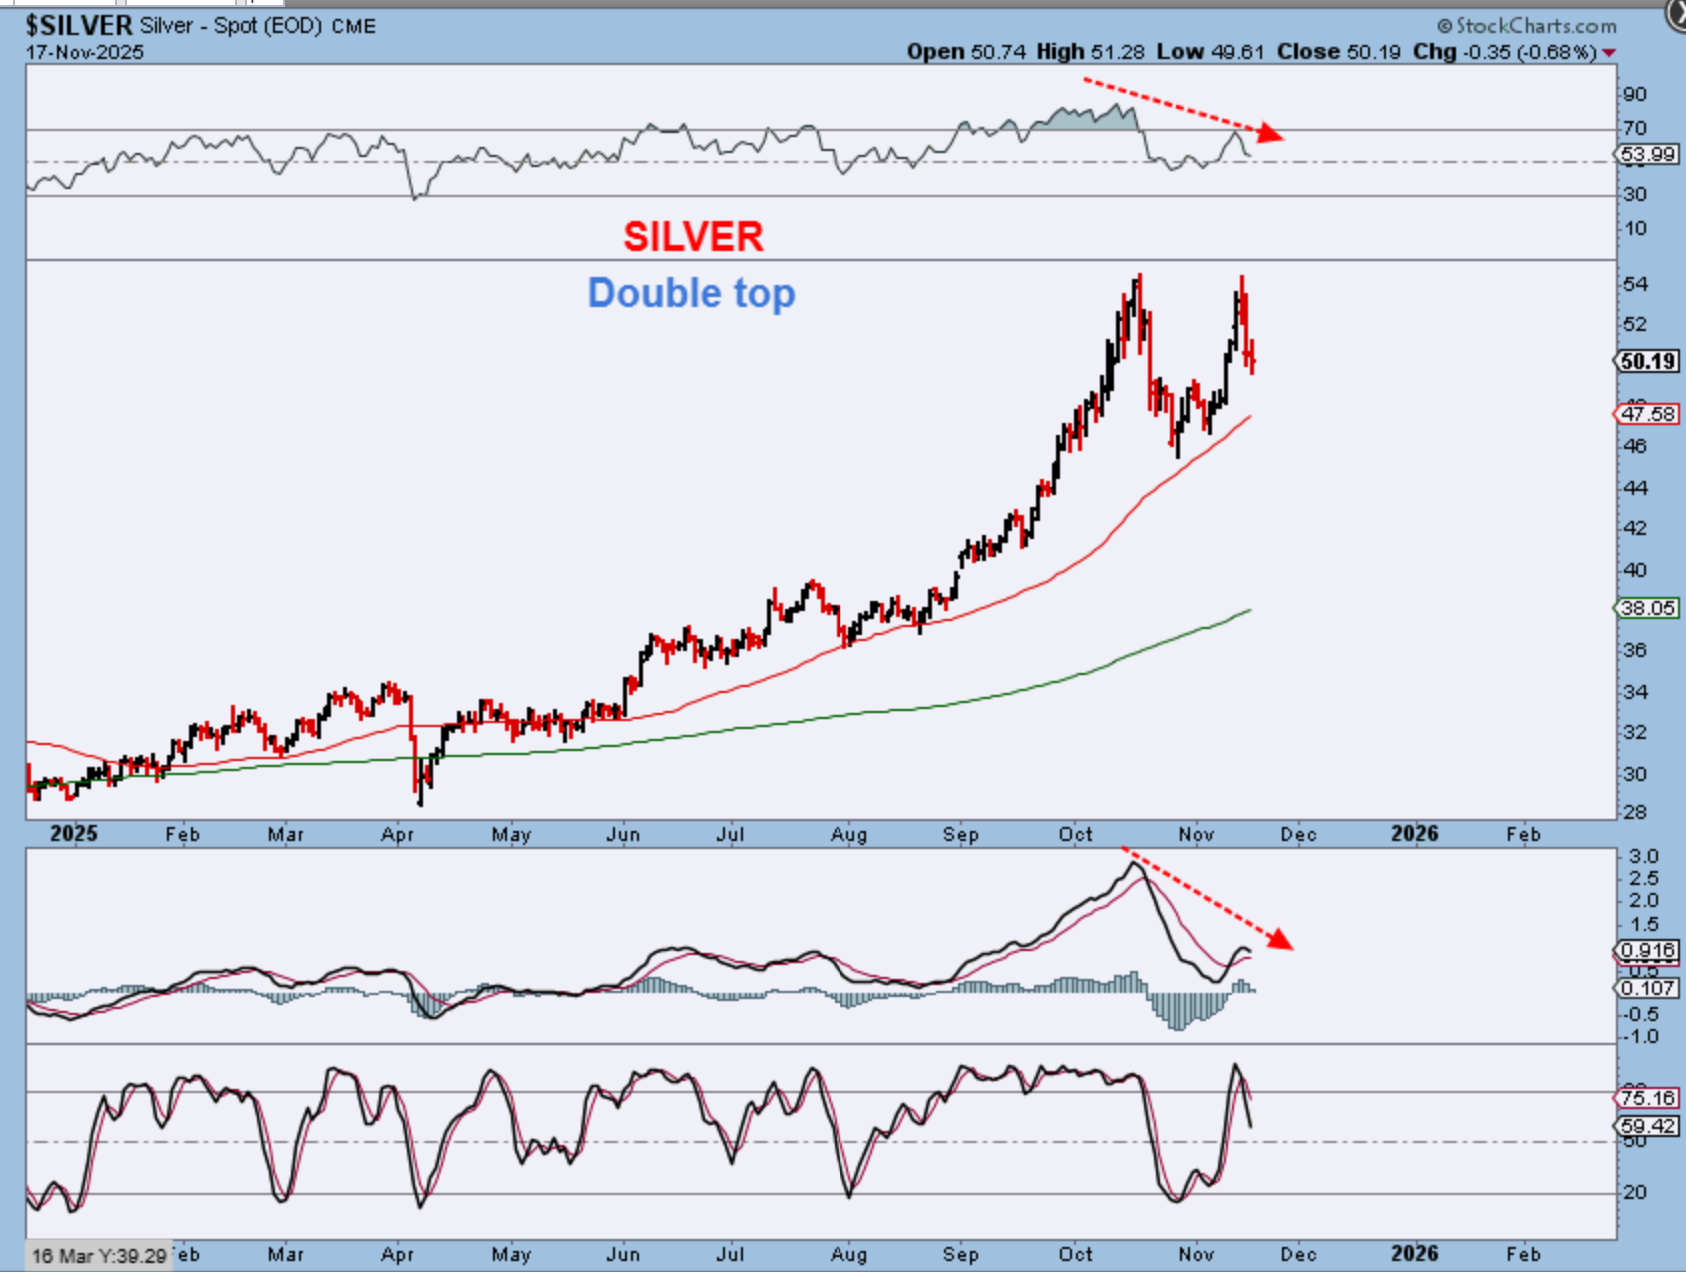
SILVER gave us a double top with a slightly lower high on day 12. The divergence is strong and price has dropped toward the 50sma.
.
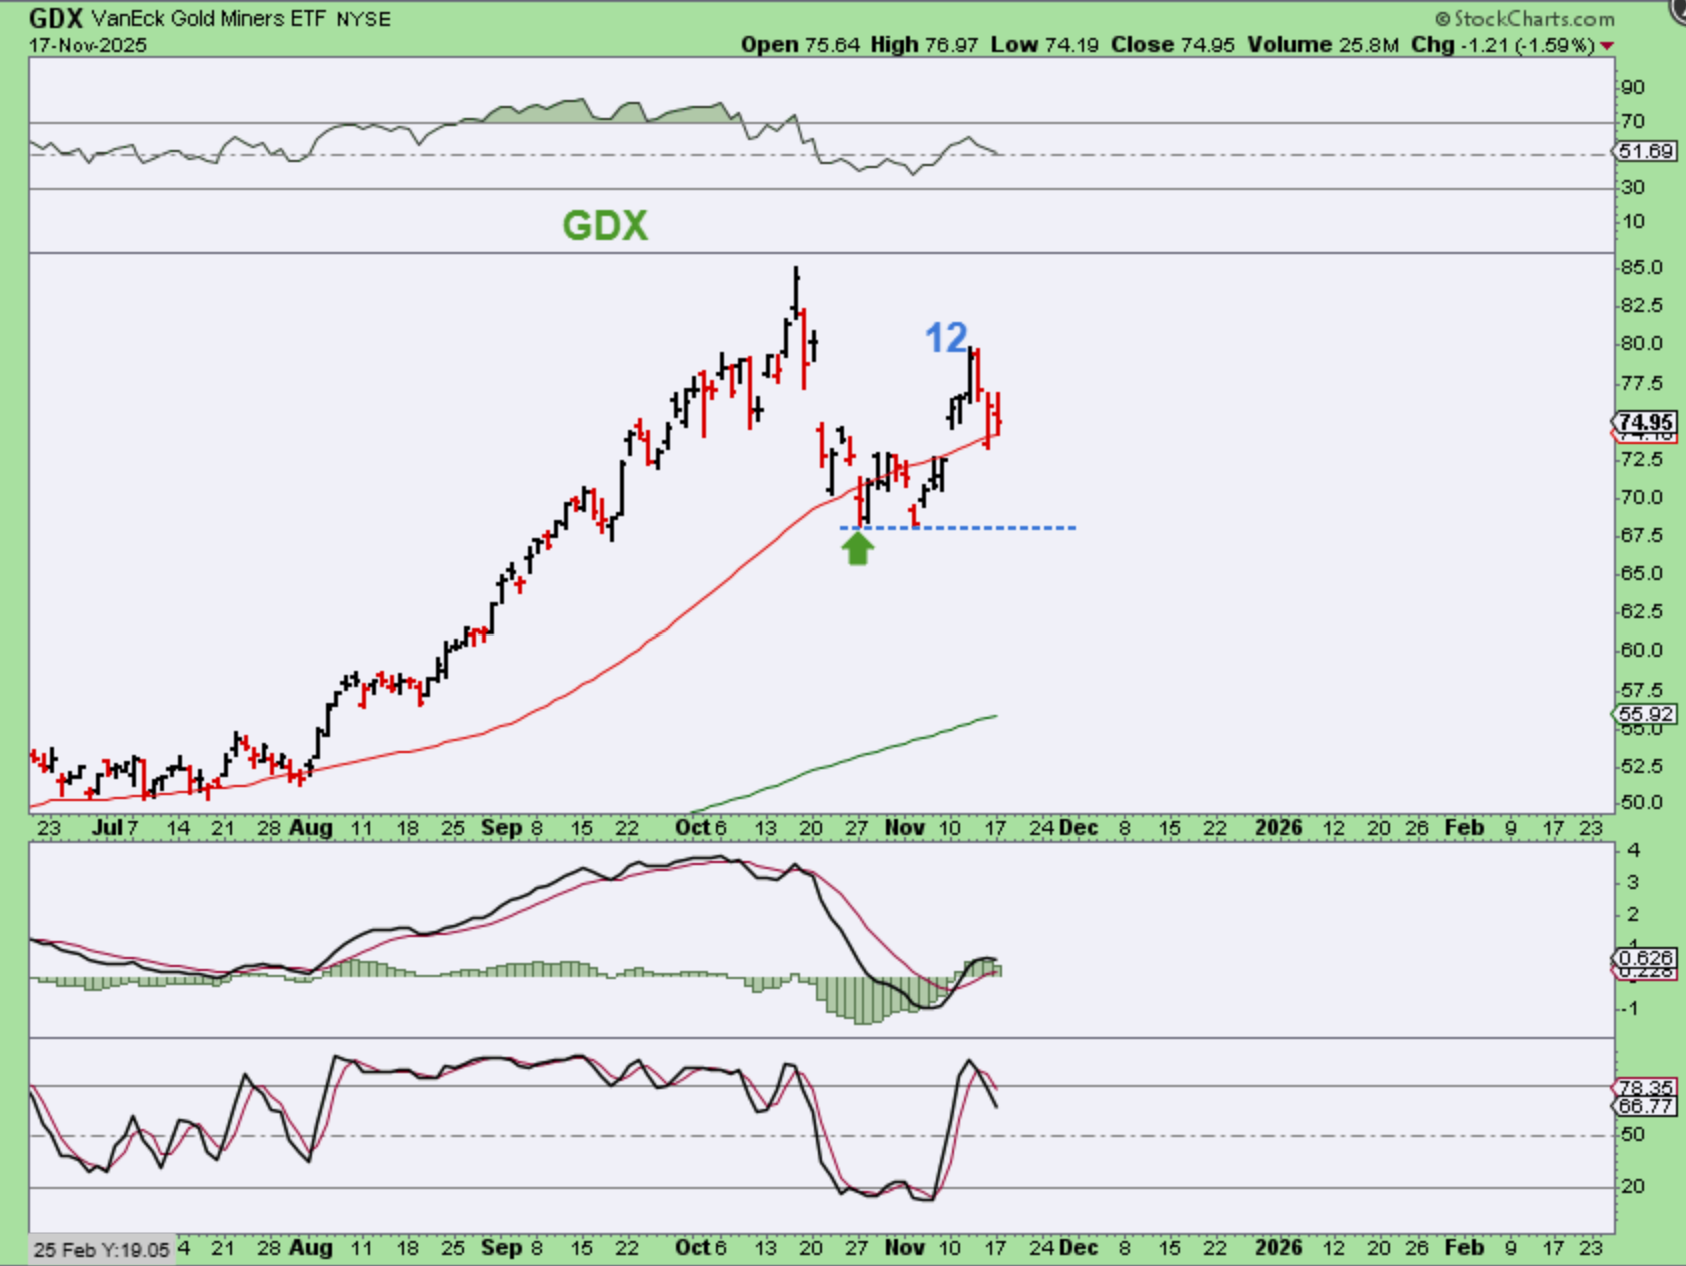
GDX basically follows Gold, but it dropped rather sharply in October, lost the 50sma for a while, and then bounced higher. It has dropped back to the 50sma and should drop lower over time, below the dcl.
.
When the bulls are firmly in control, the markets are exciting and fun! When the markets then start to get overbought and an ICL comes due, it gets choppy, difficult, and even boring, but we want to keep in mind that this has been an ongoing process that leads to a nice buying opportunity at the next ICL. We have been seeing this over and over again. The drop into Aprils ICL was Horrible, caused by news report after news report of new tariffs, increased tariffs, recession fears, etc etc. Once that ICL was in place, we looked at the former strong stocks like RKLB, AAOI, PLTR, NVDA, GOOG, NFLX, and more, and some of them doubled and tripled. That is what we want to keep in mind now. A drop into an ICL can be a great buying opportunity. Right now, for some, Shorting the drops can add some gains, but it really takes patience and skill to avoid shorting a strong bounce in a formerly very strong bull market. SOXS, SQQQ, and even JDST will make gains over time, but those kinds of trades are not for everyone, they may cause occasional chipping away of the gains already made. So in conclusion, we are seeing weakness and drops after small rallies, but we were expecting this and we are going to be prepared to buy the dip, WHEN THE TIME IS RIGHT. Enjoy your Tuesday trading.
.
~ALEX
.
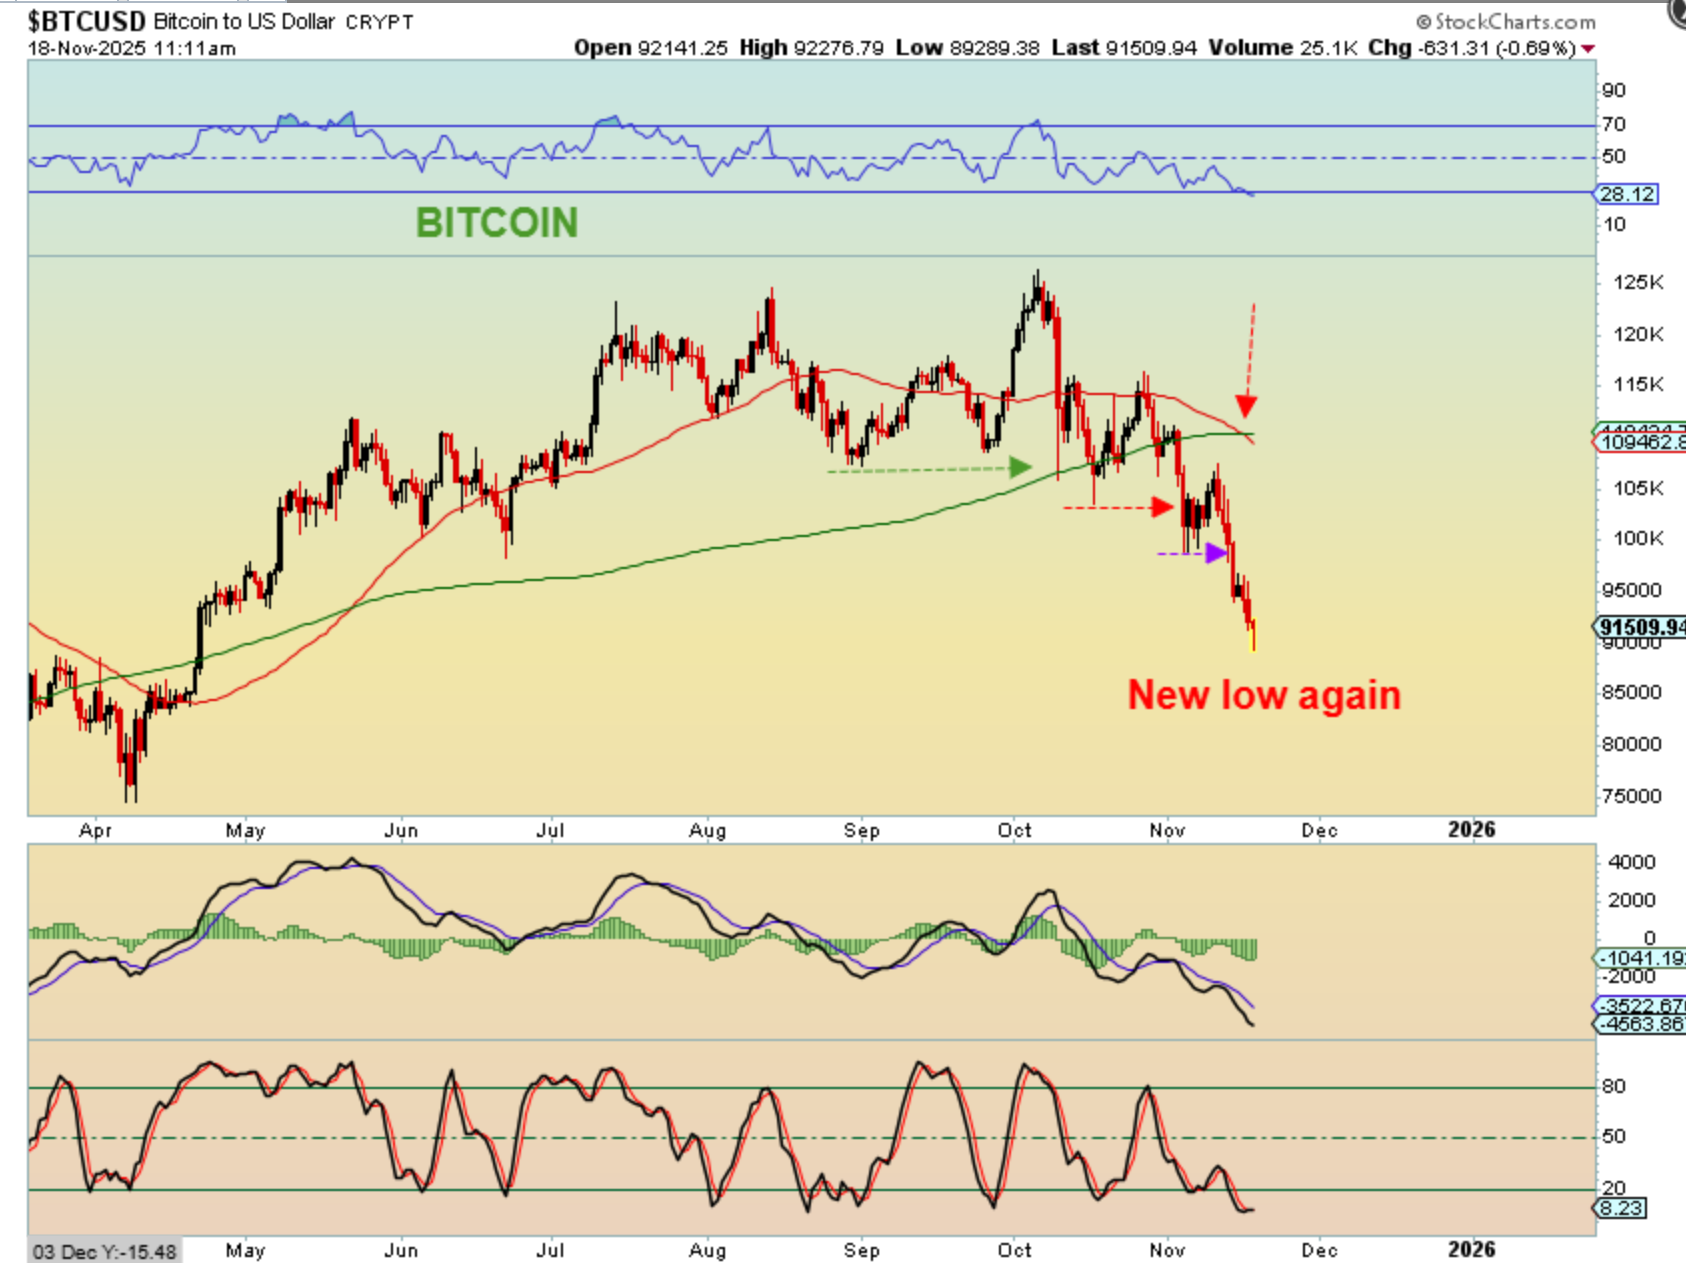
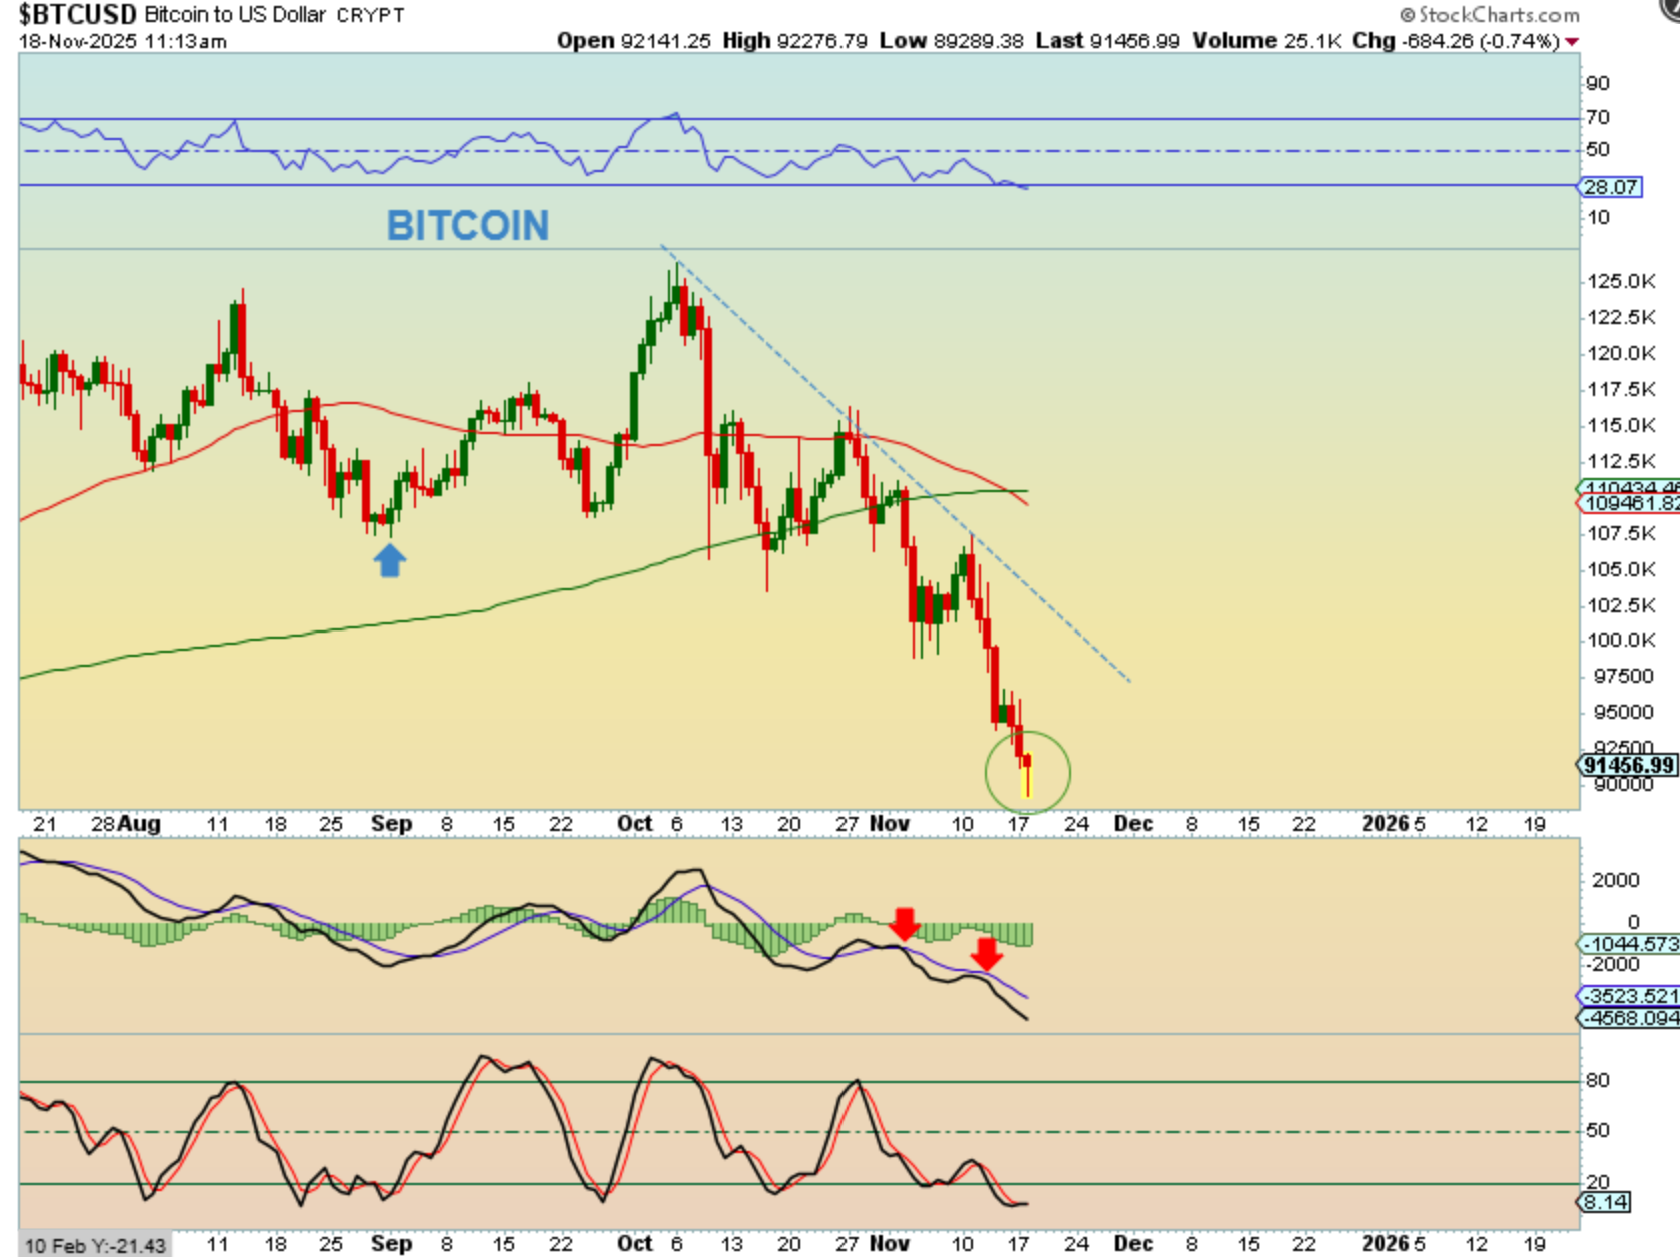
BITCOIN did not find its low yet. When crypto gets weak, it often just crashes and that is basically what we have been seeing. This is a live chart and it may be a reversal that offers that next bounce, but Bitcoin has been very weak.
.
I want to mention something here too. When I started to say that Bitcoin would sell off as we head into the 4th year of a 4 year cycle, I had a few friends actually telling me that there is no way the government will allow Bitcoin to even drop below $100,000 ever again. ‘Trump loves crypto’ they aid. I was told that governments are now buyers and Bitcoin will be gaining $5,000-$10,000 every quarter and will see $200,000 before it ever sees $100,000 again. Ethereum would break $5000 and run to $10,000 rapidly. Well guess what?
.
BITCOIN tagged $89,000 last night. Ethereum moved up under $5000 in October and already fell to $3070 last night.
Sometimes its hard not to get ‘caught up in the hype’, but at the top everyone is euphoric and overly bullish. It is best to take it a step at a time, without emotions, and allow the markets to speak. This chart speaks volumes right now. It will likely bounce and drop again.