
November 8th Weekend Report
.
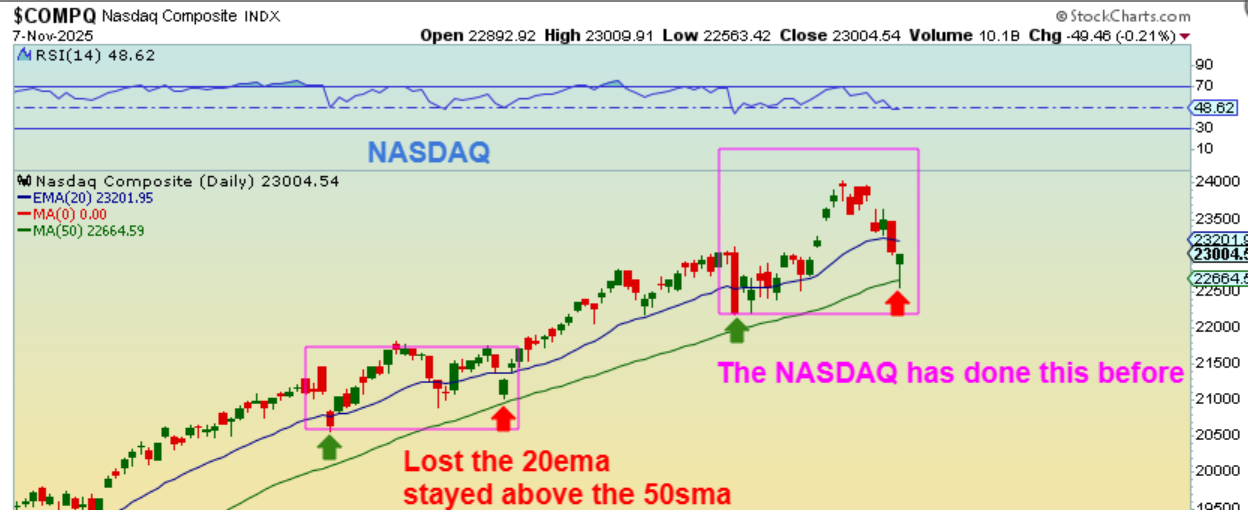
NASDAQ – I mentioned a half cycle dip to the 20 ema, but we have seen dips to the 50sma too. Well Friday saw more selling, but then buying came in in the 2nd half of the day so we have a reversal candle at the 50sma. it ALMOSTR broke the dcl, but it didn’t, so this is still able to rally higher. THAT SAID…I think we just get a bounce for now…
.
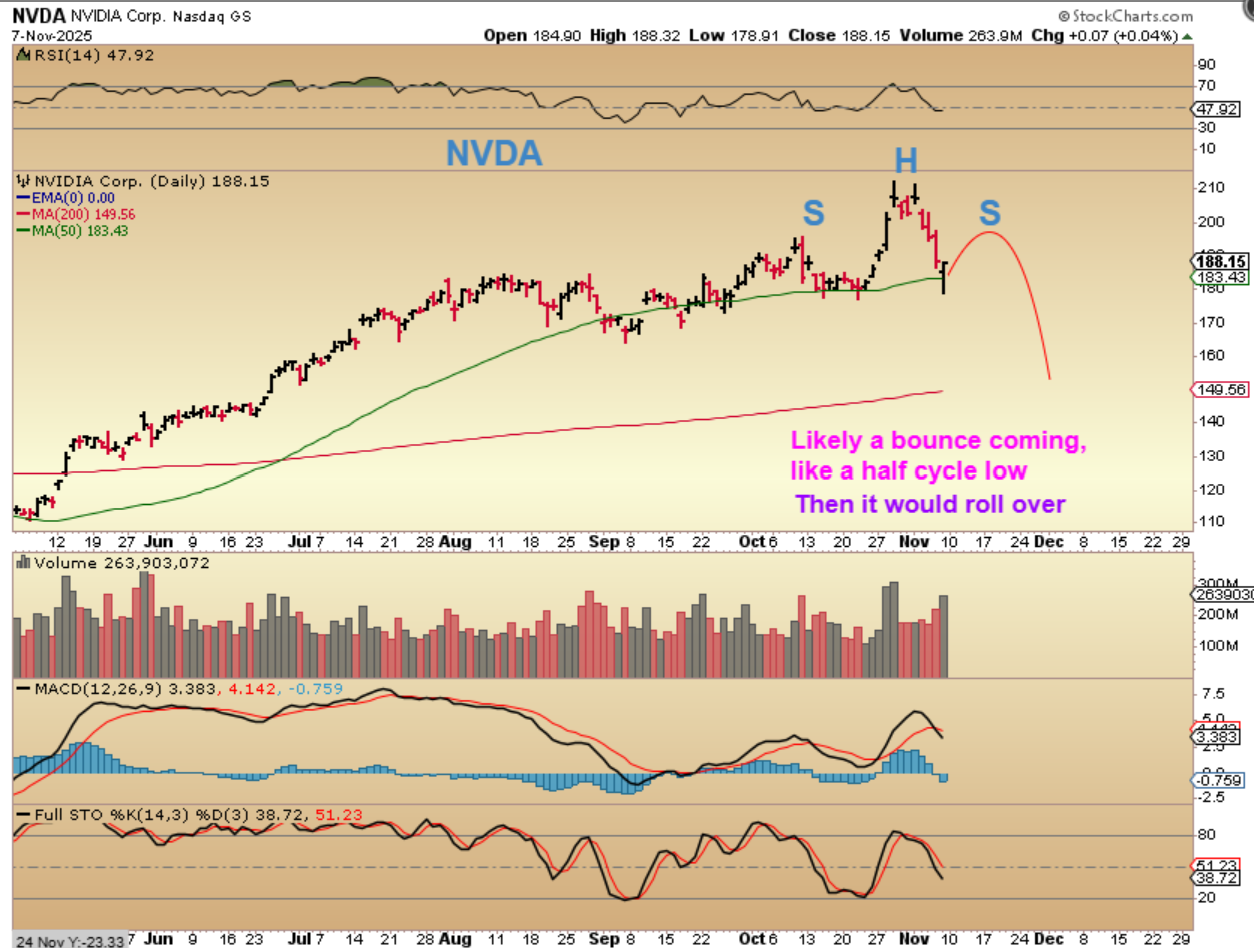
NVDA – I pointed out some stocks that looked to be weakening too, and they also dropped, lost the 50sma, and regained it by the close, but a small bounce could lead to a H&S formation. We are getting deeper into the daily cycle so expecting a strong rally doesn’t seem to fit the current set up.
.
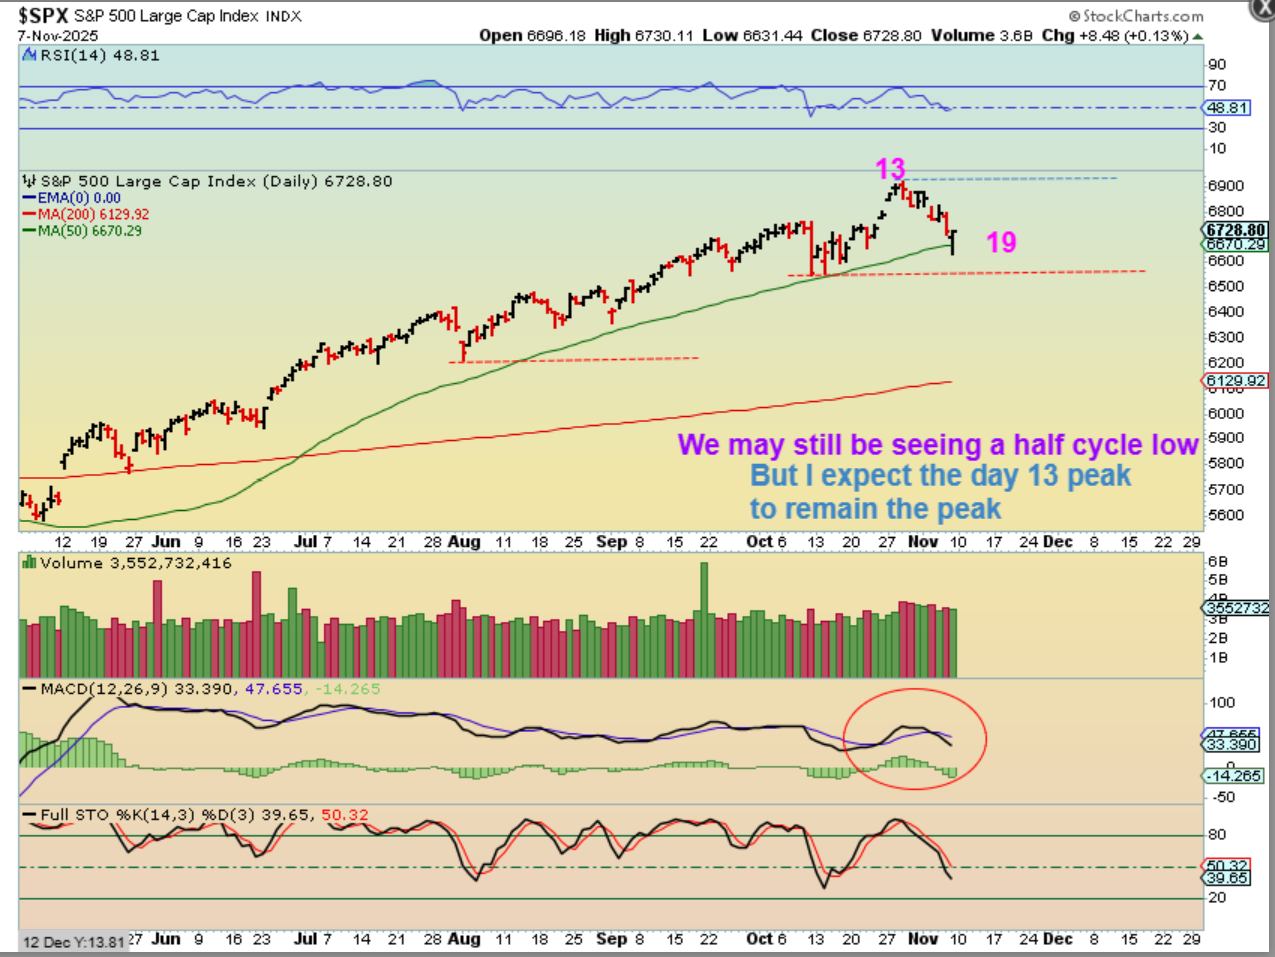
So it was the same with THE SPX. We lost the 50sma with Fridays sell off and suddenly the markets recovered in the 2nd part of the day. We did not break the dcl low, so it is not a failed daily cycle. You can see that buying lasted right to the close too, since we closed at the highs. Due to the ‘timing’, I think that day 13 will remain the ‘peak’ to make this L.T., but we’ll see next week.
.
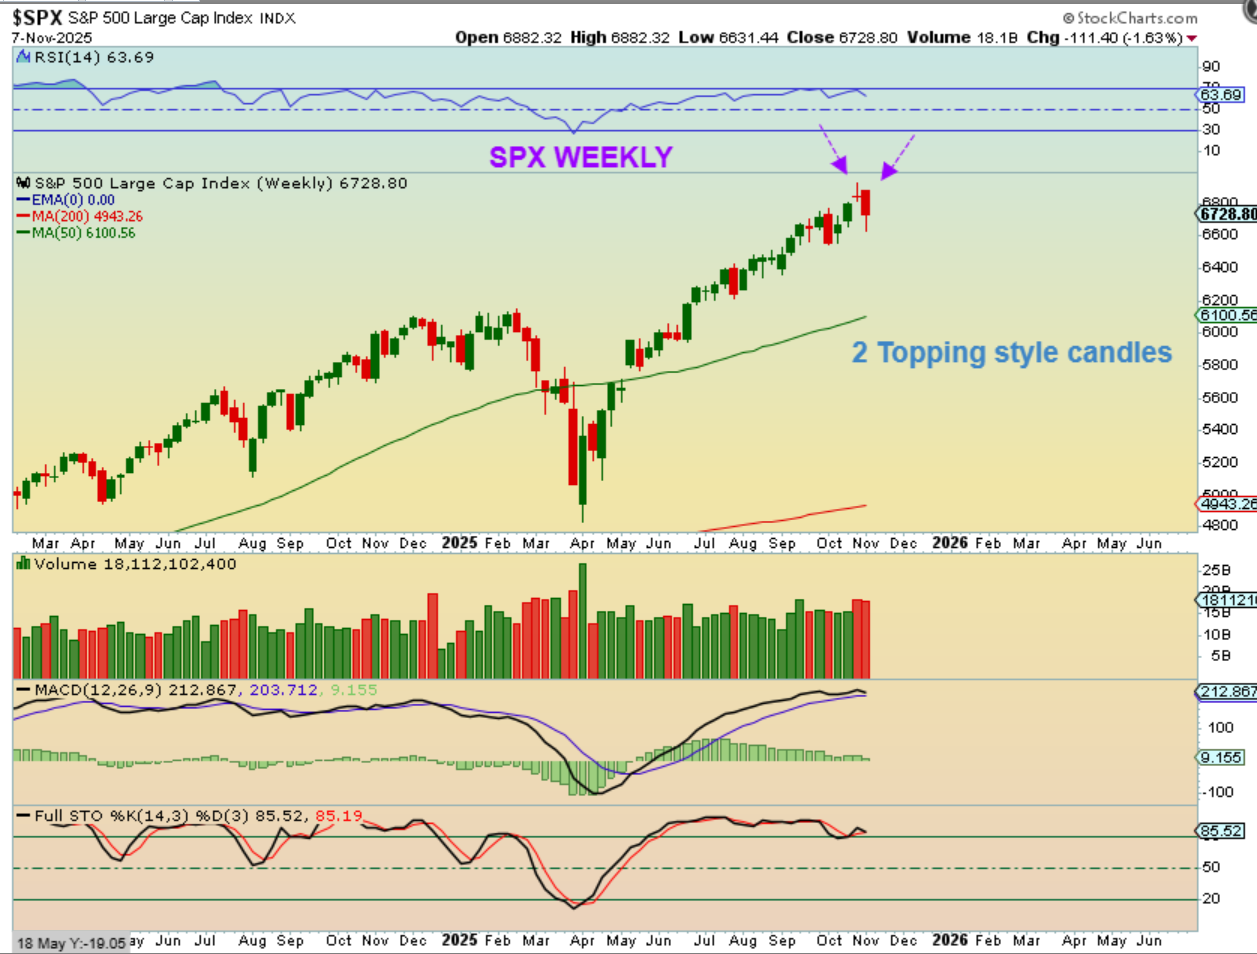
SPX WEEKLY – 2 reversal candles, bt this can still chop sideways and then drop into an ICL.
.
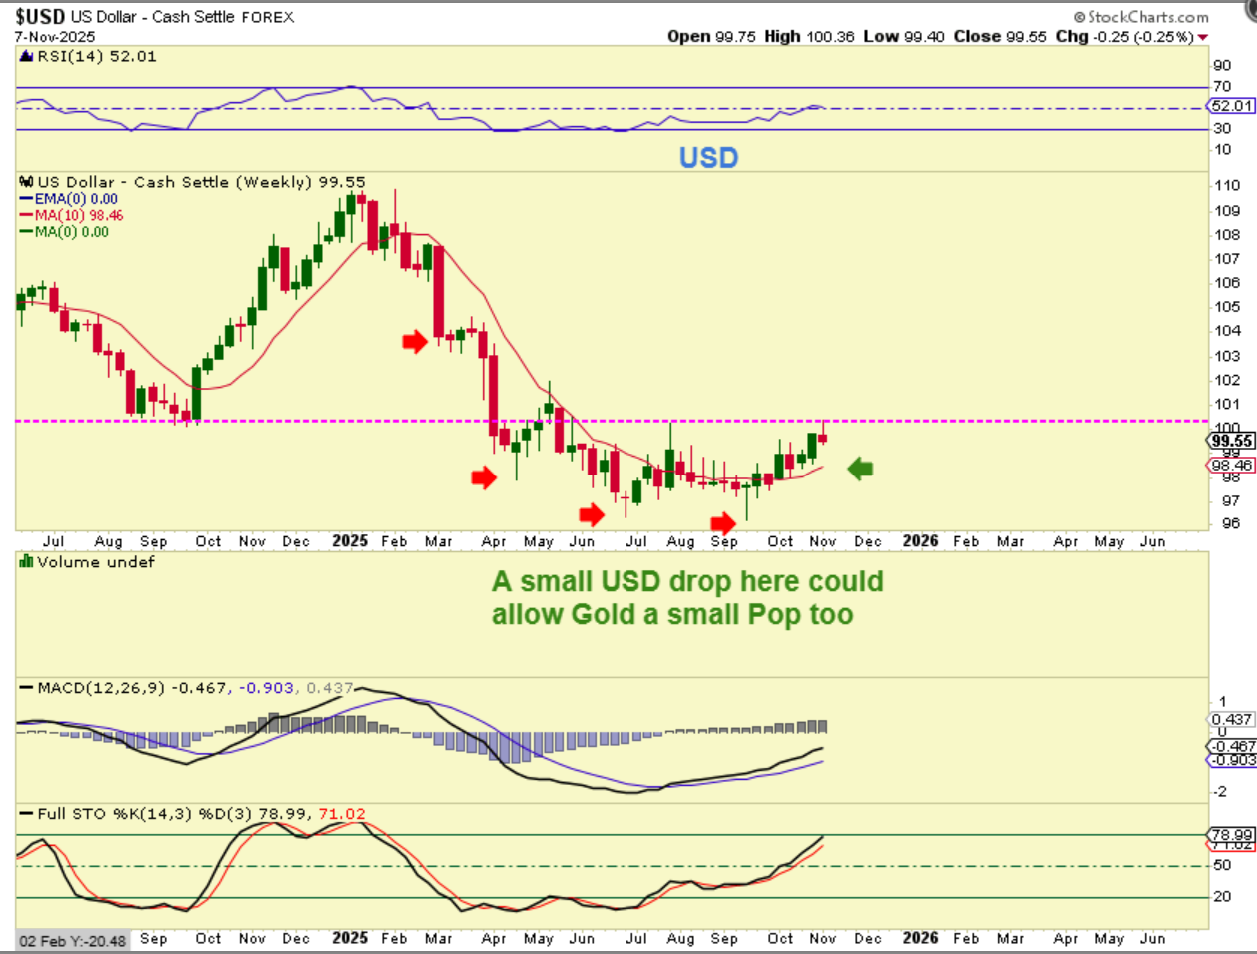
THE USD has been moving higher but it is at a resistance point, and it did start to pull back at the end of the week. When the USD pulls back, I’m expecting a higher low. Please see the chart.
.
So I expect that we’ll see
– A USD dip that won’t break the lows, and
– A GOLD pop that may not break the highs. Gold is oversold.
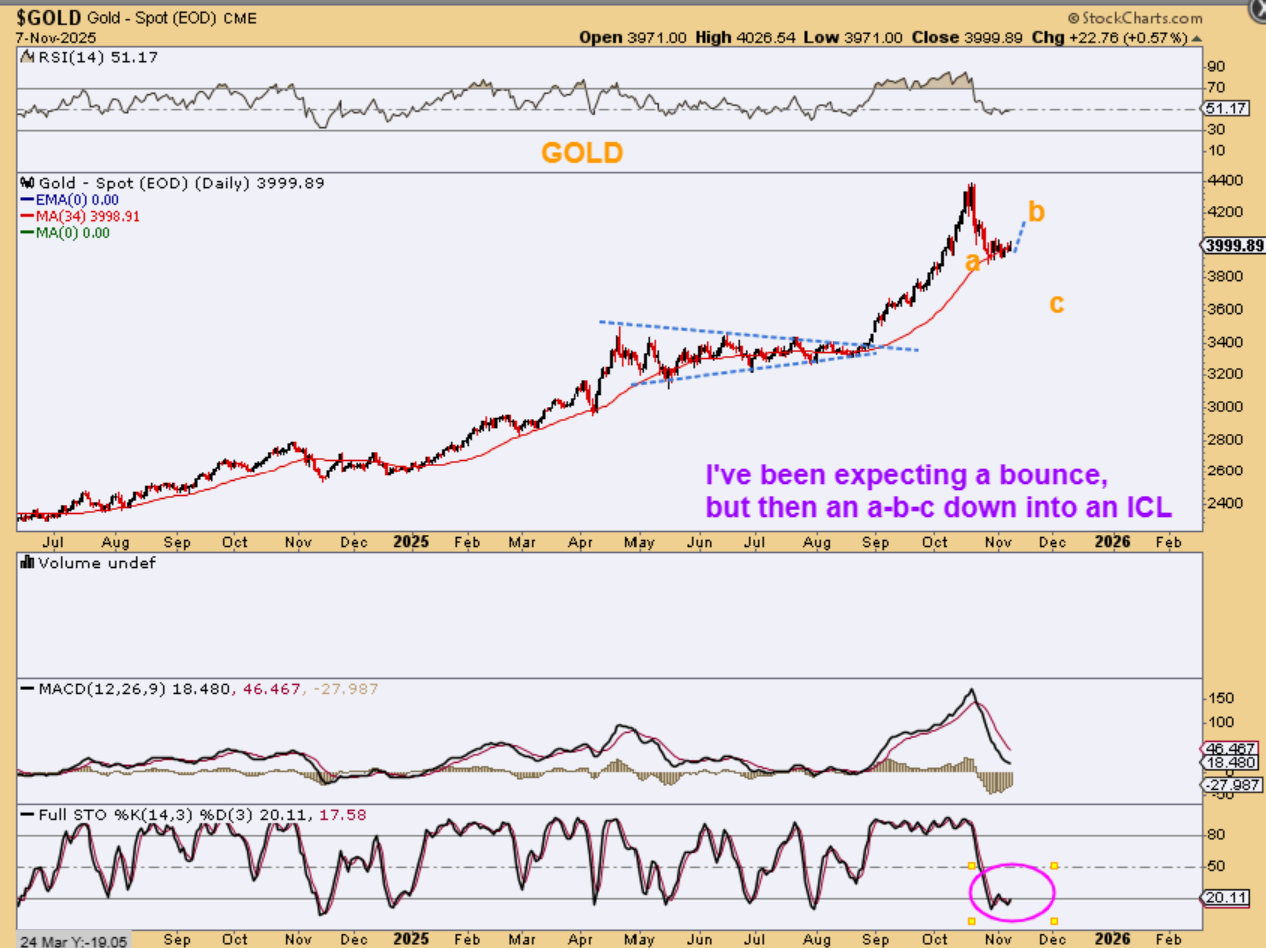
– I have discussed an a-b-c drop into an ICL too.
.
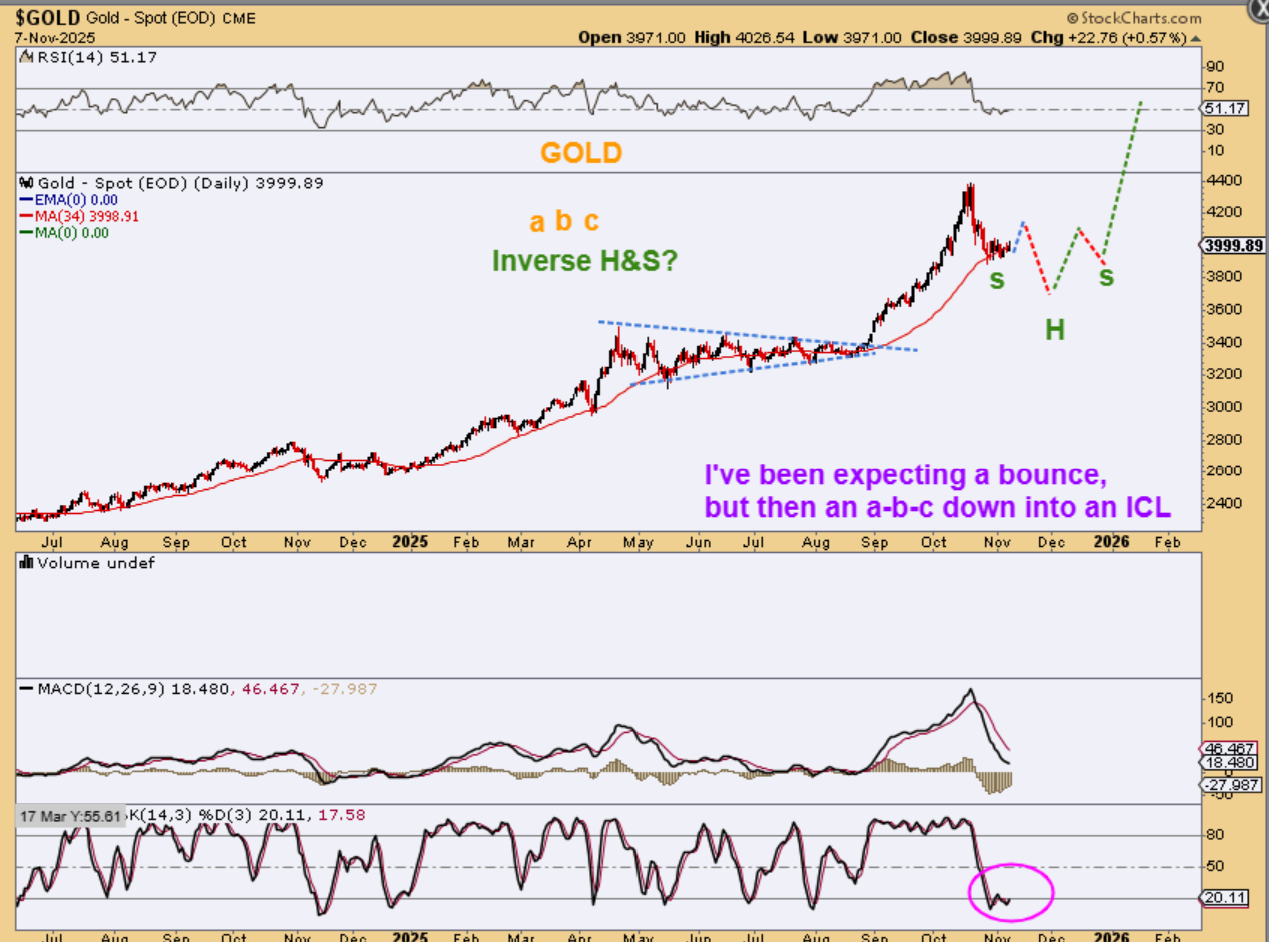
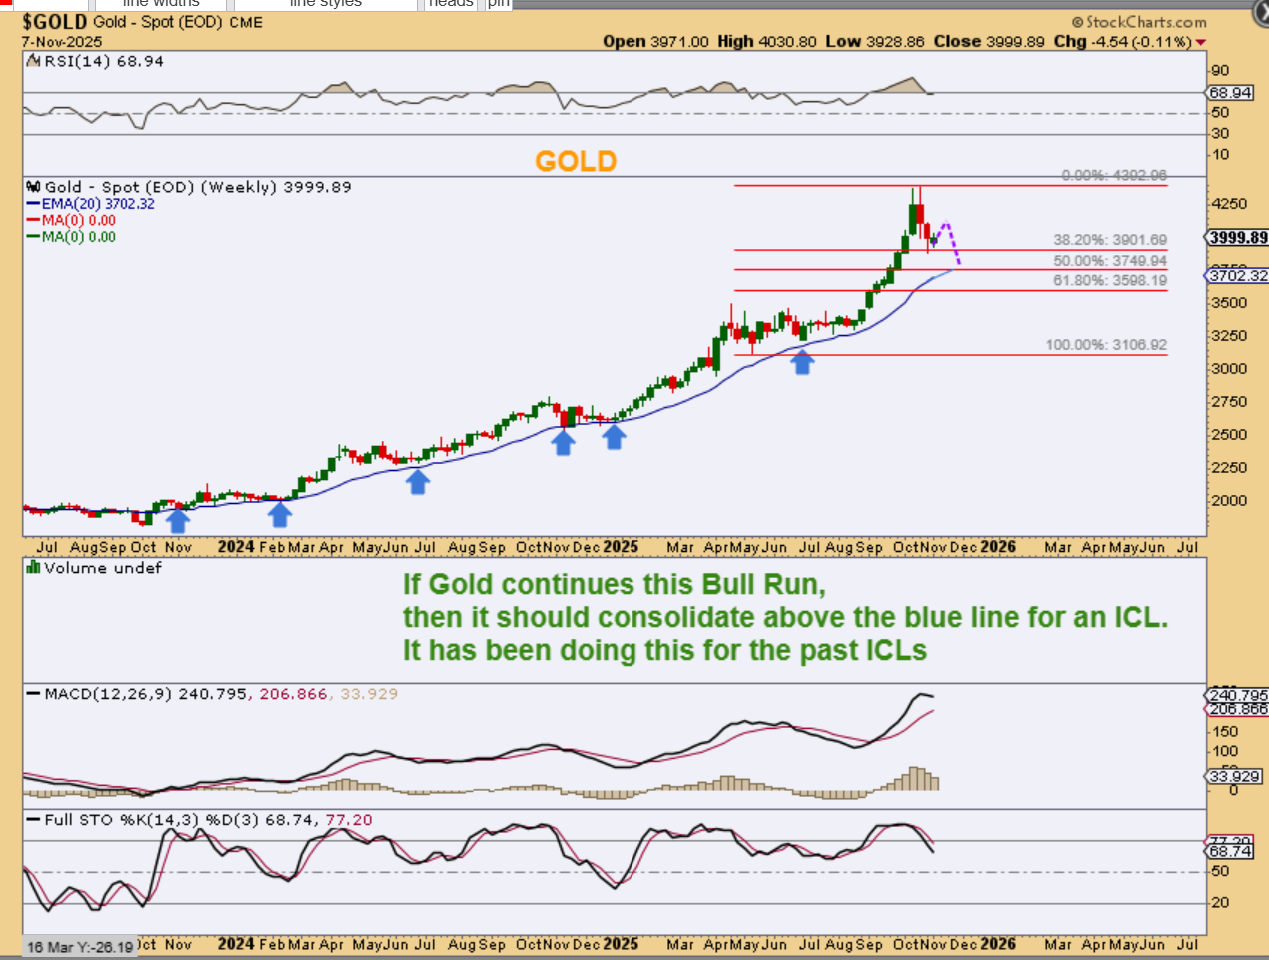
GOLD – A simple a-b-c drop into an ICL can lead to an inverse H&S too. We could get a perfect buy set up if that wasn’t a parabolic top.
.
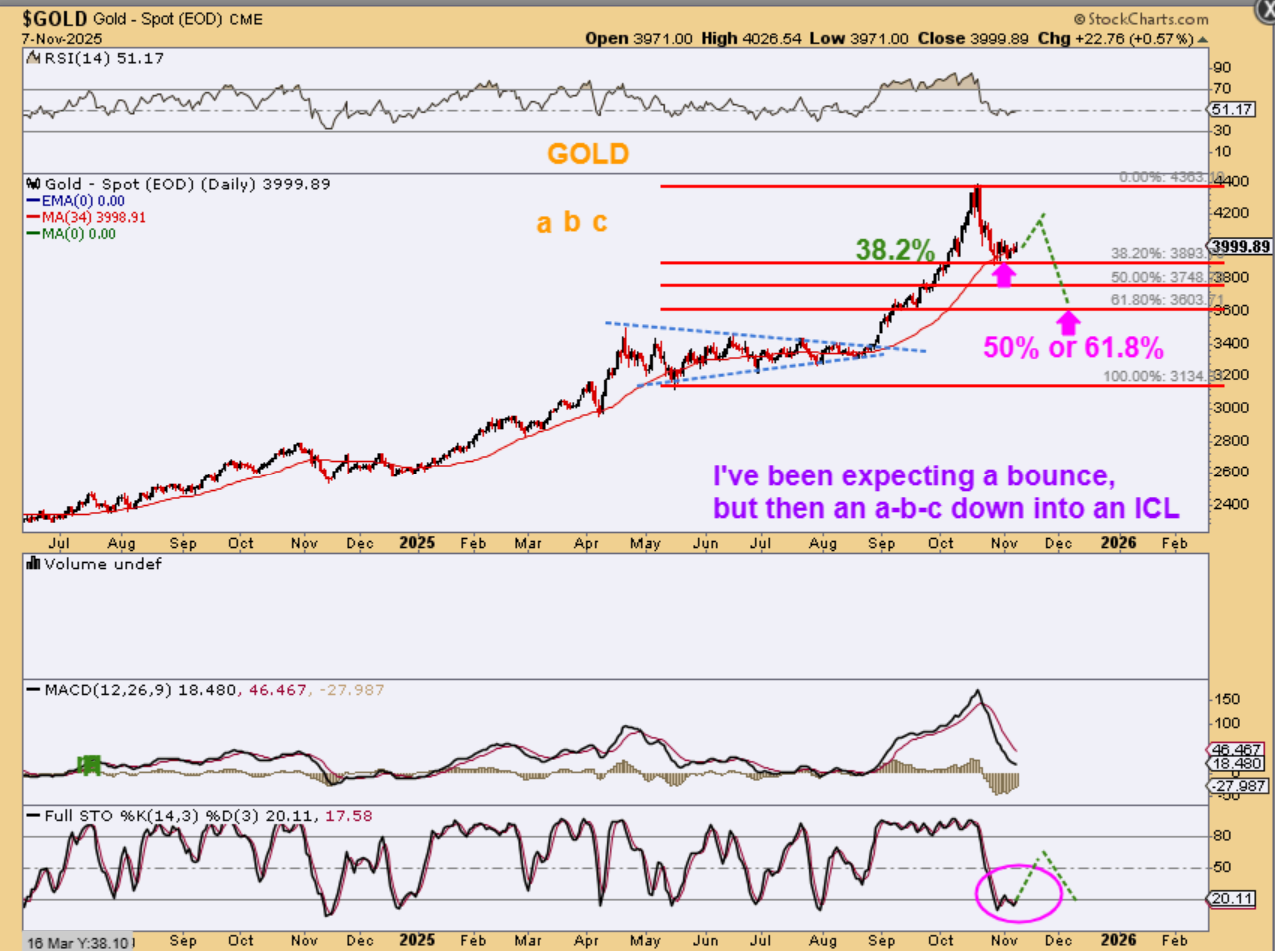
Starting from the low of the long triangular consolidation to the peak,
GOLD has now dropped to the 38% Fib level, so a bounce and 2nd drop could give us a drop to the 50% or the 61.8%.
That is ‘roughly’ $3750 or $3600.
.
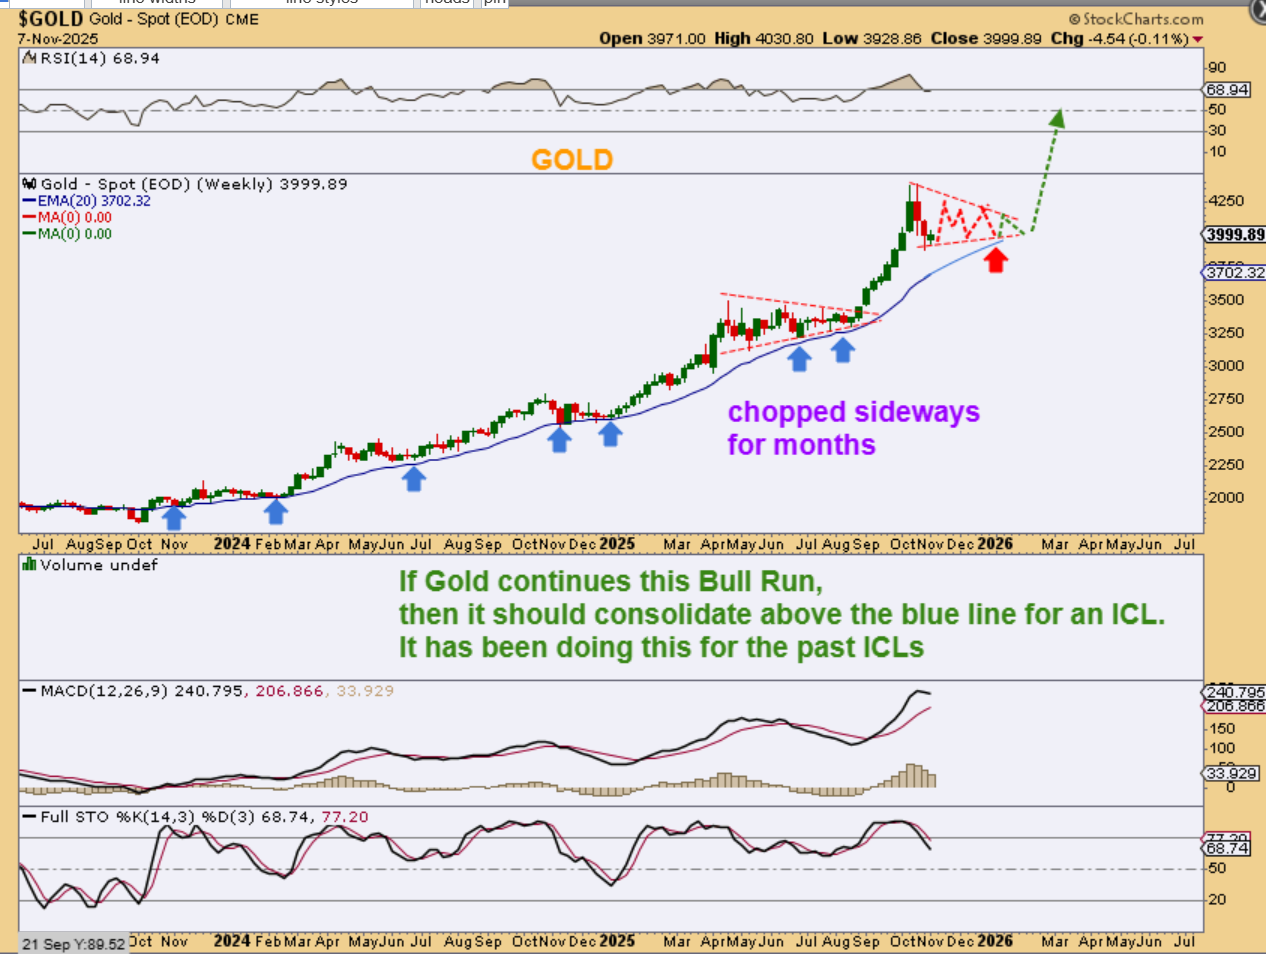
A simple a-b-c down for GOLD can also bring us down to the blue line near $3750 also. Please read the chart.
.
And of course we cannot rule out a bullish choppy triangle, similar to the one that we saw in 2025 for GOLD. This moves price along in time without that deep crash of an ICL.
.
SILVER – 4 weeks ago I mentioned that the candle that we saw was a ‘shooting star candle, and that was a topping candle. Now that we have dropped and Silver found support near the 50sma on a daily chart near day 28, we could bounce and also see an a-b-c formation here. Silver moves dramatically, so an overshoot of that 20 ema is possible.

.
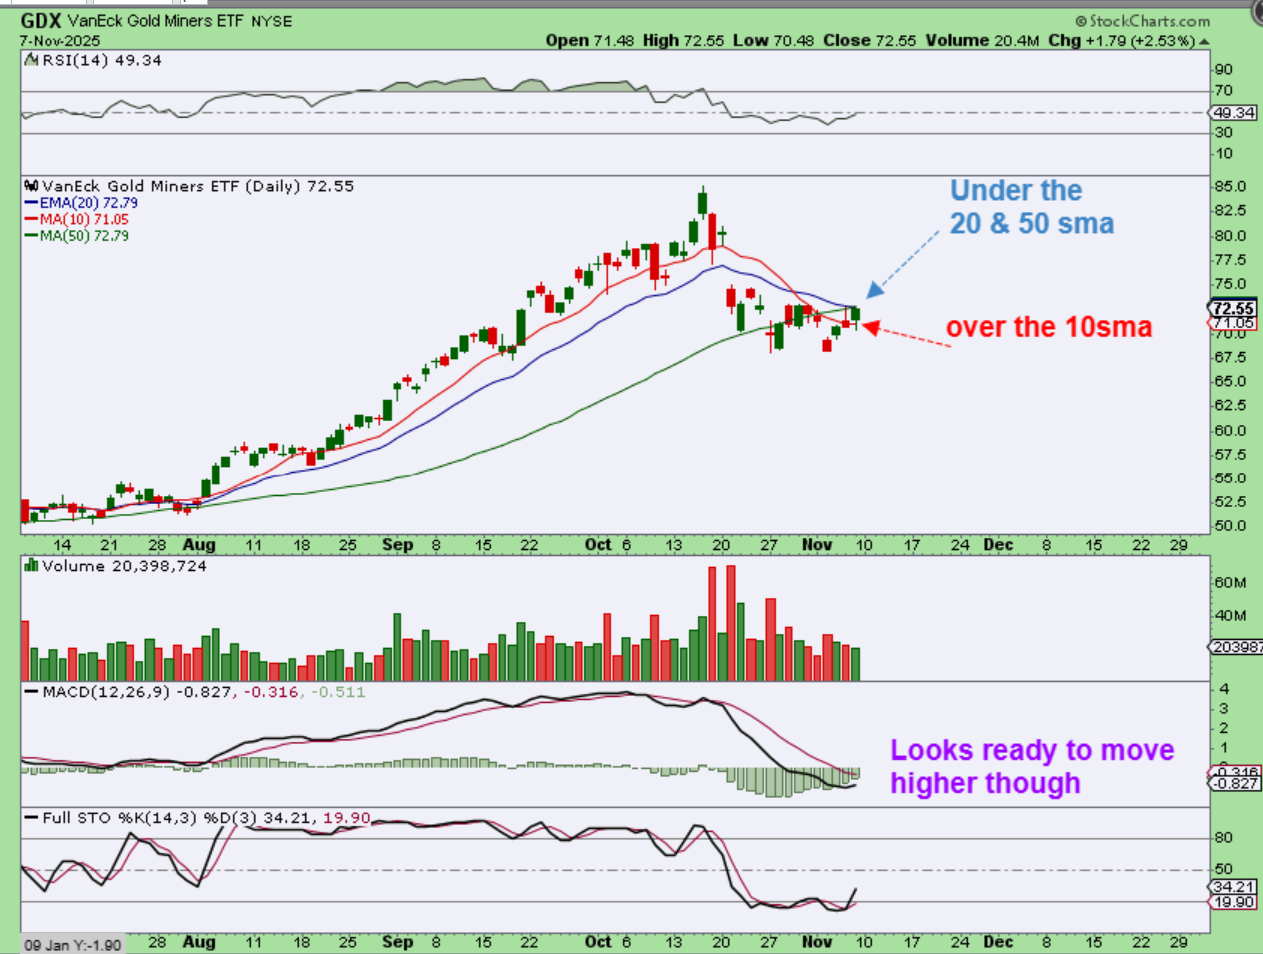
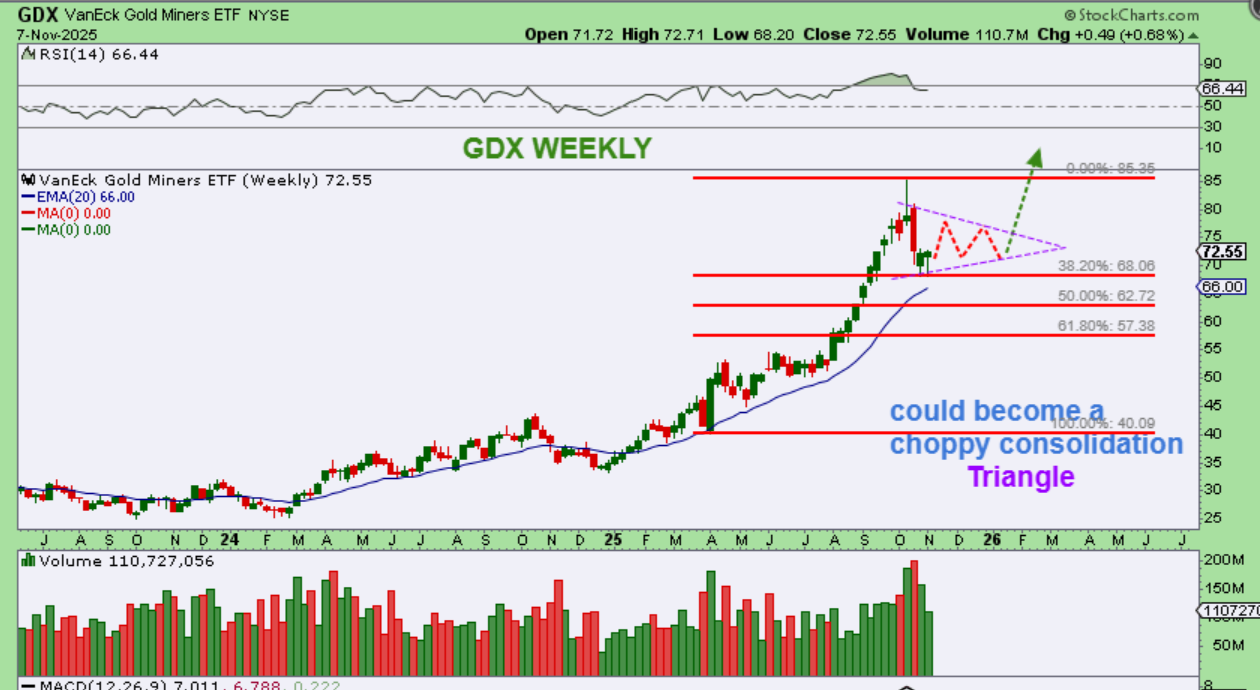
GDX has had its struggles once it dropped below the 50sma. It is STILL under the 50 sma and 20 ema, but it did move above the red 10sma to confirm a dcl on Friday. I do expect it to move higher with Gold and Silver, but I am only expecting a bounce.
.
I measured The GDX from the April low, since several ICLs formed in that April drop. GDX bounced right off of the 38.2% Fib level perfectly…twice. This too could become choppy and…
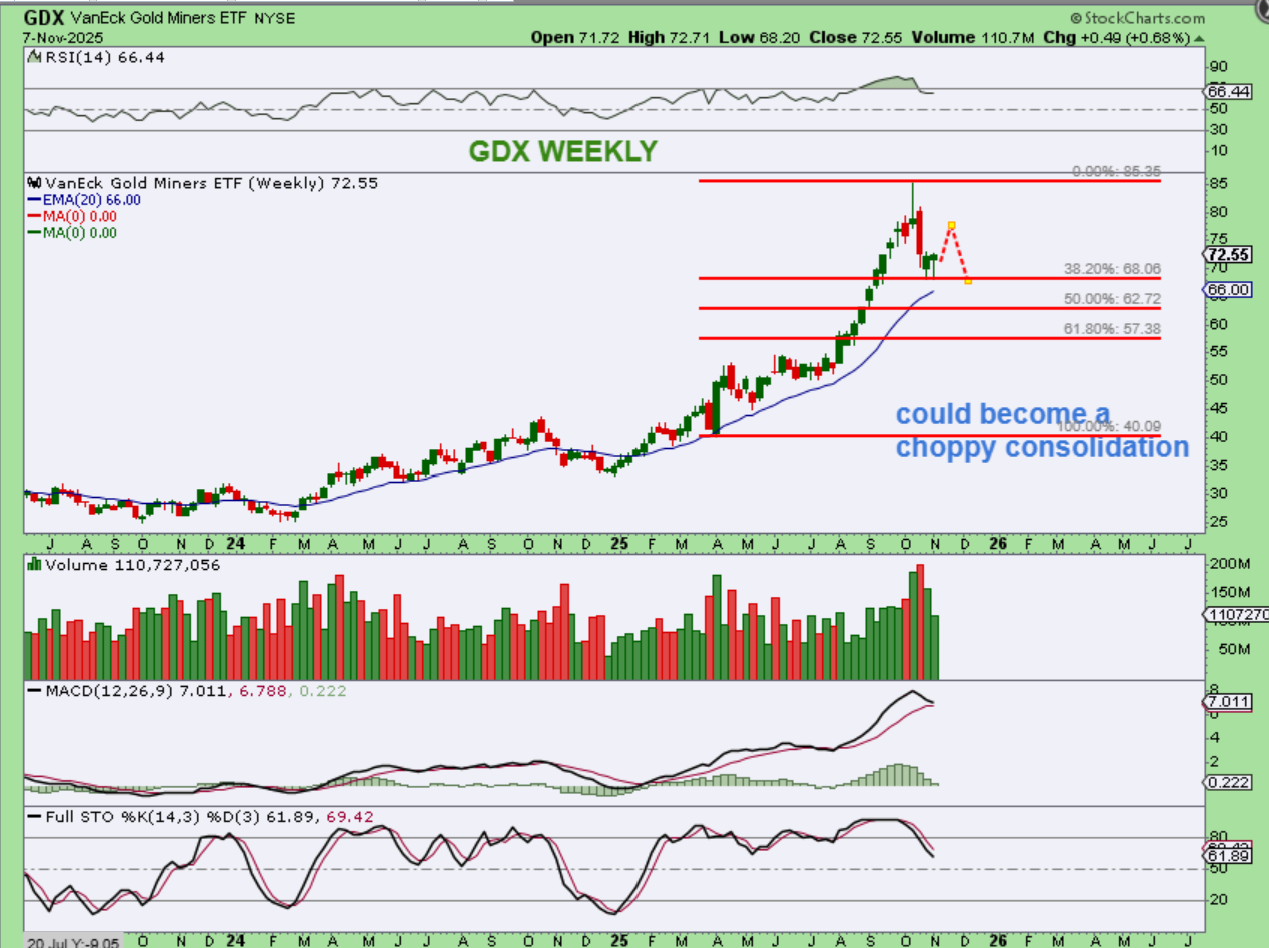
.
And if the GDX becomes choppy, it can form a triangle the same way that Gold did. This, of course, is just an idea of how a very bullish run can remain strong. IF GDX just did a blow off top, then the drop will break down a lot more over time.
.
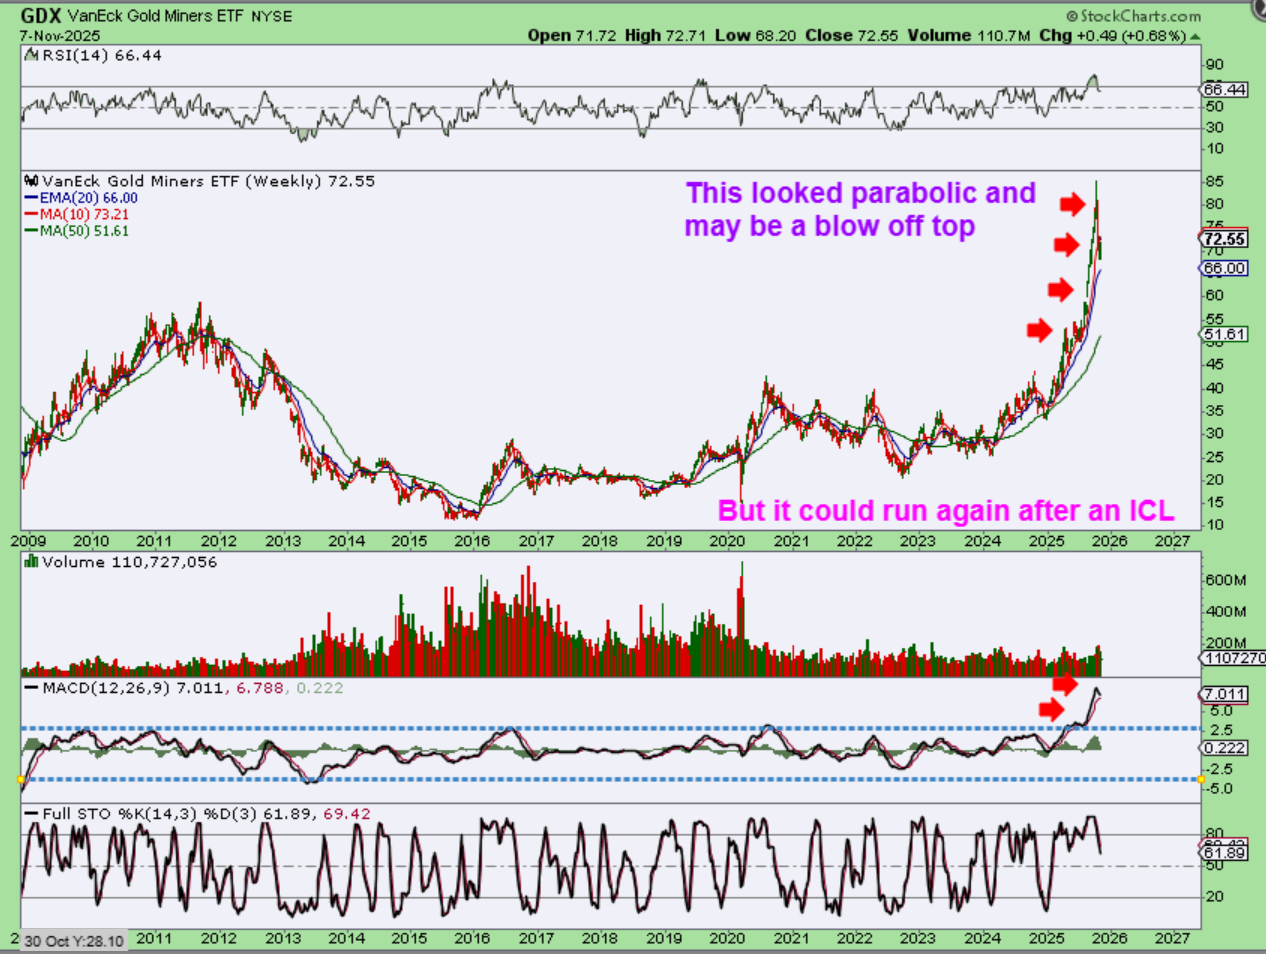
GDX – And finally we had that discussion about a parabolic blow off. it DOES look like a blow off top, and that MACD was ridiculously overdone, wasn’t it? So this could be the peak until we get a good consolidation and then make another run, but also…
.
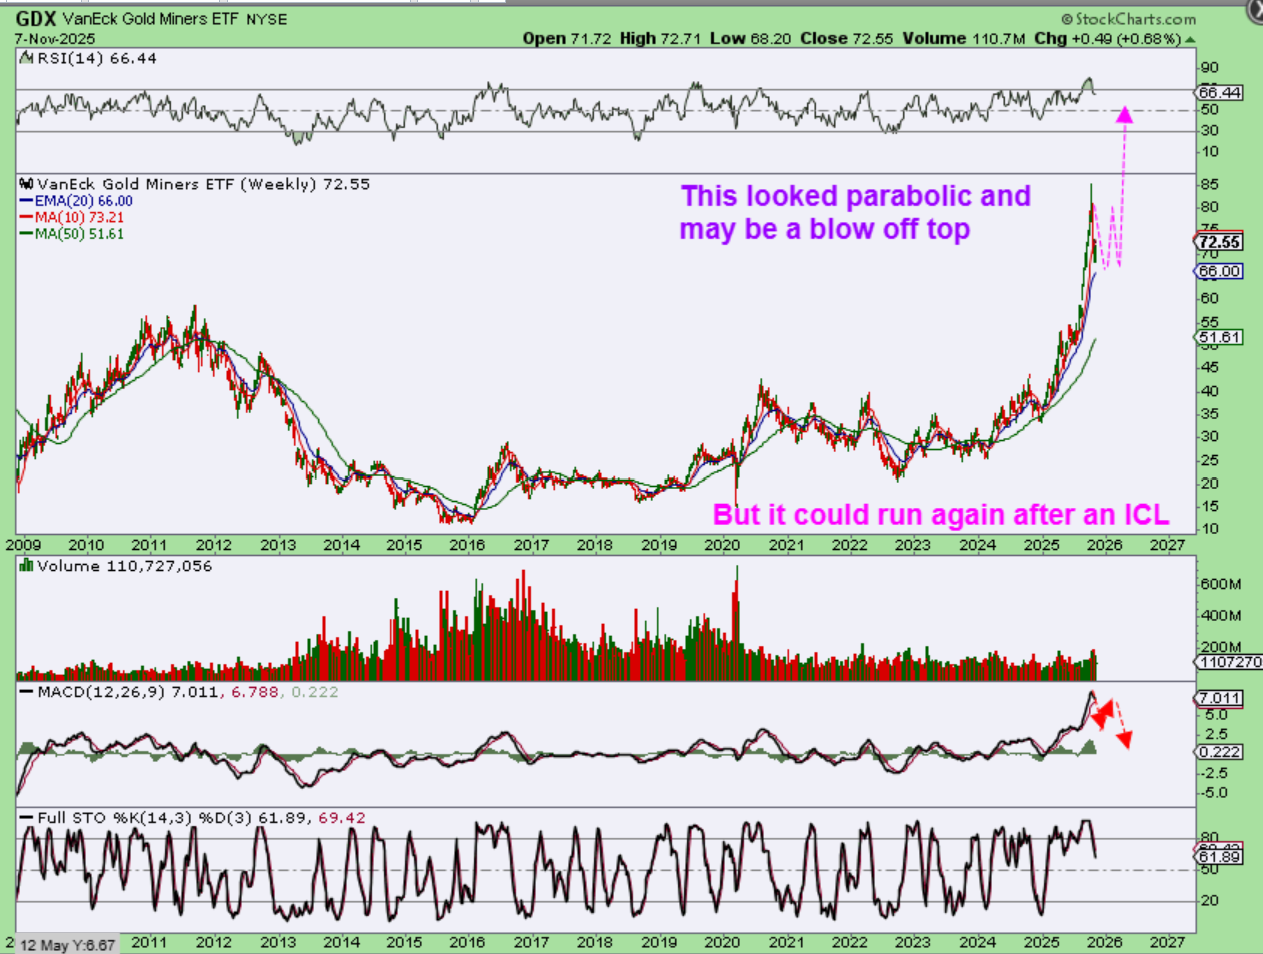
GDX – I can’t really rule out another run higher after a loner consolidation as shown, but even after a little sideways triangle chop into an ICL right ow, one more blast off higher could happen. It all depends on that bull run with Gold and Silver.
.
The General Markets could be ready to run higher next week, but if it rolls over under that 50sma again quickly, then I’d say that we are heading down into the next dcl / ICL. Even if it does move higher, I do not expect new highs above the day 13 ‘peak’, since we are in month #7. Gold and Silver look to have a dcl in place and should bounce from here next week. Bitcoin has a dcl too, I’ll cover that below. Enjoy your weekend everyone! 🙂
.
~ALEX
.
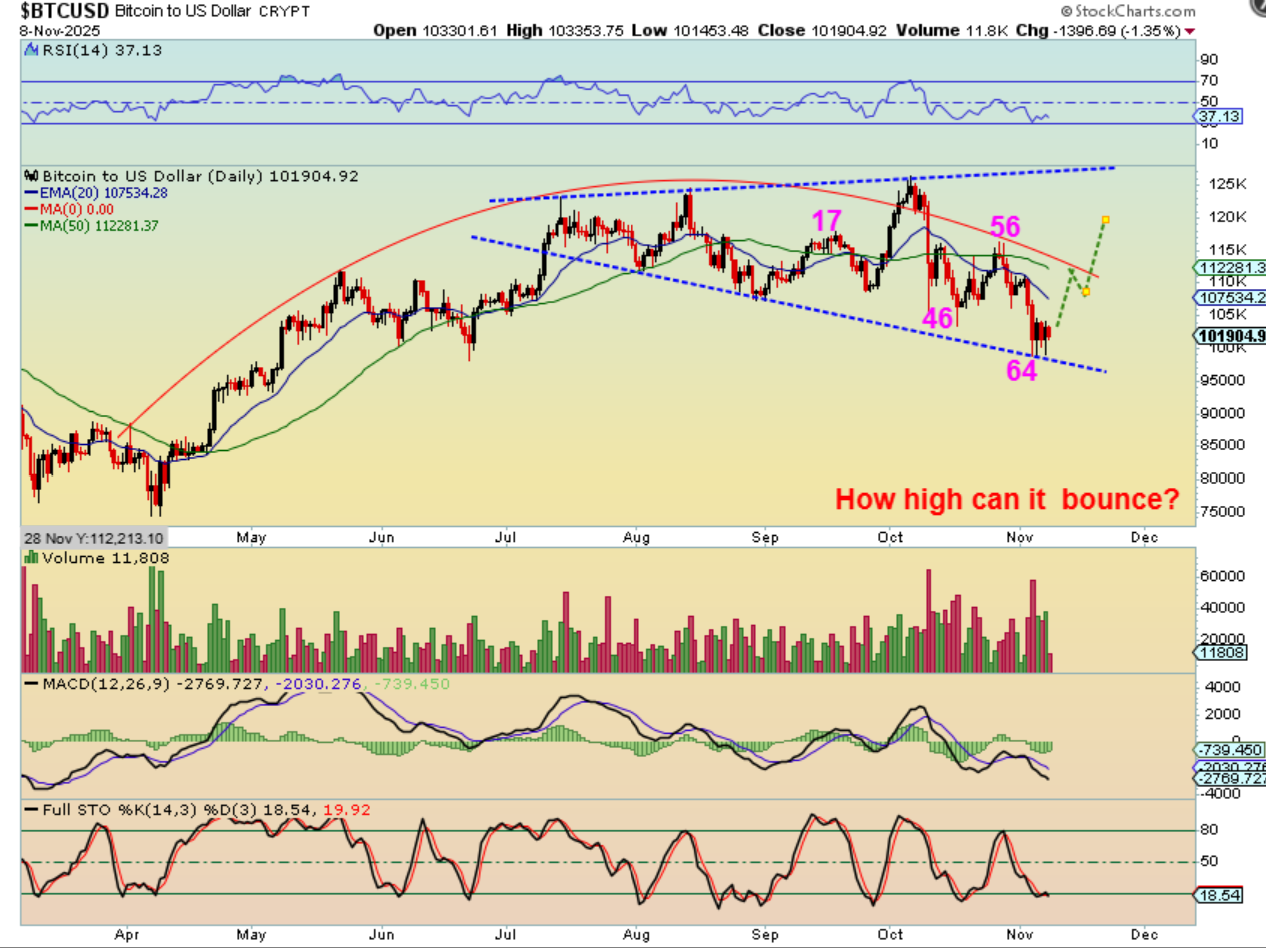
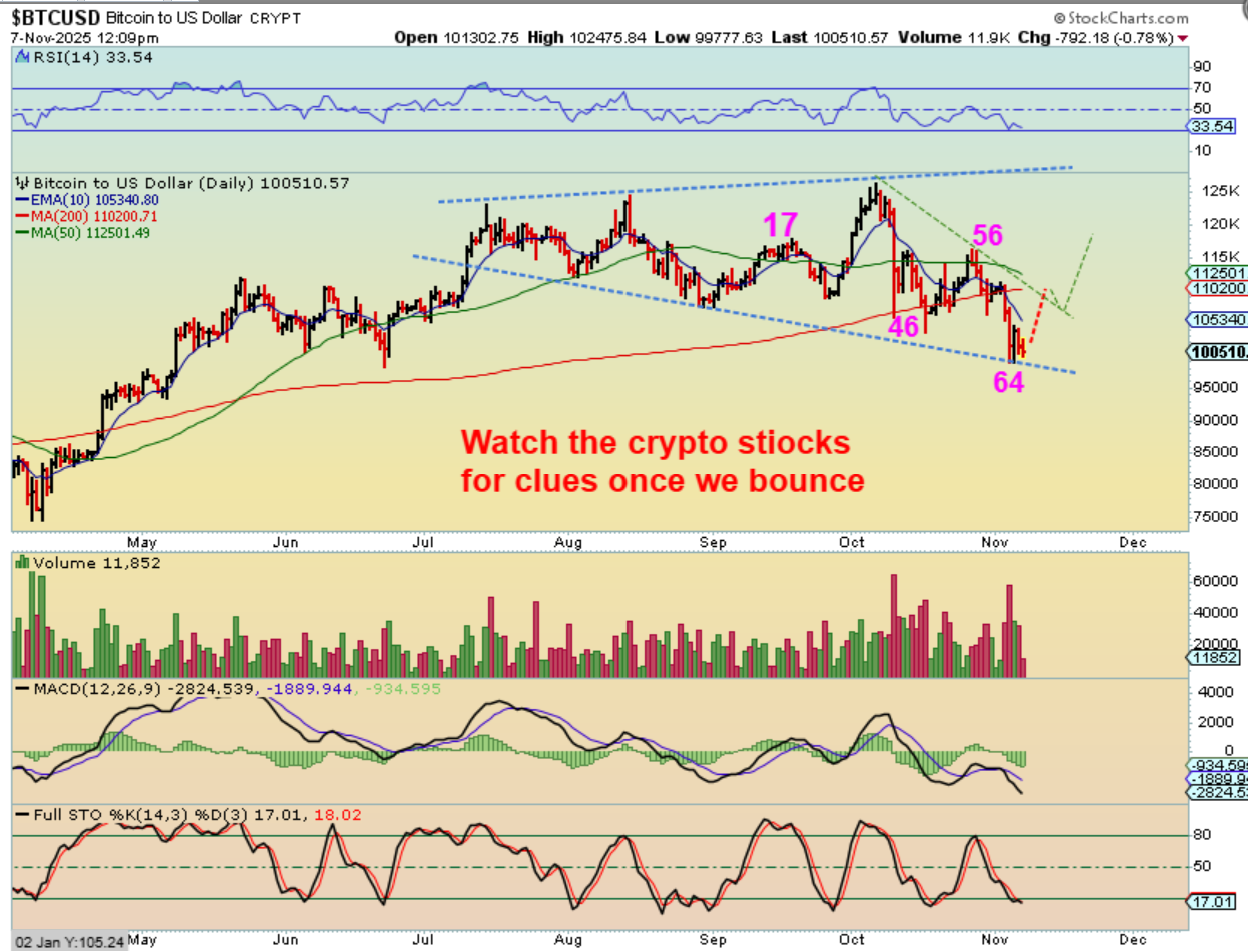
BITCOIN – We watched for a ‘low’ to form around day 60 and we do seem to have that low in place at day 64. How high will this run? I was thinking that we could get back to $130,000+, but at this point the chart is really showing weakness, so I have my doubts. We’ll take it 1 step at a time, but let me show you something else…
.
We’ll take it 1 step at a time, but let me show you something else…
.
I showed the overhead resistance in this chart at the downtrend line and 50sma.
1. Getting above that will be short term bullish.
2.What happens if we just chop sideways for a couple of weeks? …
,.
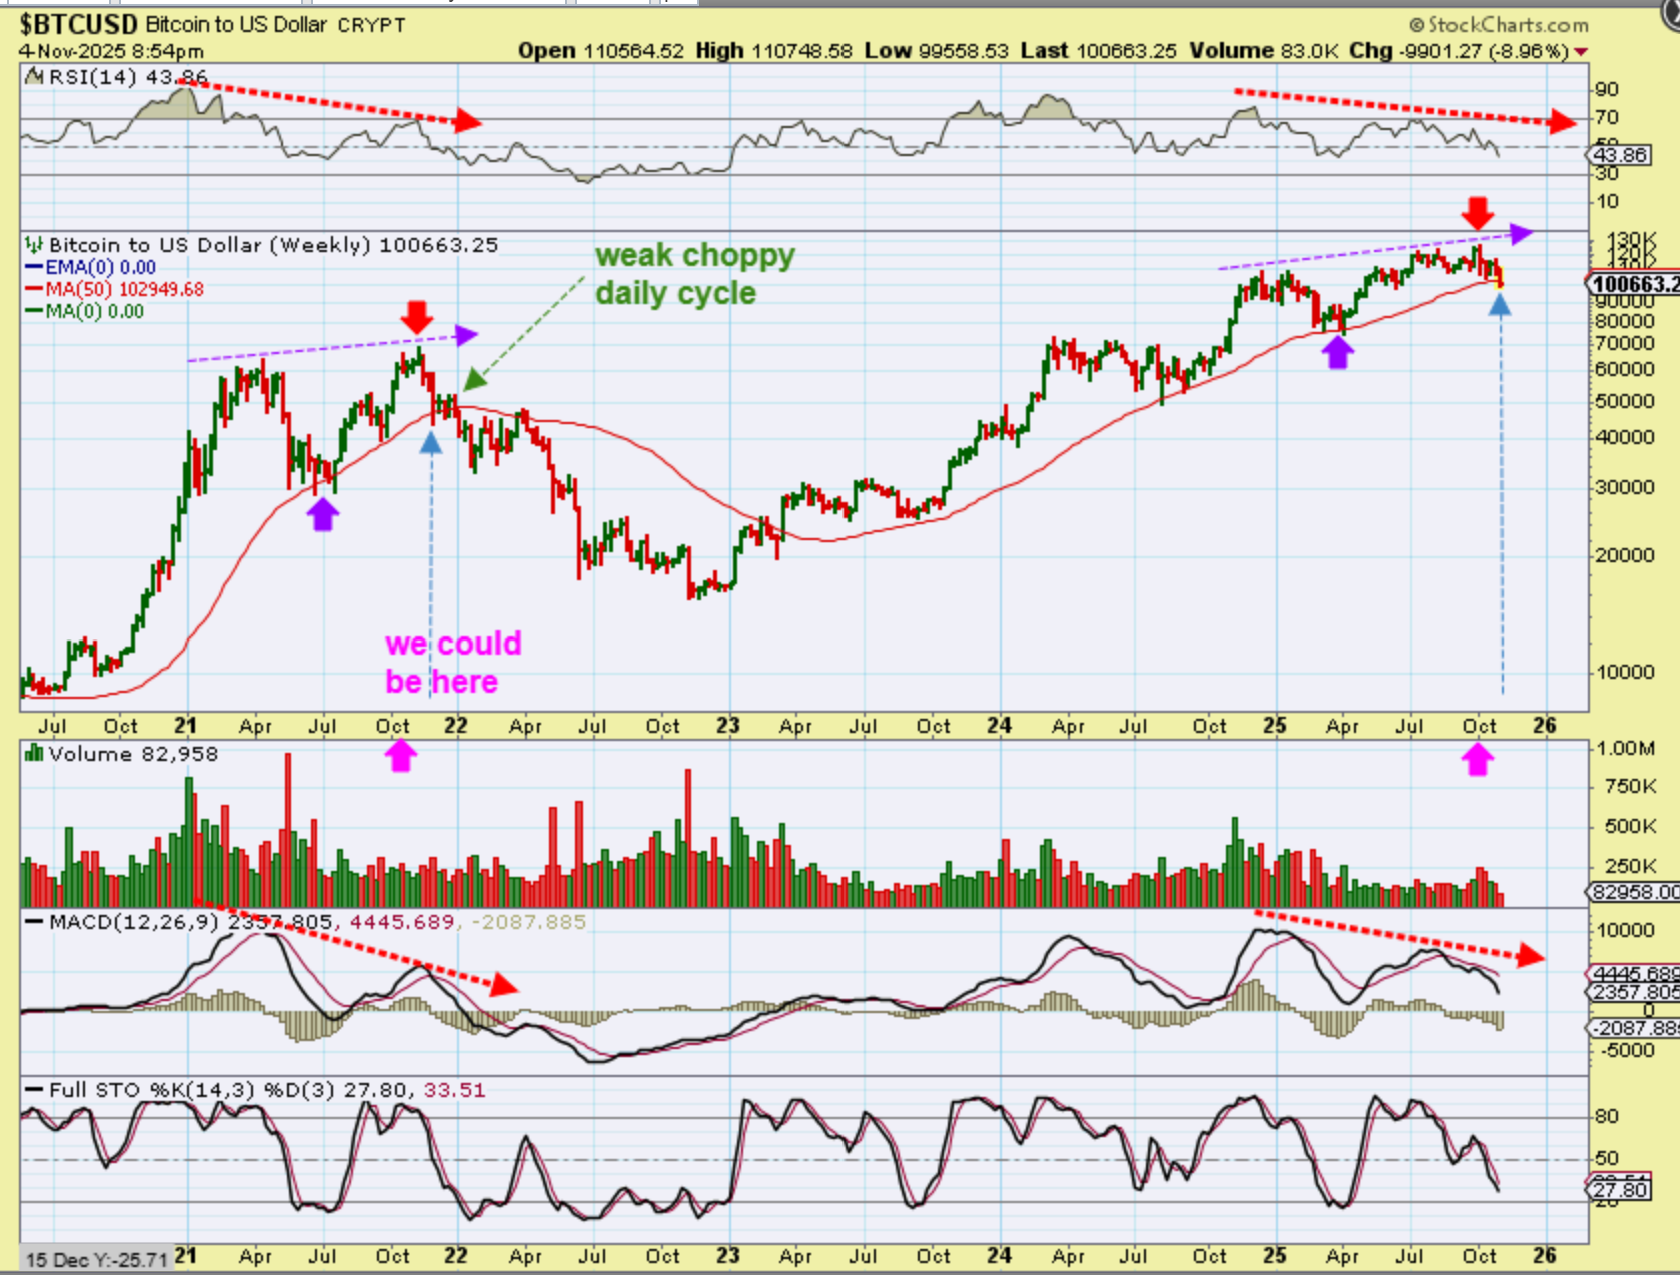
BITCOIN – I’m comparing the 2021 top to now.
1. We see RSI divergence similar to then
2. MACD divergence is similar to that top too
3. Notice that our price also broke below the red 50 week MA, and then it chopped sideways for 4 weeks.
4. These do look similar in several ways, and after that 4 week sideways chop…
..
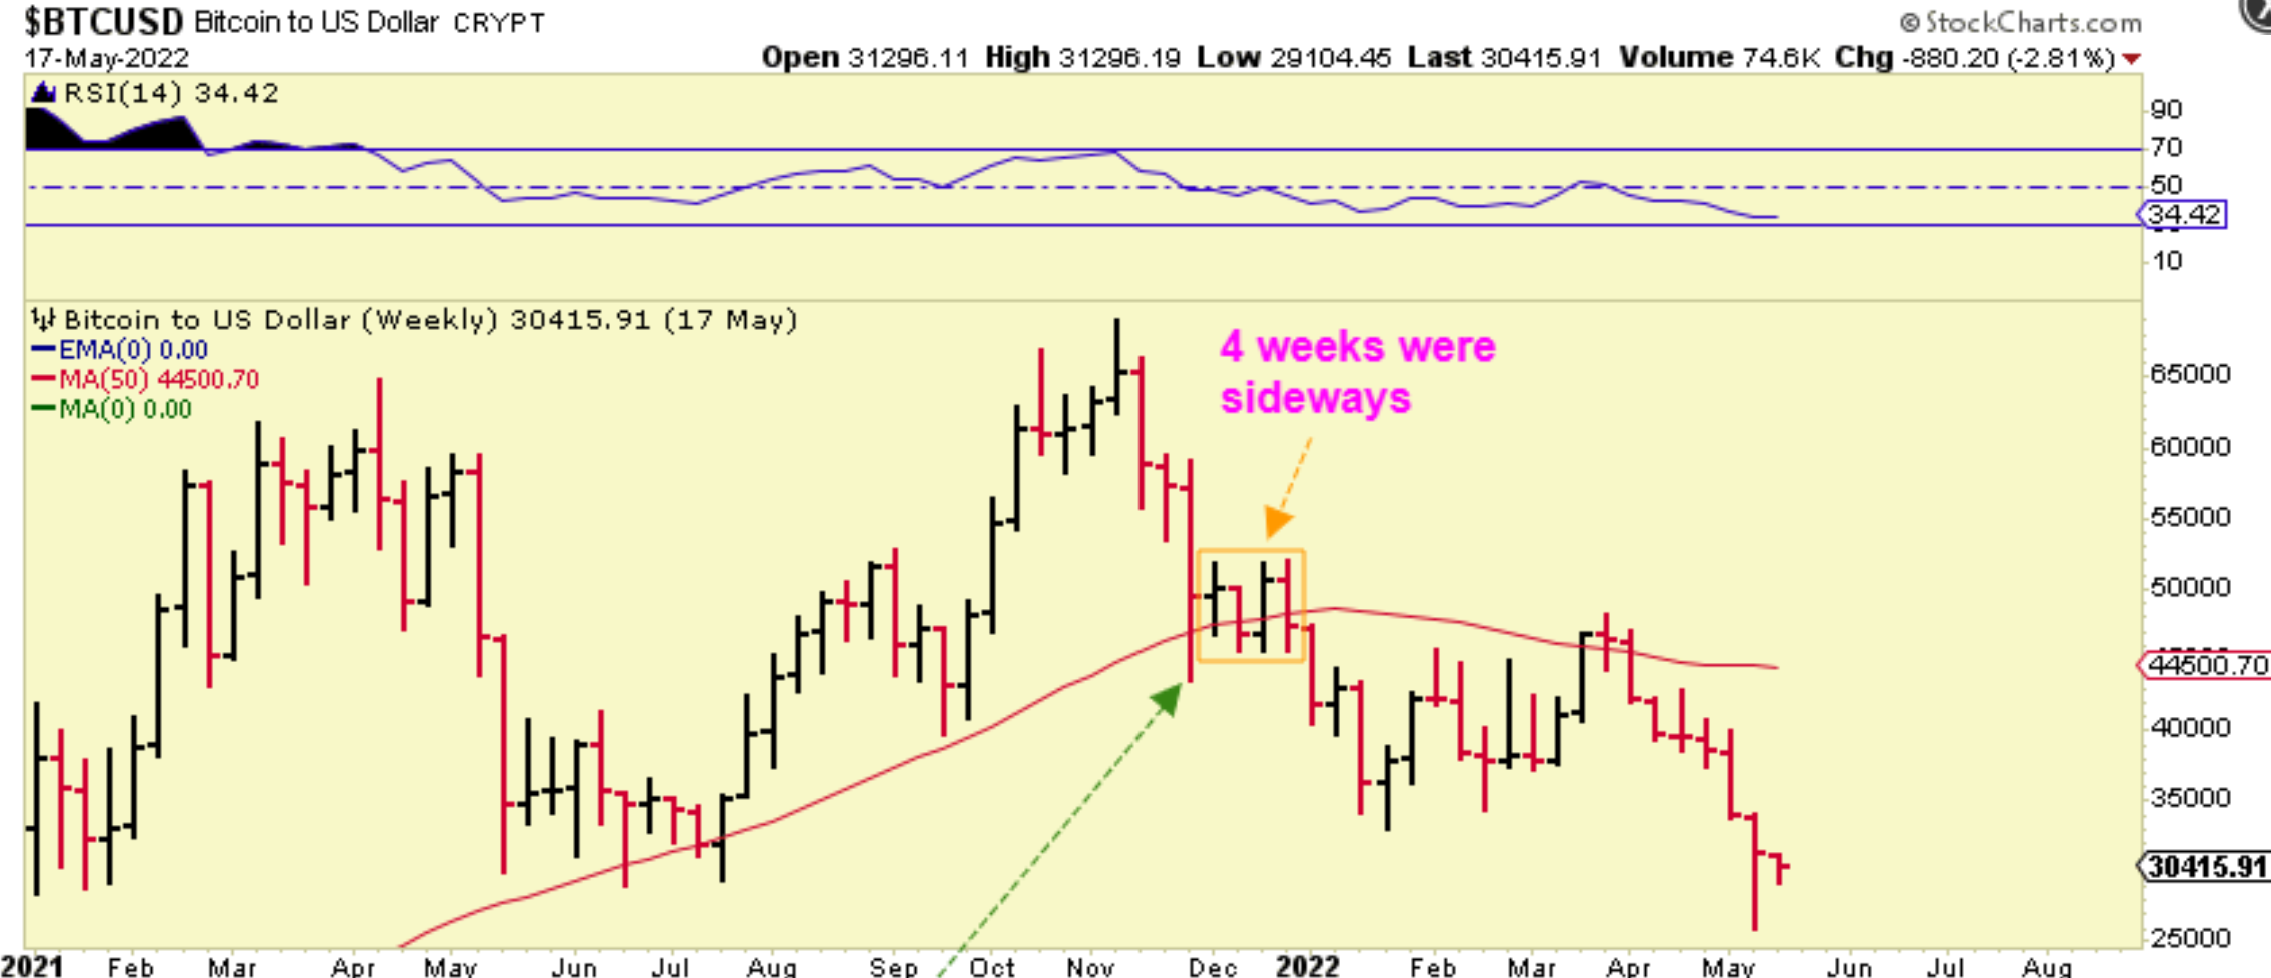
BITCOIN 2022 CLOSE UP or ZOOMED IN :
After Bitcoin spiked below that 50 week ma, we see that it just chopped sideways for 4 weeks and then dropped or rolled over, back below that 50 week ma. So…
.
BITCOIN -I focused on that Spike below the 50 week ma like we had then and have now (See the Blue arrows) and I decided to add a copy of what followed in 2022 after that spike lower to where we are now (See the Green Arrows). It was 4 weeks sideways and then it rolled over. so …

.
1. If we chop sideways for the next 3-4 weeks under the 50sma, I am out of Crypto.
2. If we can push higher and break above the 50sma on a daily chart and get above that downtrend line and run above $112,500, I’ll see more strength than we had in 2022.
