November 15th Weekend Review
This report took 4-5 hours to draw up, and with relatives visiting, I am on my way out the door. I didn’t have time to proofread it yet. Please excuse any typos or errors, and if something is unclear, you can let me know and I’ll fix it on Sunday. 🙂 Thx!
.
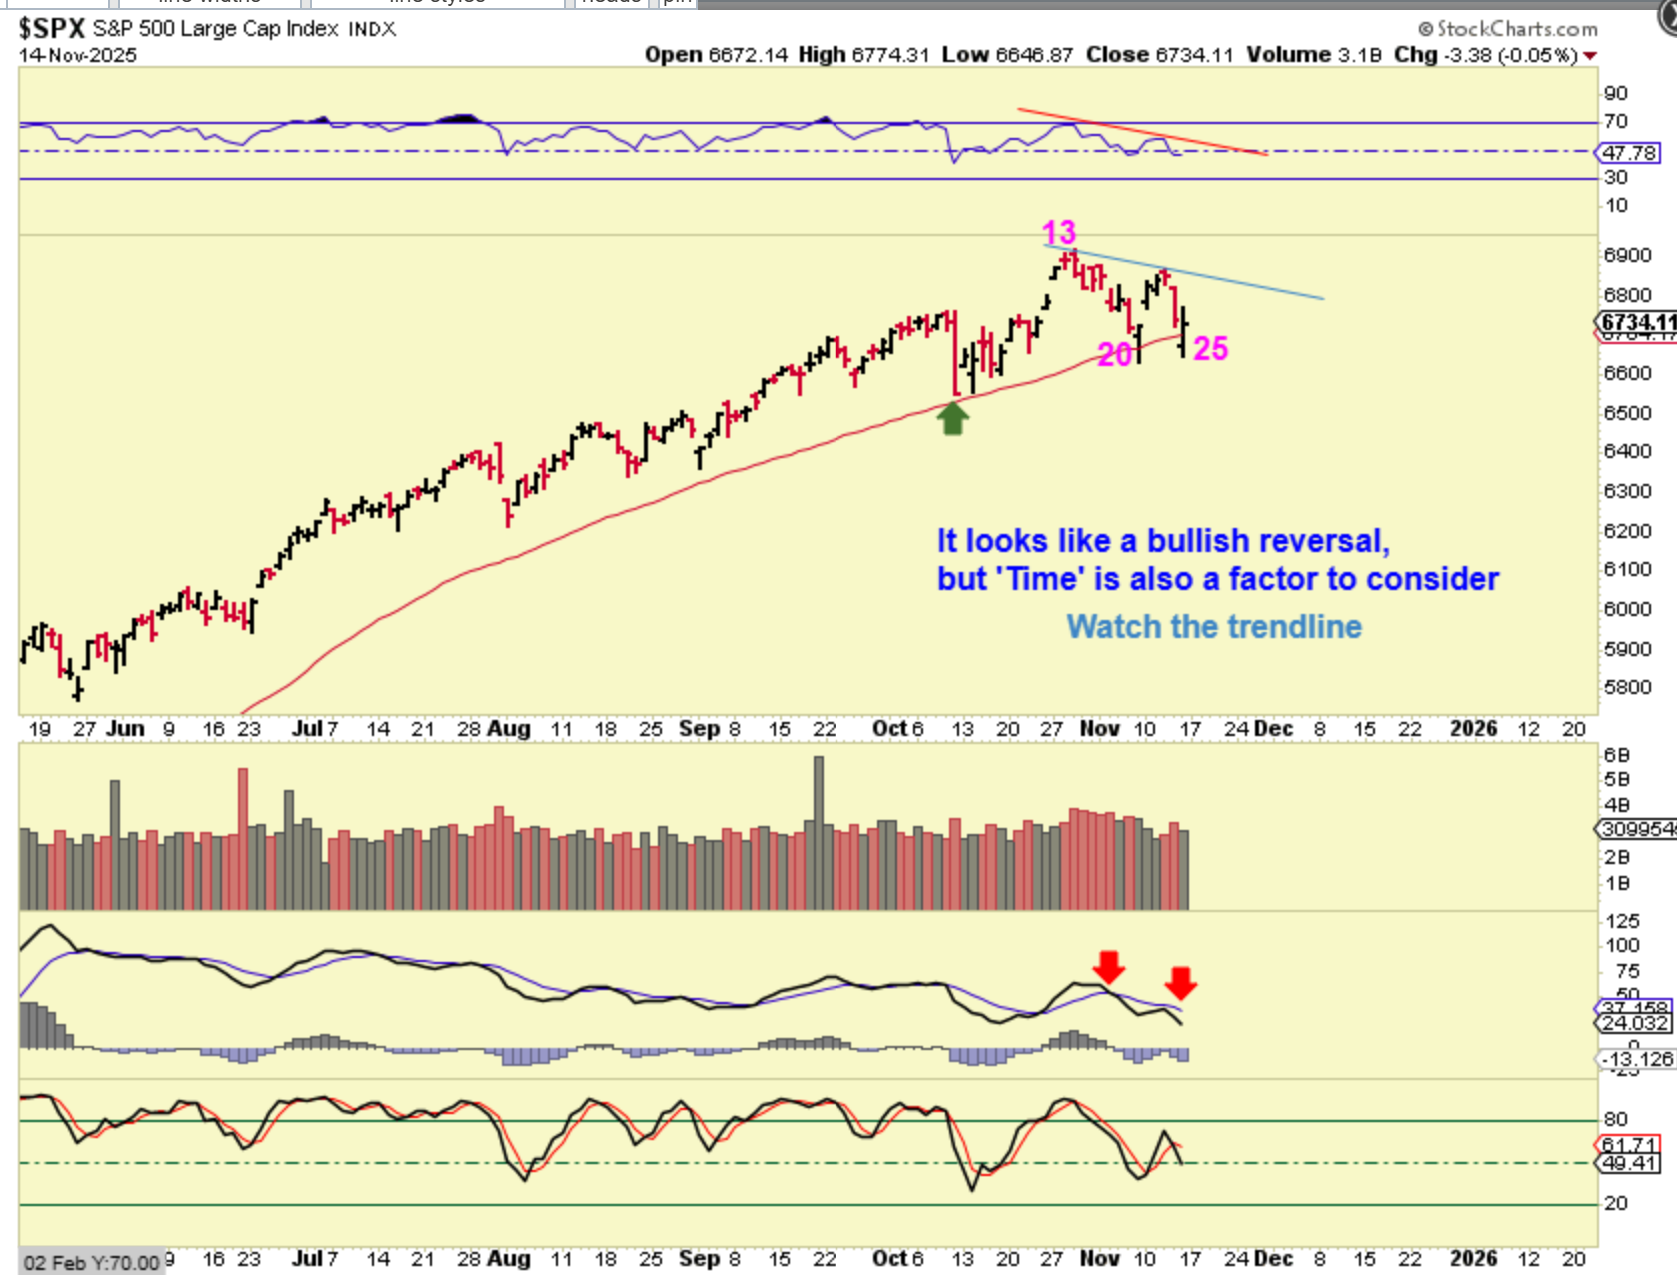
SPX DAILY – I know that this looks like the bulls are in control, and maybe they are to a degree (buying the dips), but time is a factor too. We are on the 7th month of the Intermediate cycle and we have a day 13 ‘peak’ on day 25. I think that we could bounce to the downtrend line and then roll over into an ICL drop. Look at the MACD weakness showing up too.
.
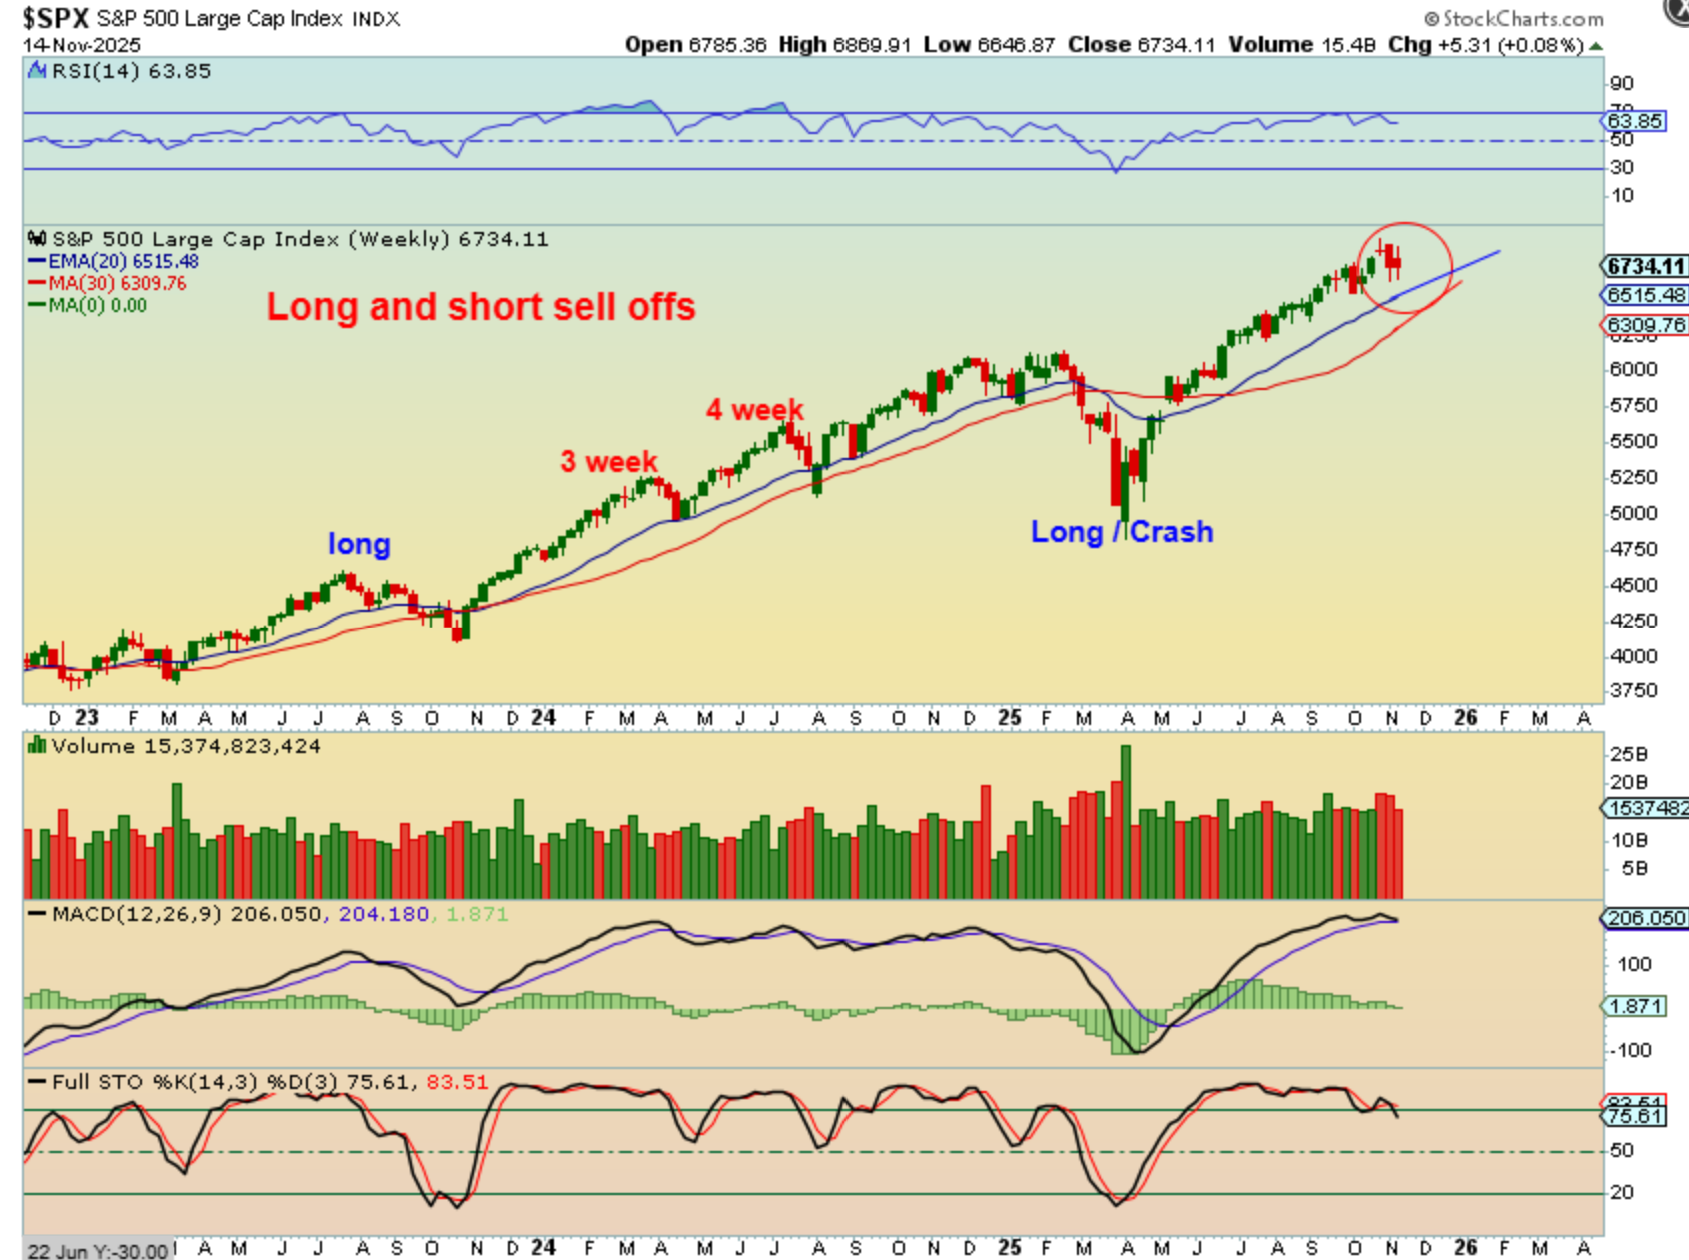
SPX WEEKLY: Past ICL sell offs were both long and short. Some lasted 3 or 4 weeks and others were prolonged. The last one was a crash as Trump kept adding exaggerated tariffs to foreign trading partners. Right now we have 3 red topping/doji type of candles, but we still have more time to drop further. Watch the blue and red lines (20 ema, 30 wma).
.
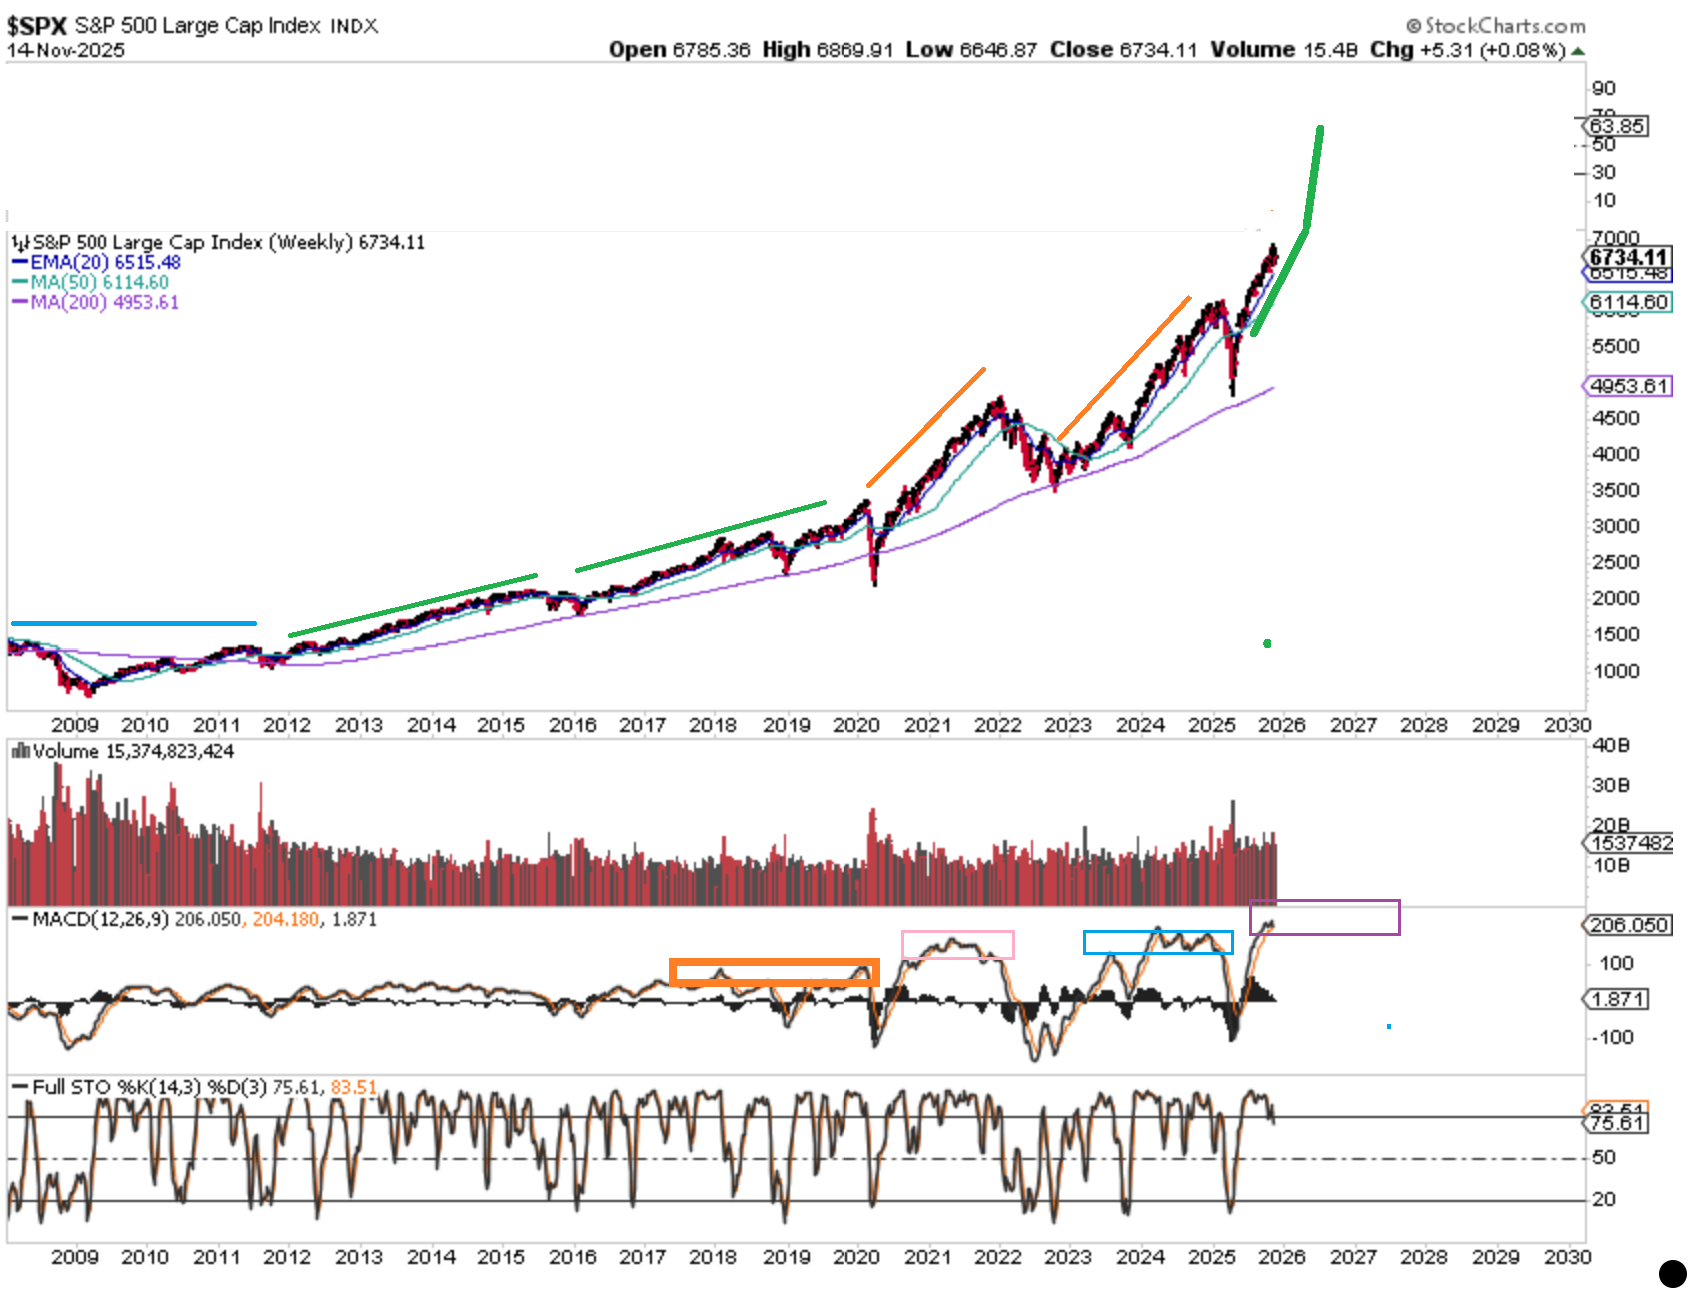
Is it possible that THE SPX IS GOING PARABOLIC, LIKE WE SAW IN 2000 with the tech Bubble? It is possible. My thinking is that we get a small sell off now into an ICL because rumors are that we will not get a rate cut in the next meeting. After we get an ICL, we could have another 6-7 month long intermediate cycle that celebrates rate cuts, AI, QUANTS, TECH, etc all over again. Each run is looking steeper, right? So we’ll see.
.
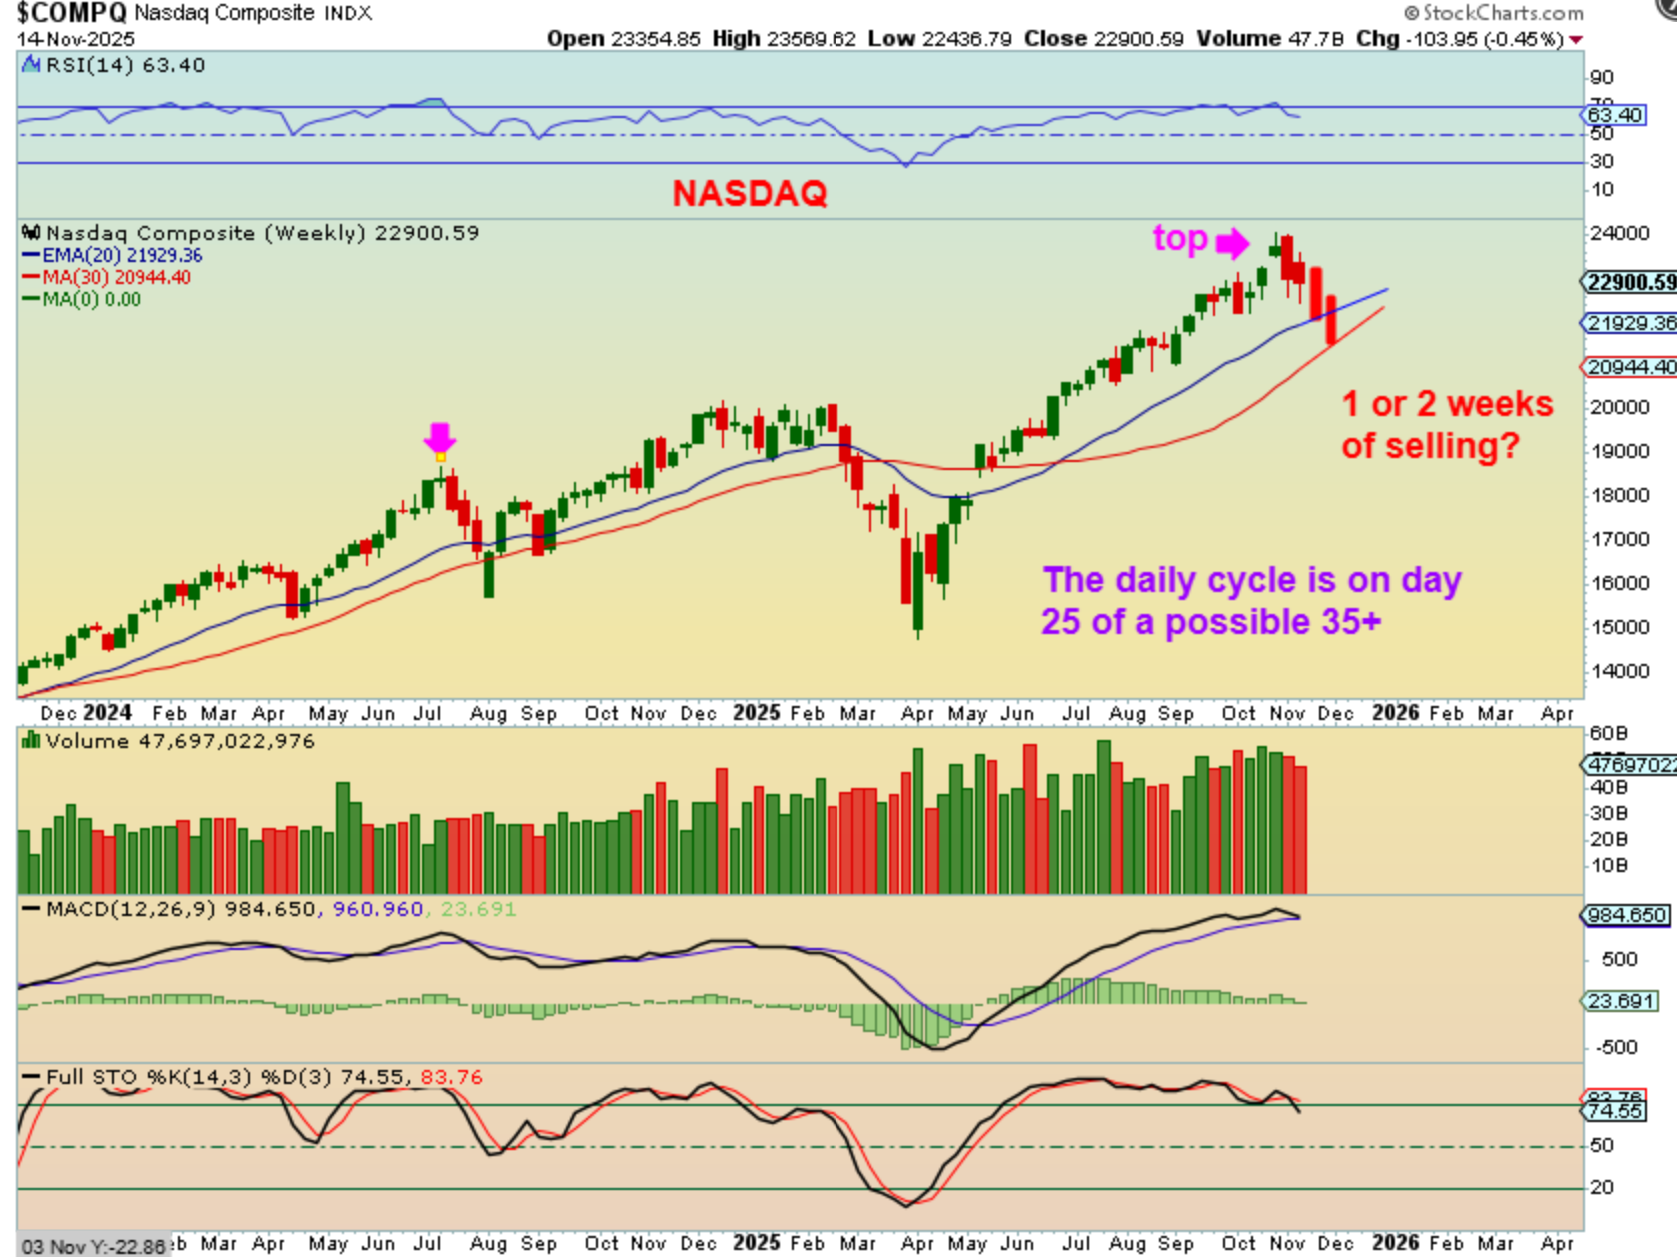
NASDAQ WEEKLY – I have drawn in 2 candles here to the 30 week ma, because if we are on day 25, then 2 weeks would be day 35 for the daily cycle. 3 weeks would be day 40, 4 weeks would be day 45, and that is also acceptable for a daily cycle, so I think we could see at least 2 or 3 more weeks of selling (Note: It may be choppiness and sideways, or it may be a drop).
.
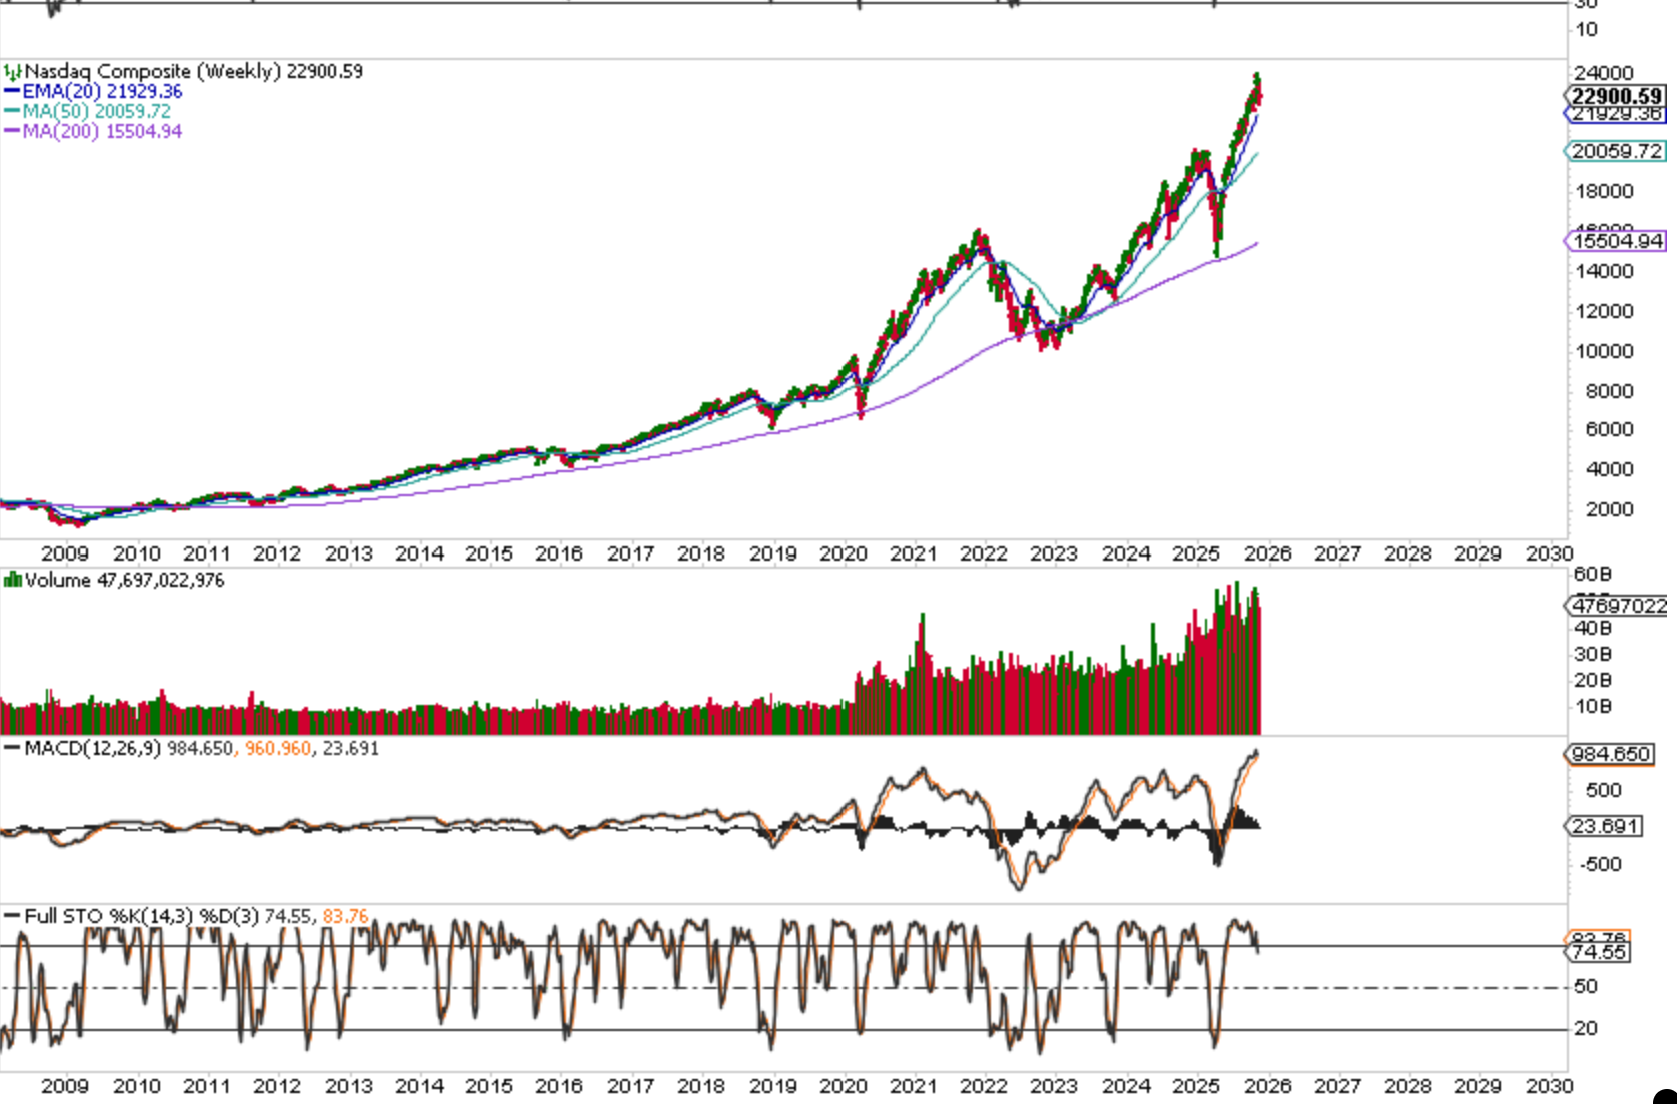
Is it possible that THE NASDAQ IS GOING PARABOLIC, LIKE WE SAW IN 2000 with the tech Bubble? It is possible.
Again, my current thinking is that we get a smallish sell off now into an ICL, due to rumors of ‘no rate cut in the next meeting’. After we get an ICL, we could have another 6-7 month long intermediate cycle that celebrates rate cuts, AI, QUANTS, TECH, etc all over again. NASDAQs runs are also starting to look steeper since Covid, right? So we’ll see.
This last rally looks straight up from Aprils ICL, so one more might really give us some strong gains, but then it would be time to allow a deeper correction to take place.
.
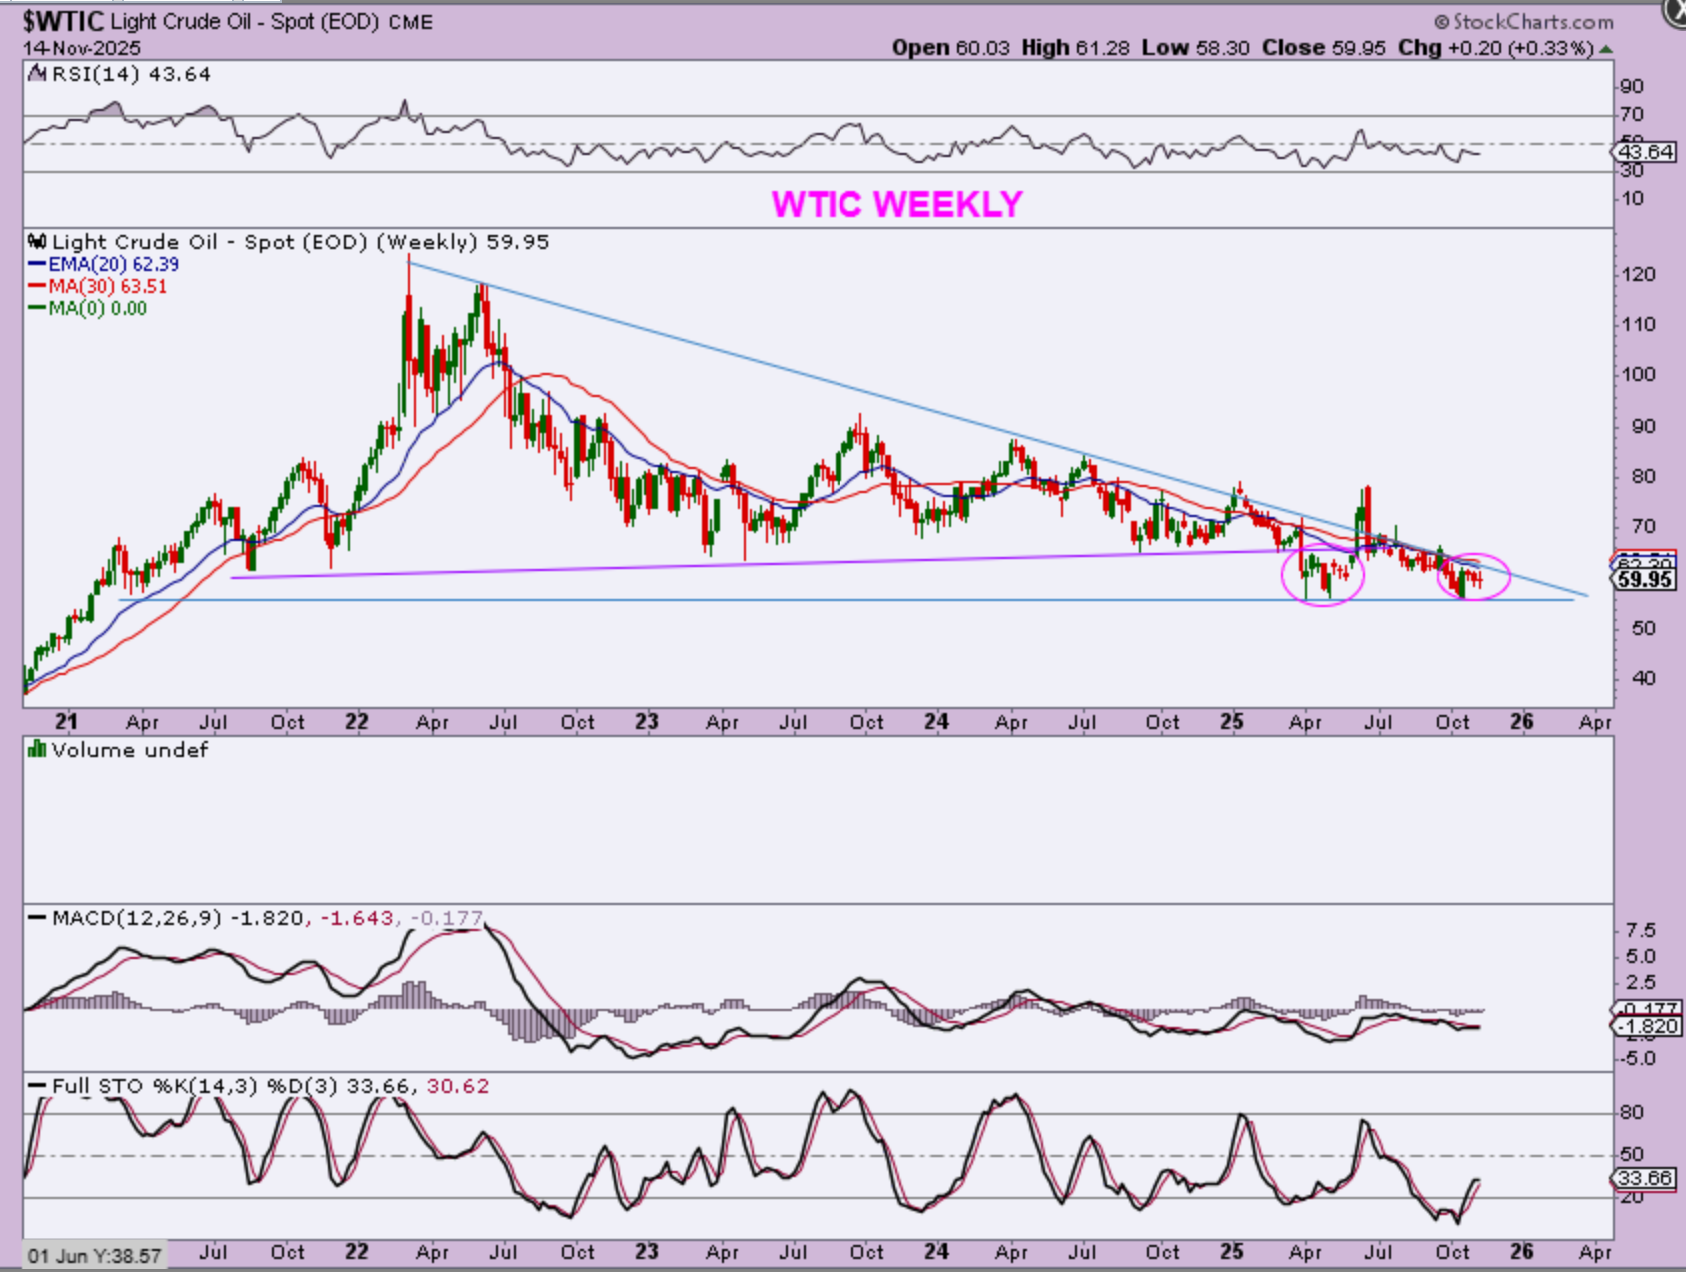
WTIC – I used to follow the purple lower trend line, because that is what was relevant support at the time. Then Oil broke down to $56, recovered with a blast higher, and then broke down to $56 again. Now Oil has found support at the $55-$56 area (blue line) and is still in that APEX of a triangle. If it has an ICL in place, it could break out, but so far it is just choppy.
.
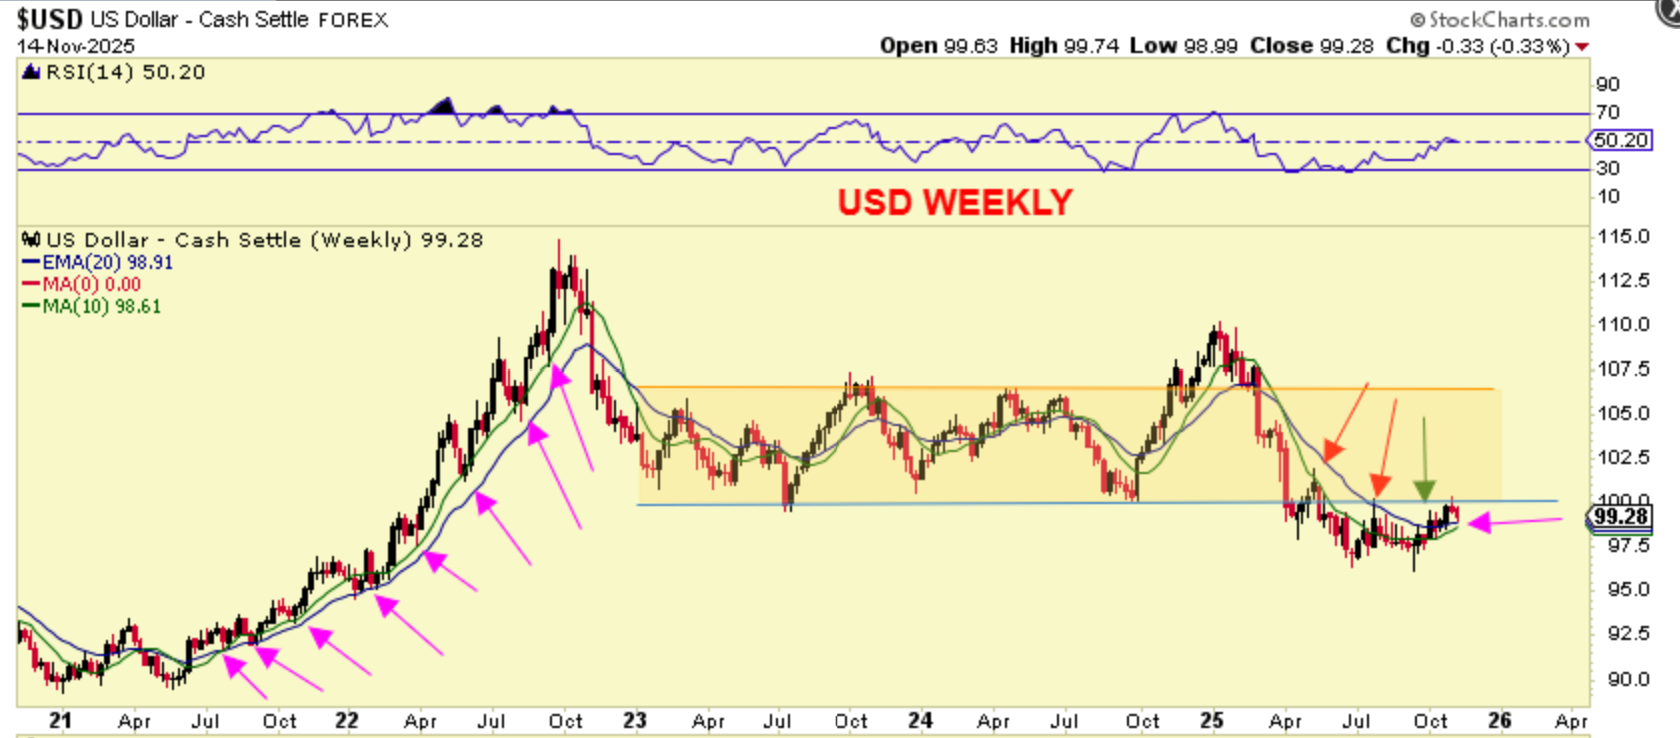
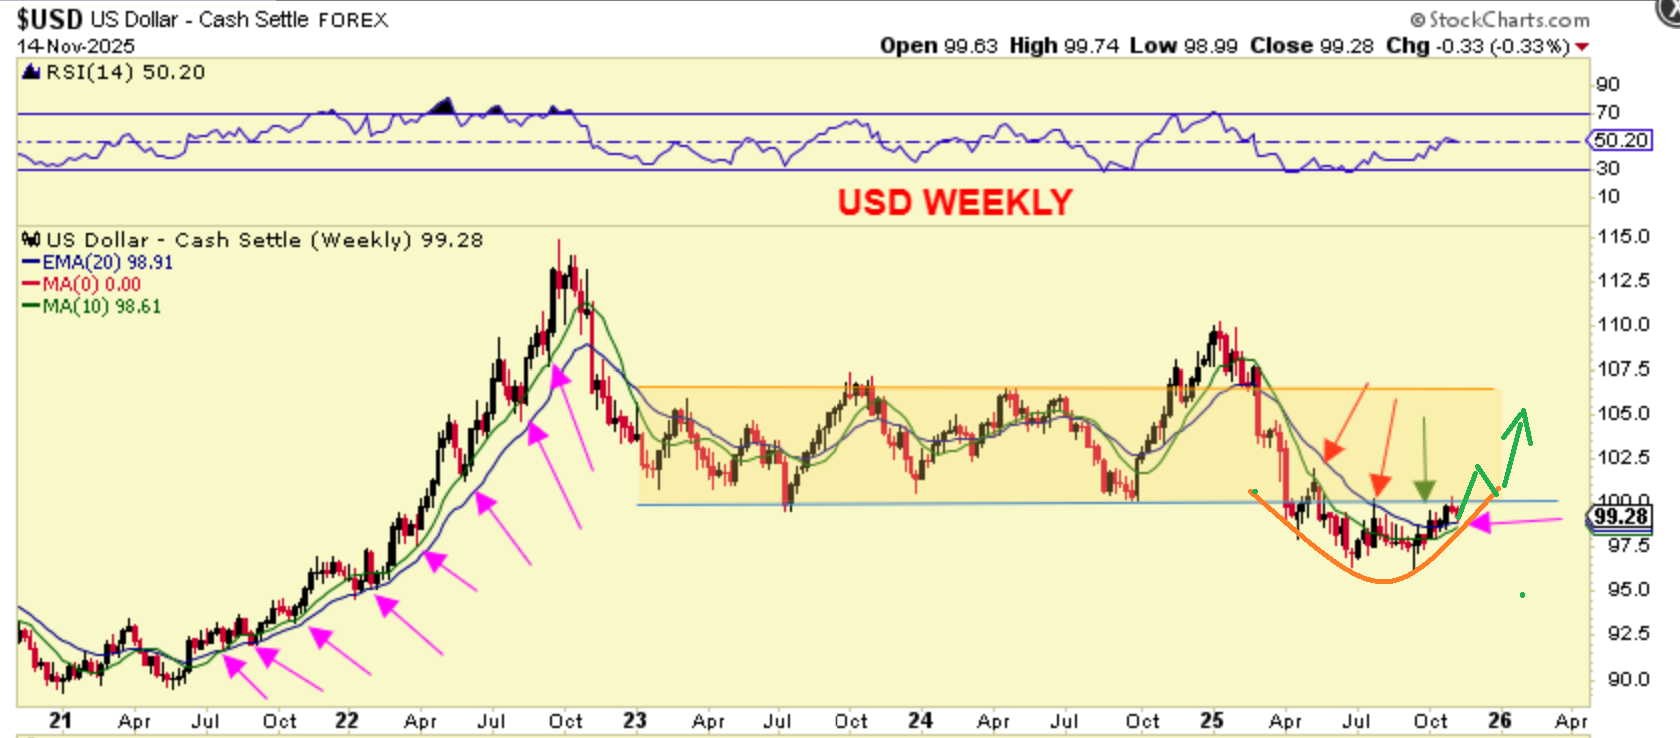
USD WEEKLY – The USD has had lower lows and was trapped under the 20 and 30 MA, but now notice that it is above both of those moving averages. The progress on the daily charts that I have mentioned in each report is now being seen here on the weekly chart. So price is currently above the 20 & 30ma, it is stalling at resistance now, but I do think that the USD will break higher. That may or may not affect Gold.
.
USD WEEKLY – I am expecting to see something like this. Does that mean that Gold has peaked? It might. Gold has ignored the USD often recently, but we do need to consider that a stronger USD might adversely affect Gold & Silver.
.
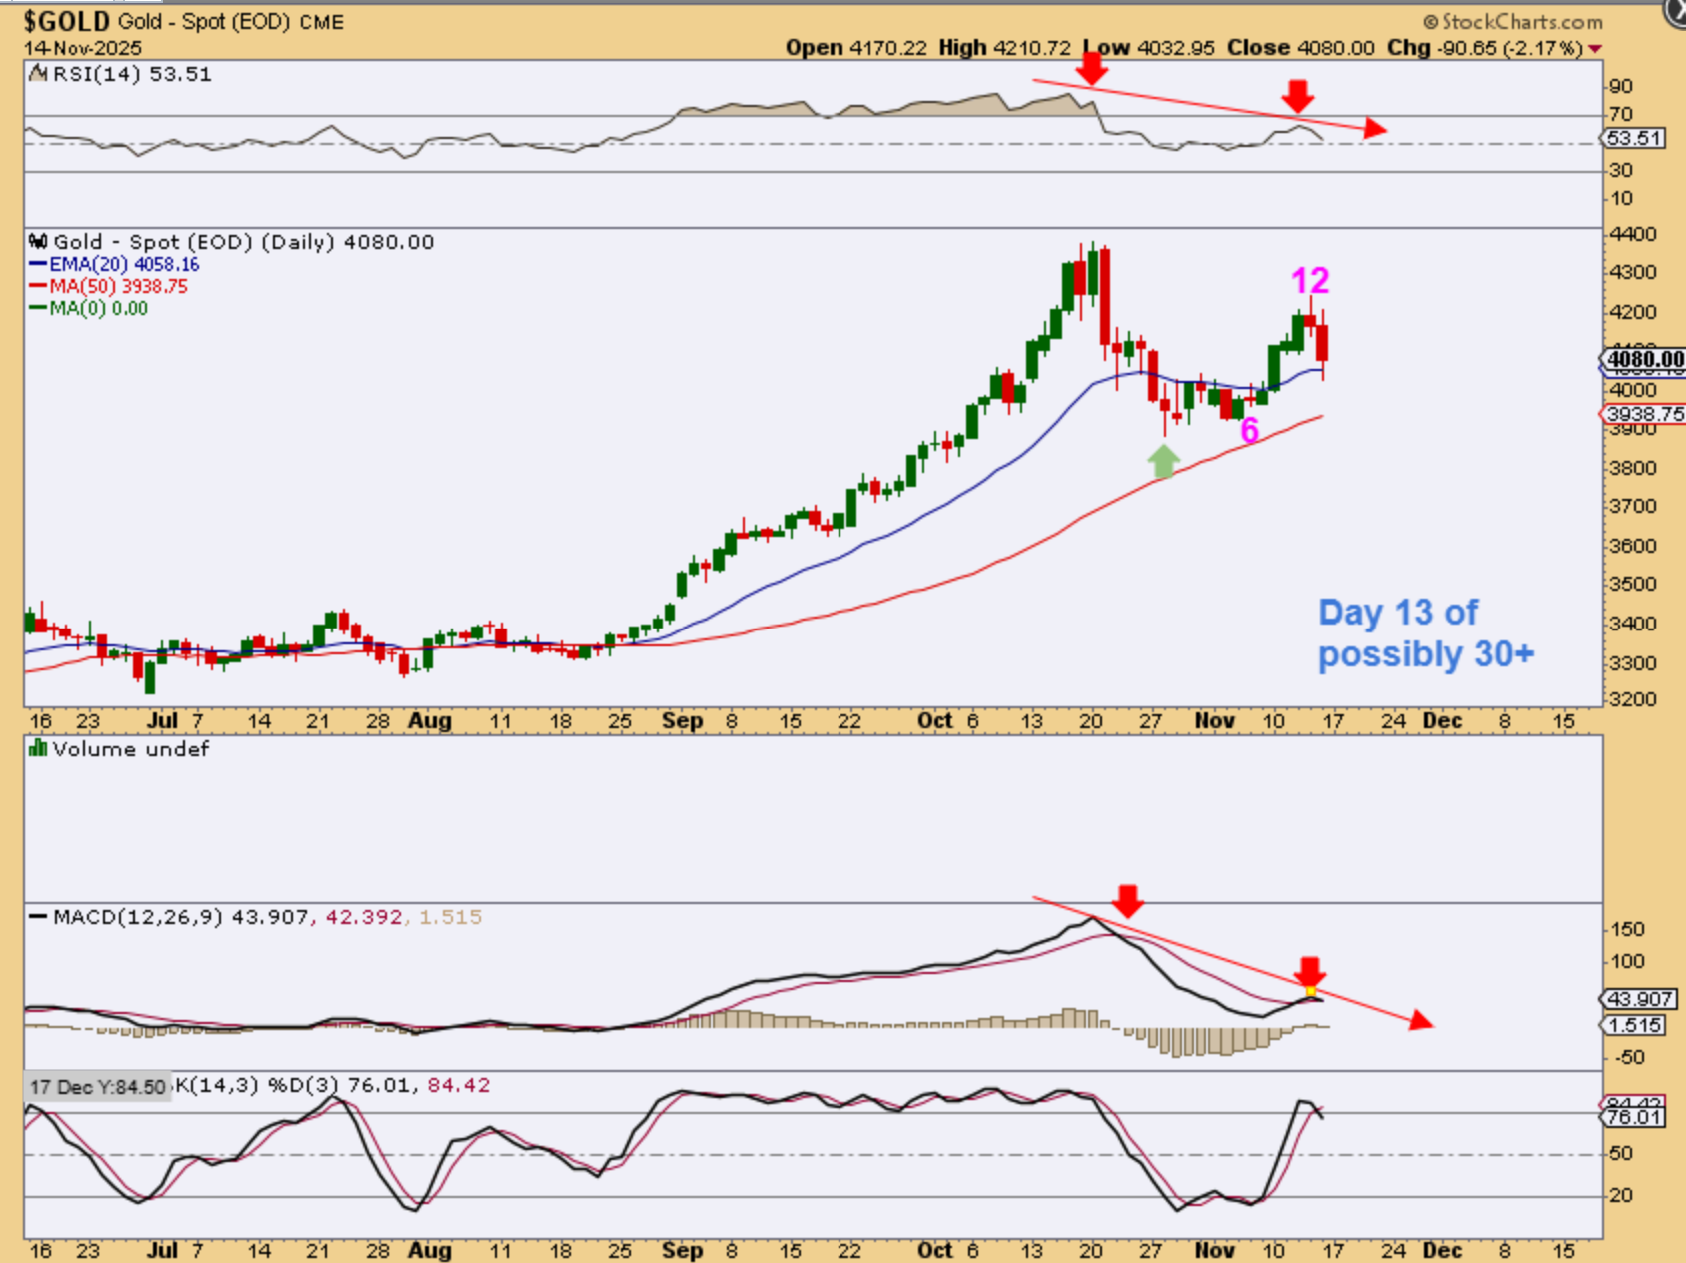
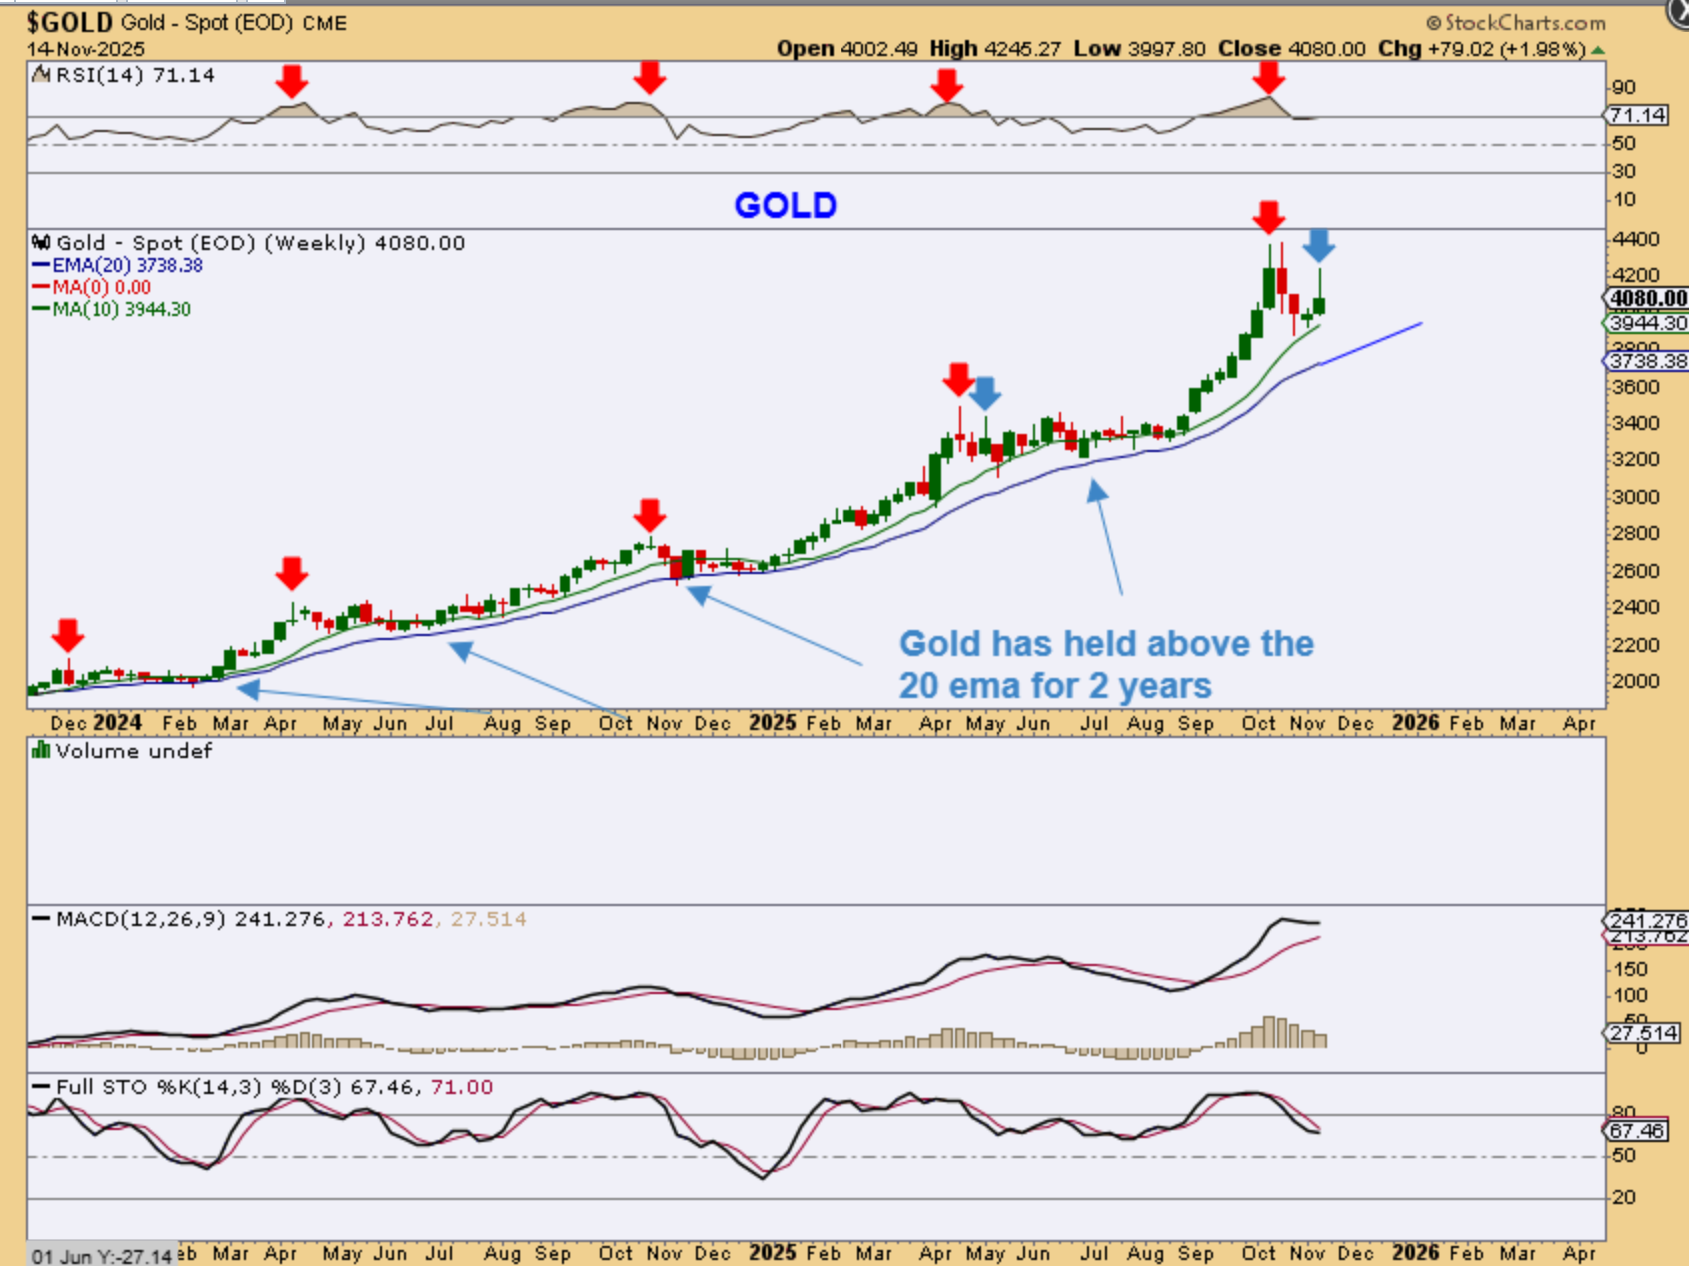
Friday was a down day for GOLD. A peak on day 12 leans toward being L.T. unless price can rally above it. Right now the RSI and MACD look weak, so this would need to chop sideways and push higher or else we may be dropping into that next ICL. The time is right for an ICL.
.
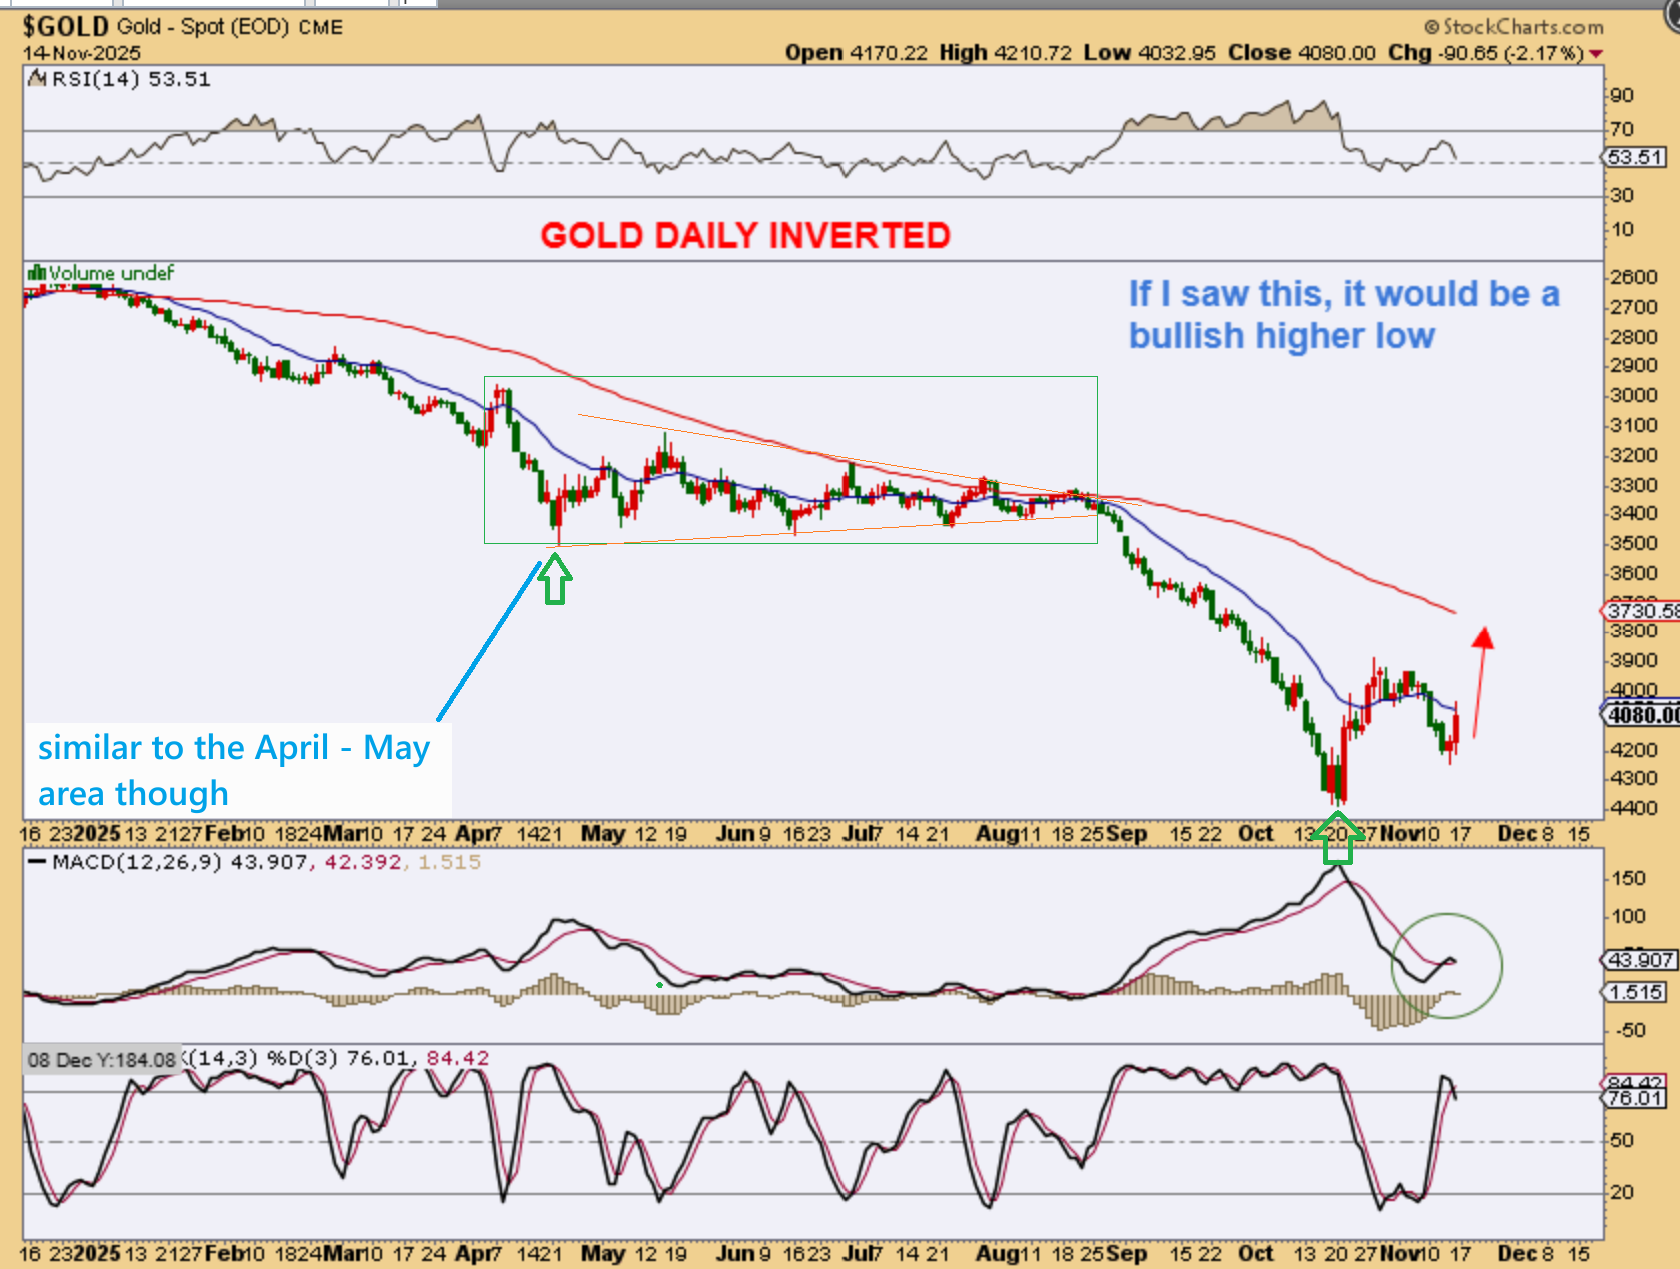
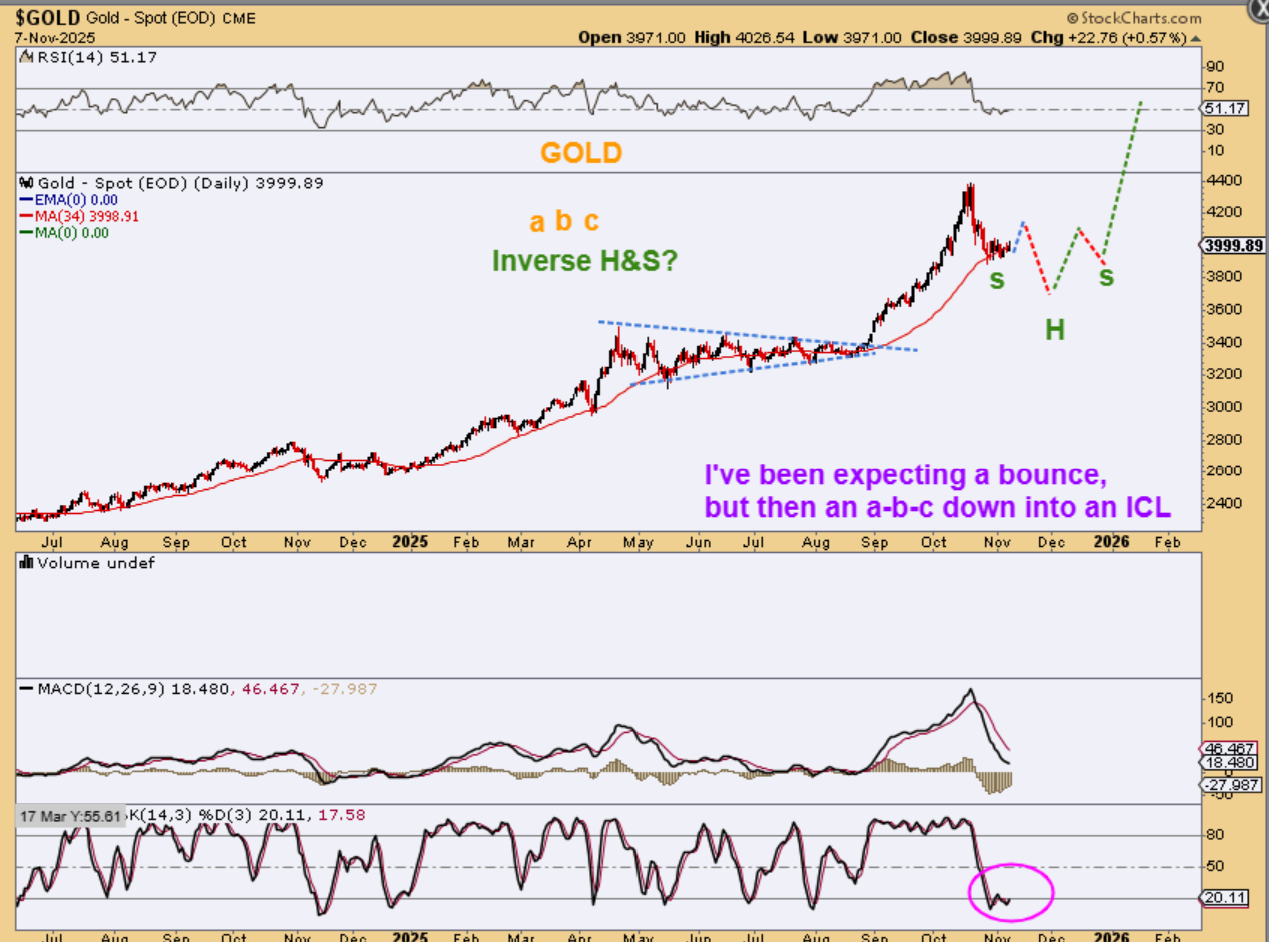
At times I take a chart that looks like it “MIGHT, MAYBE’ be topping and I flip it to see if I would think it looks to be bullish and bottoming that way. GOLDs inverted chart looks does like a bullish set up. We did see that in April and May too, but that was when the long consolidation gave us an ICL triangle.
.
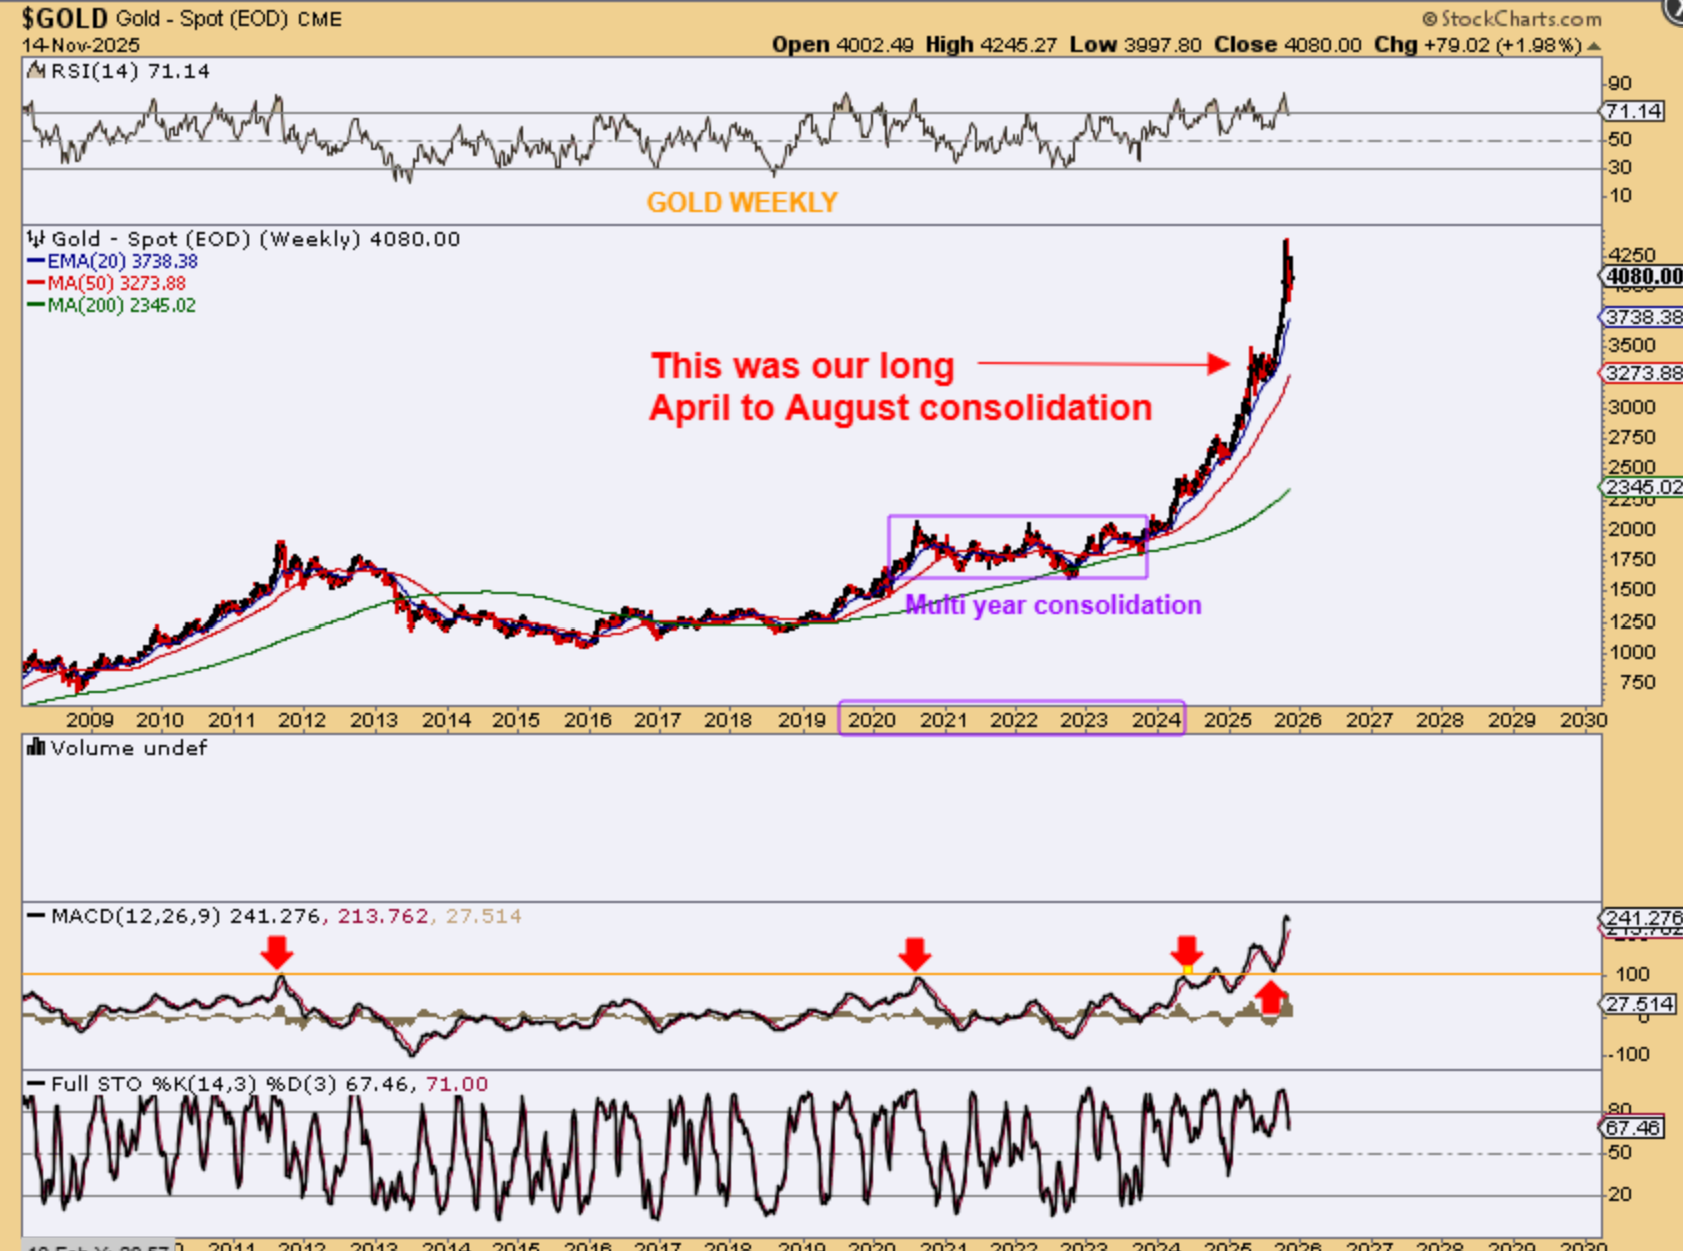
GOLD WEEKLY– So I look at this and I wonder,
1. Is it a parabolic blow off top (it really looks like it could be, with the USD bottoming), or
2. Could this churn sideways again as another mild ICL and then do a final run higher.
3. My advice was to buy the low if you want and use a stop in case this rolls over, or wait for an ICL or breakout.
.
A close up shows us another weekly reversal candle for GOLD. That also happened in April – May before churning sideways into an ICL, so we aren’t getting any solid clues, except that Gold may be now seeking out the ICL.
.
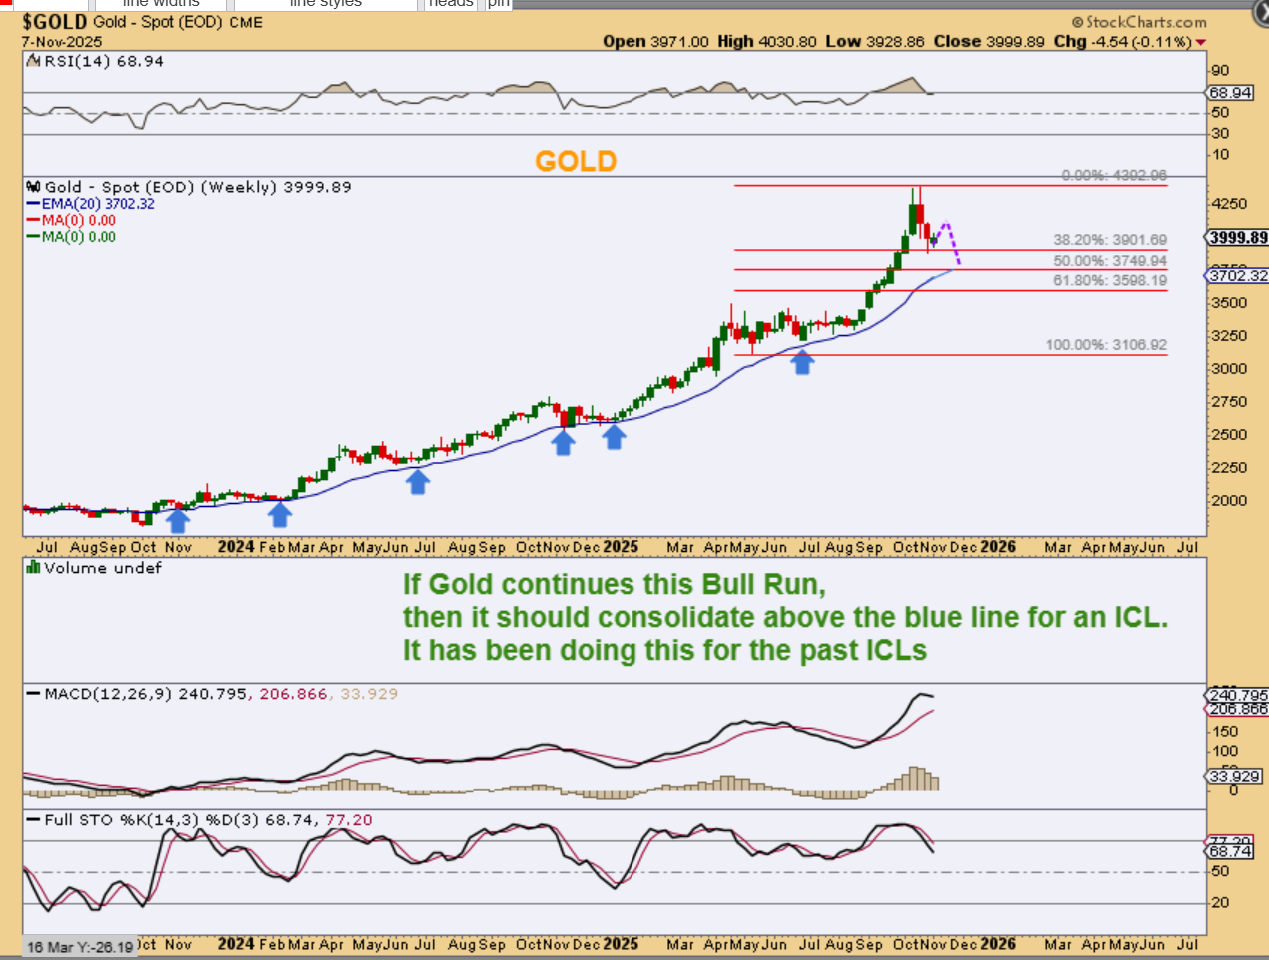
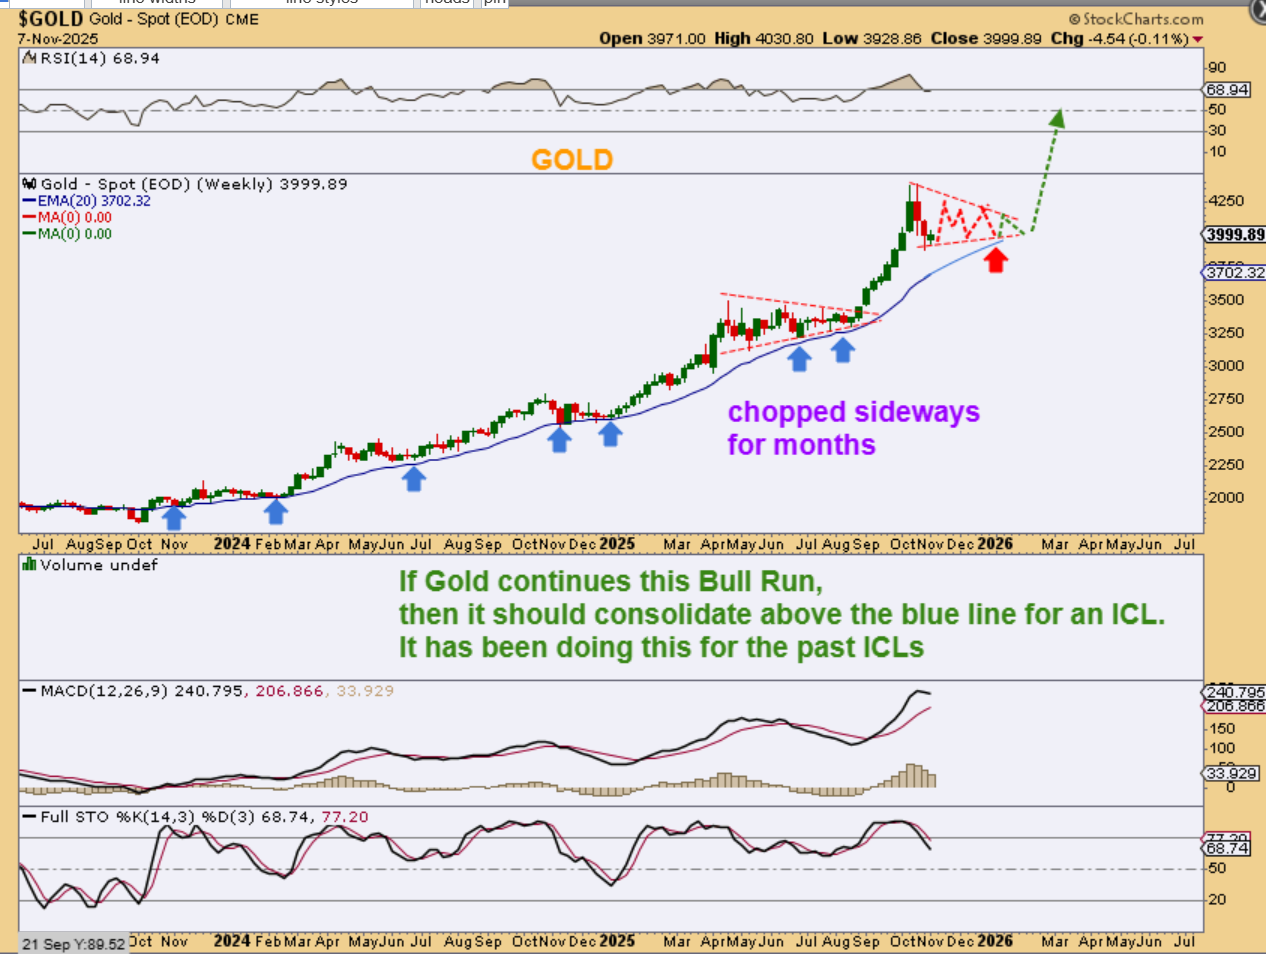
LAST WEEK I DREW THE FOLLOWING 3 CHARTS WITH GOLD BOUNCING LAST WEEK and it is still playing out this way rather than rallying to new highs.
.
A bounce (which we just saw) and then a dip into an ICL near $3750.
.
A bounce, which we did see) and then another choppy longer consolidation into an ICL, or…
.
A bounce on the daily chart (which we did see) and then a drop into that ICL still near $3700-$3750 area, that gives us an inverse H&S and another rally.
.
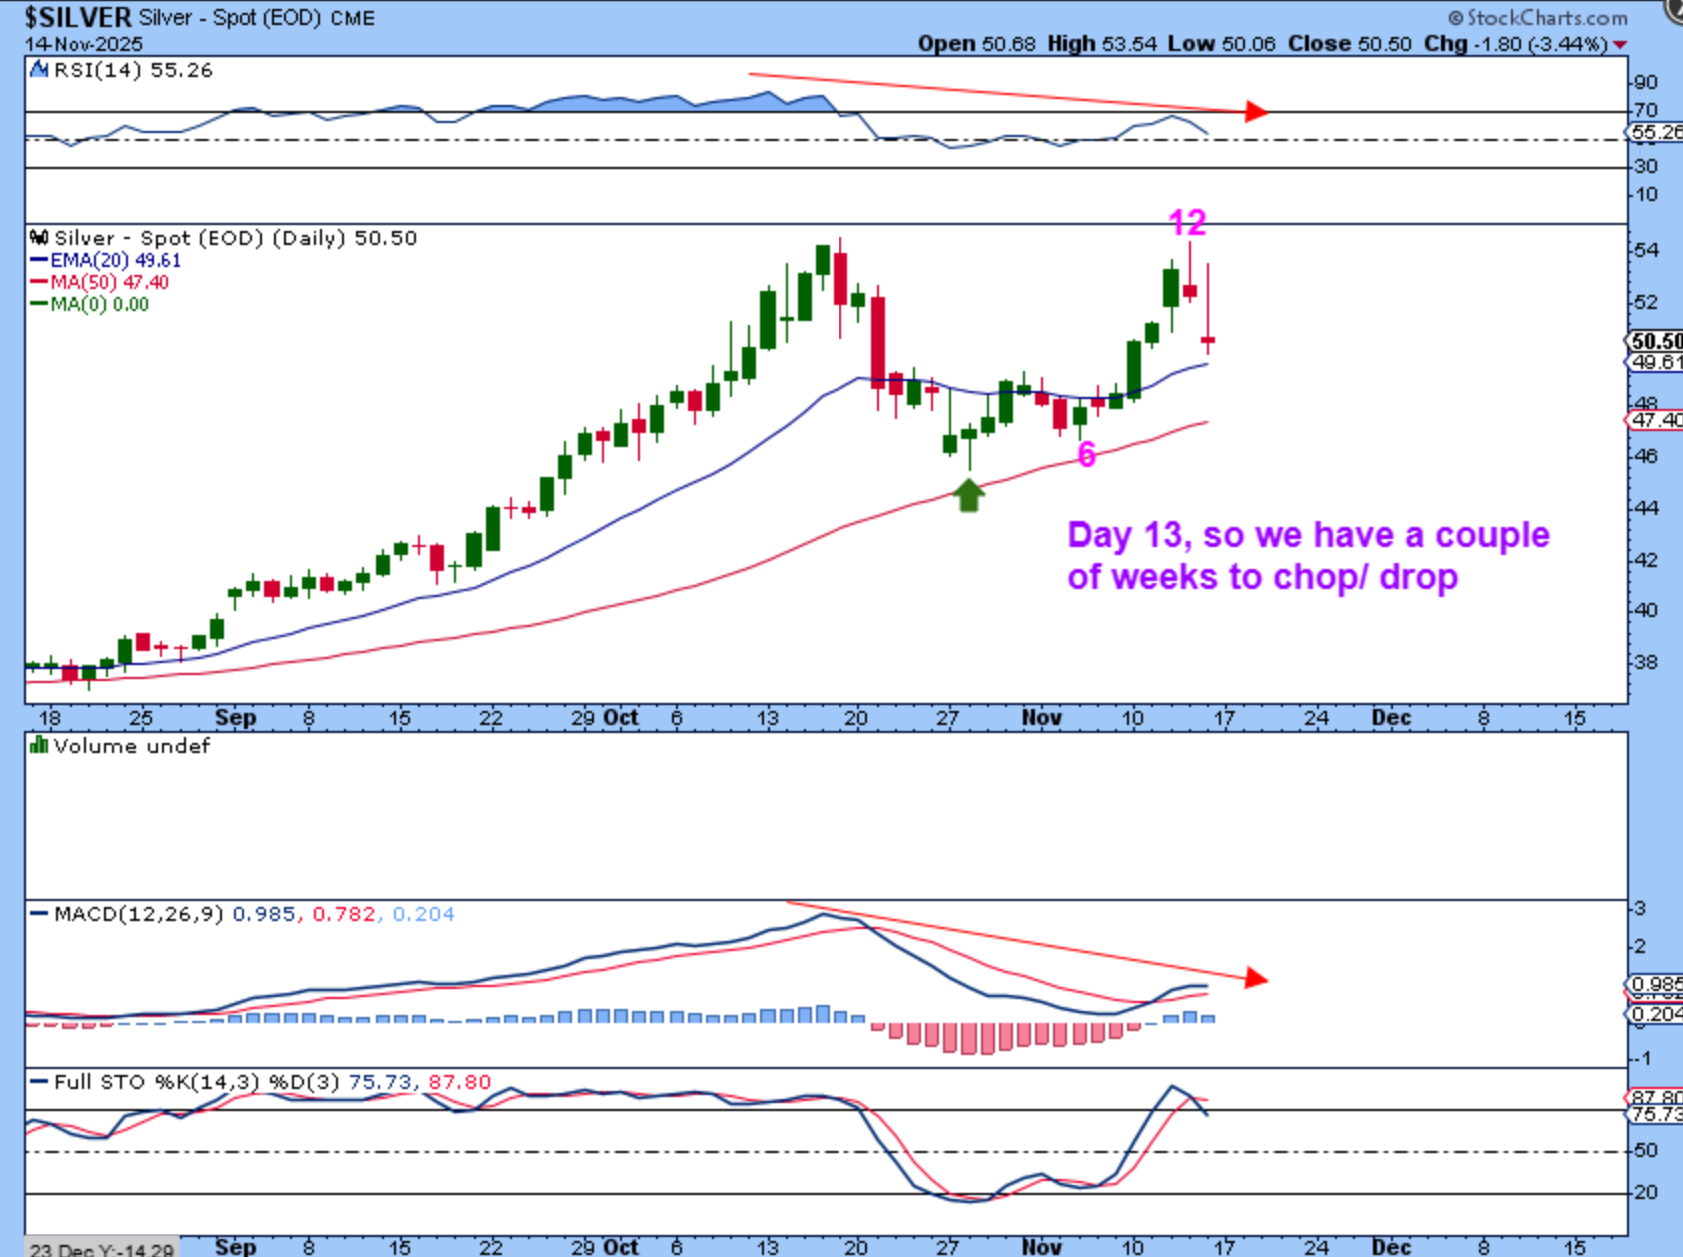
SILVER gave us a much bigger bounce than Gold did, but after peaking on day 12, it also sold off. It feels like we will drop into that ICL, so…
.
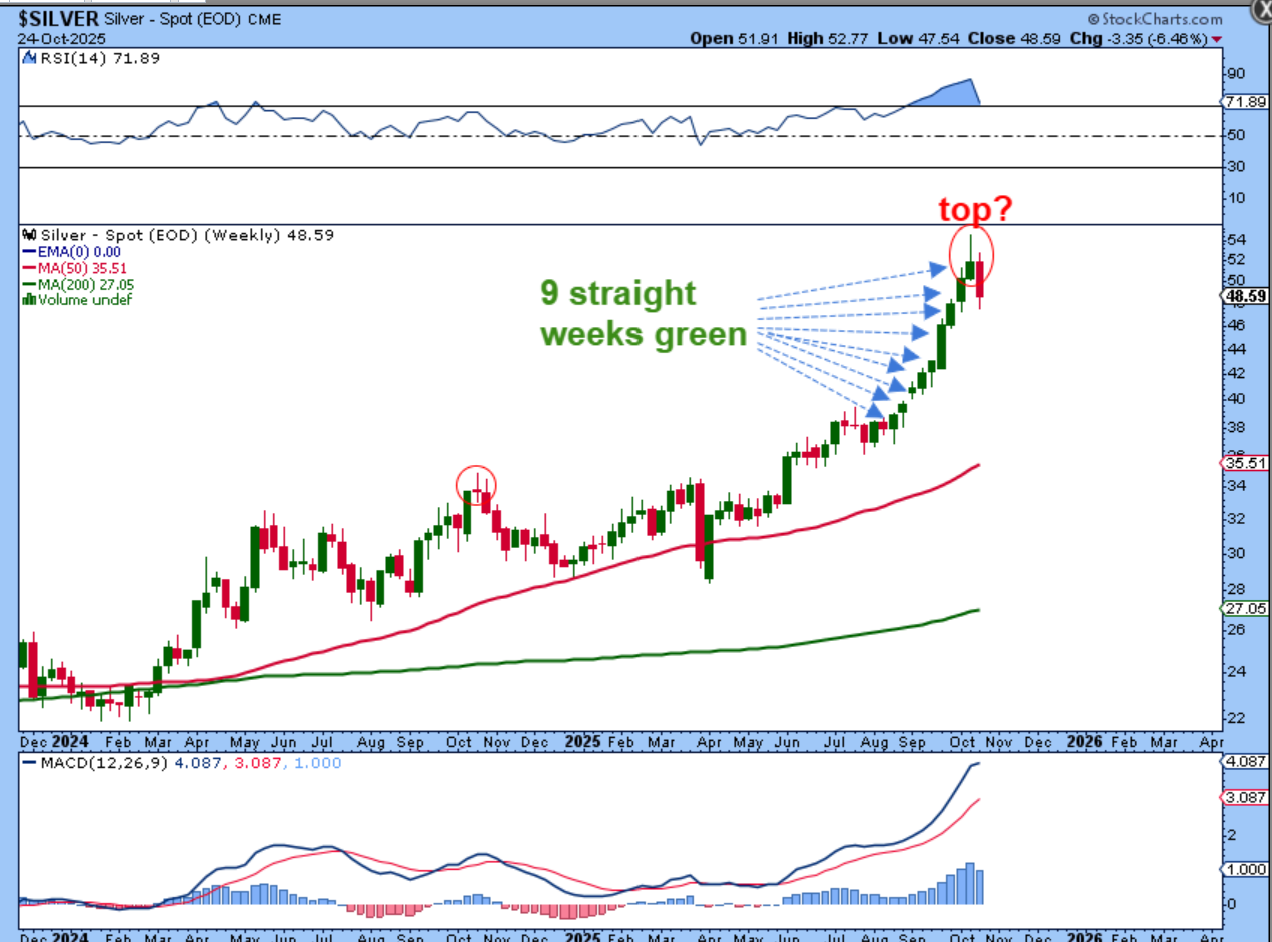
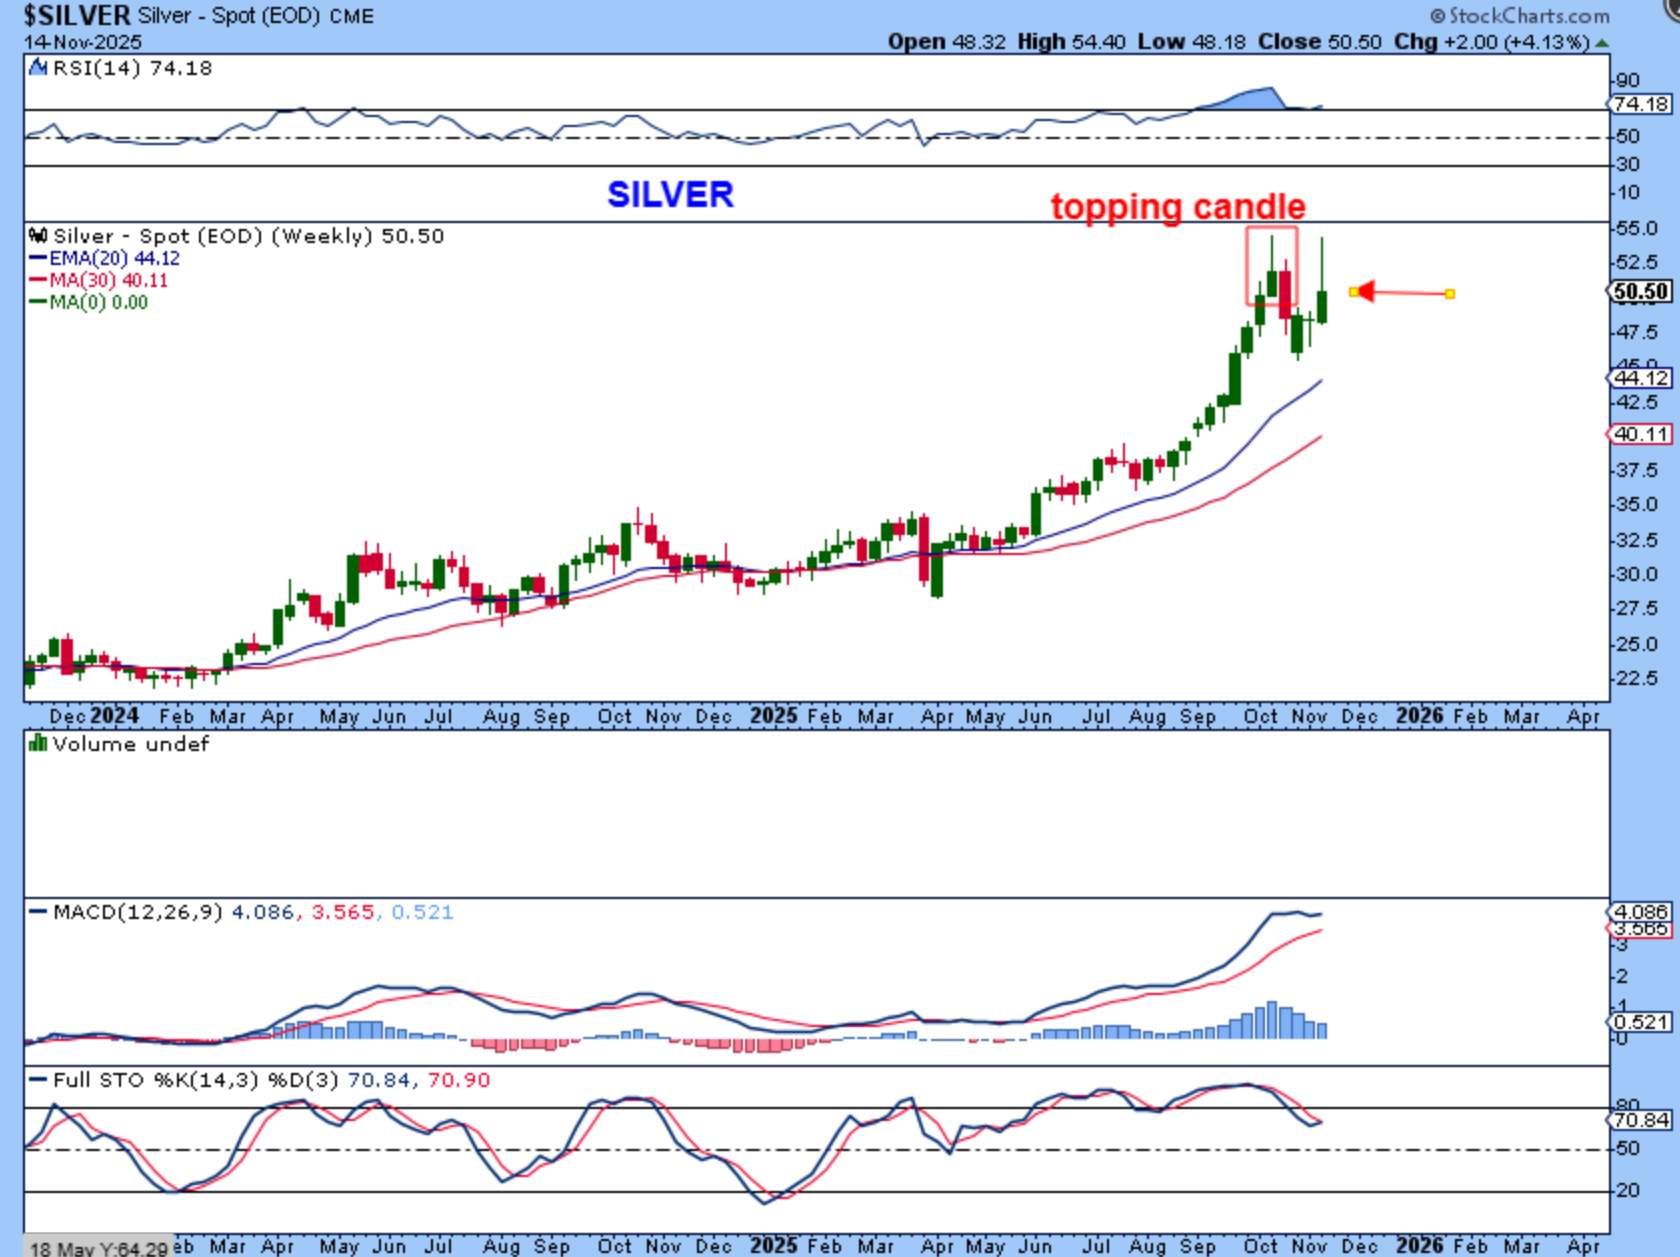
SILVER WEEKLY CHART:
3 weeks ago I pointed out the 9 straight week rally and a reversal candle as likely being the top.
.
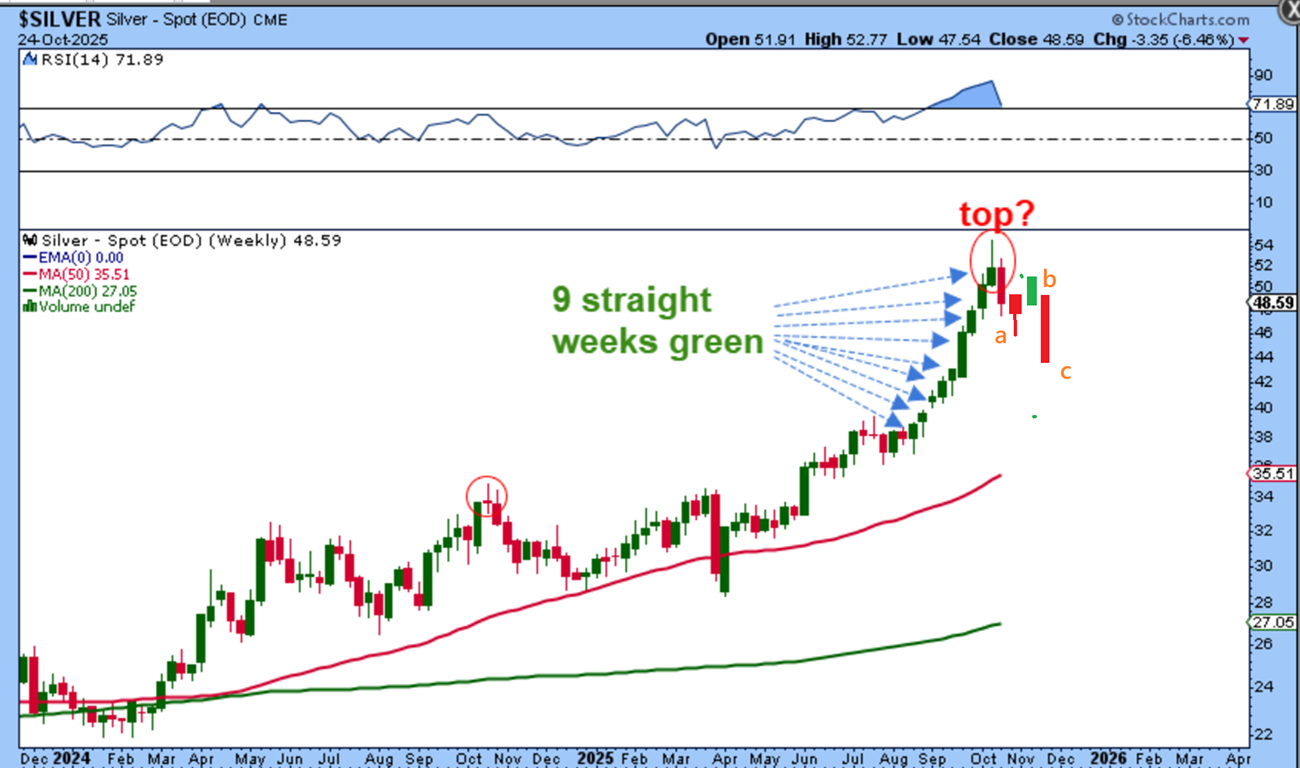
SILVER- I pointed out an a-b-c as a possible drop into an ICL. (Silver has since run back up to the highs, but an a-b-c drop is still possible).
.
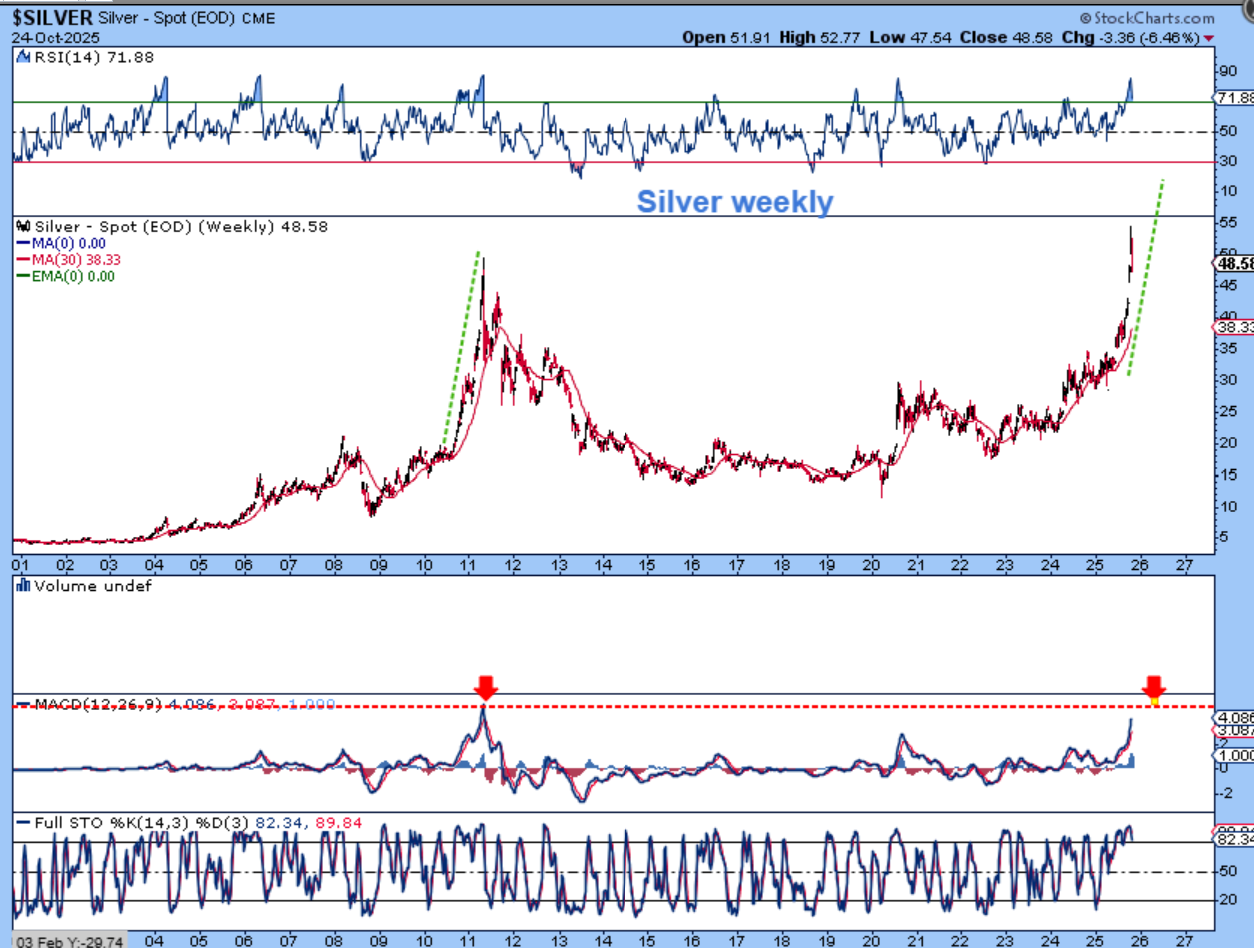
SILVER I showed that the MACD is not as overdone as the 2011 top, so maybe we have room to run?
.
Our current Silver weekly chart shows us with another one of those topping candles or reversal candles. This still could play out as an a-b-c down.
.
And GDX has and will likely continue to follow Gold.
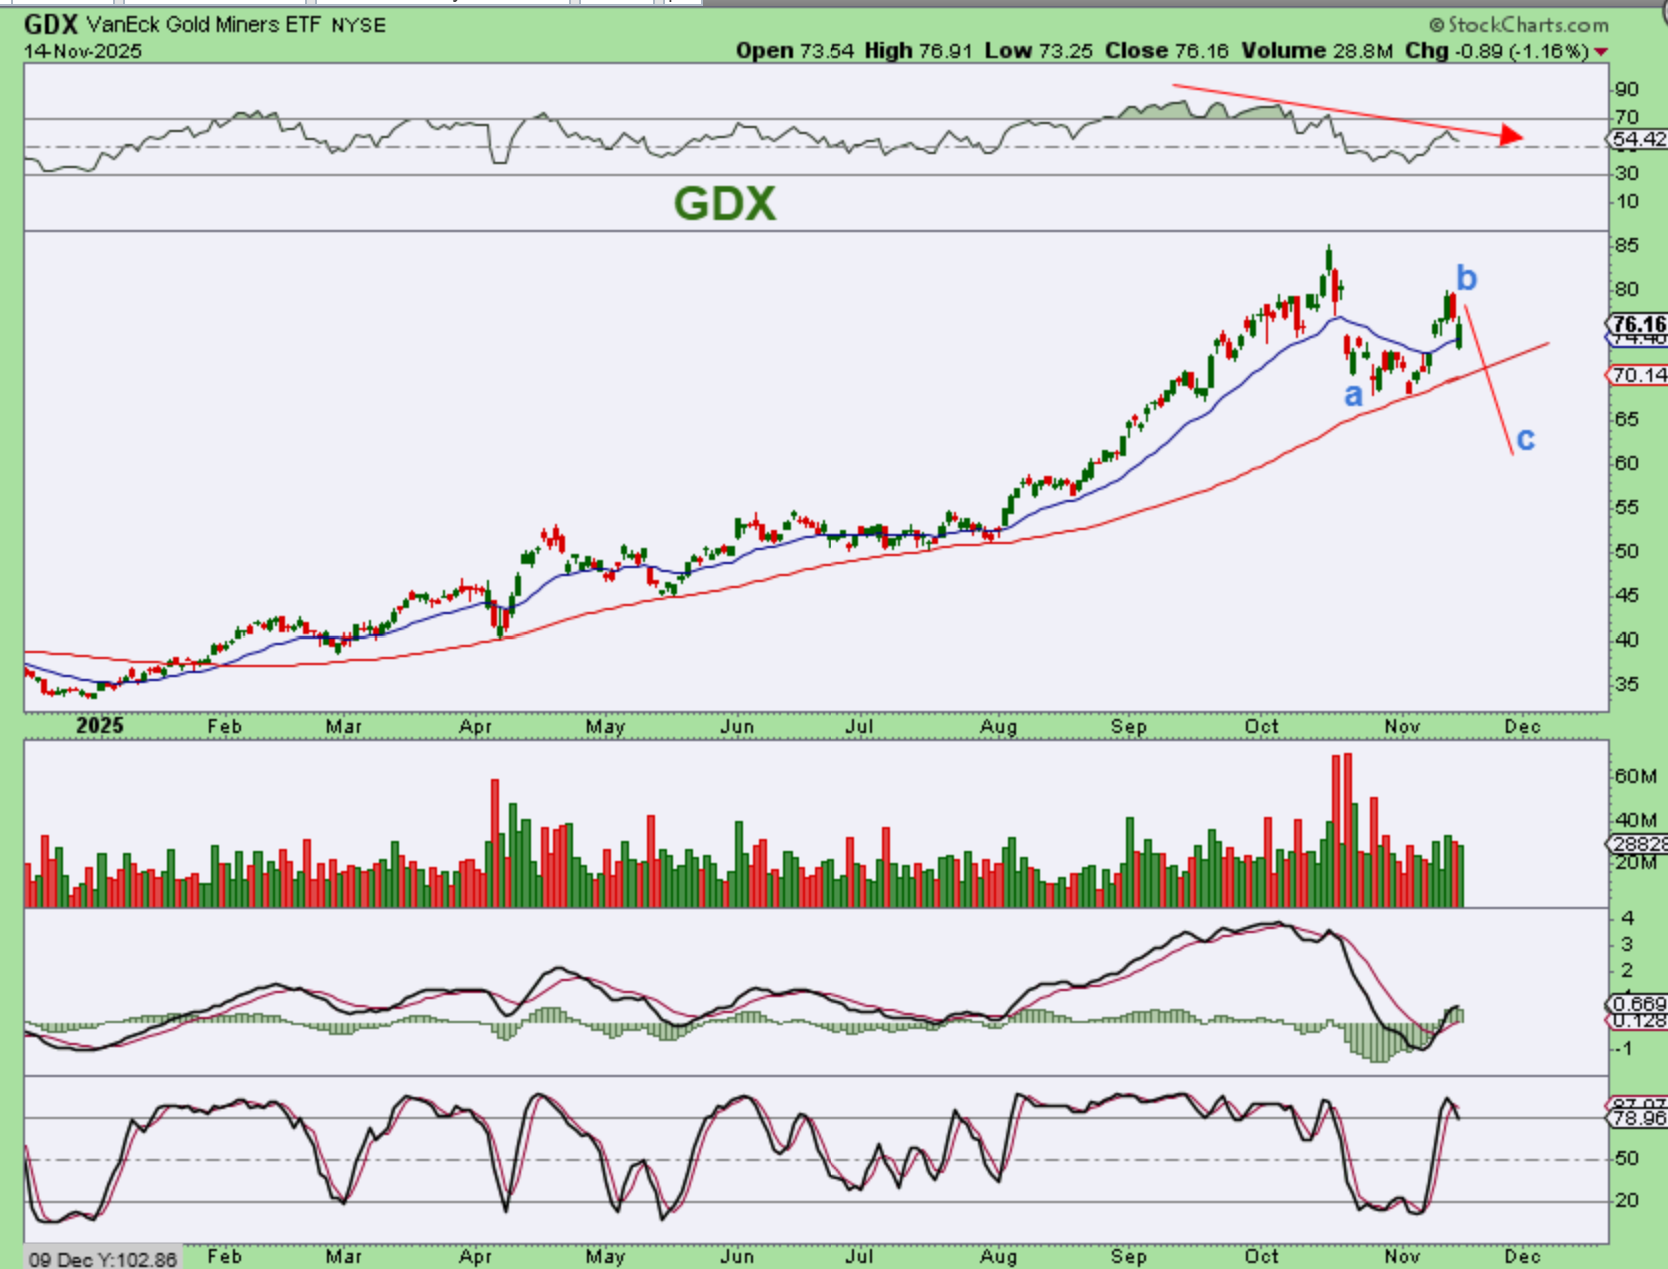
.
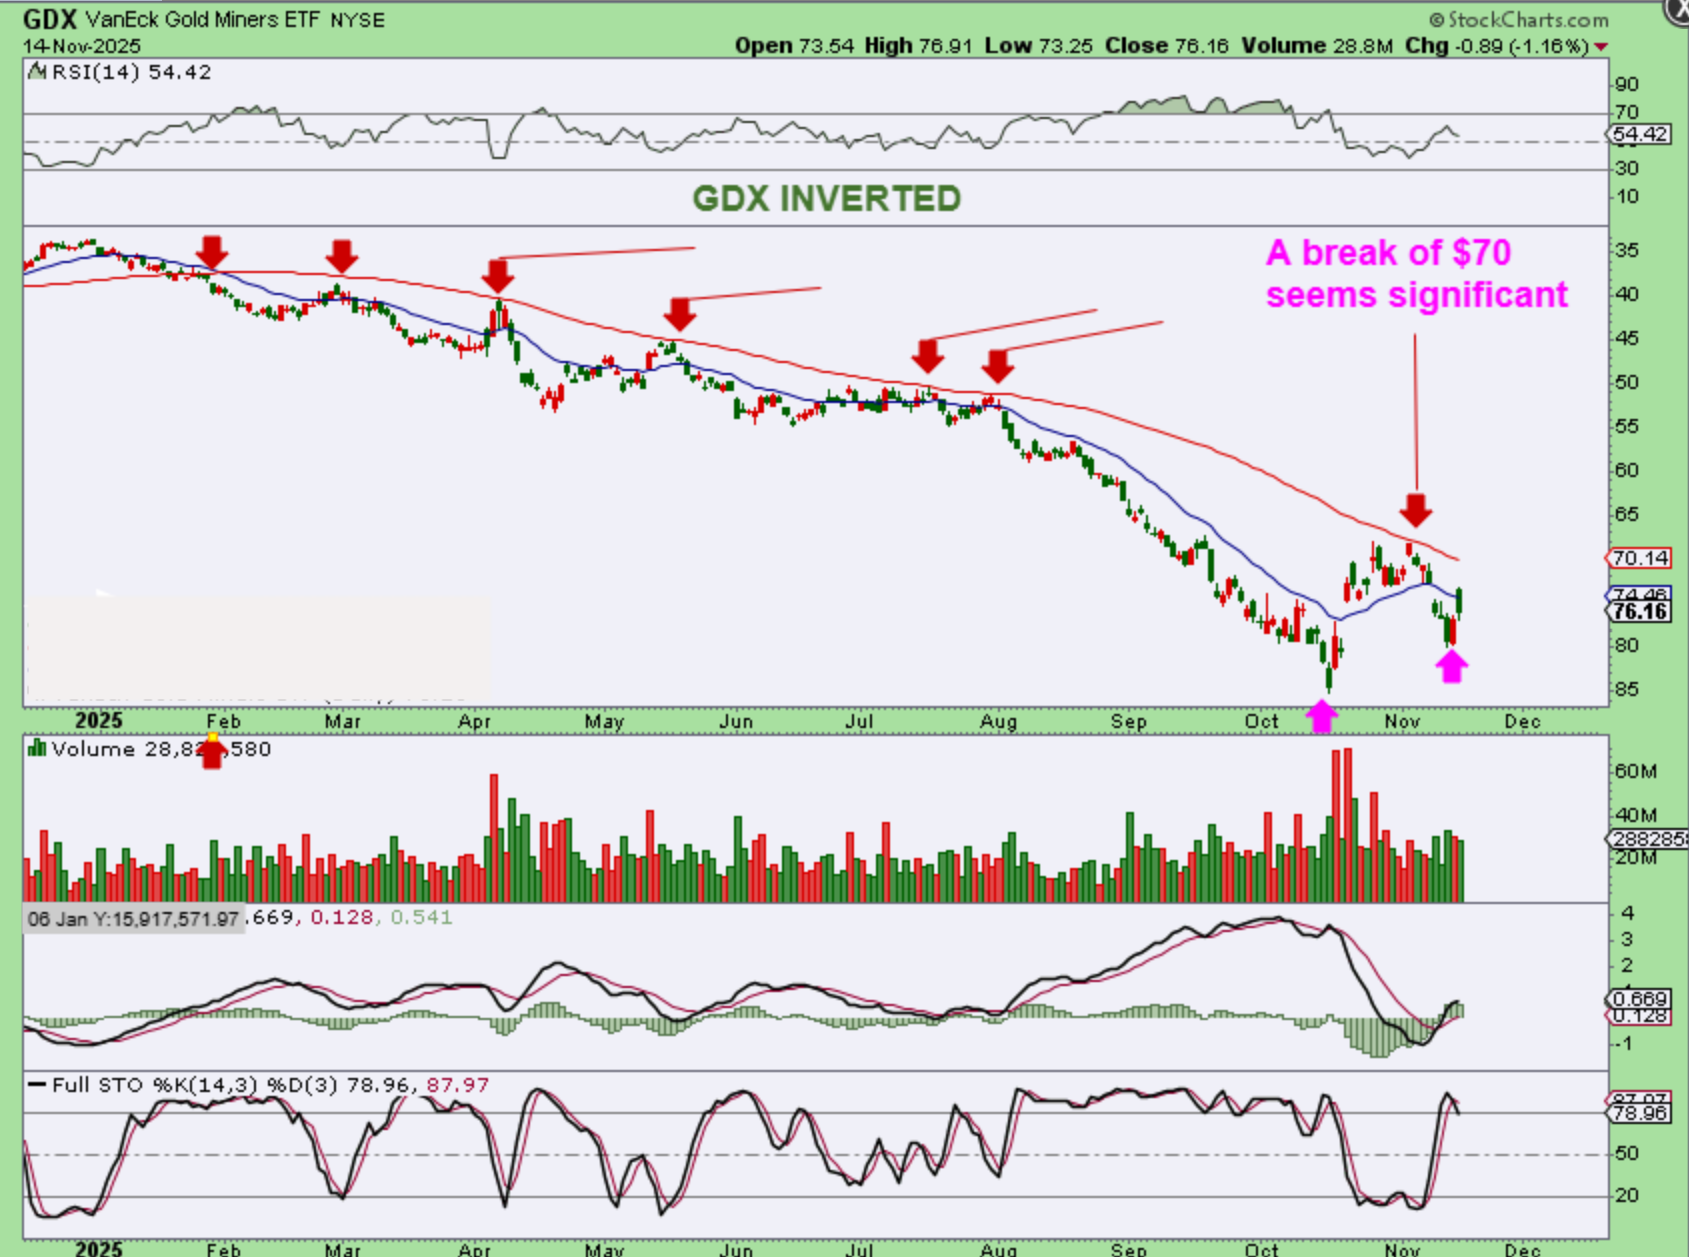
I also did the inverted GDX and it also looks like a bottom. GDX dropping below $70 looks significant. THIS chart makes it look like we will drop into an ICL.
. .
That is our weekly review. I used to say that ‘The Bulls remained firmly in control’, but at this point we look due for a pull back. A drop into an ICL can be boring or it can also start to look ugly and concerning, but actually, an ICL is a great buying opportunity! If we start to just get really choppy or even start to sell off lower over the next couple of weeks, it may lead into an ICL followed by a nice year end ‘Santa Rally’, as it has been called. Have a great weekend everyone, and as always, thanks for being a Chartfreak with me!
.
~ALEX
.
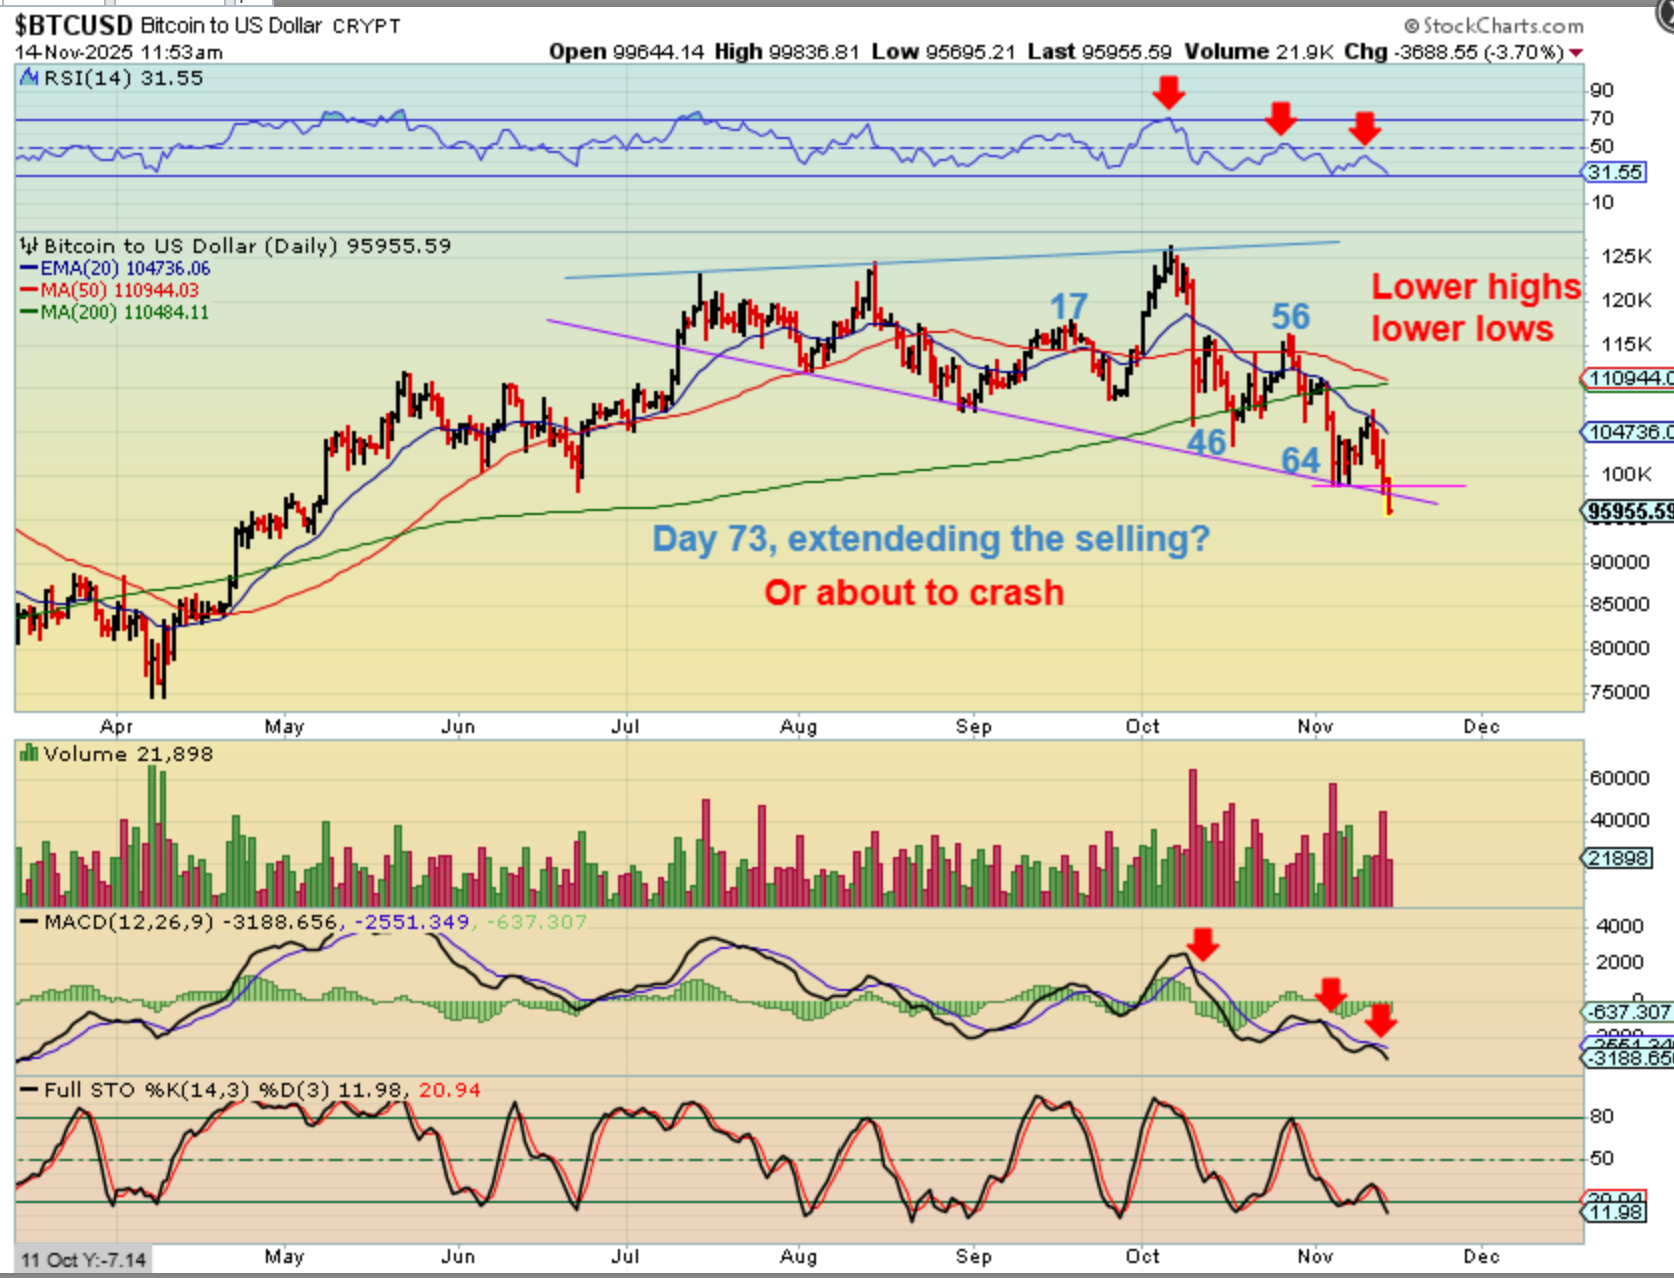
IN FRIDAYS REPORT, I asked this question:
Is it possible that the selling is so persistent that it extended the daily cycle to day 73 and will still bounce? It is possible and bear markets daily cycles do seem to last longer than Bull Markets.
Now, I don’t want to give out false hope, because many crypto stocks are getting crushed, but Bitcoin could bottom late and then rally to the 50sma, giving crypto stocks a bounce. Let me show you why I say that…
.
There was a time earlier this year during the ‘Tariff sell off’ when BITCOIN had a day 57 low, but it only bounced and then broke the low weeks later with the general market ICL April 7th. I couldn’t see any other way of counting this from LOW-TO-LOW, right? It was 84 days low-to-low.
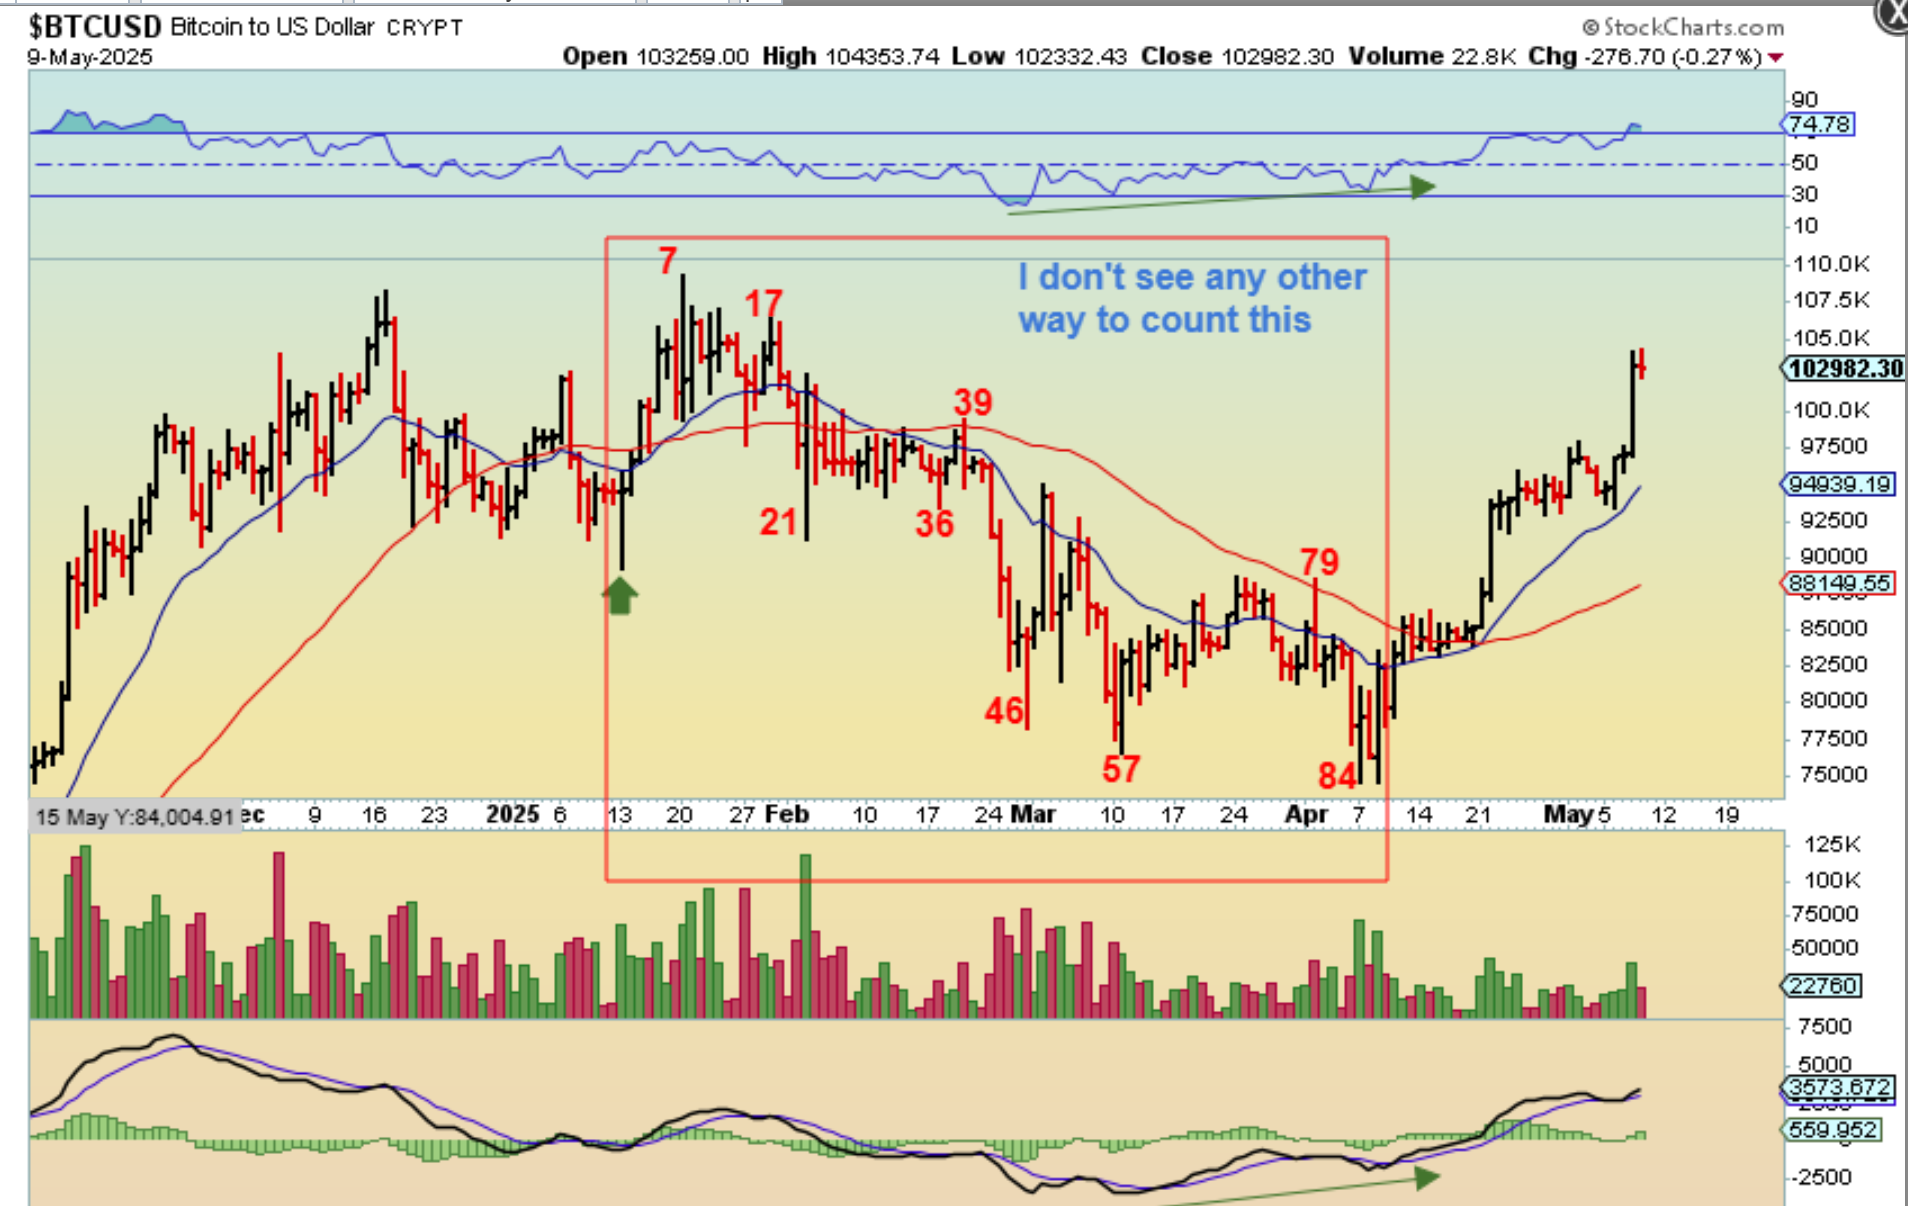
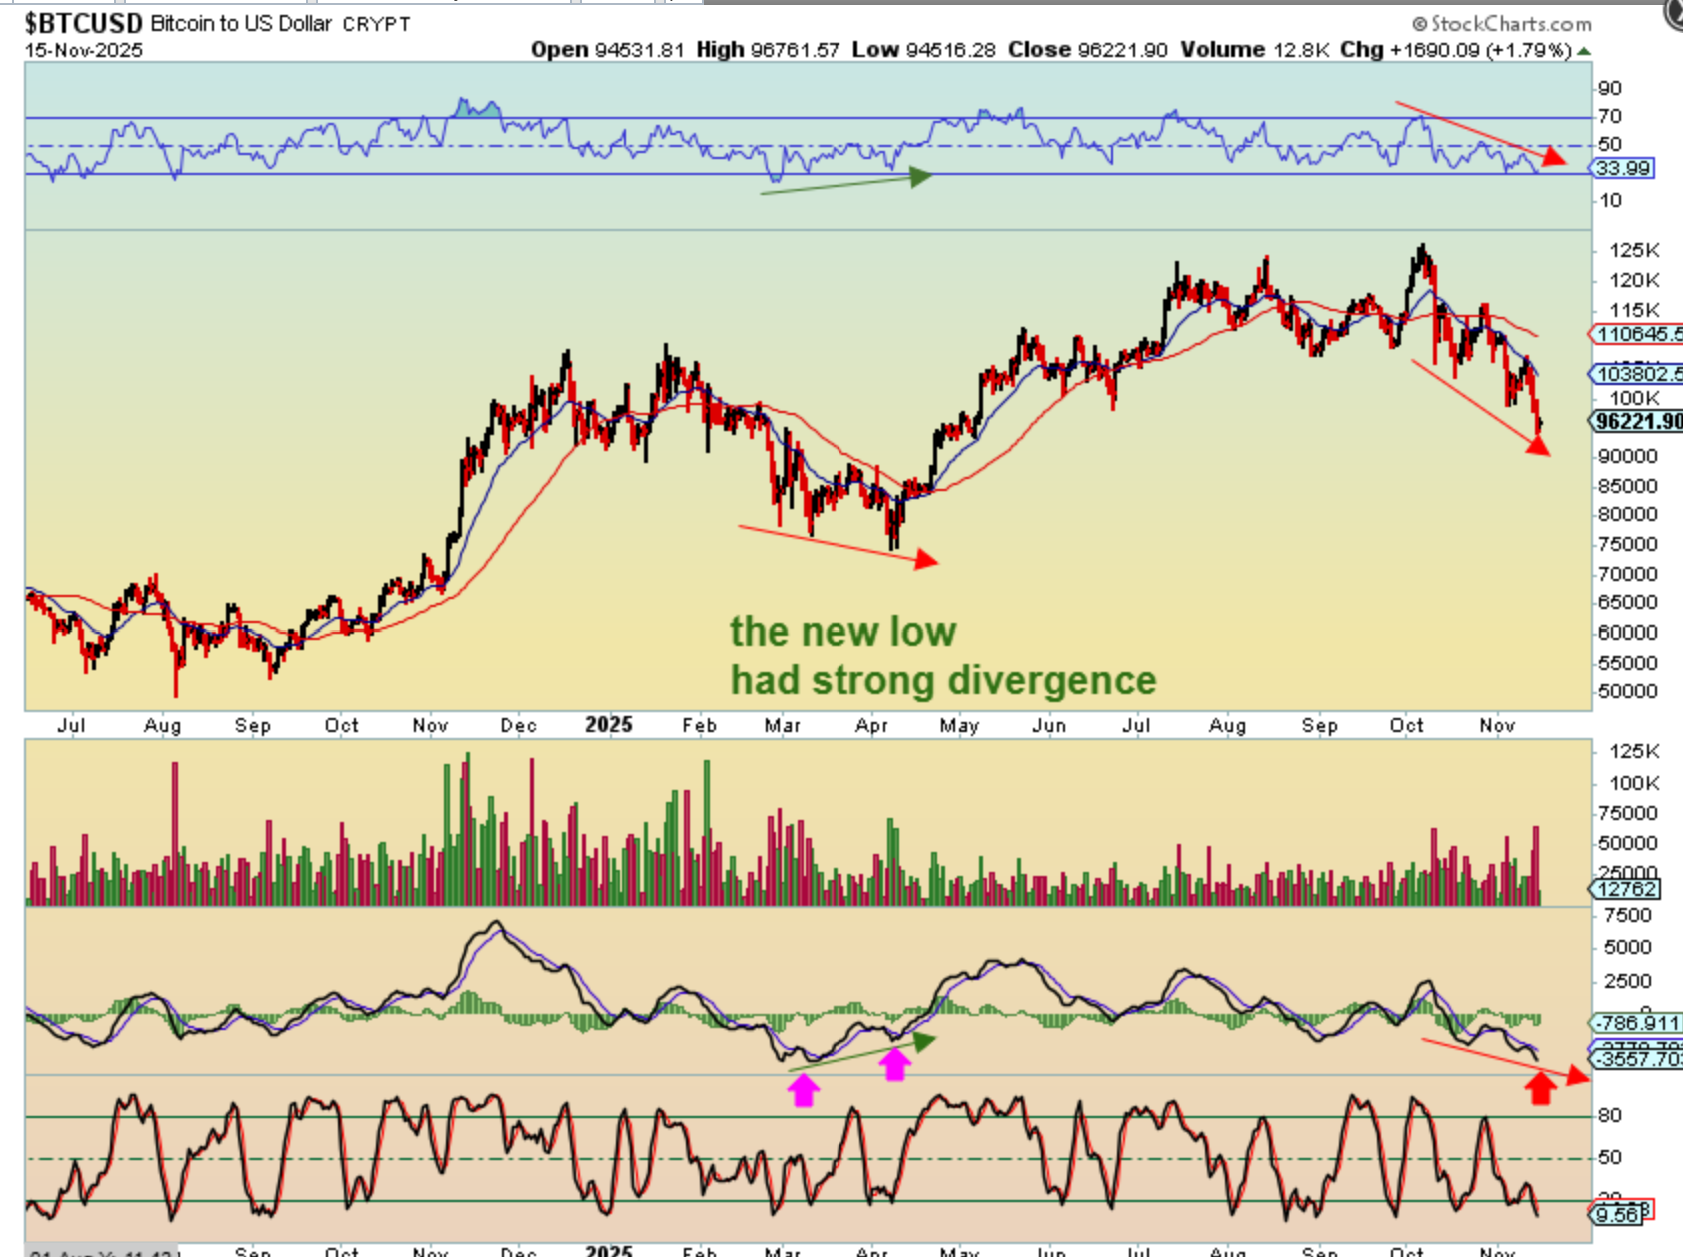
The big differences that I do see from that time to now is the Divergence in the RSI & MACD, and the volume.
Back at the April 2025 lower low, BITCOIN had strong divergence at the MACD. The RSI also had begun to rise up and volume selling was drying up a lot! Right now we do not have any sign of strength like that in the RSI or the MACD, and volume is hgh.
.
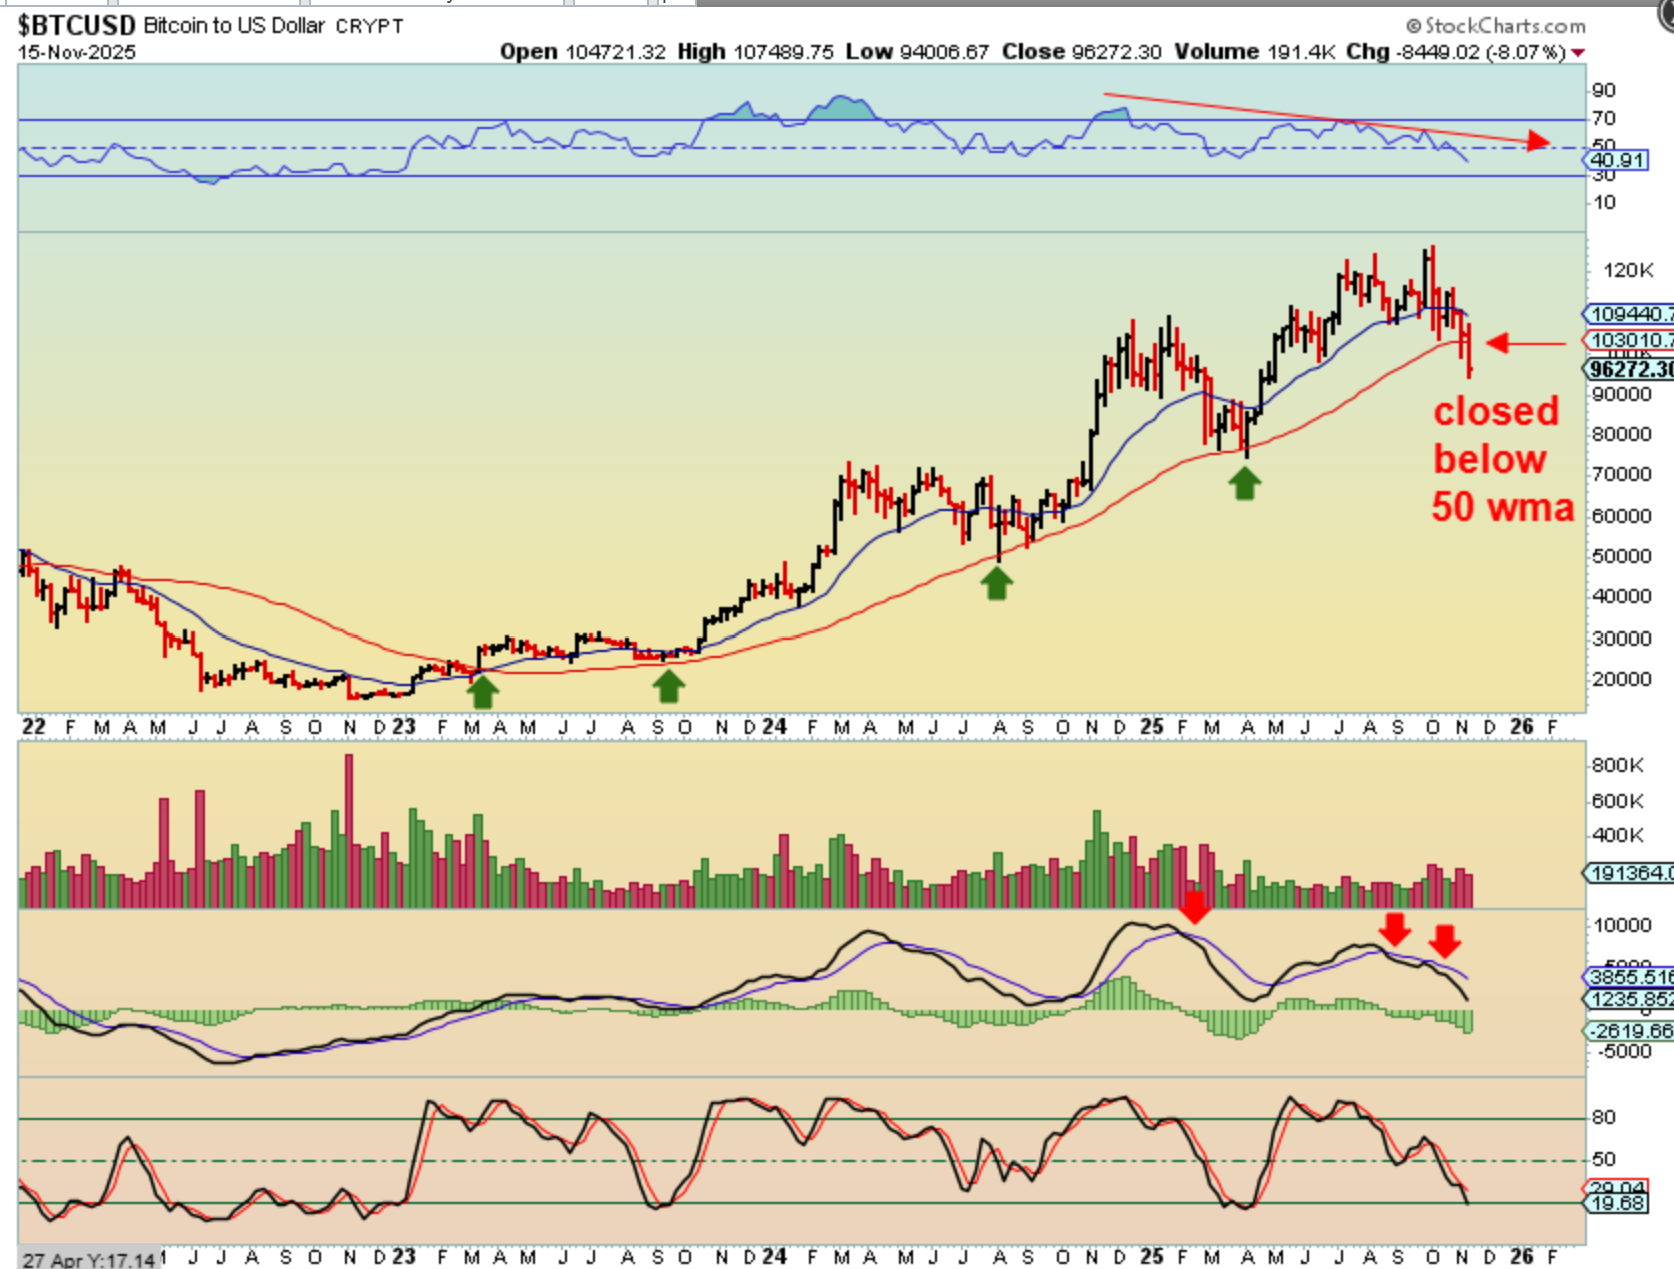
BITCOIN WEEKLY – This is also the first time that Bitcoin CLOSED below the 50 week ma, and it did so by quite a bit. There is No doubt in my mind that we have been seeing a change in character with Bitcoin. Even if it ounces, I think that it will be weak and then roll over.
.
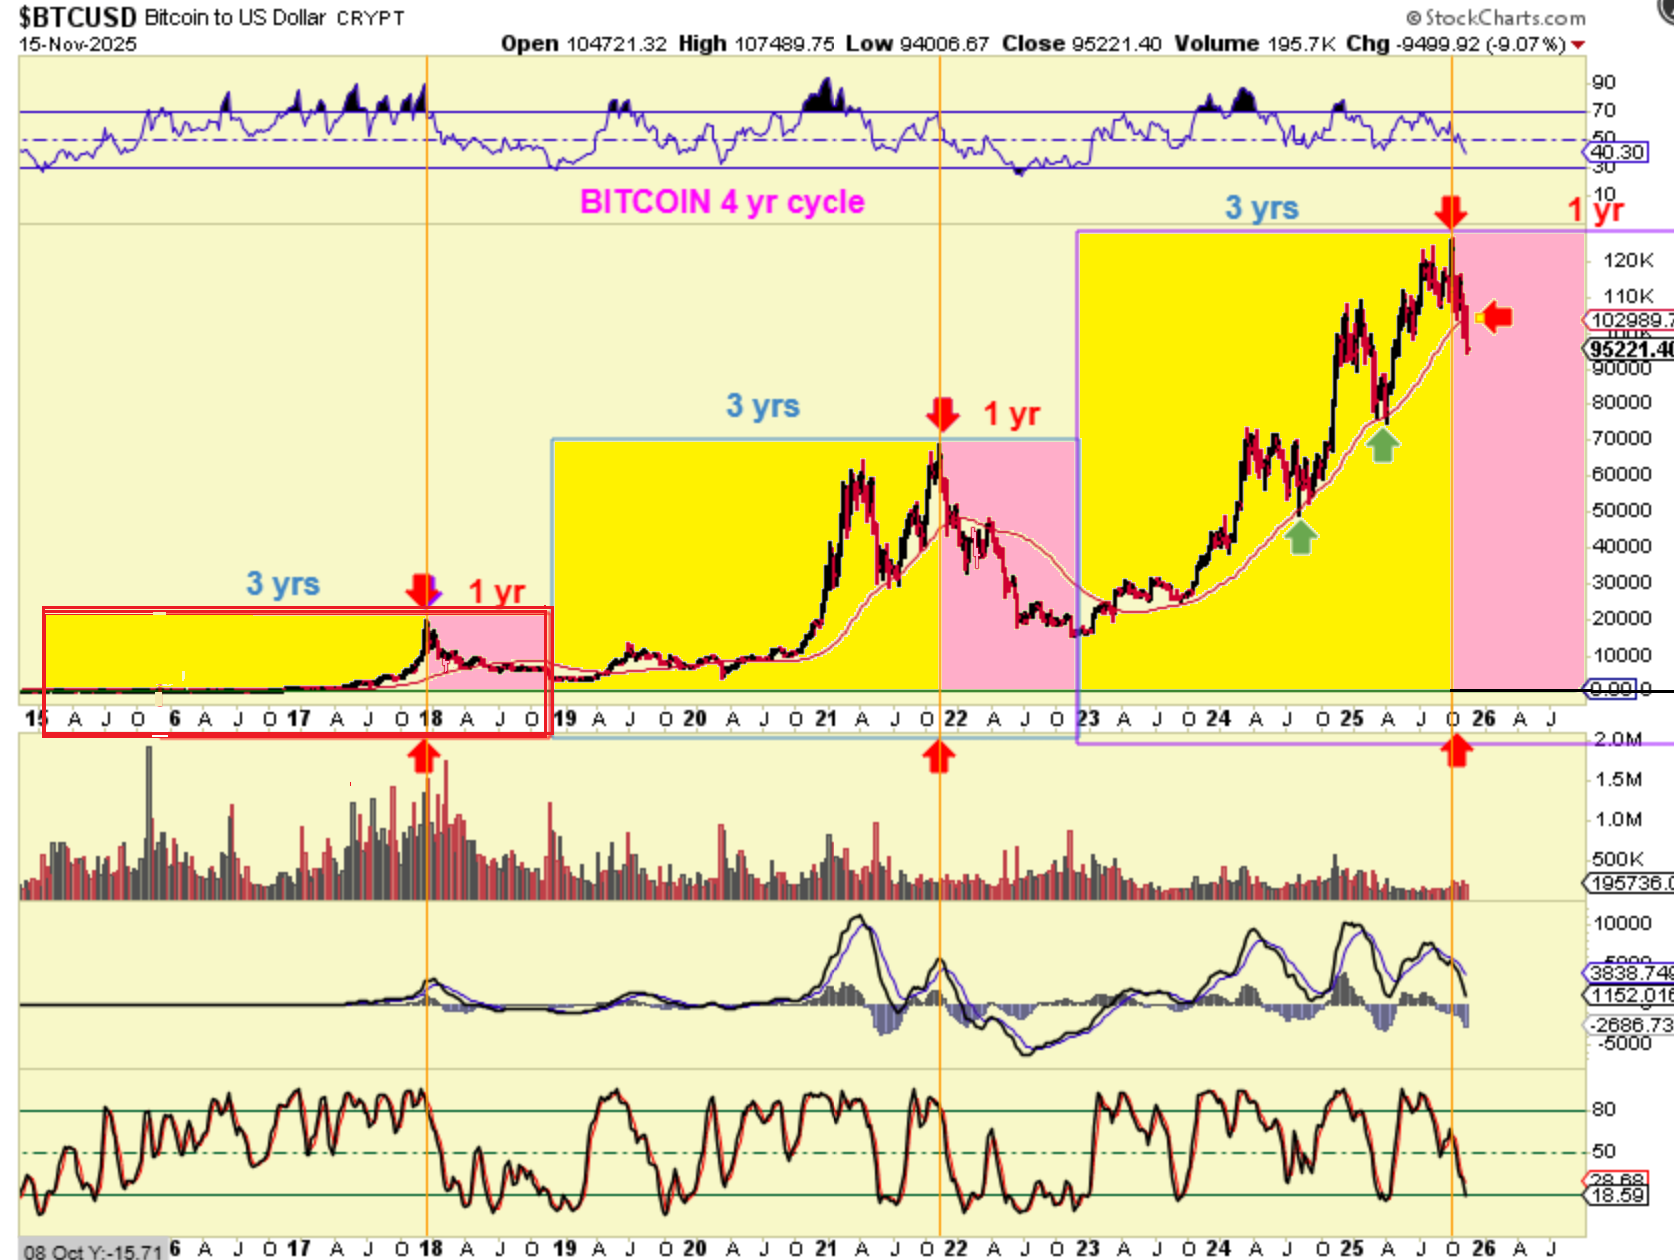
BITCOIN WEEKLY 4 year cycle review – Notice that the ‘peak’ for the 4 year cycle comes in late every 3rd year. We are there now.
.
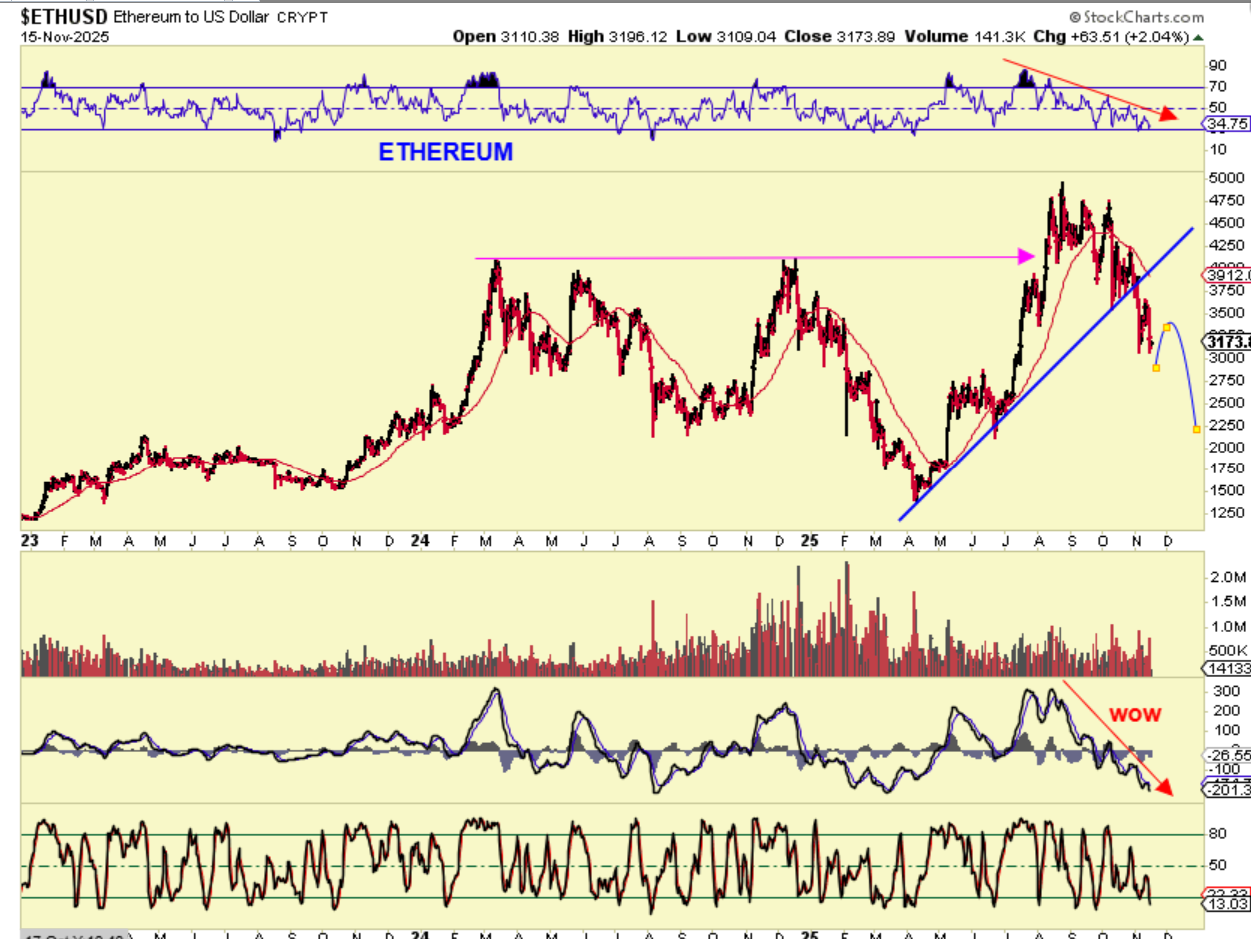
ETHEREUM is not something you want to hold onto either.