Nov 1st Weekend Review
I will proofread this report for typos later. I want to release it before I head out for the evening. Enjoy!
.
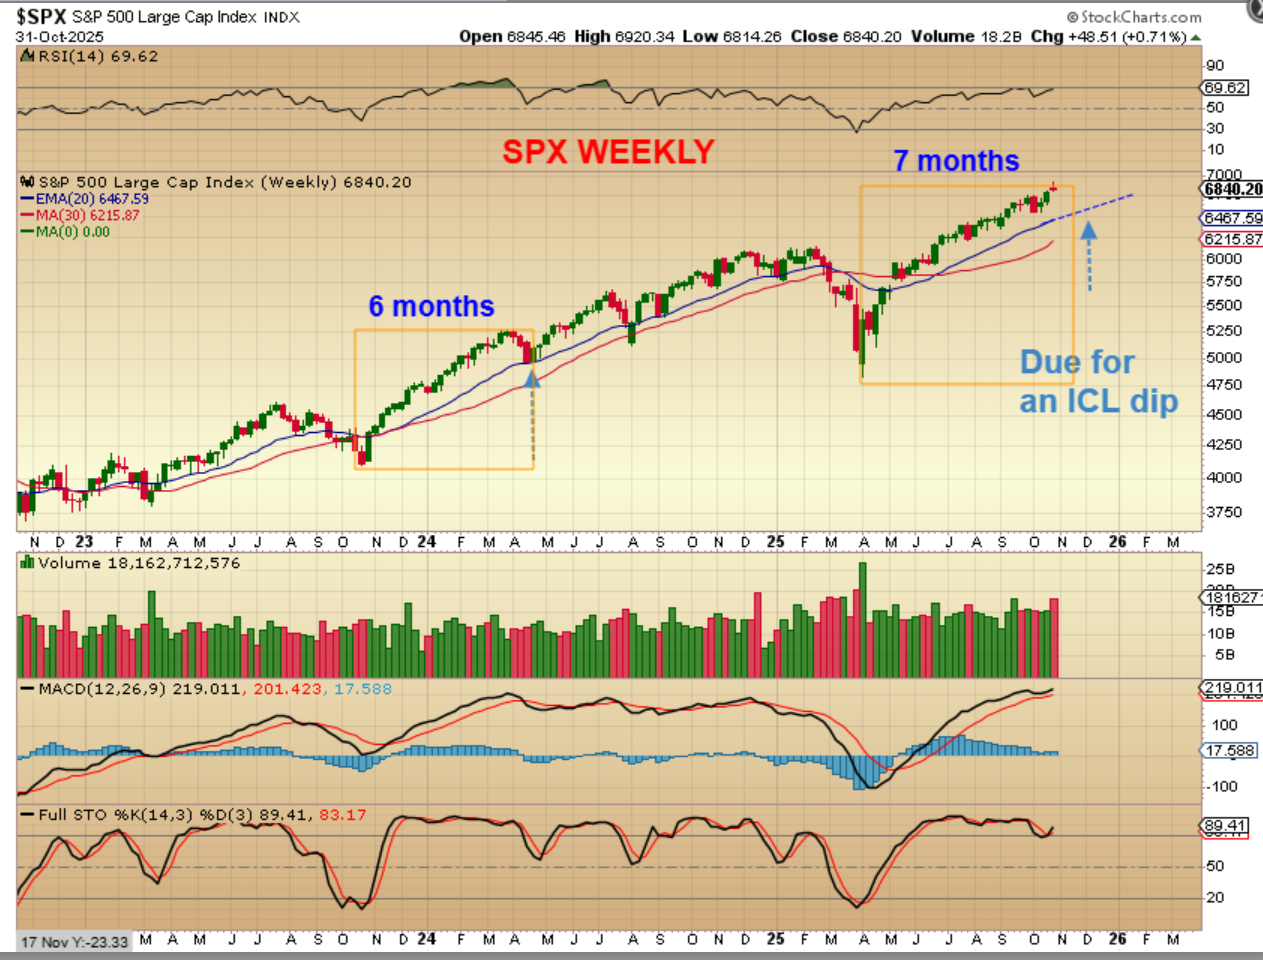
SPX WEEKLY- This was a Fed Week with a Rate Cut. The markets ran higher and then started to drop, so we have a possible top reversal candle. It is noteworthy that we are on Month 7 and ICLs can come at month 5,6, or 7. We are due, but…
.
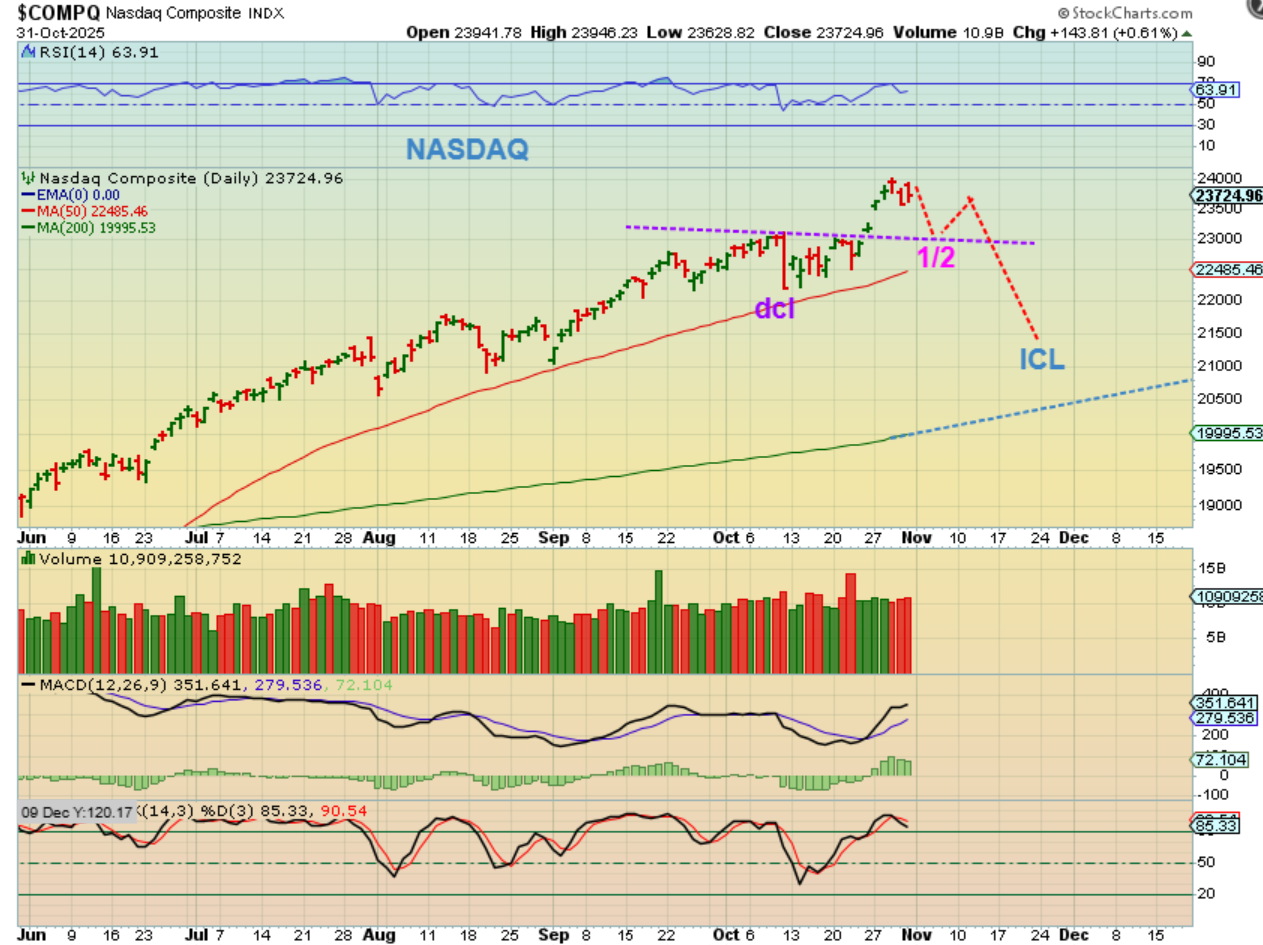
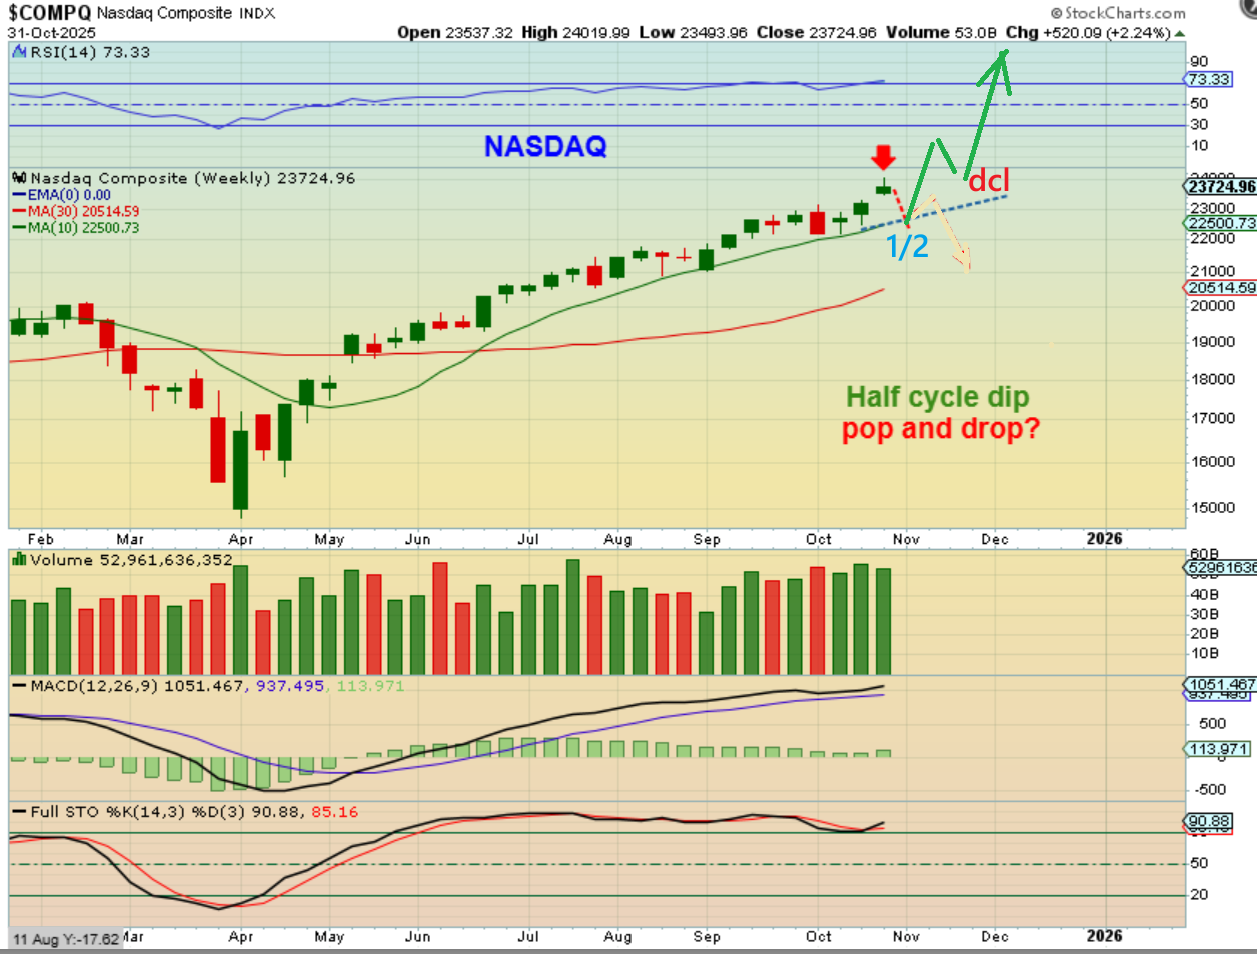
NASDAQ – On a daily chart we have a day 13 peak so far and Friday was day 15. This MIGHT just give us a half cycle dip (back test?) followed by a bounce, and then a drop into a dcl / ICL. In other words, the markets may become choppy/toppy.
.
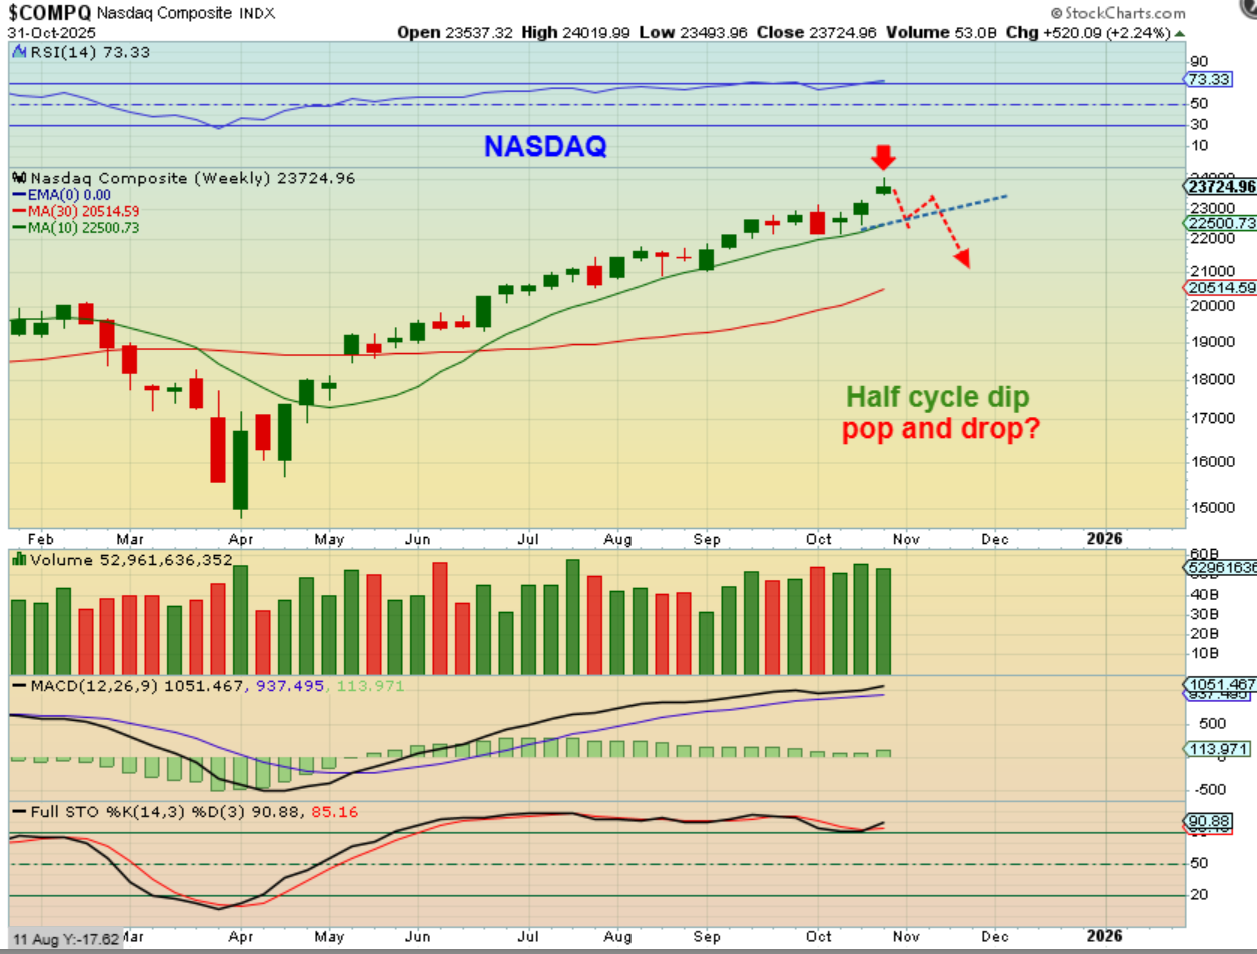
THE NASDAQ WEEKLY could end up something like this. It also has a topping candle. I have also mentioned an outside chance that this just run parabolically higher through Nov into Dec.
.
I have also mentioned an outside chance that this just run parabolically higher through Nov into Dec. That rally would start after the half cycle low, if that were to happen. I tend to think that we’ll get an ICL first, but rallying to new highs again is a bullish move.
.
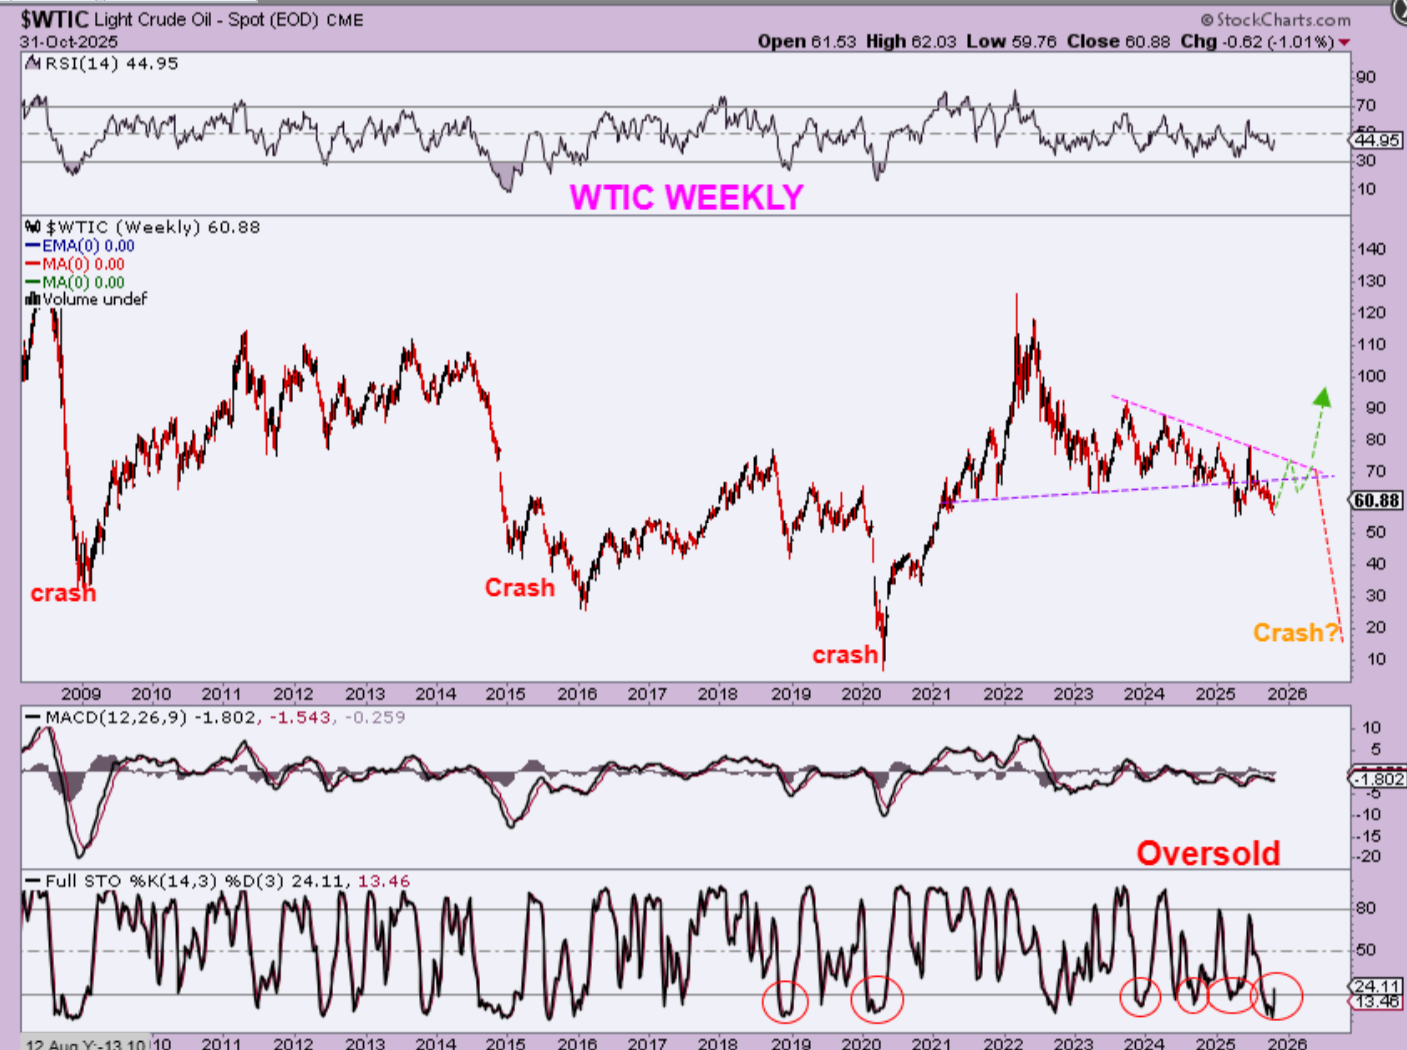
WTIC WEEKLY –
1. I just wanted to go to a really big picture here to show you how, at times, Oil can just completely crash. It was almost every 5 or 6 years and it would crash. The last crash was covid, 5 years ago. I’m showing this because Oil hasn’t shown any real strength since 2022.
2. Currently, however, Oil is very oversold and due for another good-sized bounce. Lately the bounces have been very choppy daily cycles and unproductive. Oil keeps getting rejected at the overhead magenta downtrend line. I just wonder: If that happens as we get closer to the apex, Will we Break out and rally, or might we see Oil do one of those crashes?
.
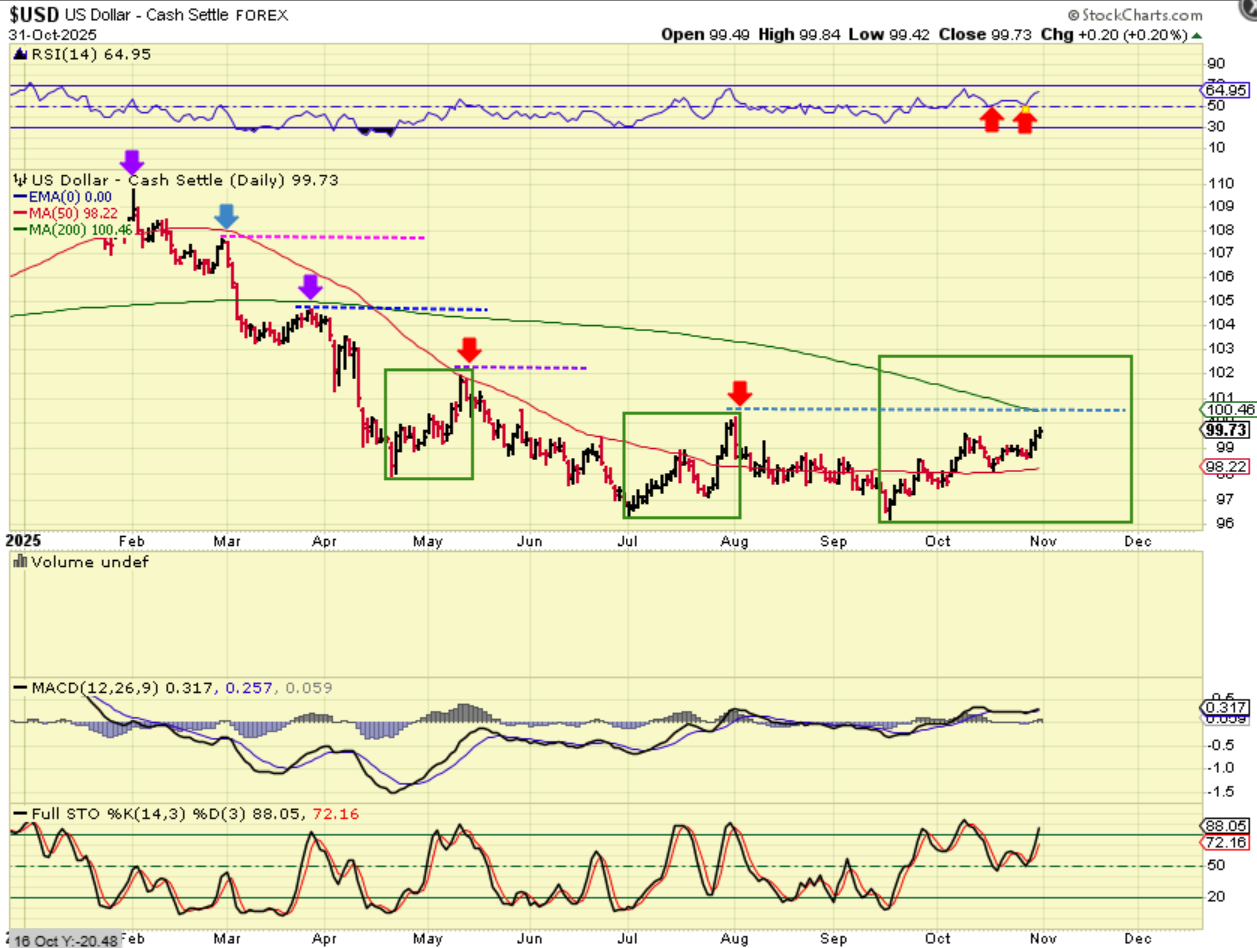
THE USD is strengthening. I have been pointing out a series of lower lows and lower highs and after reversing at the 50sma, it looks like it wants to tag the green 200sma. That may give it the first higher high.
.
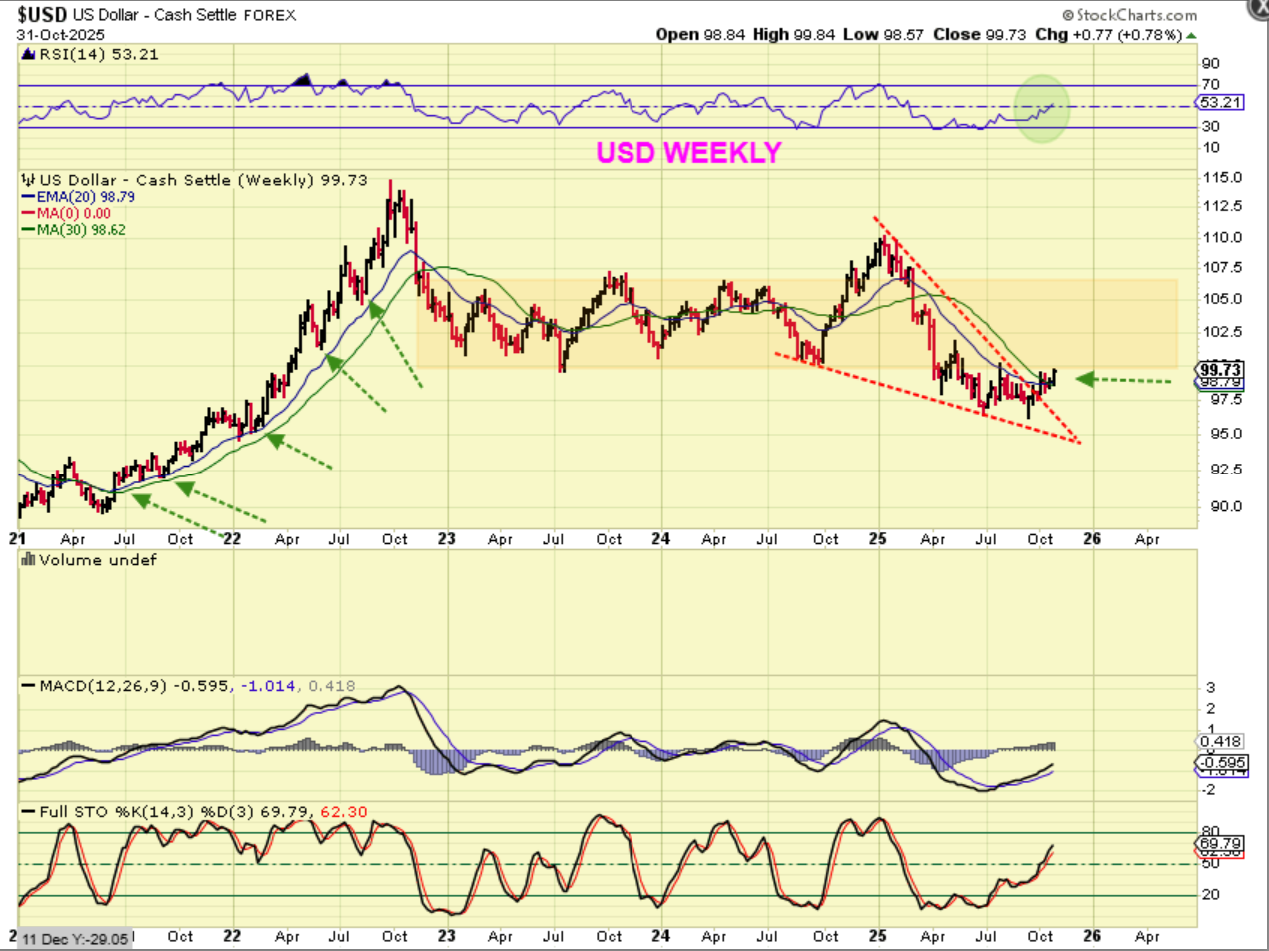
THE WEEKLY USD is now above the 20 & 30 weekly ma’s. That was resistance after the breakdown in 2025. The RSI has crossed the 50% line, and the stochastics is not overbought. This means that the USD is gaining strength. So the big question is this: …
.
The USD is gaining strength.
So the big question is this: Will the ‘bottom’ in the USD give us the ‘peak’ in Golds run? That is a possibility. As you can see,
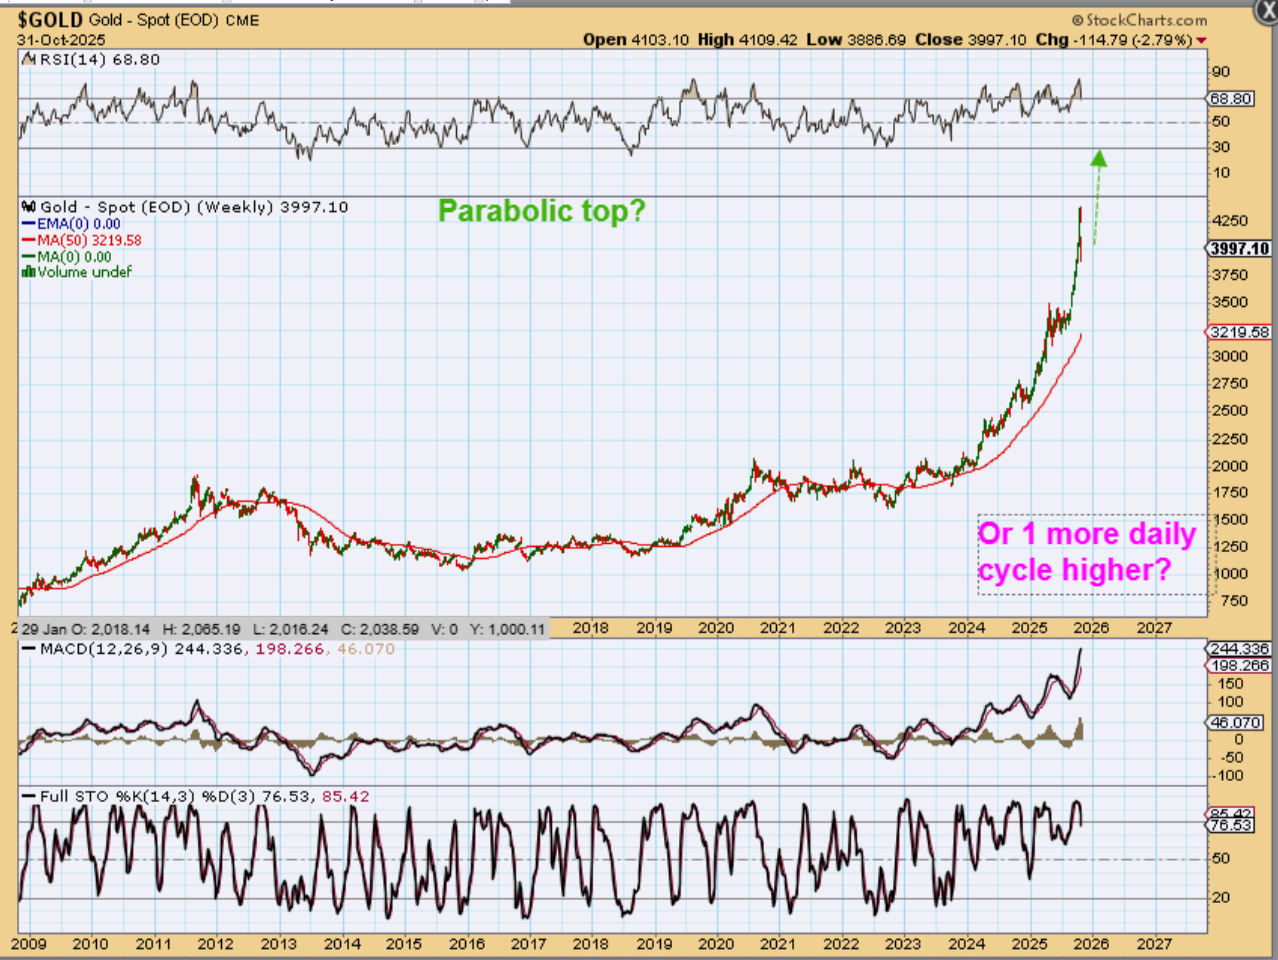
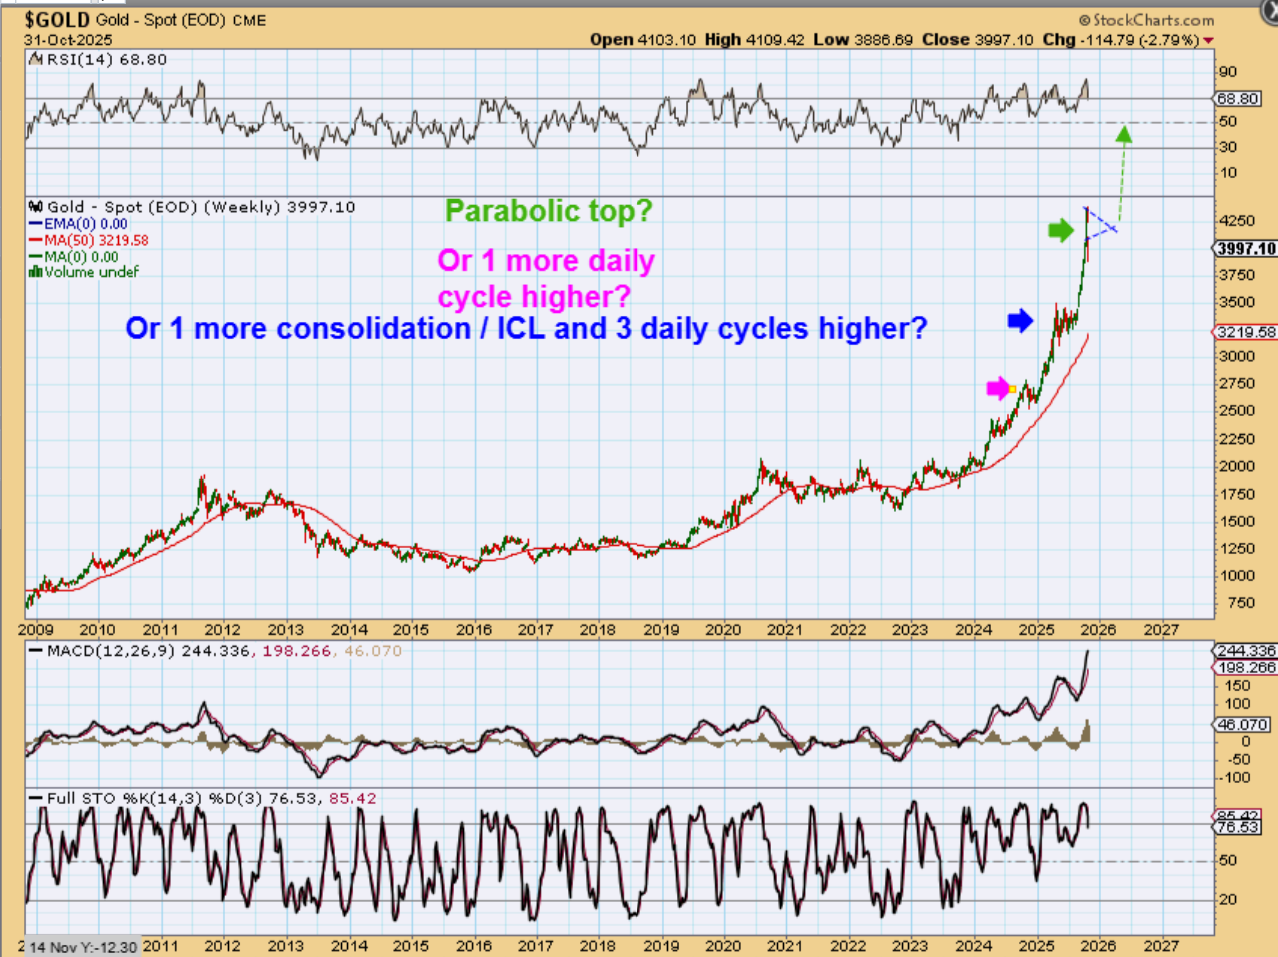
GOLD has that ‘straight up parabolic top’ look to it. This might be the top for now, if the USD gains strength, but I’ll also discuss the possibility of one more run higher for Gold.
.
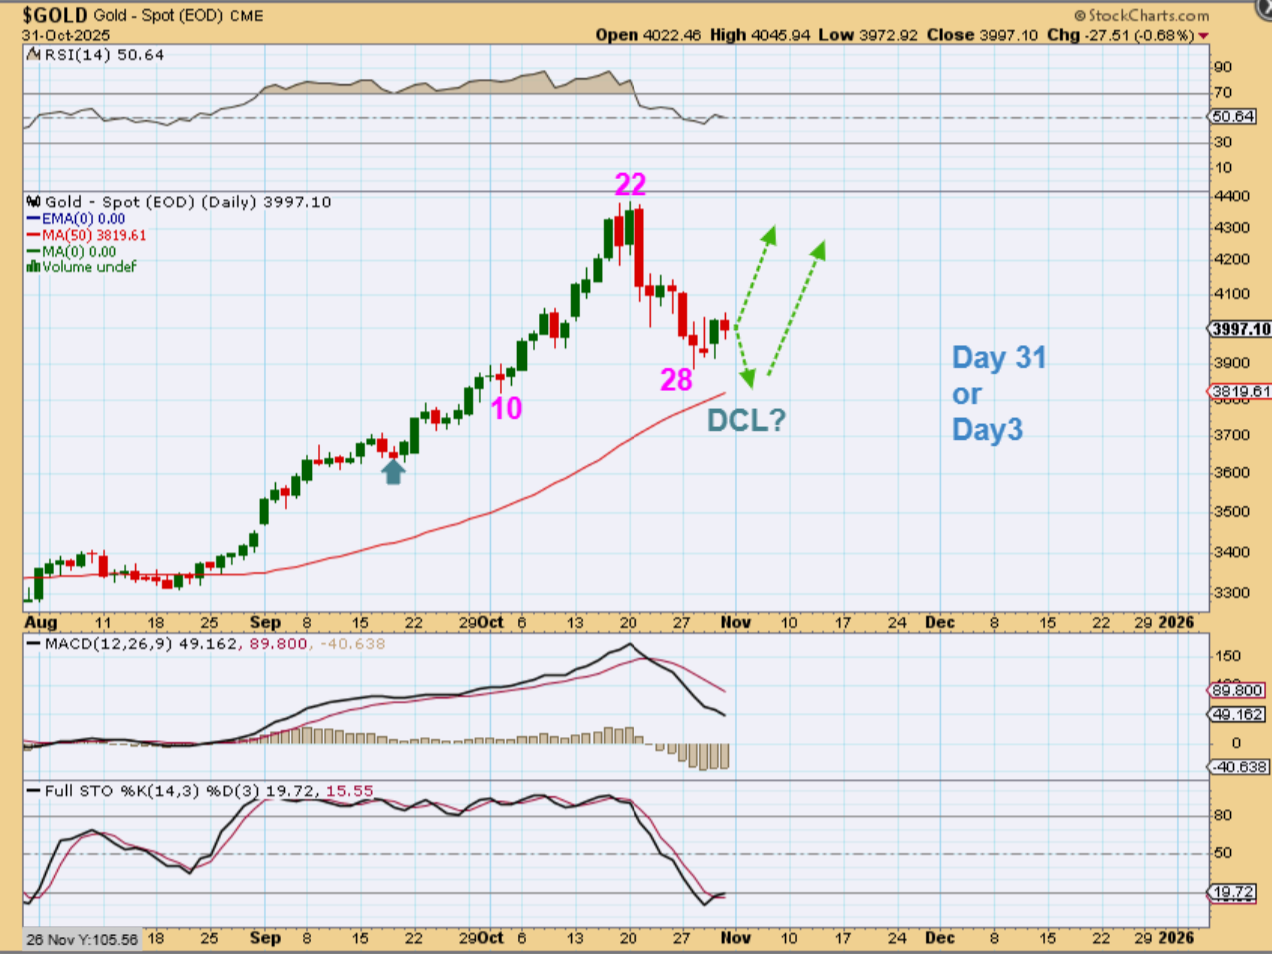
GOLD has a day 28 low right now that might be a dcl. It gives us an a-b-c drop, but 1 more drop is also possible. When that dcl is in place, you can see that price running to a new high is not out of the question, so we may get another run to new highs. The recent run was to $4400, could Gold run to $5000 and top? We’ll see. Gold is very oversold.
.
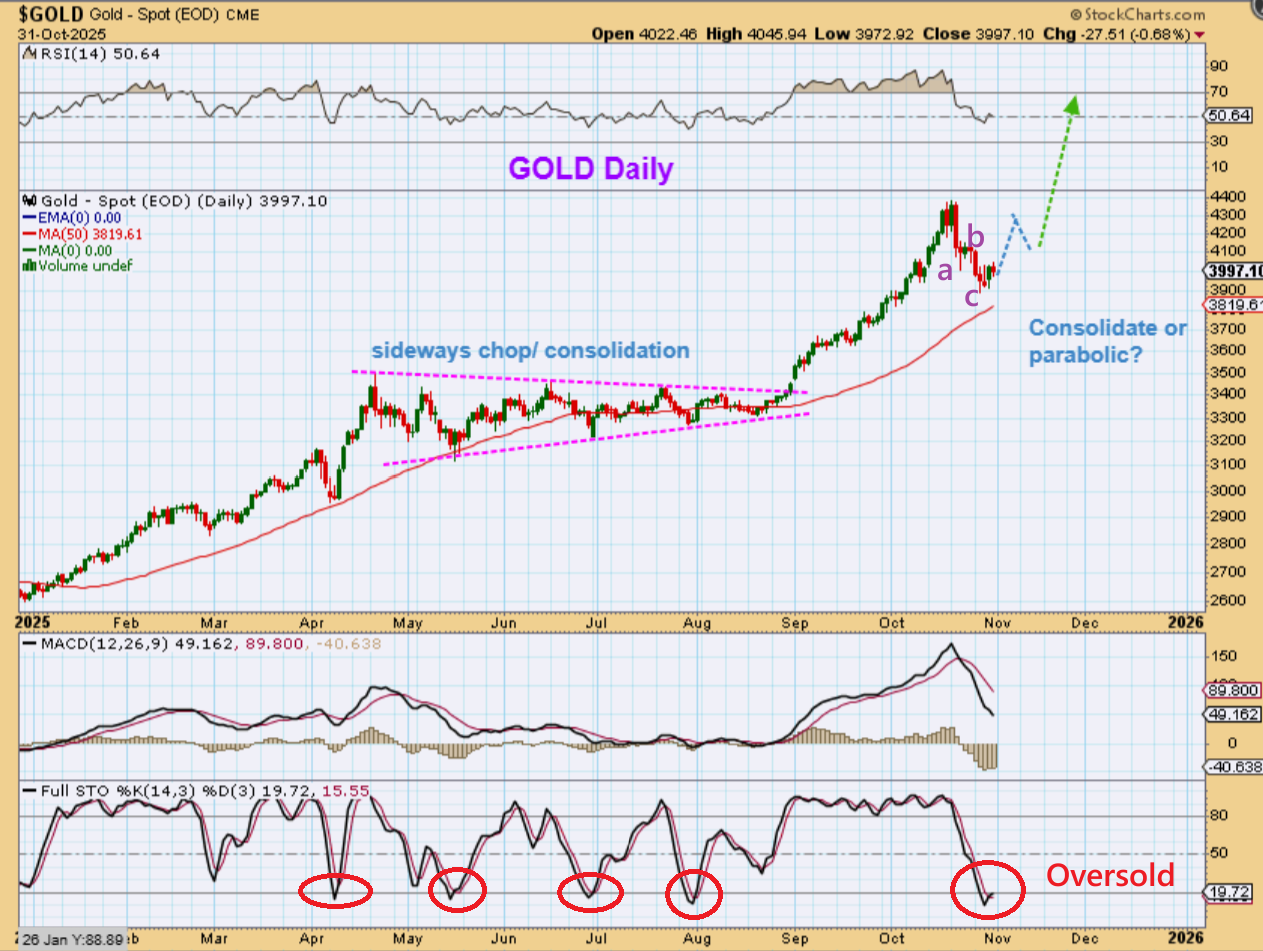
GOLD has an a-b-c down and is quite oversold. Could that be an ICL drop? I doubt it, but if it was Gold could really run higher with time on its side. Even if that is just a dcl drop, the rally out of that drop could get Gold to $5000. If the USD bottomed and moves higher, Gold may just chop higher with a double top.
.
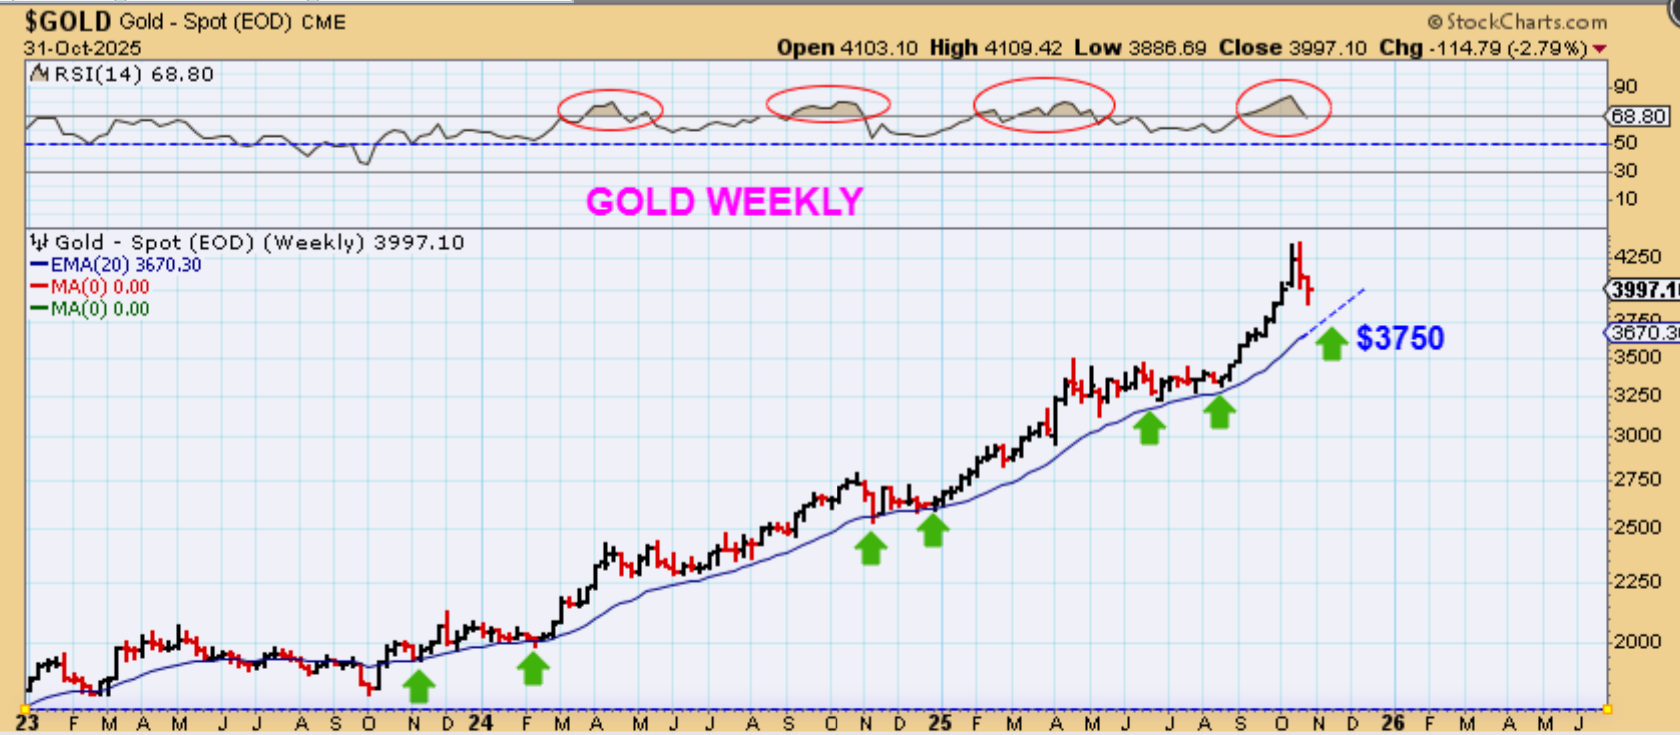
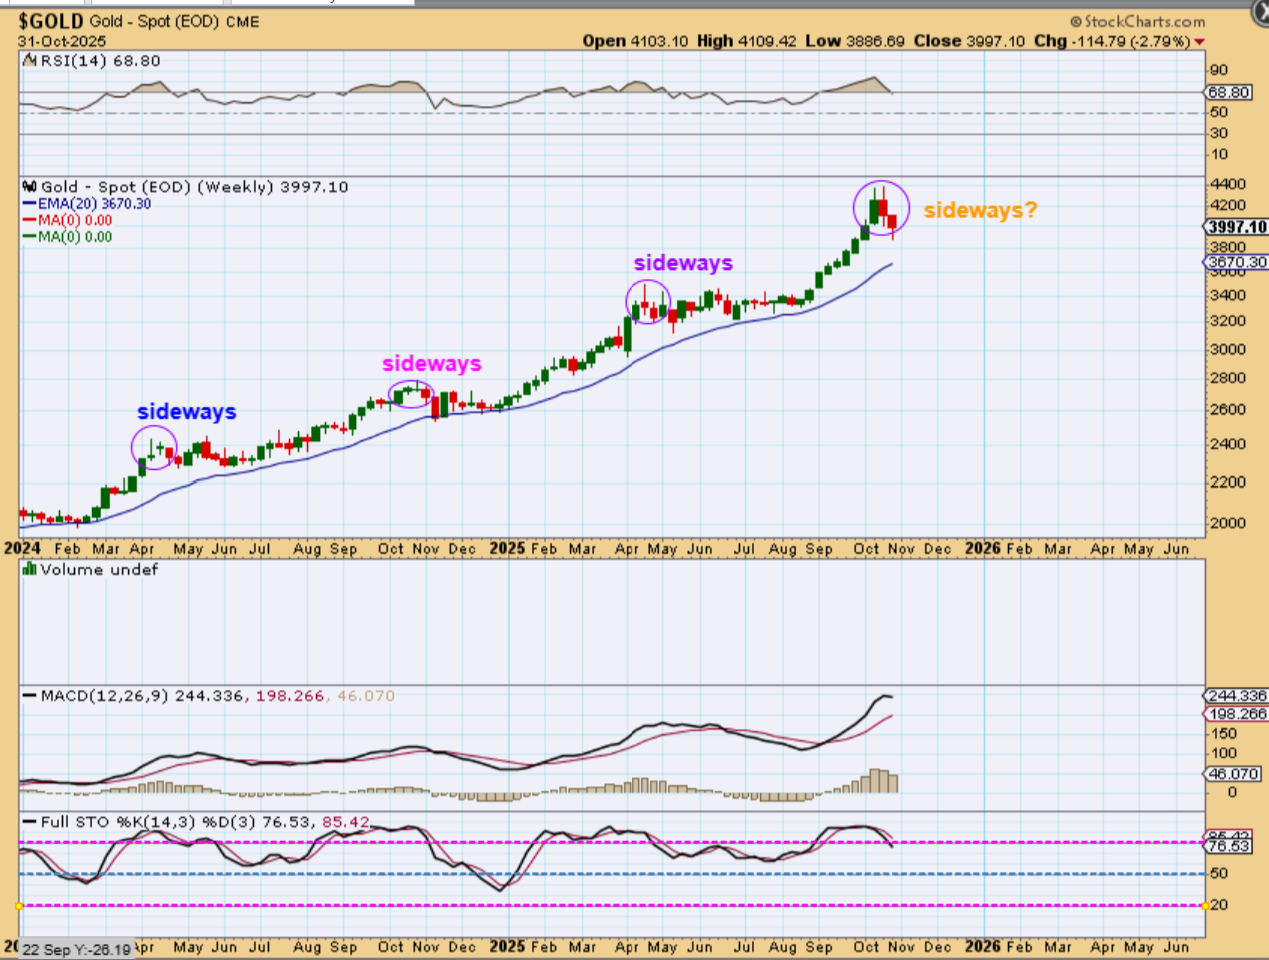
GOLD WEEKLY – This also looks like Gold has peaked or may run up and double top, but we’ll have to wait and see. Recent rallies have dipped and consolidated along that blue 20 ema. In fact…
.
One thing to take note of is how long Gold has respected that blue 20 week ema. Even at ICLs and sideways consolidations, it has been riding that line. It has not CLOSED below it for 2 years. If we see Gold close below that line, I’d say that for sure-the party is over.
.
GOLD WEEKLY CANDLESTICK has what is often topping candles too. The bull run has given us new peaks and then moved sideways with the following consolidations, rather than steeper drops.
.
Again, taking a step back, you can really see that even GOLDs WEEKLY CHART looks like a parabolic low off top.
.
Can GOLD chop sideways one more time and then give us a final run higher? We can’t rule out another triangle consolidation like we had in 2025, but having such good gains from the recent 2 year rally does call for locking in some gains. This rally may have peaked.
.
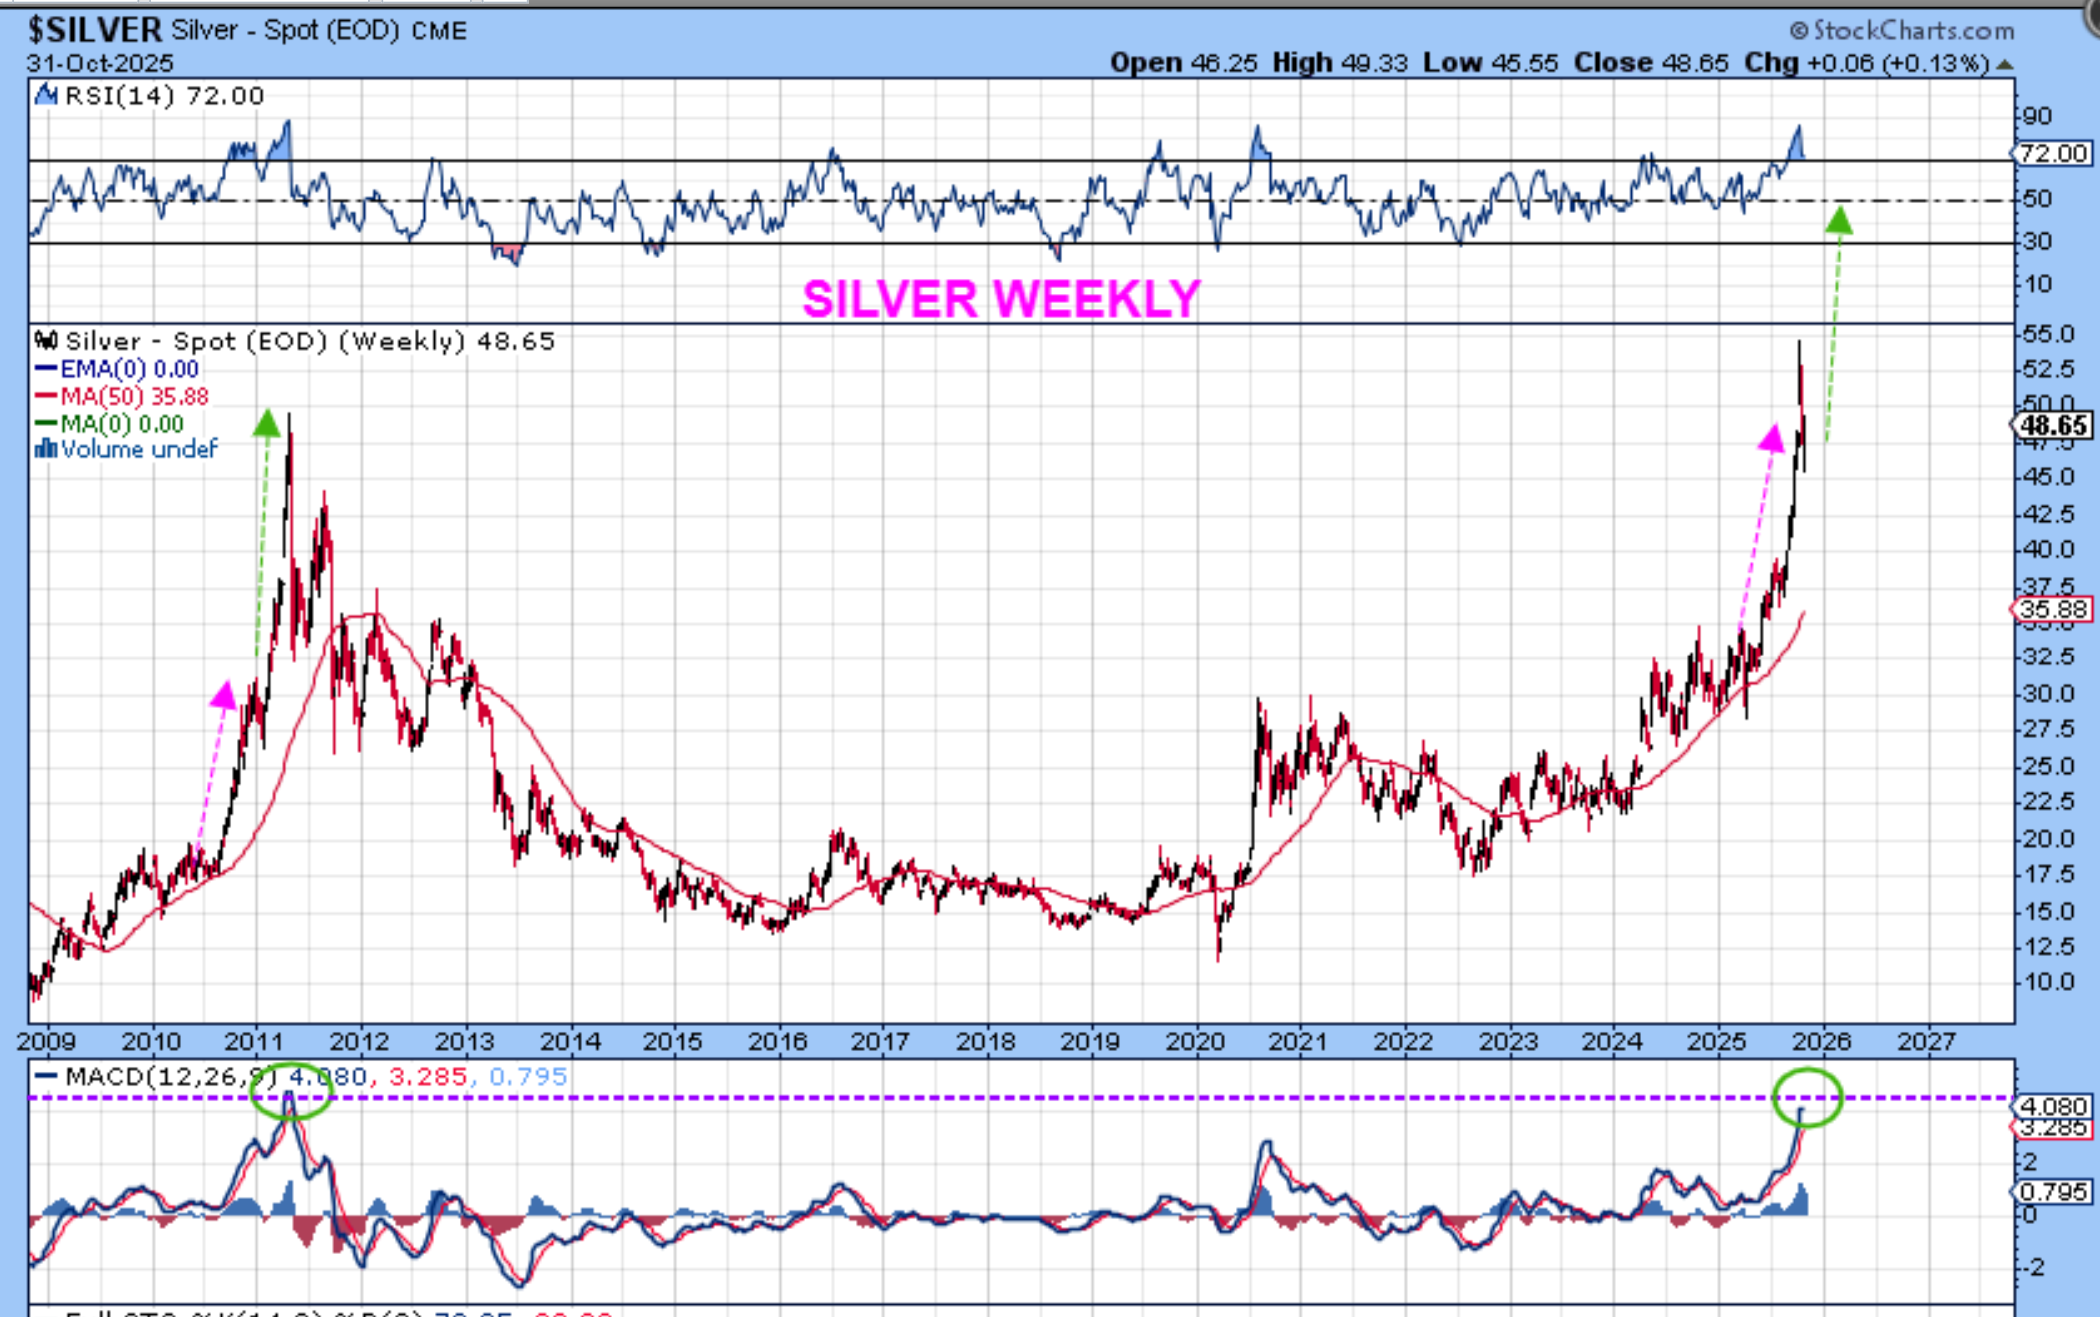
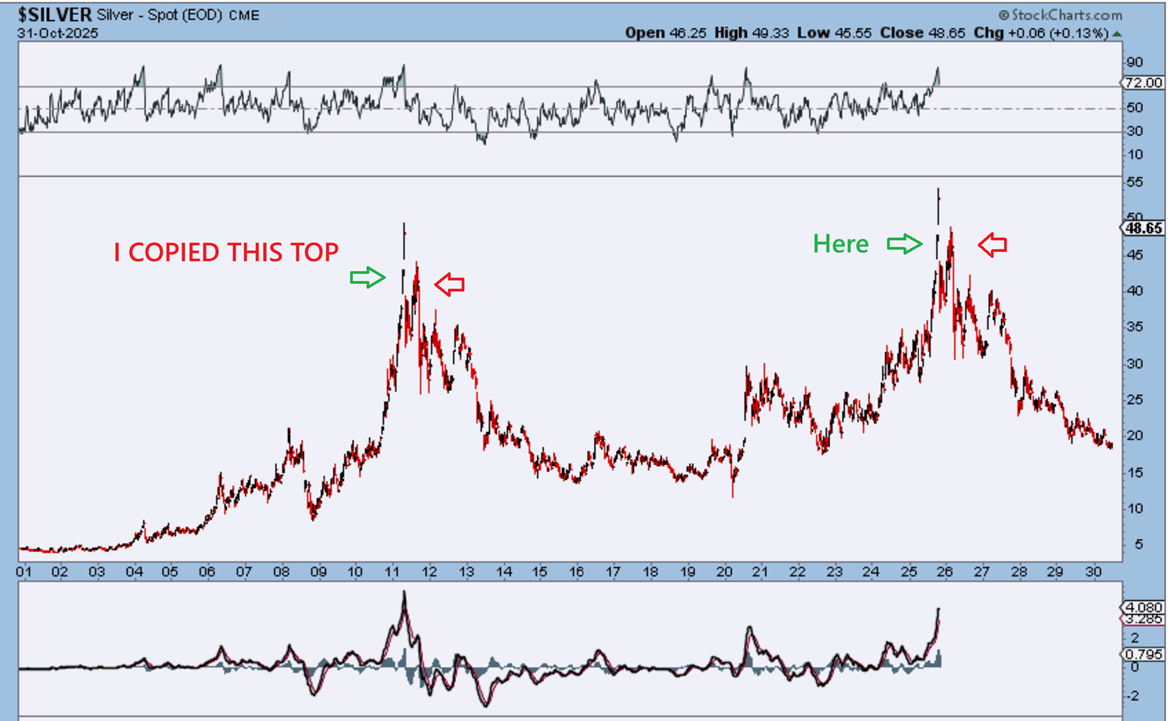
SILVER is parabolic looking too, but maybe not quite as much as the 2011 run. That 2010-2011 rally had a strong run (magenta arrow), a quick sharp dip, and then a 2nd leg up. This current run has a sharp rally up and a sharp drop right now. We’ll see if it can run again.
.
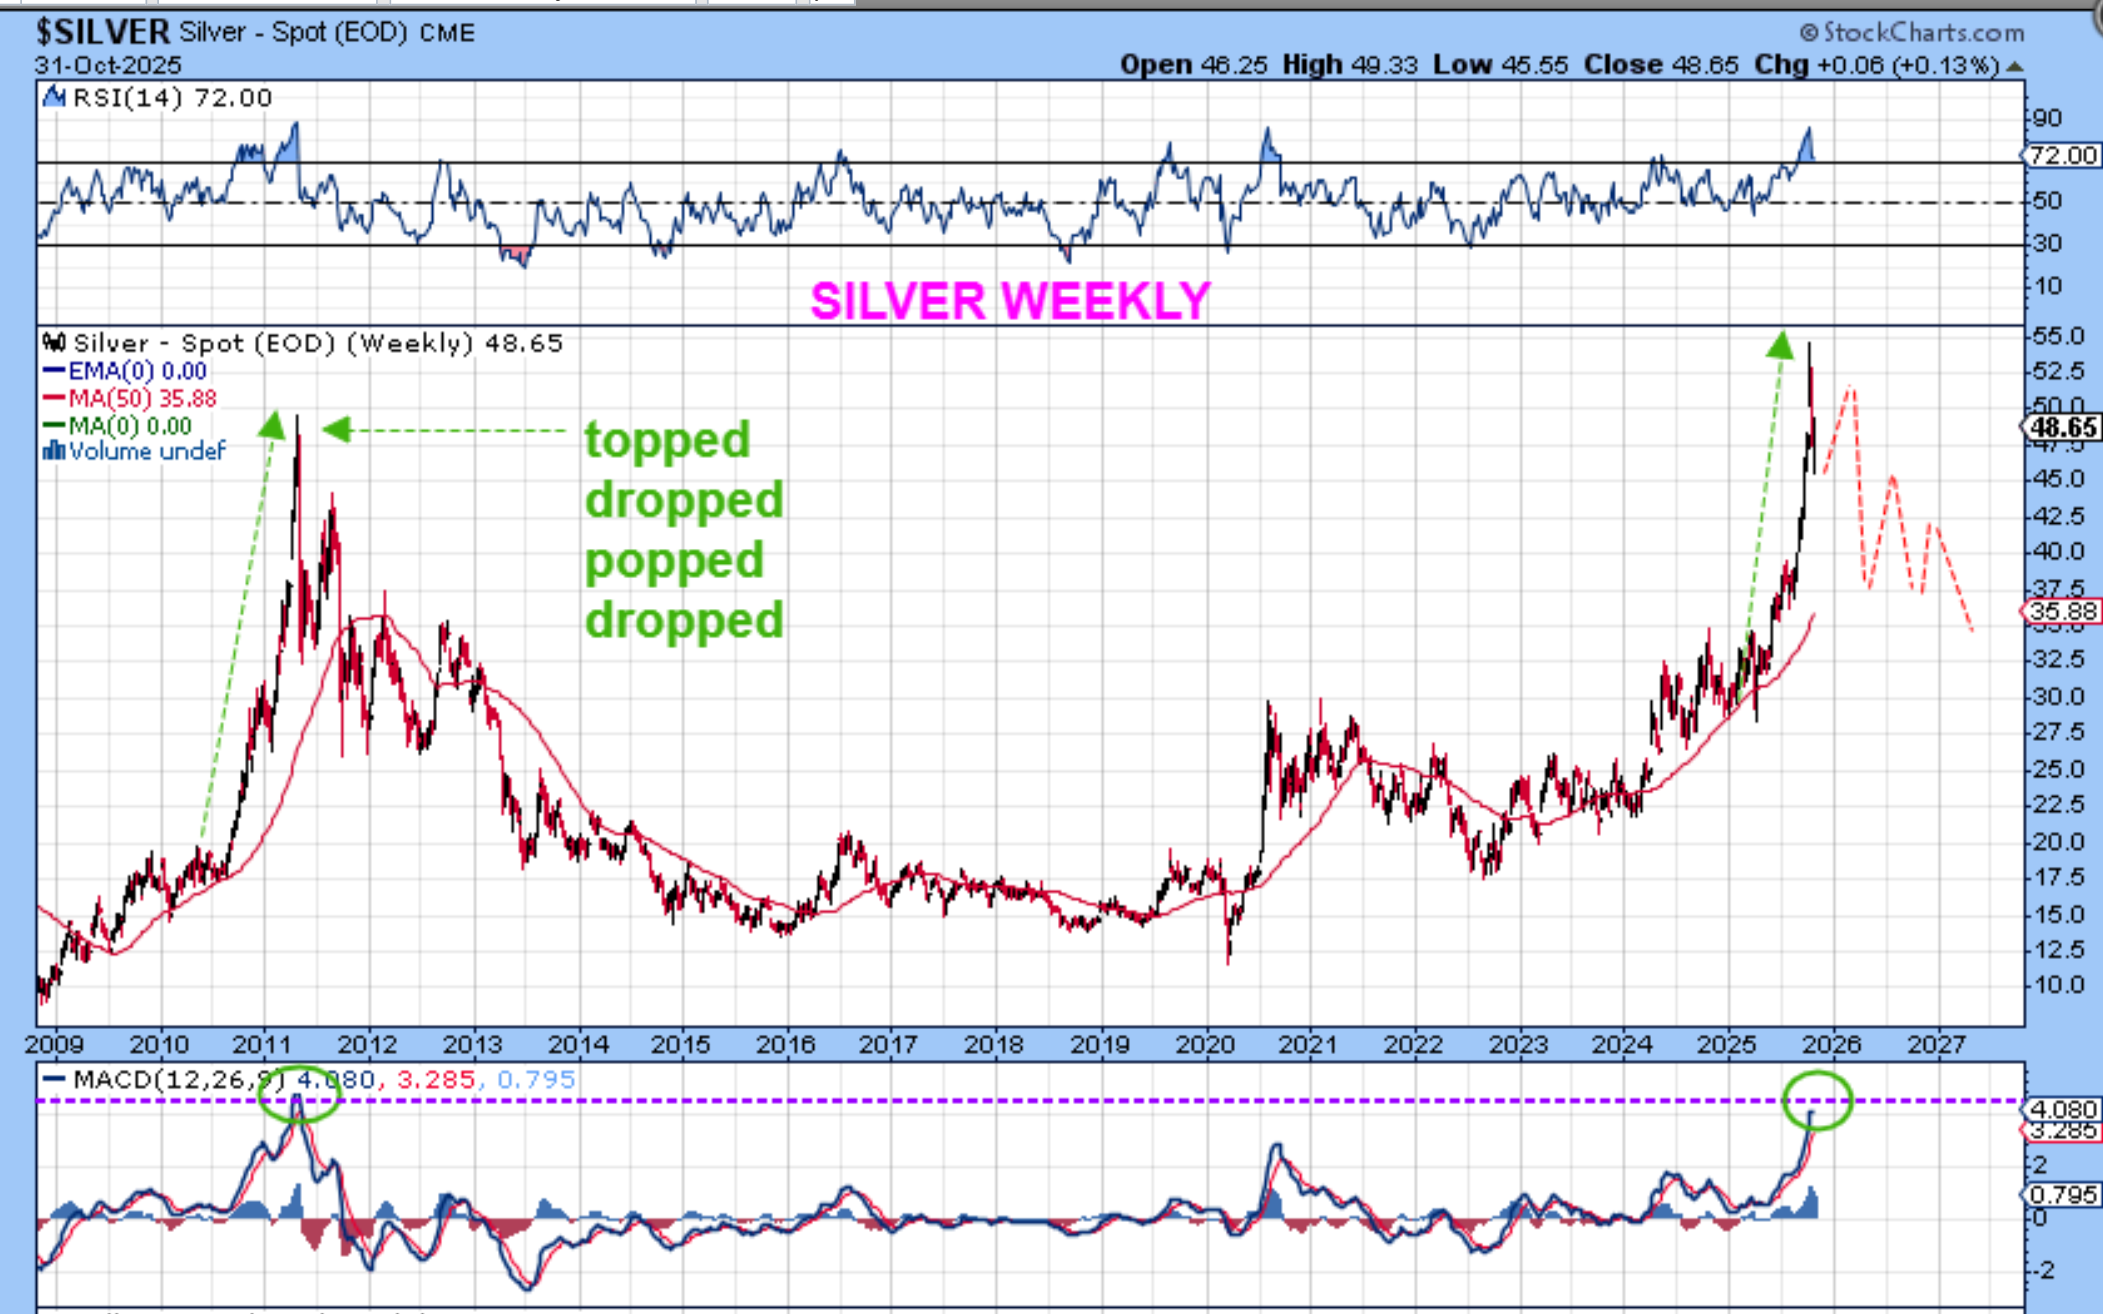
When SILVER ‘peaked’ and dropped in 2011, it did rally up toward the highs again, but it chopped higher and then sold off with a lower high, clearly indicating that it had peaked. We could do that with our current dcl in place too, so I wanted to point that out.
.
SILVER – This is an example of how that might look a couple of years from now.
.
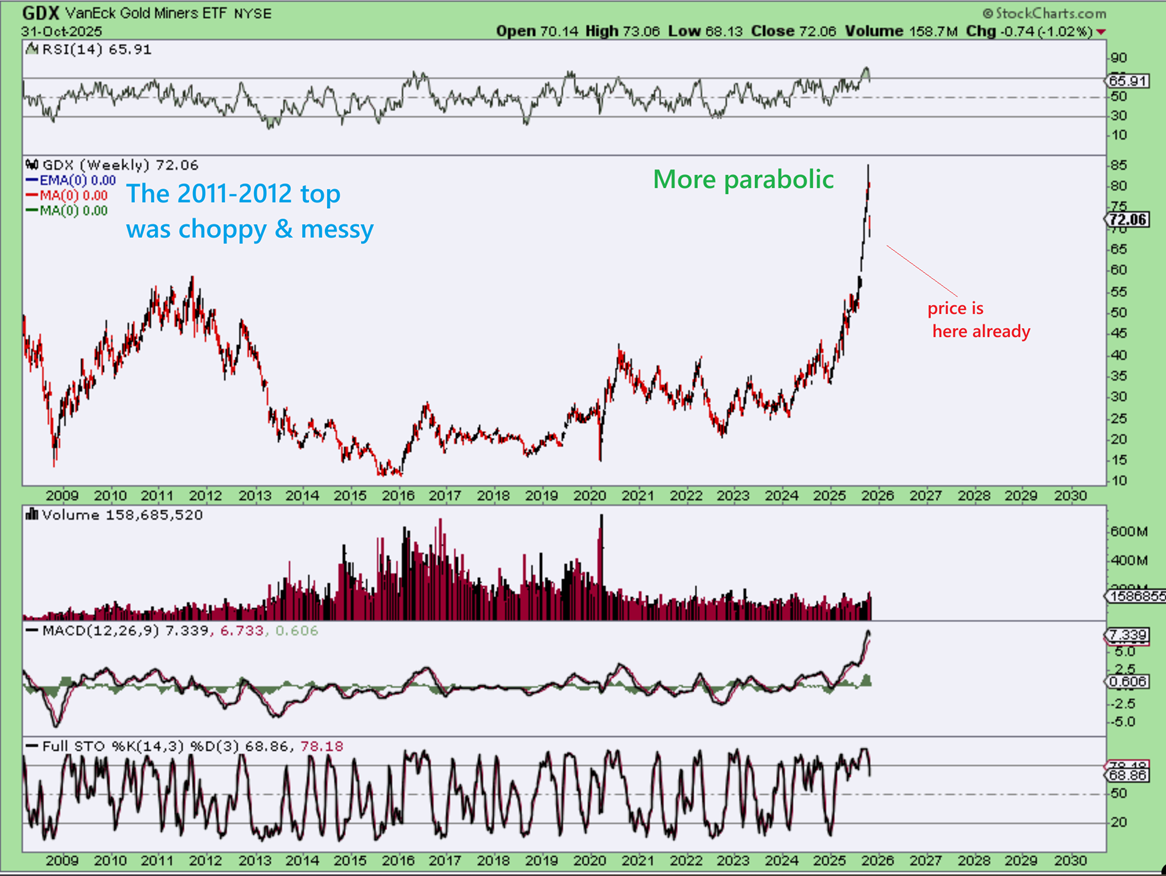
IS THE RUN OVER?
The Miners didn’t do a blow off top in 2011. Instead, they chopped around at the top and finally sold off again. Look at the current rally. The price dropped fast. We are due for a dcl, so the next bounce will either be a final run higher or a bounce to a lower high. If you didn’t sell some miners near the top, and you didn’t like that recent drop? You will want to sell somewhere on the bounce out of this dcl.
.
The General Markets are near the highs, but a dip into an ICL could start when the next dcl comes due. We may just be at a half cycle dip now, and we could move higher next week. The Precious Metals already sold off, they are oversold, and a dcl is due. The recent low s day 28 and day 29, so next week we should start to bounce, and we can watch things as it unfolds, looking for signs of weakness or strength. Bitcoin is below. Enjoy your weekend everyone!
.
~ALEX
.
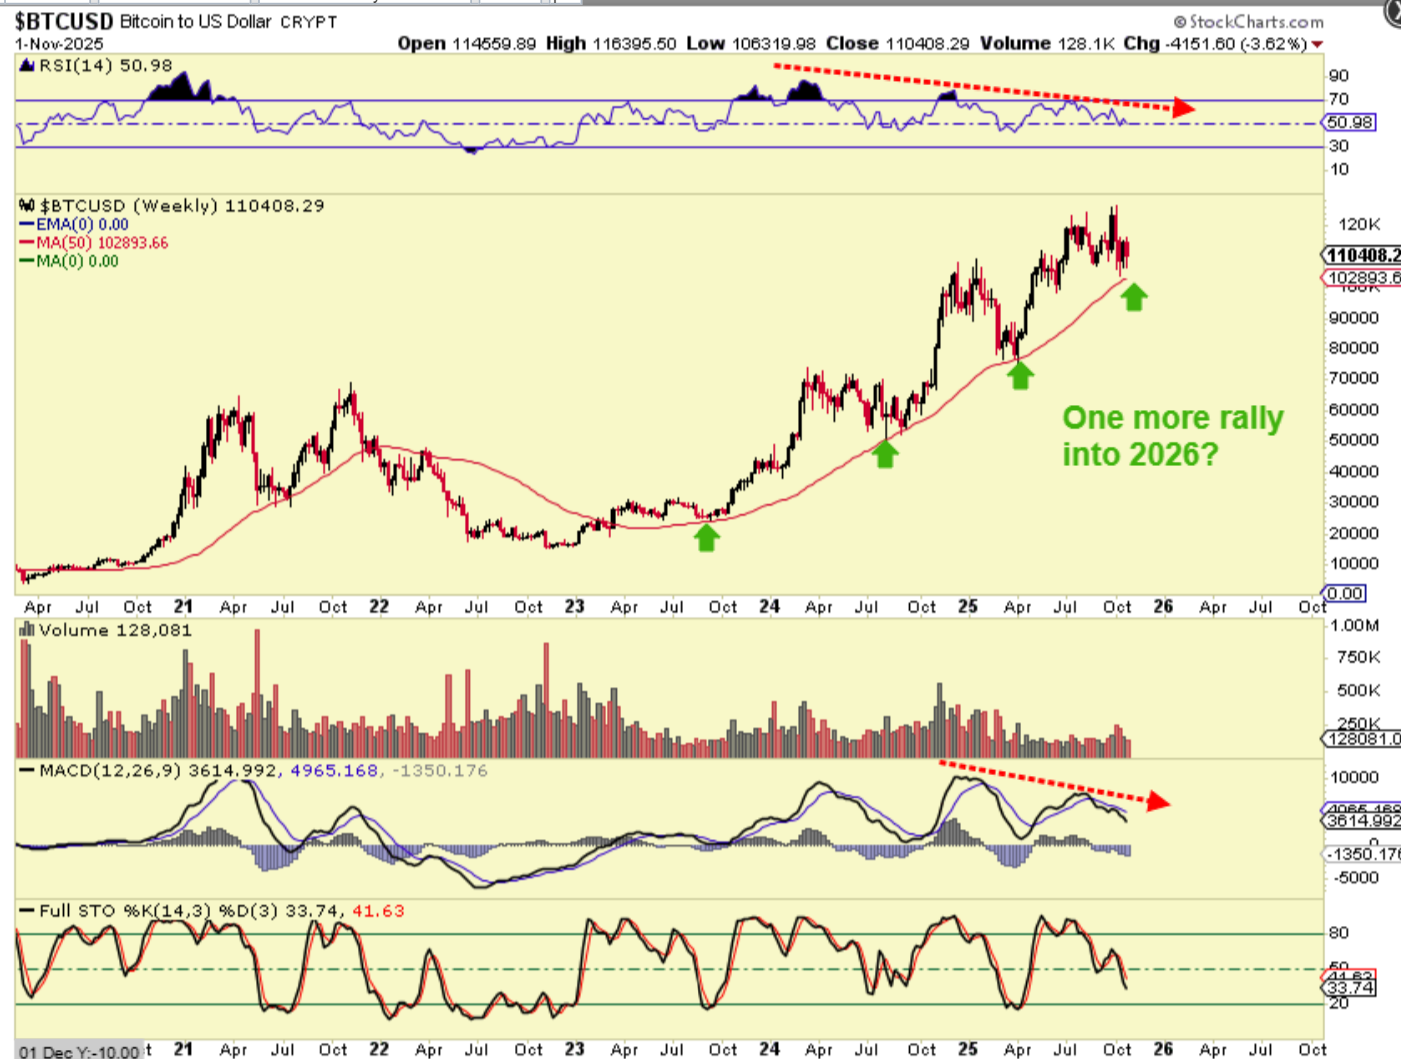
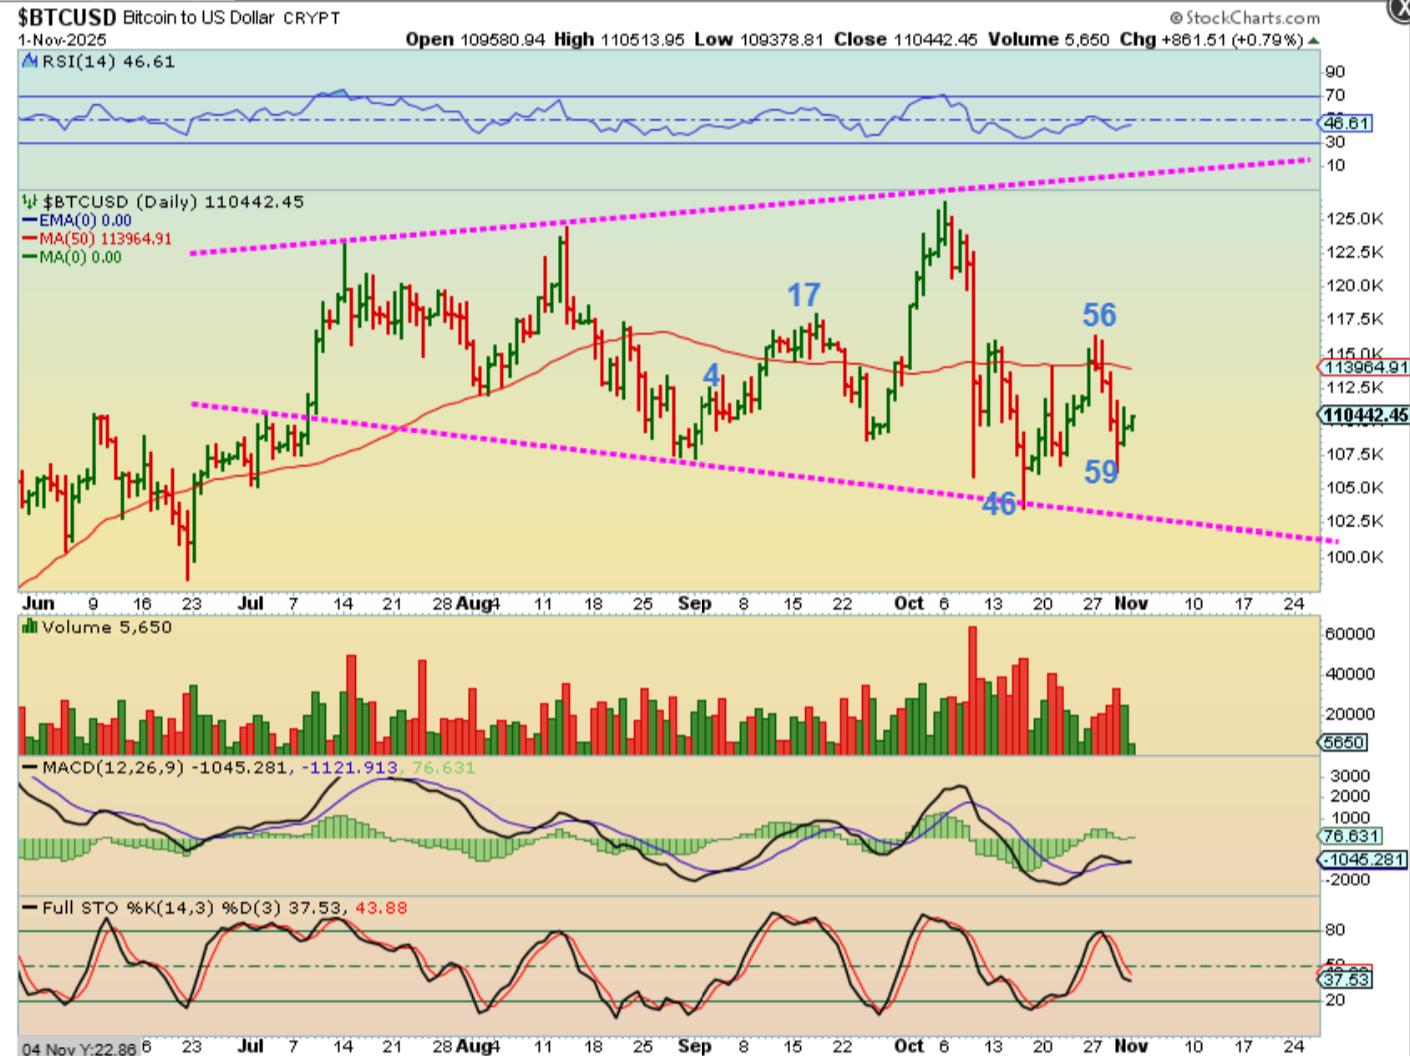
BITCOIN – Saturday should be day 61, and I have expected a drop to a lower low below day 46, since we often get the lowest low around day 60. Day 46 low just seems way too early, but so far Bitcoin should be weak, and it has shown some strength. The MACD and crypto stocks look good too.
.
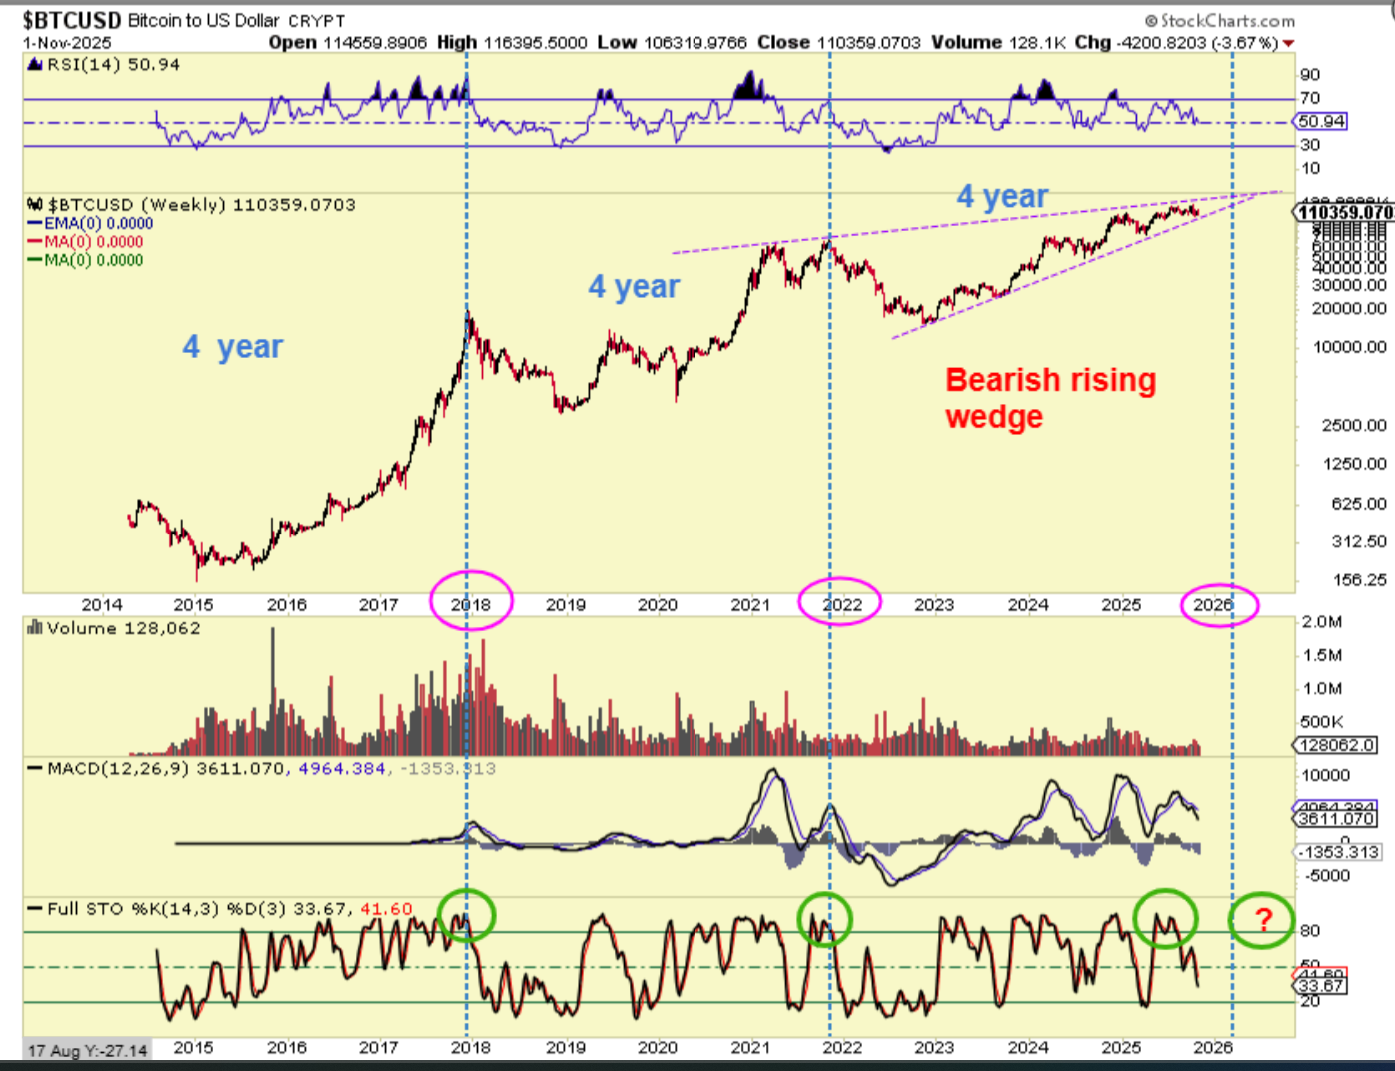
BITCOIN 4 year cycle- Bitcoin always seems to sell off hard in the 4th year of its cycle, so I have drawn ‘peaks’ every 4 years too. Each peak was actually around the end of the year, so do we have 1 more run higher? It looks like we should and since a low is due right now, we may be ready for a final run to a bitcoin peak. And THAT looks like a bearish rising wedge too.
.
THE BITCOIN WEEKLY has also been bouncing higher right around the 50 week ma over the past couple of years. We are at that point here now too. I cannot ignore the divergence in the RSI & MACD as we make new highs. A break to a new high will eventually be a sell for the 3rd year peak of a 4 year cycles high.