Tuesday October 14th – Volatility
.
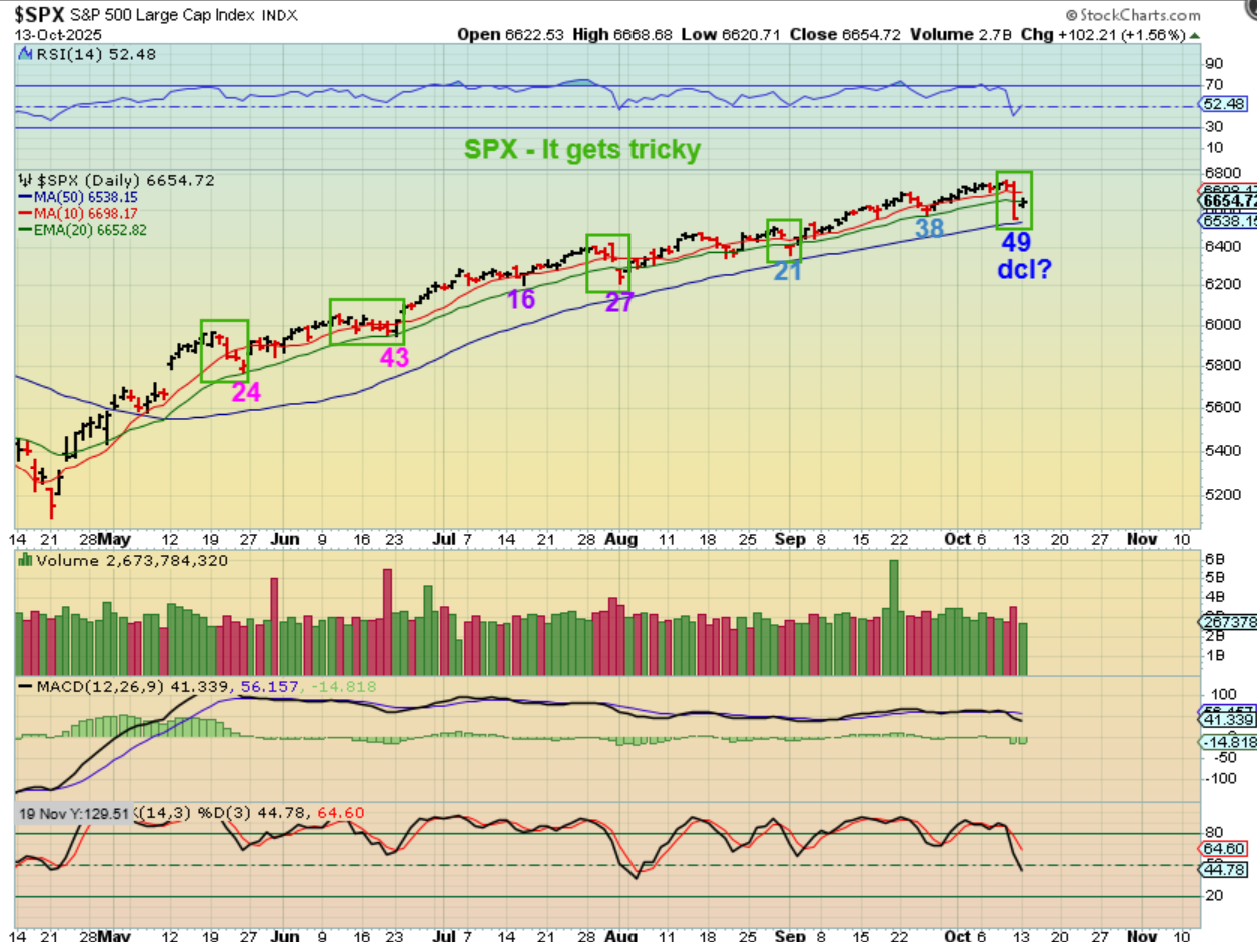
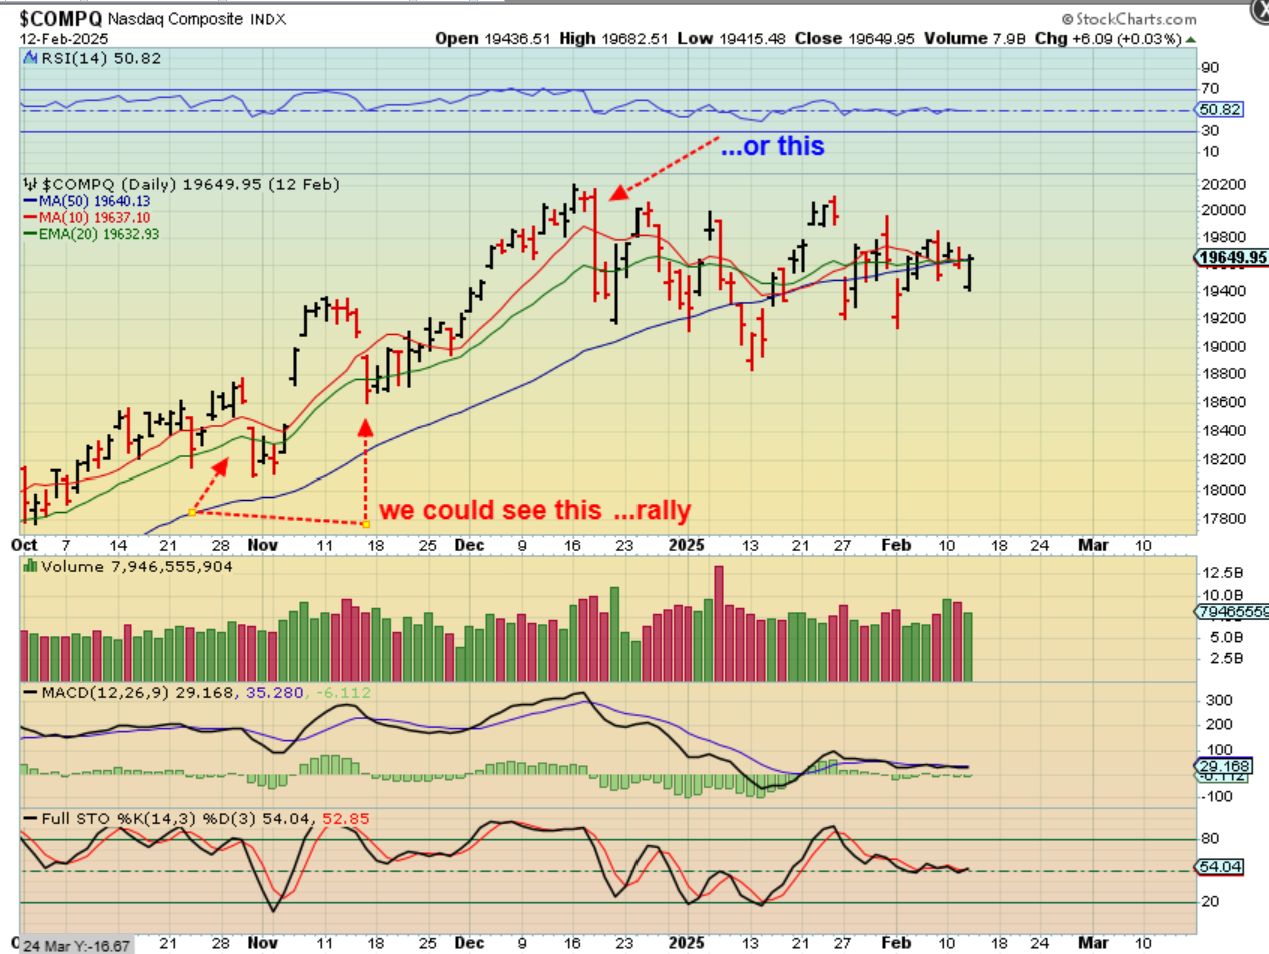
SPX -Let me remind you of the difficulty that has developed with our current Bull Market set up: All of the dips were basically mild 2 or 3 day dips. THAT is mild. We identify DCLs when they bend the 10sma downward, but we really haven’t seen that, so dcl’s are hard to identify…
1. It appears that we have 2 long daily cycles above 40 days, and one near 30 days.
2. That stretched us to 6 months of time and USUALLY an Intermediate cycle starts to dip lower descending into an ICL around month 6.
3. We are in Month 6 right now though, so is this a final daily cycle that will ‘peak’ as L.T. and then start to drop. It seems that way ‘time-wise’.
.
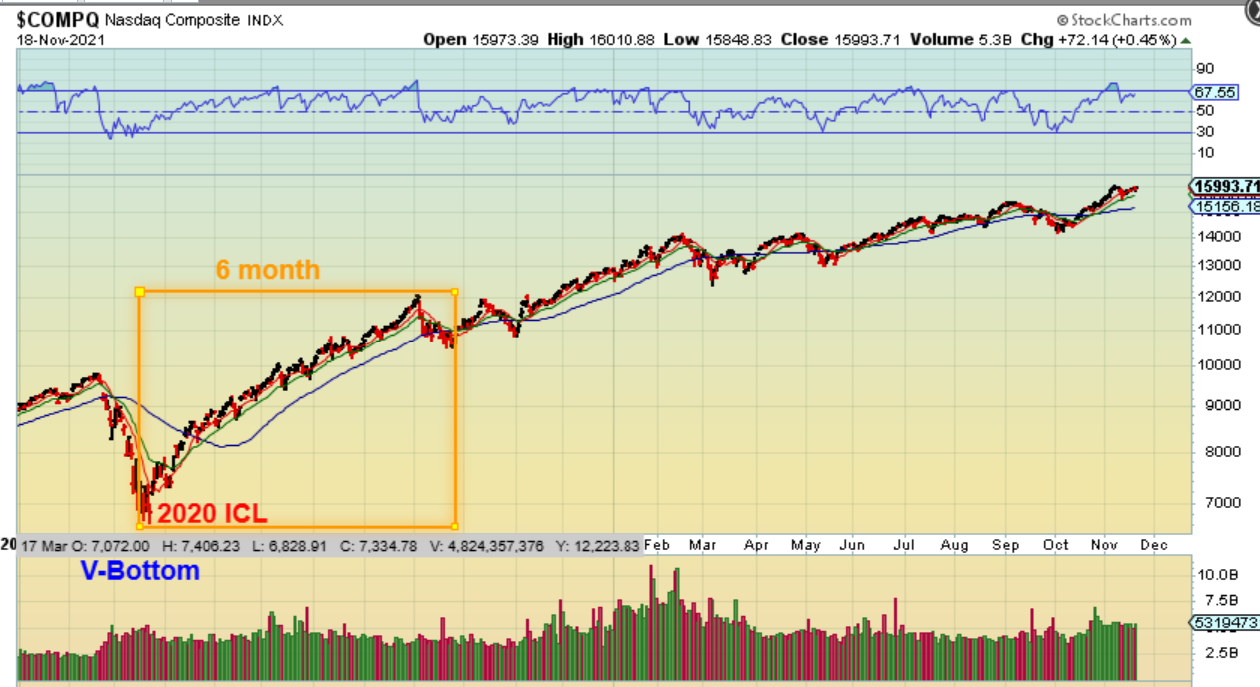
NASDAQ – So at 6 months, the very strong bull market of 2020 (Covid) surged upward, peaked, and dropped in a choppy a-b-c down ICL. After that, it was a return to the bull run.
.
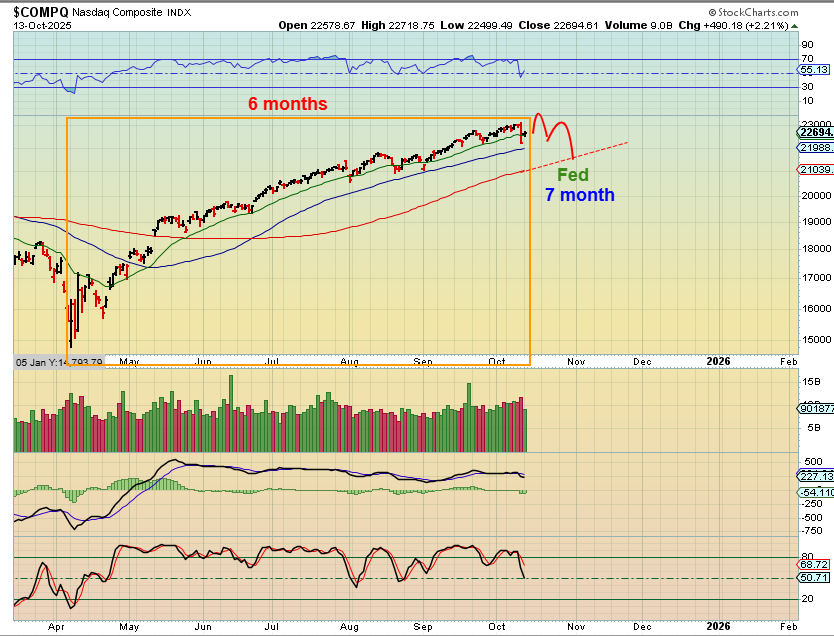
Right now, the very strong Bull run in the NASDAQ is at 6 months without that visible ICL drop, so I still just have to expect that we will see one, since even strong bull markets do. I have been guessing that it could be around the time of the Fed mtg giving us a 7-month intermediate cycle, but we’ll continue to wait and see.
.
So now I just wanted to take a peak at The NASDAQ with those 1 day slam downs. What Followed?
Usually at least a bounce higher as seen during the week following the 3 red arrows. Now one more time back to our current chart…
.
Now one more time back to our current chart.
Is that a dcl or not. The problem is that even with a bounce, as mentioned above, we identify a dcl more clearly with a swing low and a close above the 10sma. We would almost have to break to new all-time highs before that will happen, so for now I played the bounce and MANY stocks seemed to be findign buying and possibly ‘short covering’, after Fridays plunge. Many of our favorite stocks like BBAI were up 20+%. Amazing.
.
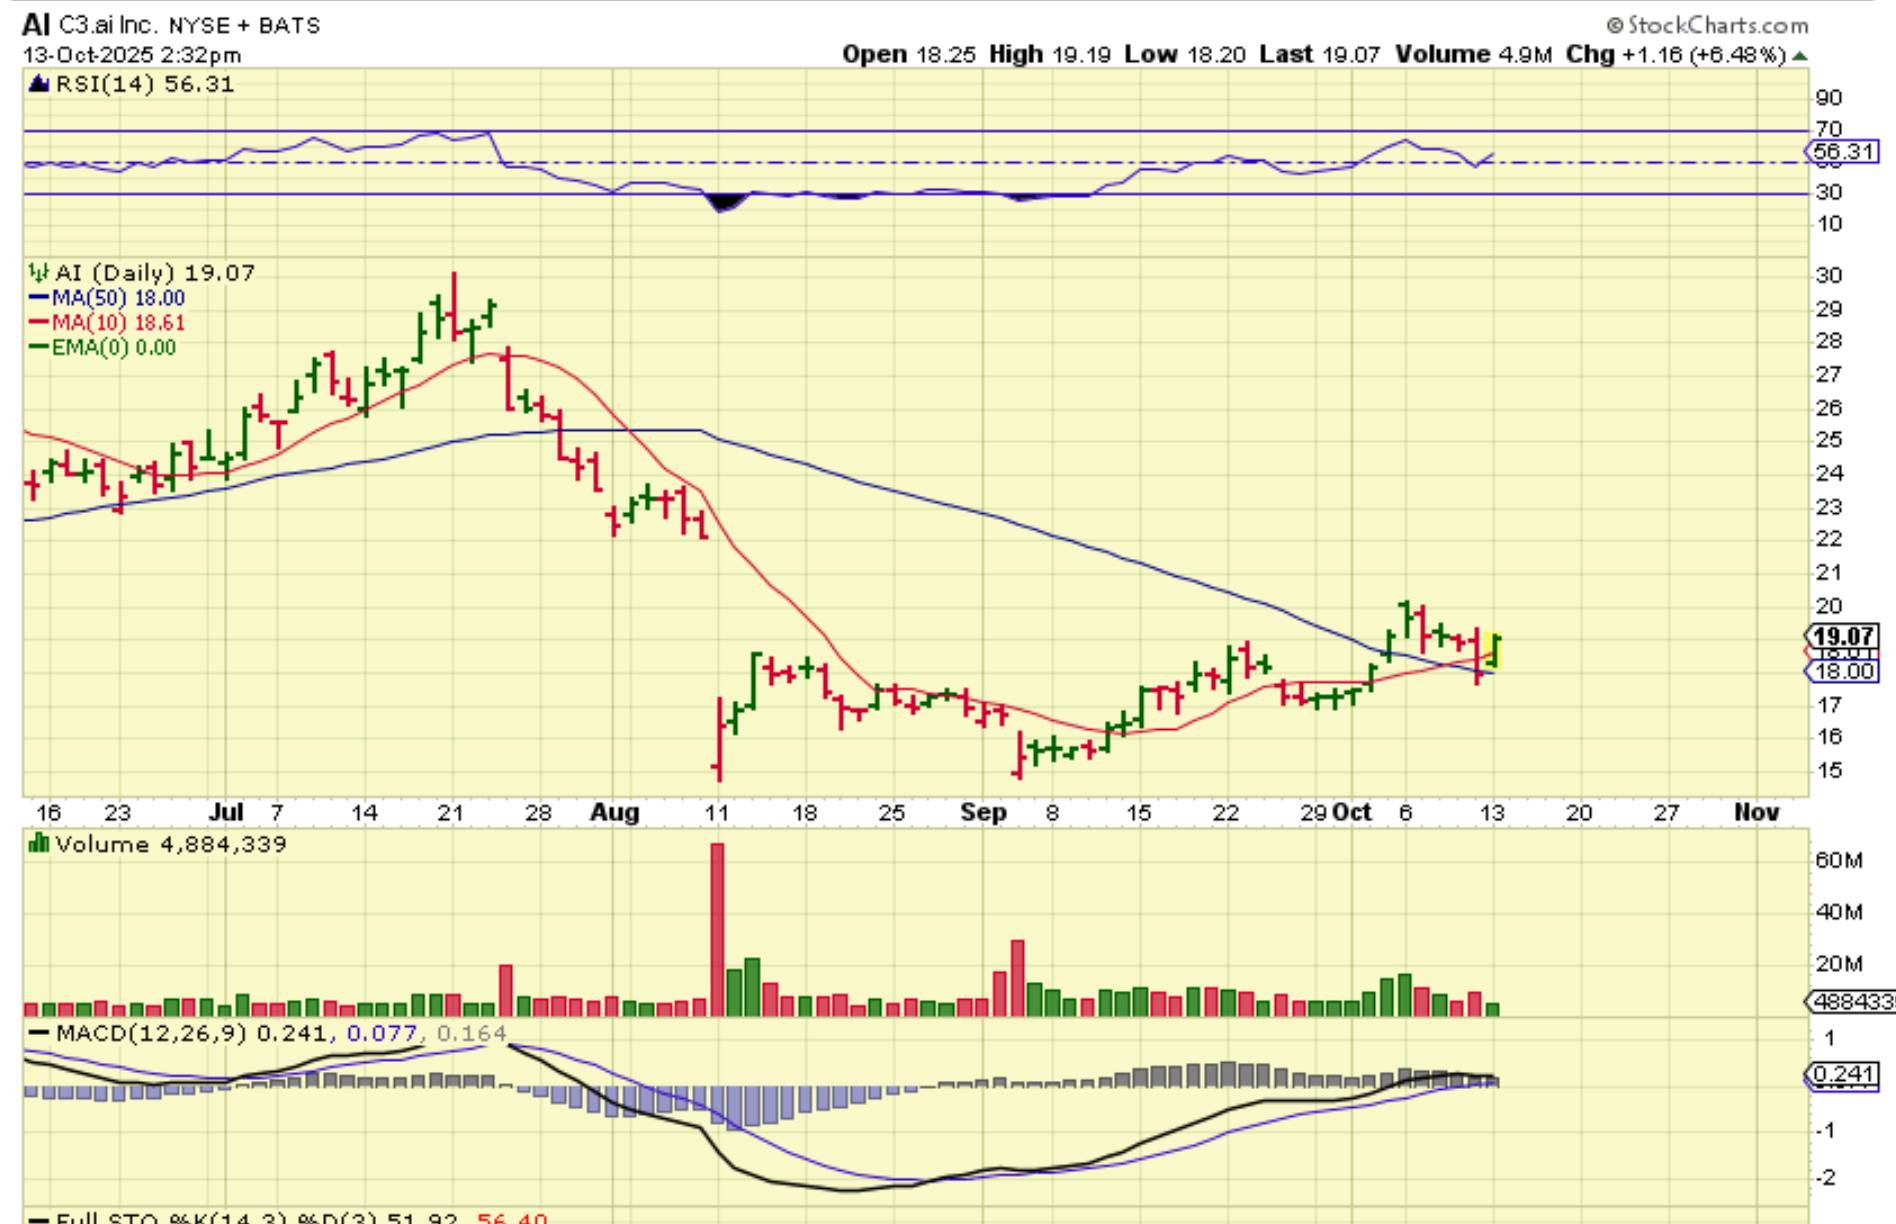
BBAI started to run and was up over 20%, so I looked at my AI watch list of SES, PONY, etc, and saw ‘AI’ as a lagger that could be bought reversing at support, and posted this in the comments.
.
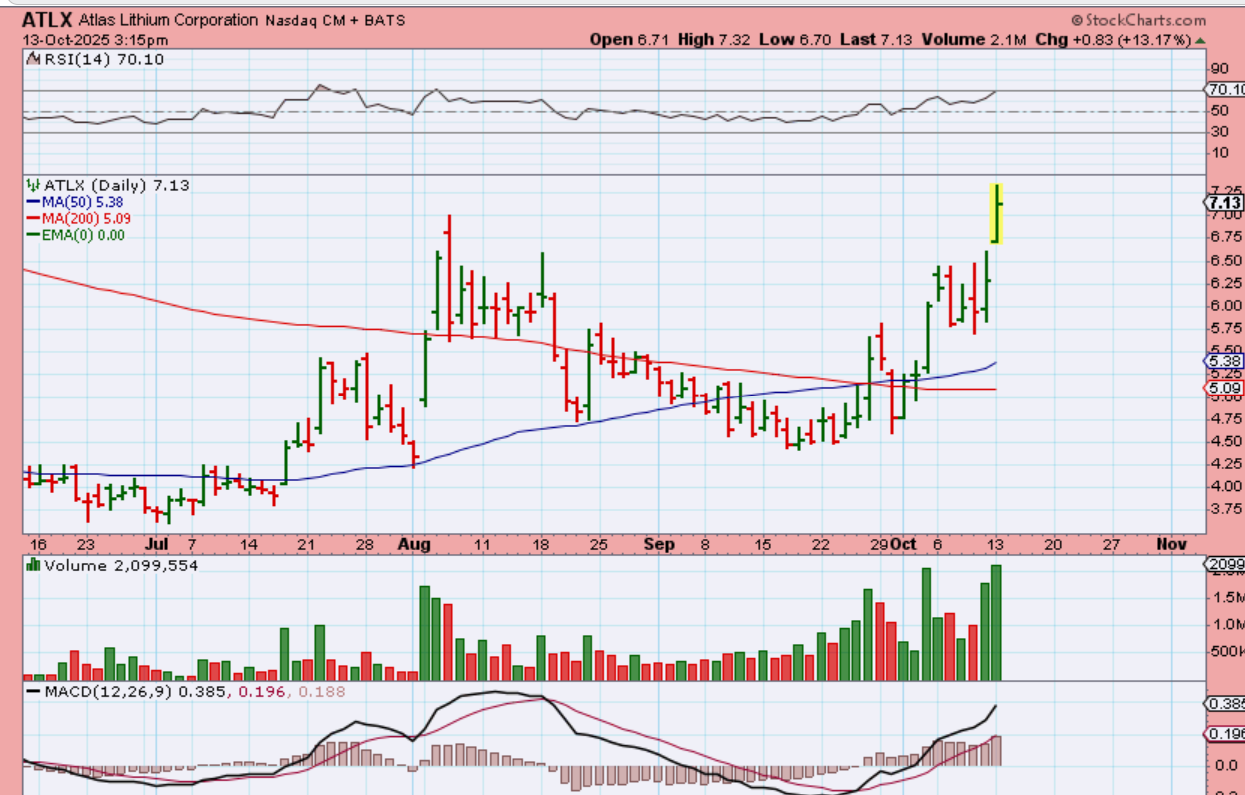
ATMX is a lithium stock that IGNORED the selling Friday and continued higher Monday, and LAC and SLI were up about 16%, so
.
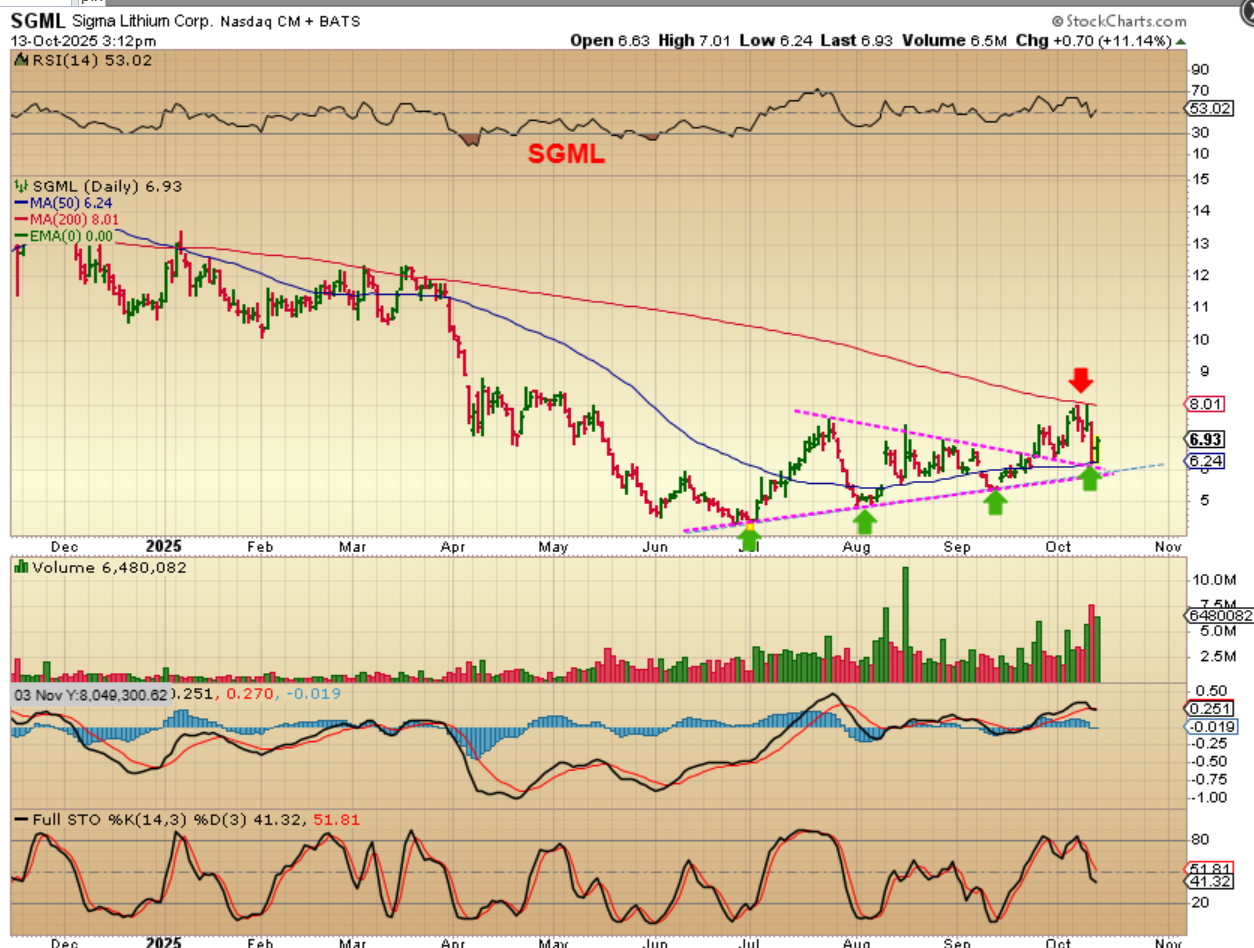
SGML might be worth buying. It reversed right at the 50sma and that is a back test of the triangle too. It was rejected at the 200sma last week, but may be ready to run. And…
.
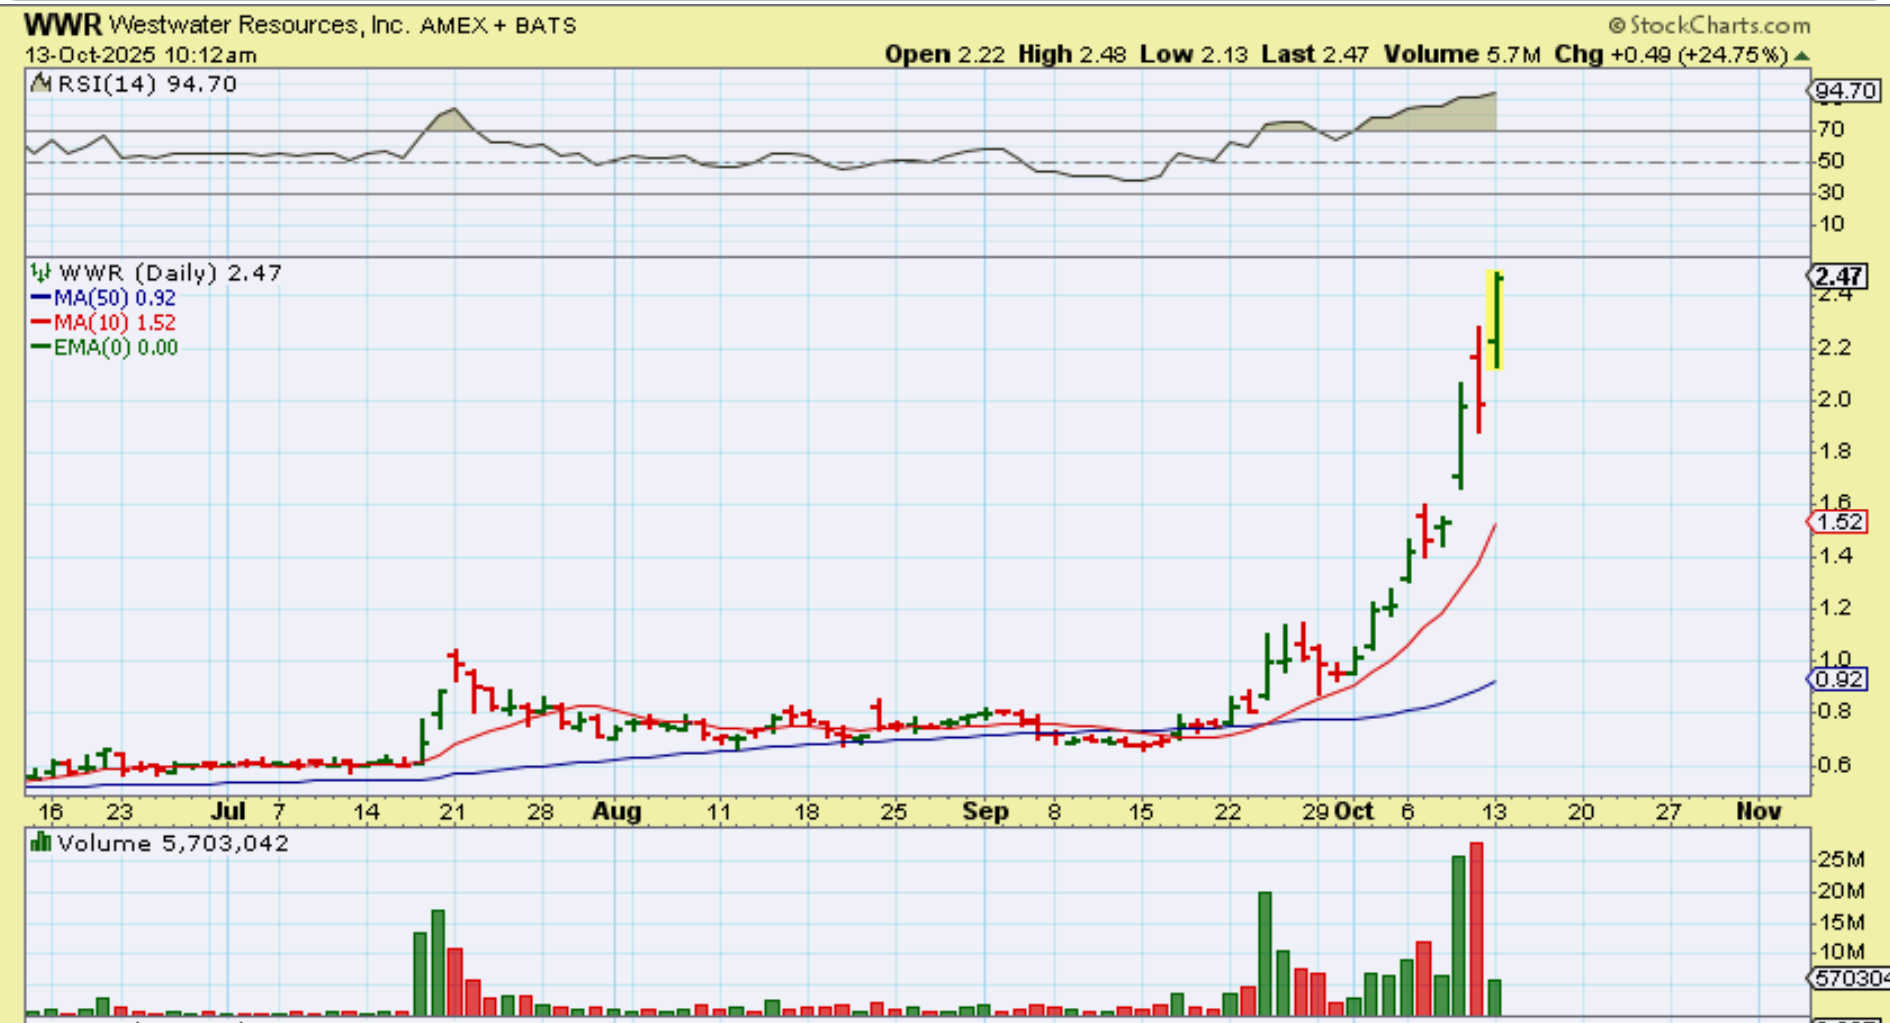
And stocks like WWR, FCEL, PLUG, BLDP, BLNK, IONQ, RGTI, QBTS, QUBT, QSI, , etc etc are still quite bullish. We bought WWR under $1. Wow what a run.
.
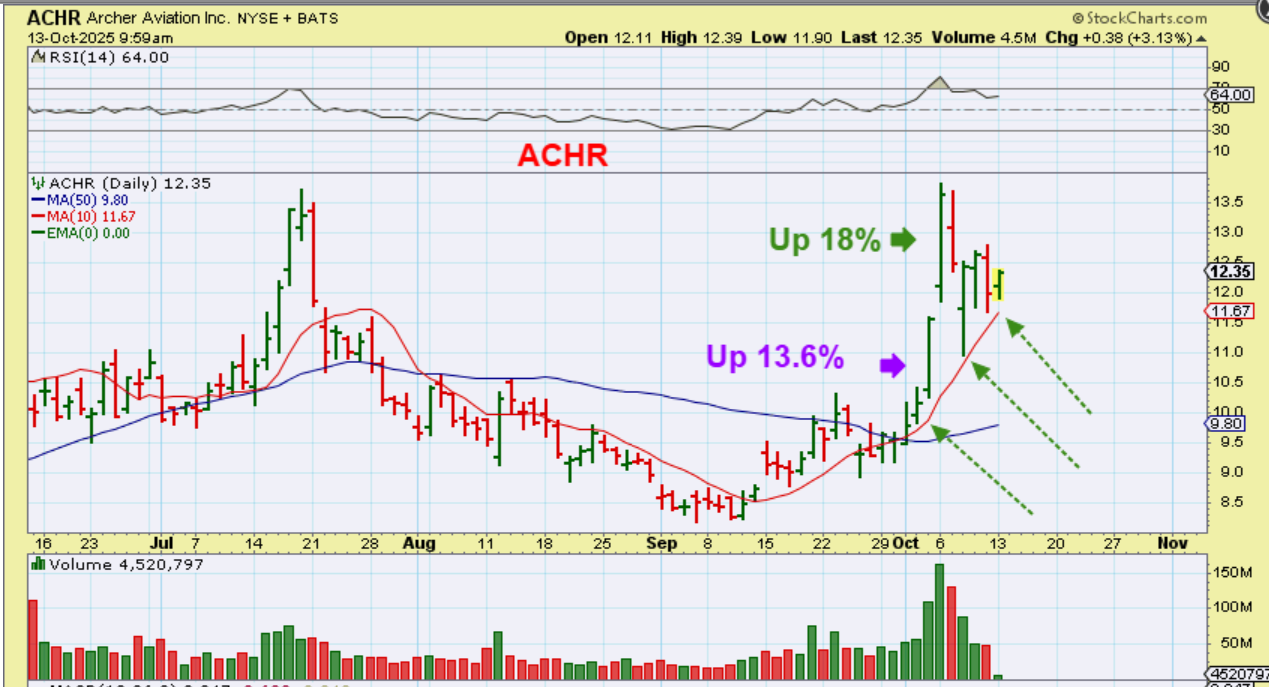
ACHR was looking good too, so I posted this 30 minutes after the markets opened. It closed up 6.6% and can run much higher if the markets stay bullish.
.
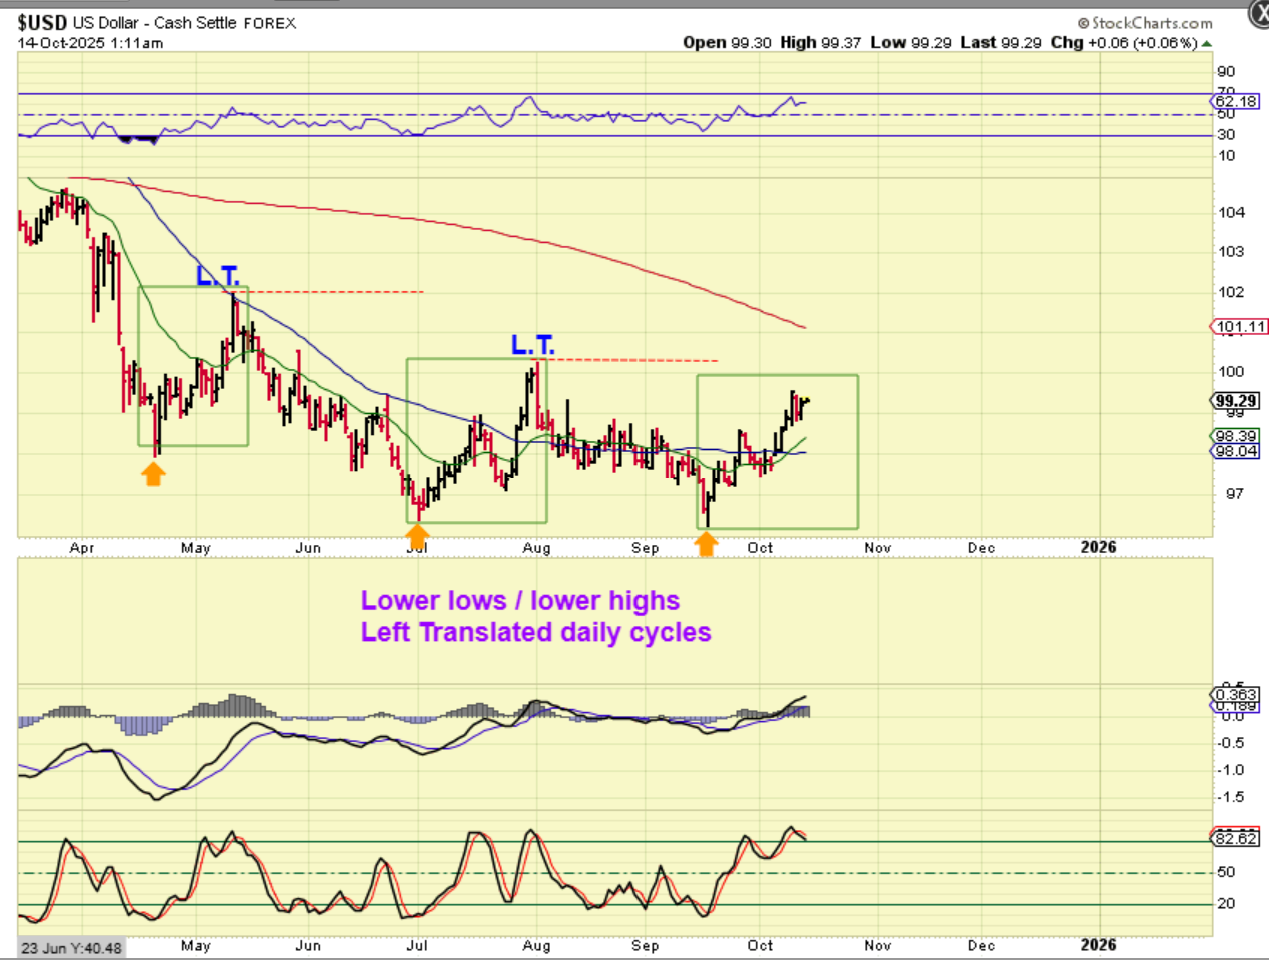
USD– I’ve been pointing out the last 2 daily cycles as strong looking at first, but then they’ve peaked early and become L.T. with lower highs and lower lows. I’m watching to see if we get a higher high this time…or not.
.
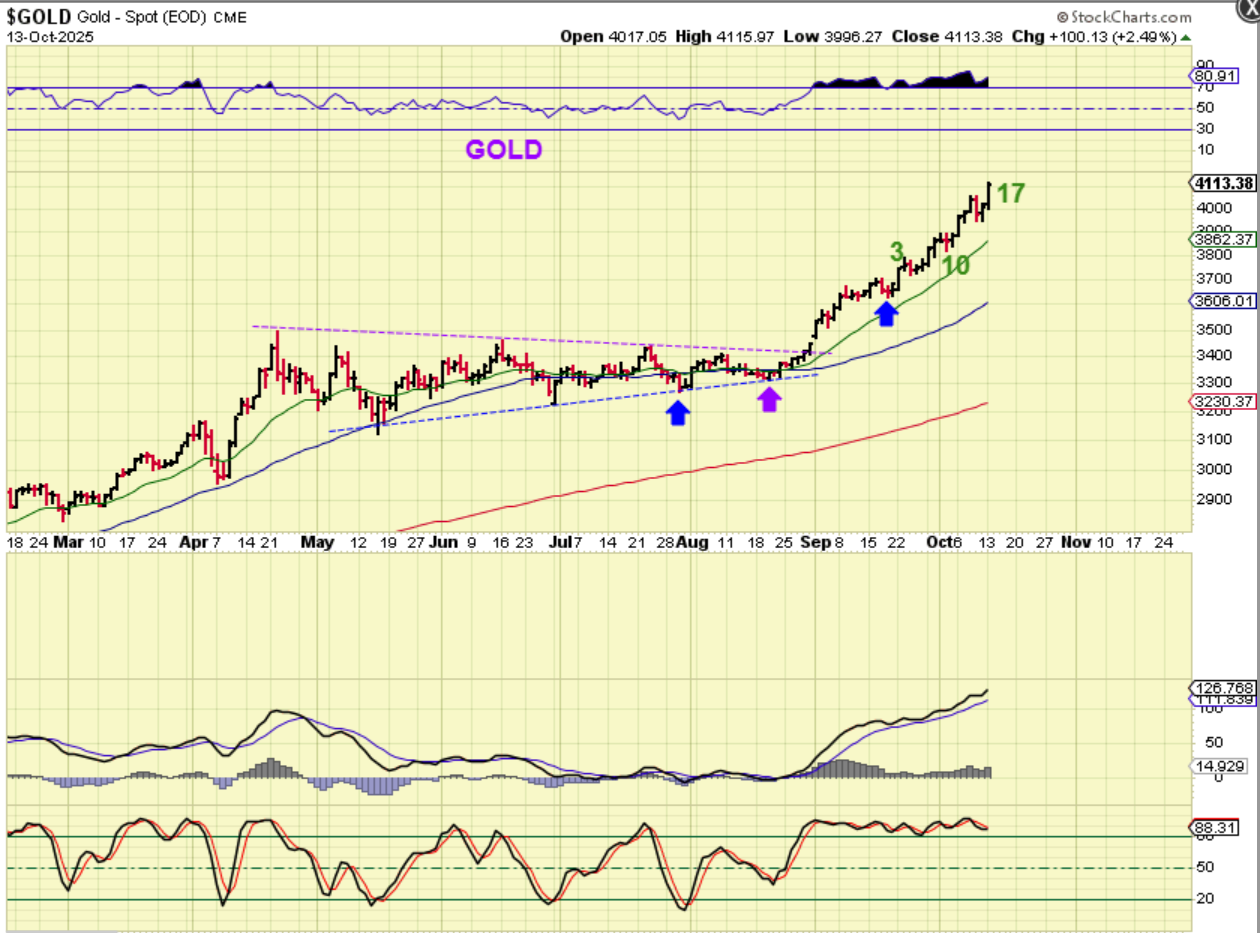
GOLD is on day 17, and at this point one would have to believe that it is going to be another R.T. daily cycle. It may start to dip down soon and put in the next dcl within the timing of the Fed meeting in October (Oct 29), but then it should start a 3rd daily cycle and that could actually become a blow off top. We have to take it a day at a time, since we have a STRONG bull run here and day 17 could still turn into a peak at day 20 or higher if it wanted to, right? This could be a rapid acceleration move. Gold is moving up WITH the USD.
.
SILVER is also on day 17 and it has made new all-time highs. This can run higher too, but I’d like to see it start to roll over soon. I am getting a bit concerned if we don’t pull back sooner than later. Why? Because…
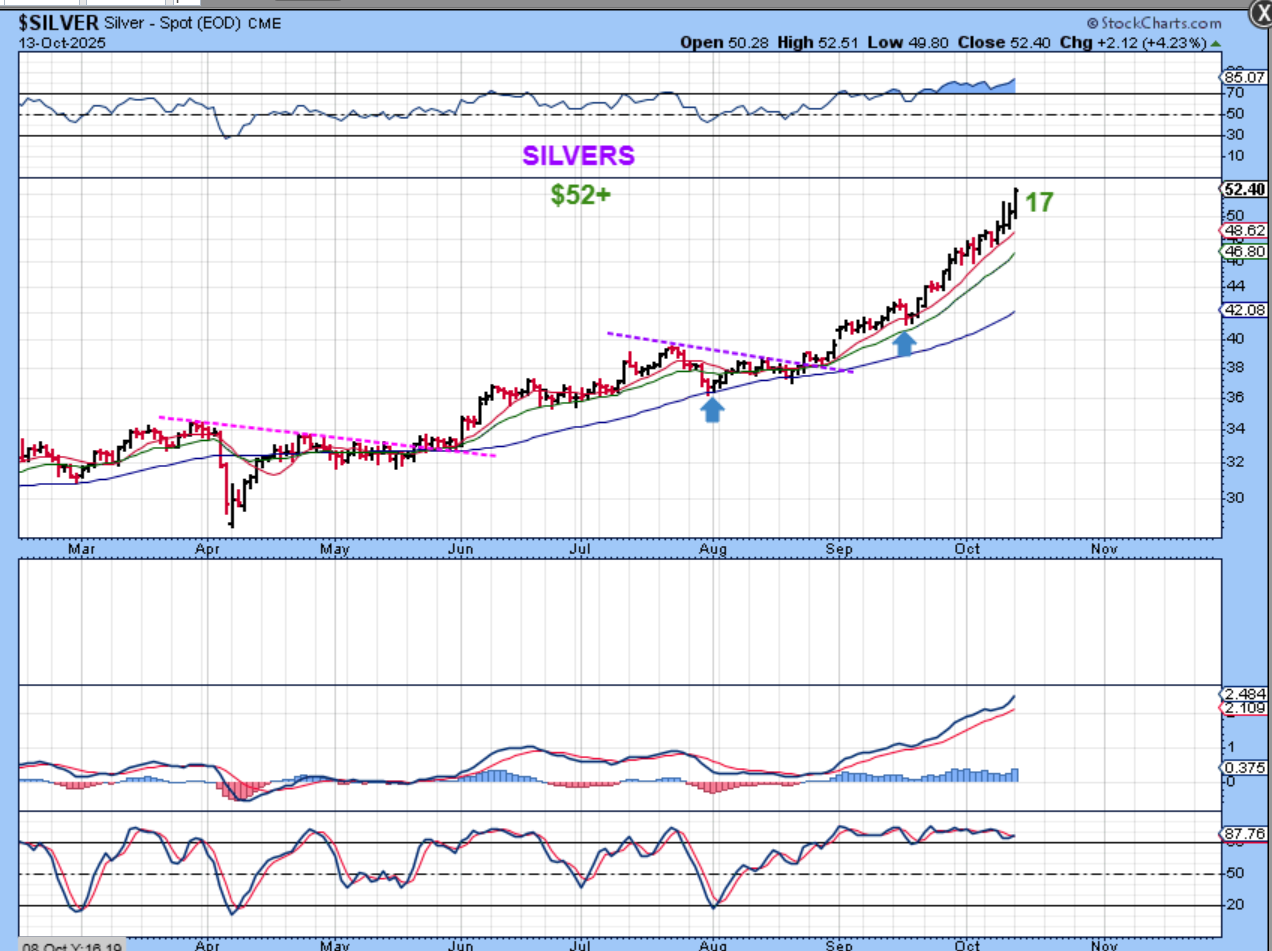
.
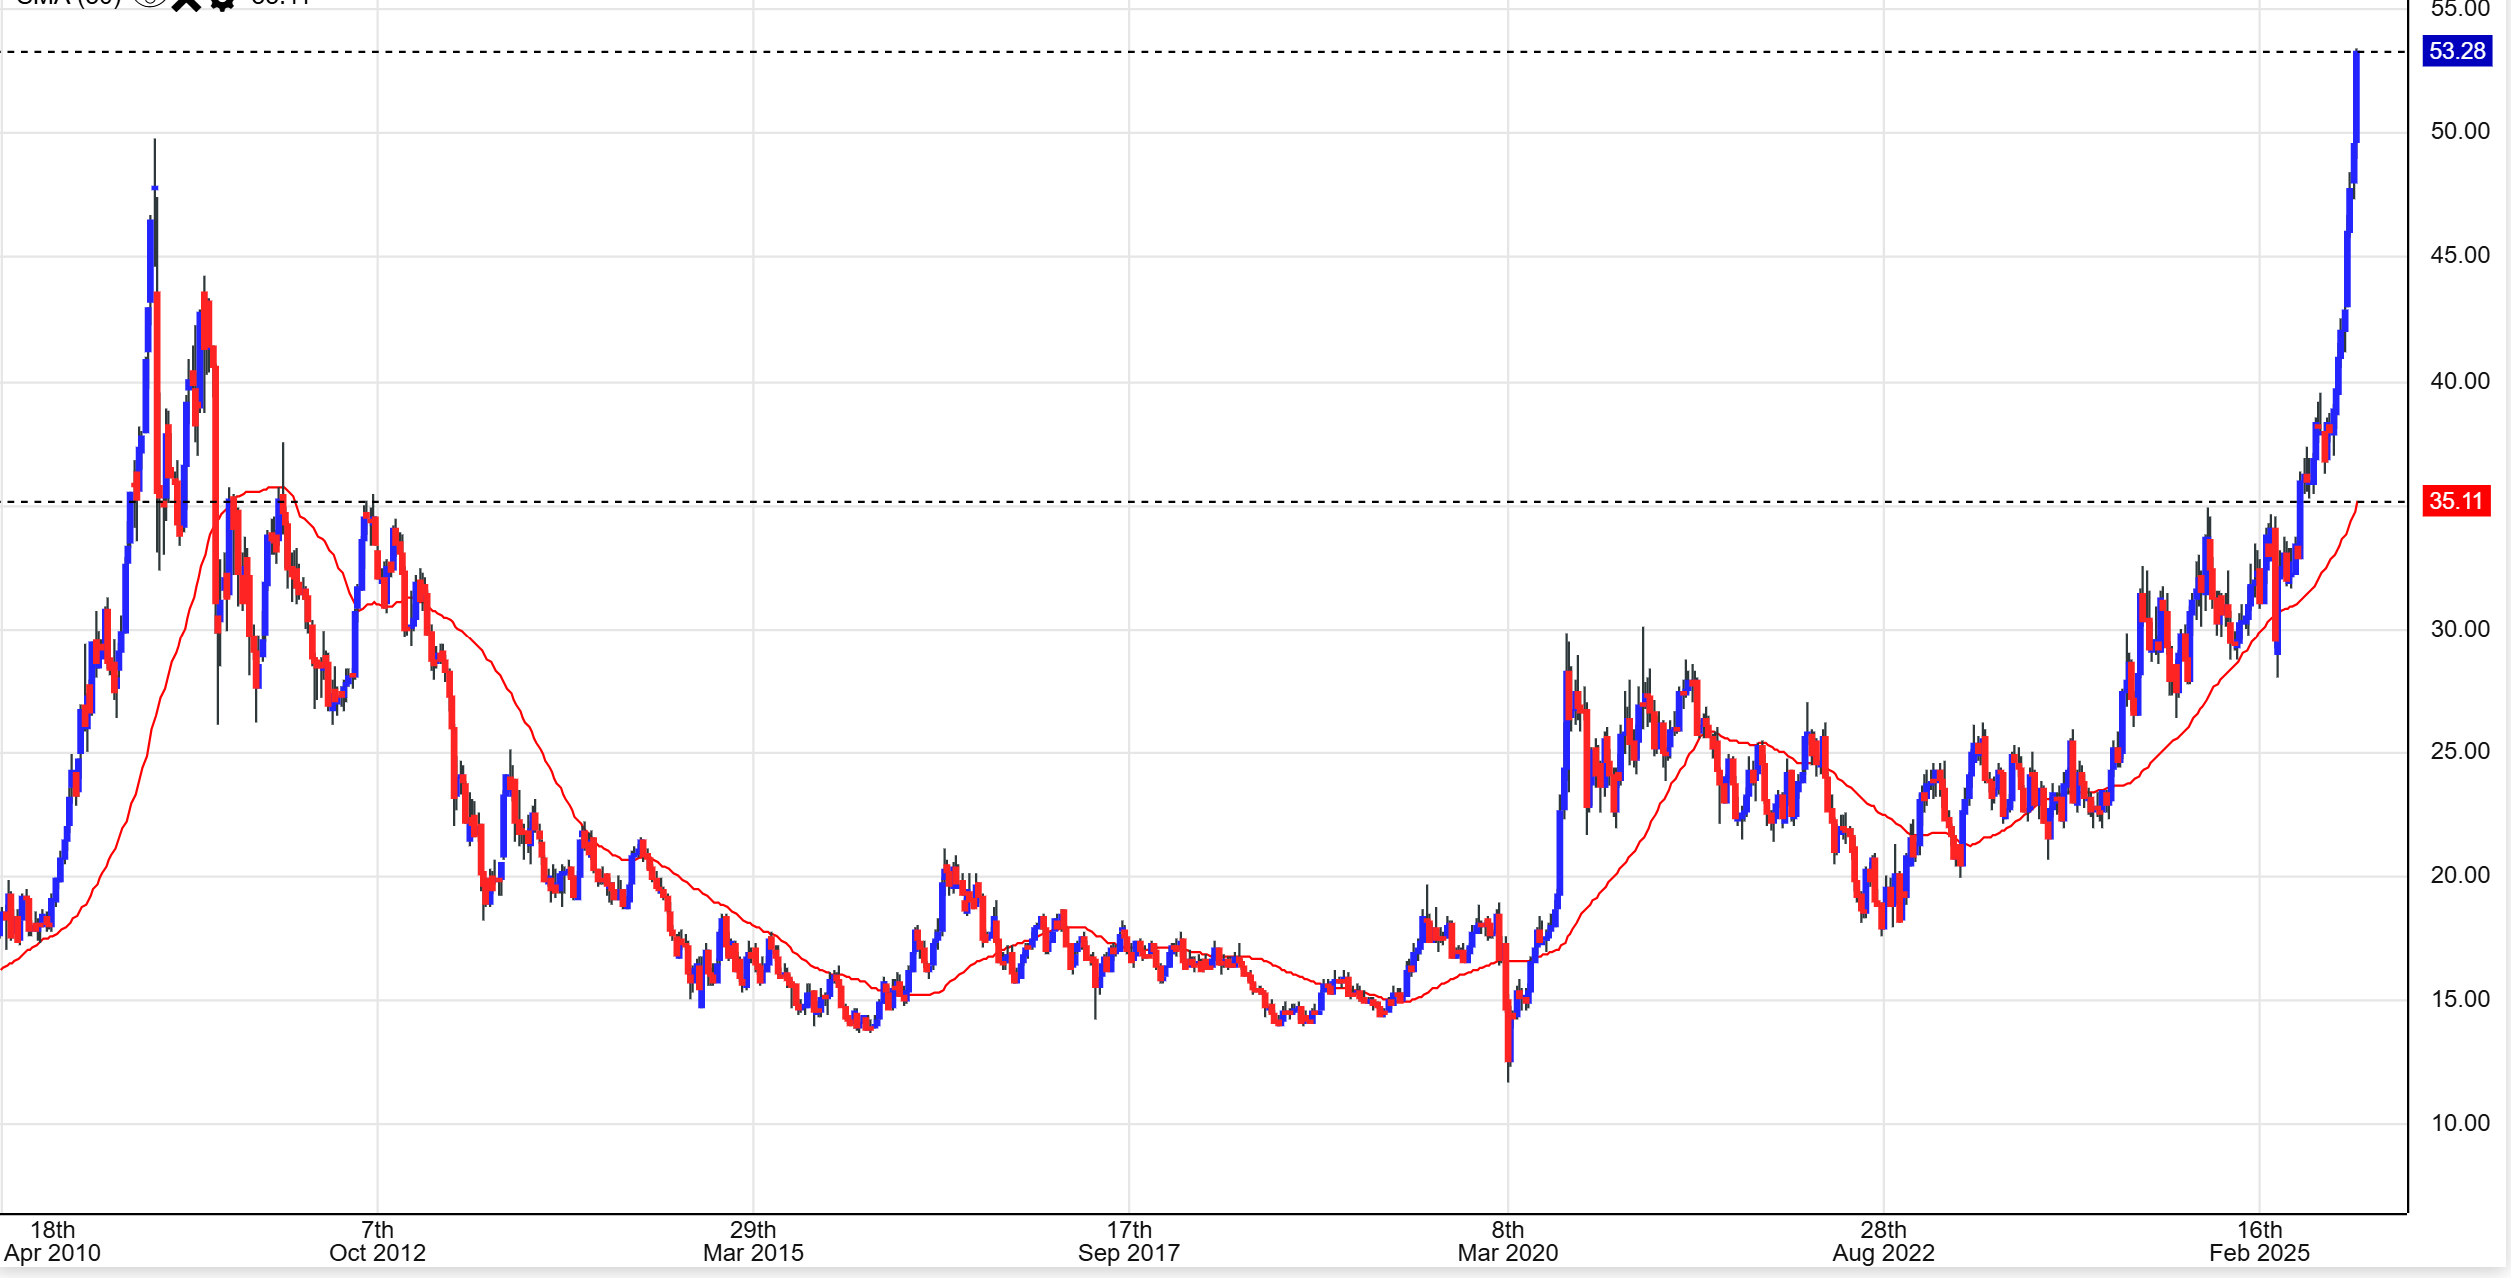
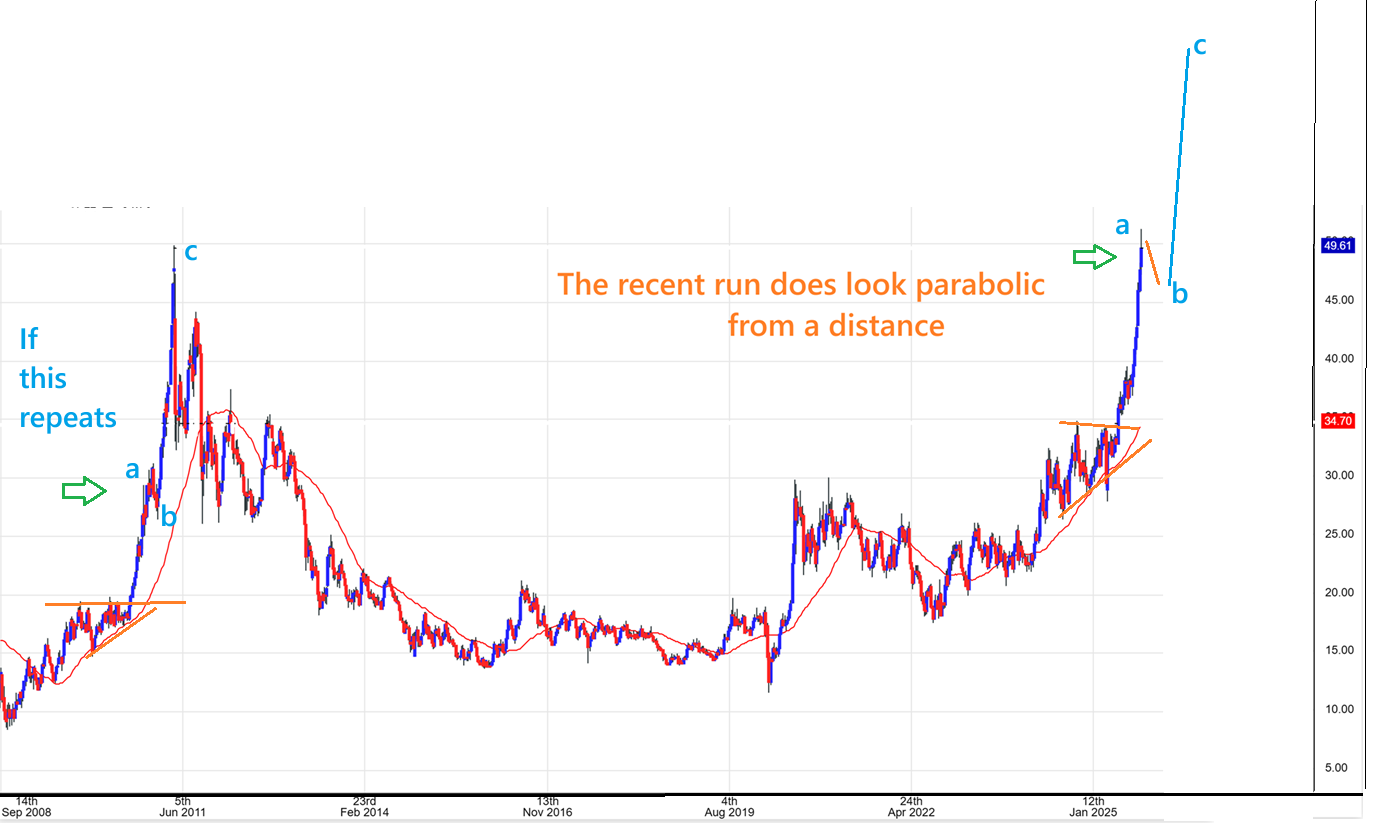
THE SILVER WEEKLY chart is really looking parabolic. I discussed this in the weekend report and this weeks move is just adding to that parabolic look. A pull back would help.
.
SILVER FROM THE WEEKEND REPORT:
I took that last parabolic run up in 2010 and added the extension after the pullback to our current price. I know that an a-b-c is usually a drop, so I should have drawn this as a A-B = C-D, but you get the point. I’m trying to show a valid possibility where this parabolic looking move to $50 could extend one more time. In the chart ABOVE, that move to $50 does look parabolic, but view below, we saw a longer looking 2 wave move in 2010.
.
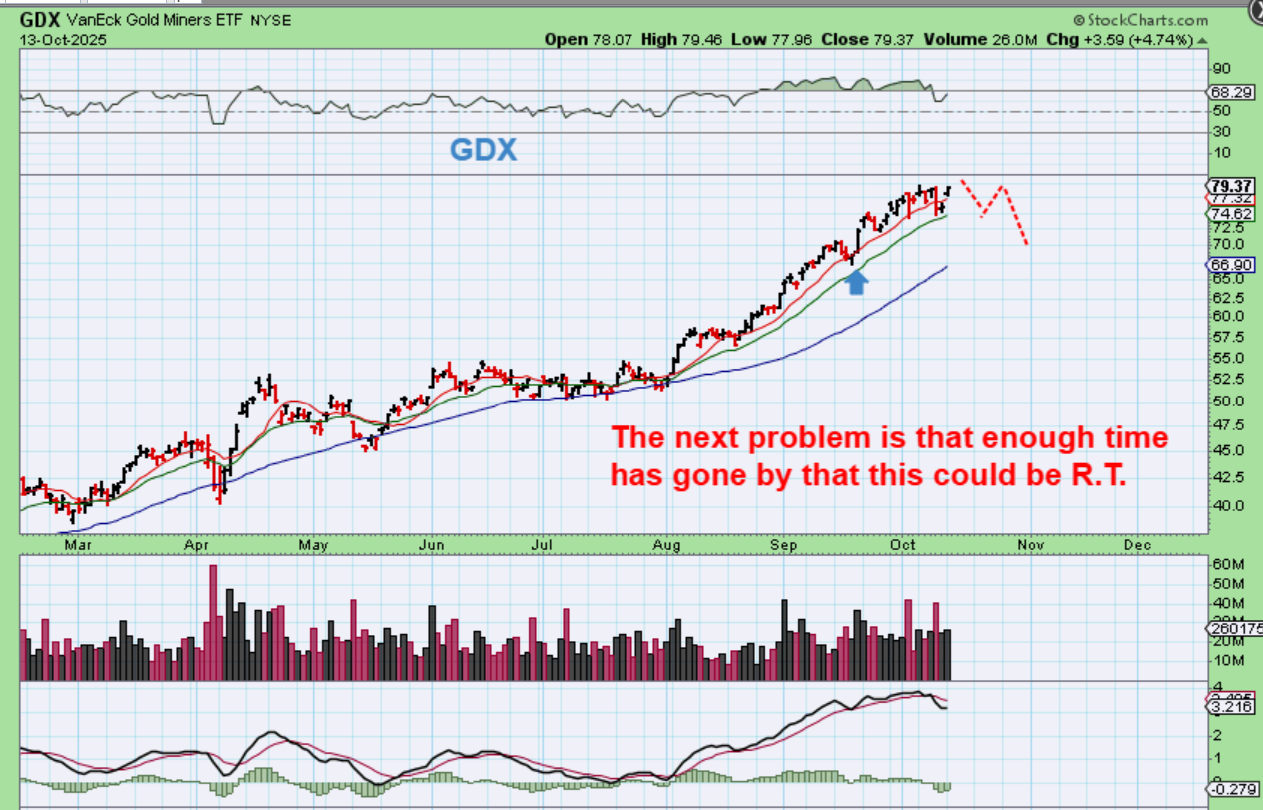
GDX has chopped sideways for the last week or 2. The RSI dropped and price is now back at the highs without MACD confirmation, so the Miners may be starting to get ready to pullback.
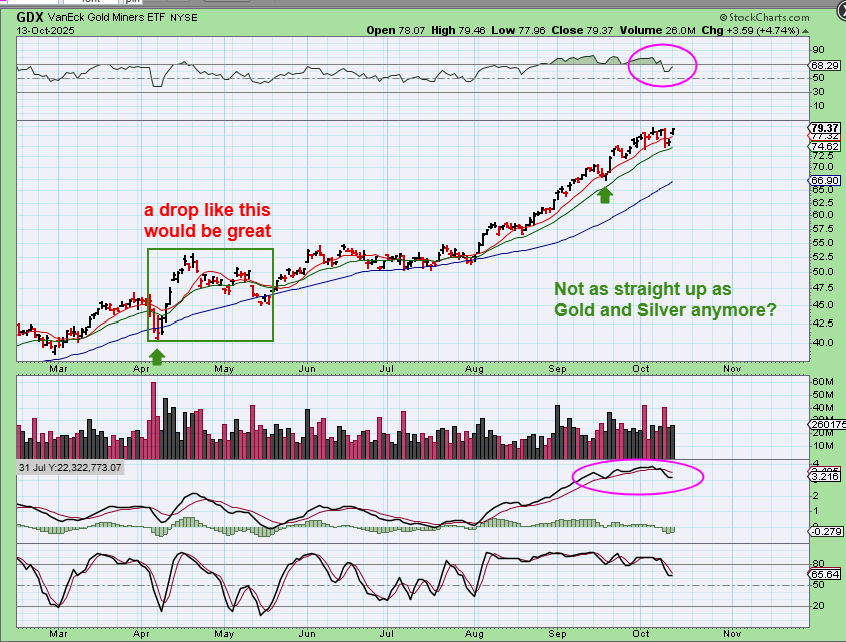
.
GDX -With a day 17 or more high, we’d need a day 34 or more dcl for it to be L.T. We only have 12 days left until the Fed Mtg.
.
General Markets: So after that big sell off day on Friday, we did see a rush of buying on Monday and there may have been short covering involved too. Many of the stocks that we have been trading were up 10%, 15%, even 20-25%. That could continue too, if we find over time that we just had a slam down into a dcl. We also think of the timing and wonder if the next daily cycle will be a L.T. daily cycle and roll over after day 9 or so? Past one day slam downs did bounce for a few days if it wasn’t a dcl, and several days if it was.
The Precious Metals have been running strong, are still running strong, and can continue to run strong as we head into the next fed meeting in 2 weeks. We really just have to take things a day at a time, until we see more evidence of a pullback unfolding. We could be seeing this sector go parabolic, and I have explained what that would look like and do too. I even wrote a report back in September called ‘What is Parabolic?’ I discussed the Miners possibly going parabolic back then, and they really haven’t pulled back much since then, so you could review that again if you wanted to.
September 20 Weekend Review – What Is Parabolic? – Chart Freak
.
Enjoy your Tuesday trading and Bitcoin is below.
.
~ALEX
.
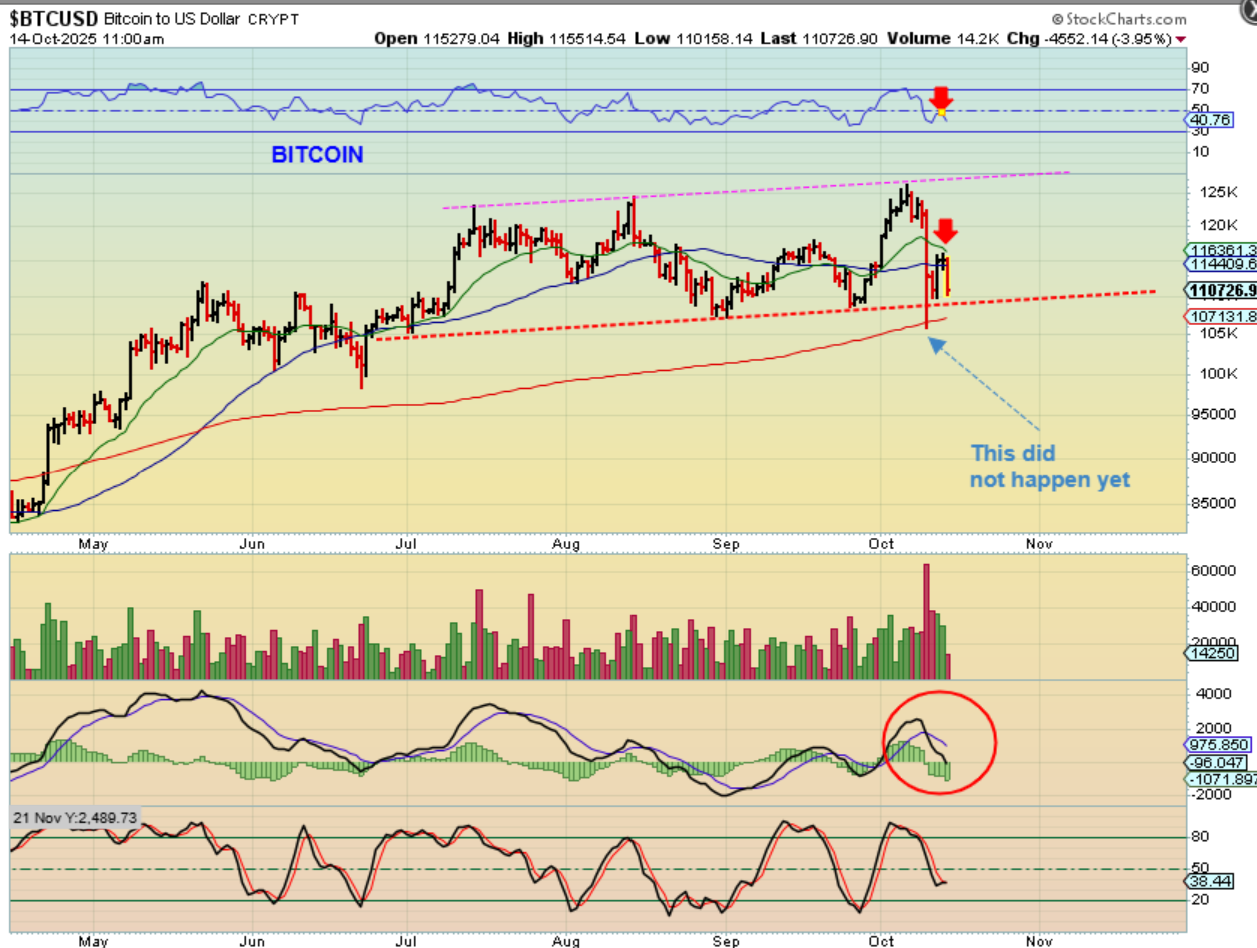
I want to start with this live chart of BITCOIN, mainly to show you that the lows WERE NOT broken yet. I want to use a stockcharts chart, but they , for some reason, show Bitcoin as breaking down below the lows over the weekend. SO THIS IS BITCOIN NOW and it looks like day 45 (of a possible 60)…
.
So Bitcoin is at the recent lows and looks to be struggling after that slam down last week. Crypto stocks bounced back nicely though, and some of the ones that I have covered as leaders like CIFR, BITF, HUT, etc were up 15-20+%, but this last red candle happened overnight, so we’ll see if those stocks will also pull back a bit more on Monday.
.
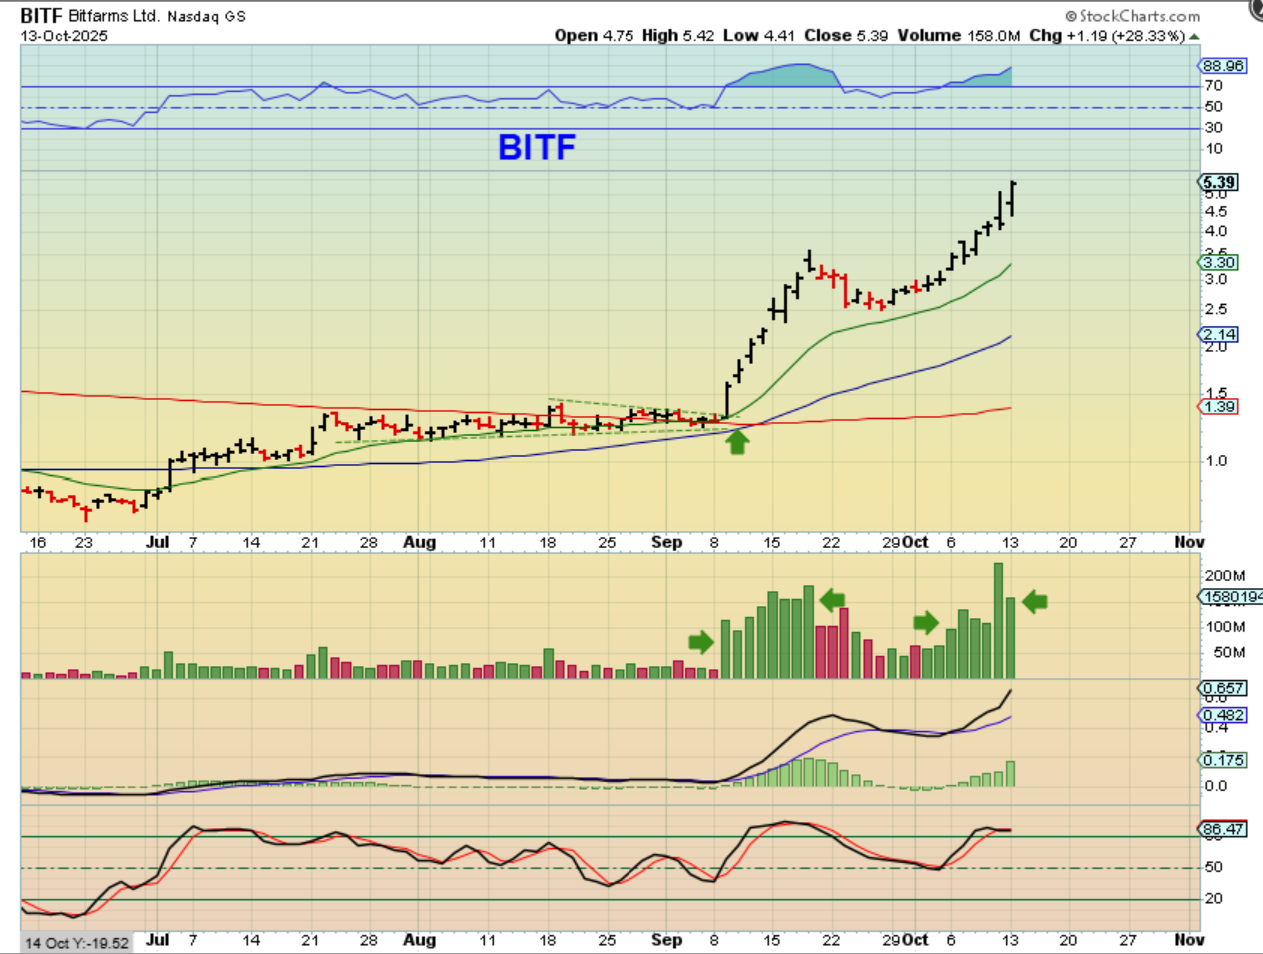
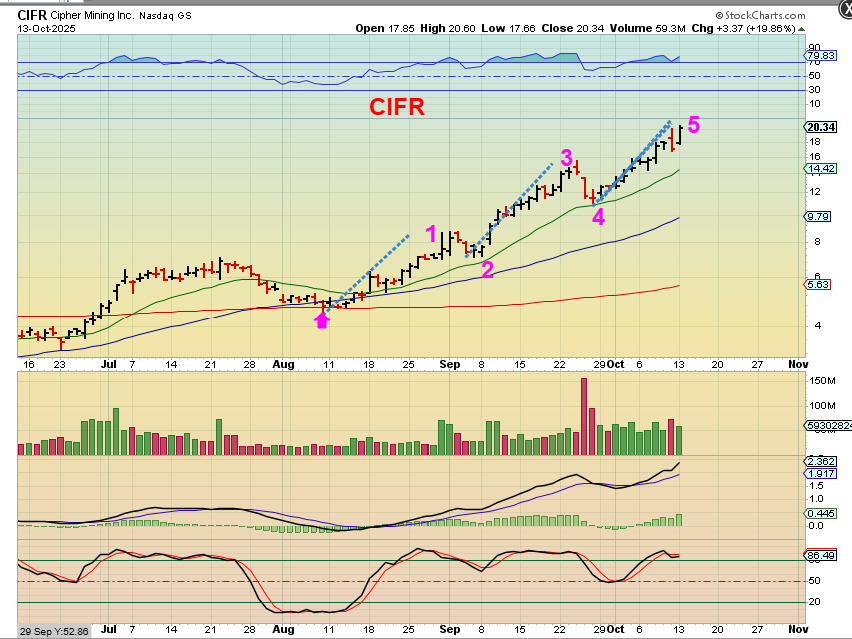
CIFR was actually up about 20% yesterday and is one of the leaders in this sector. It has continued to run higher despite Bitcoins choppiness and being back at the lows. We bought several of these leaders at the recent lows and either did a ‘buy & hold’ or traded them on the way higher, so I have covered them in most of the reports. A few of those leaders were CIFR, IREN, WULF, HUT, HIVE, BITF, BTDR, and BKKT. These ran without Bitcoin moving straight up. Then RIOT, CLSK, CAN, BTBT, and others started to play catch up, so keep your eyes on these.
.
BITF was one of our Buys near the 50 & 200sma and it has just been ripping higher on its own path. Bitcoin is choppy and at recent lows, but BITF was up almost 30% on Monday and is at new highs, so my point? Many of the crypto stocks are making their own paths higher.