Thursday October 16th – More of the Same, So Far
.
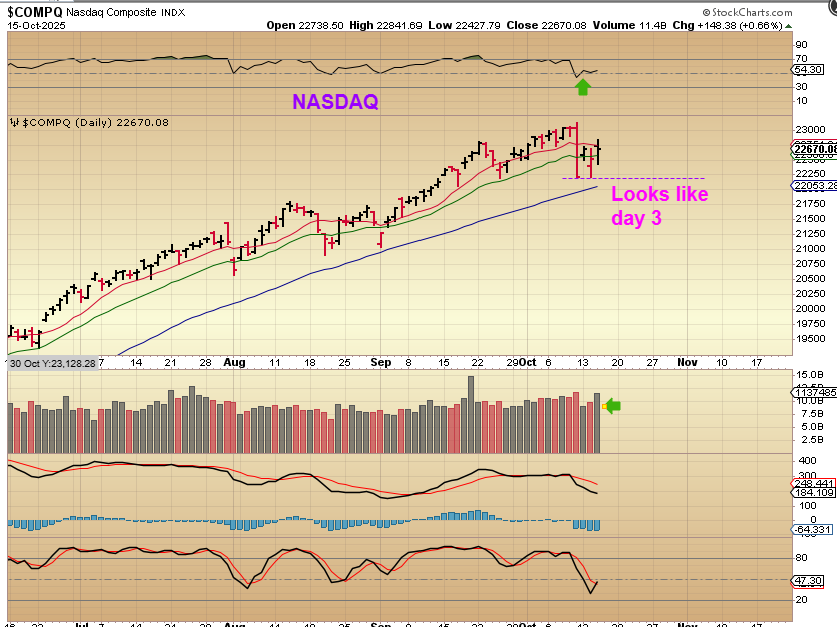
NASDAQ – The markets moved higher on Wednesday and the red line is the 10sma. It did slope lower with the dip and now price is trying to close above it. This looks like day 3 of a new daily cycle (3rd daily cycle out of the lows).
.
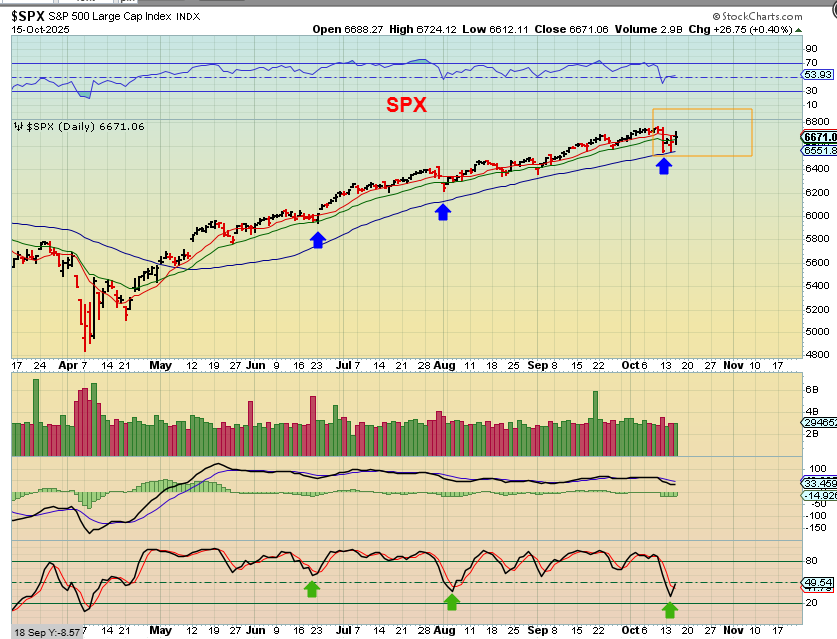
The SPX also looks to be starting a move higher out of the recent dip.
.
On Oct 6
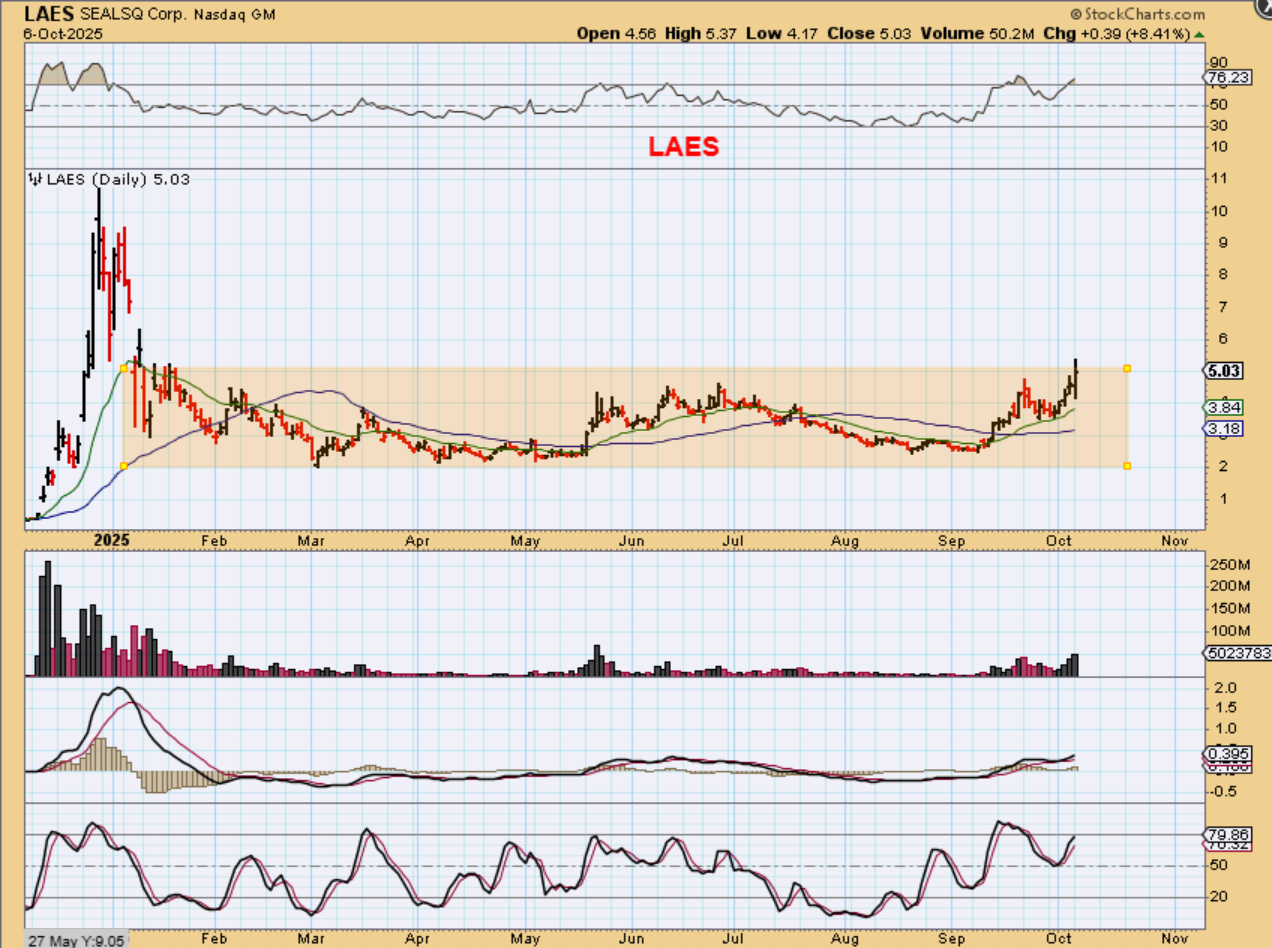
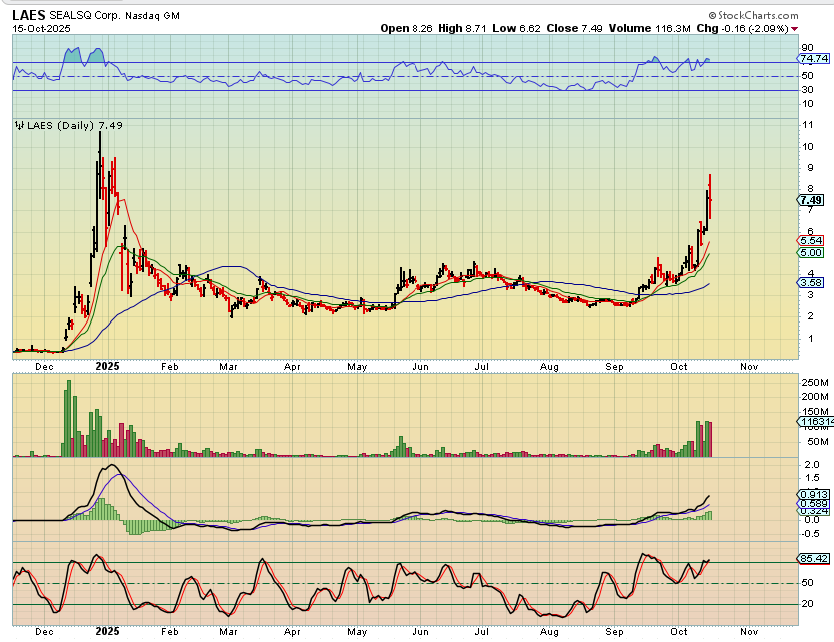
LAES – I loved this base. It is a 10 month long base! It was a buy at the 50sma or the back test of the 20ema, but here it looked ready to breakout as a buy too. I wanted to add on a dip below $5, but…
.
LAES I didn’t add on that sharp drop below $5, but it has now moved to almost $9 and is putting in some big swings now. It can be very hard to ride, and even though this can run to $10, the intraday swings are tough if you are watching this trade live. Today alone the high was $8.71 and the low was $6.62. If you owned 1000 shares, that was a $2/share swing. If you owned 5000 shares, that was a $10,000 swing – lol. These massive moves can get tough to stomach, so if you wish, you can cut your position size.
.
QUANT STOCKS CONTINUE TO RUN! Stocks like QBTS, QUBT, ARQQ, RGTI, IONQ
.
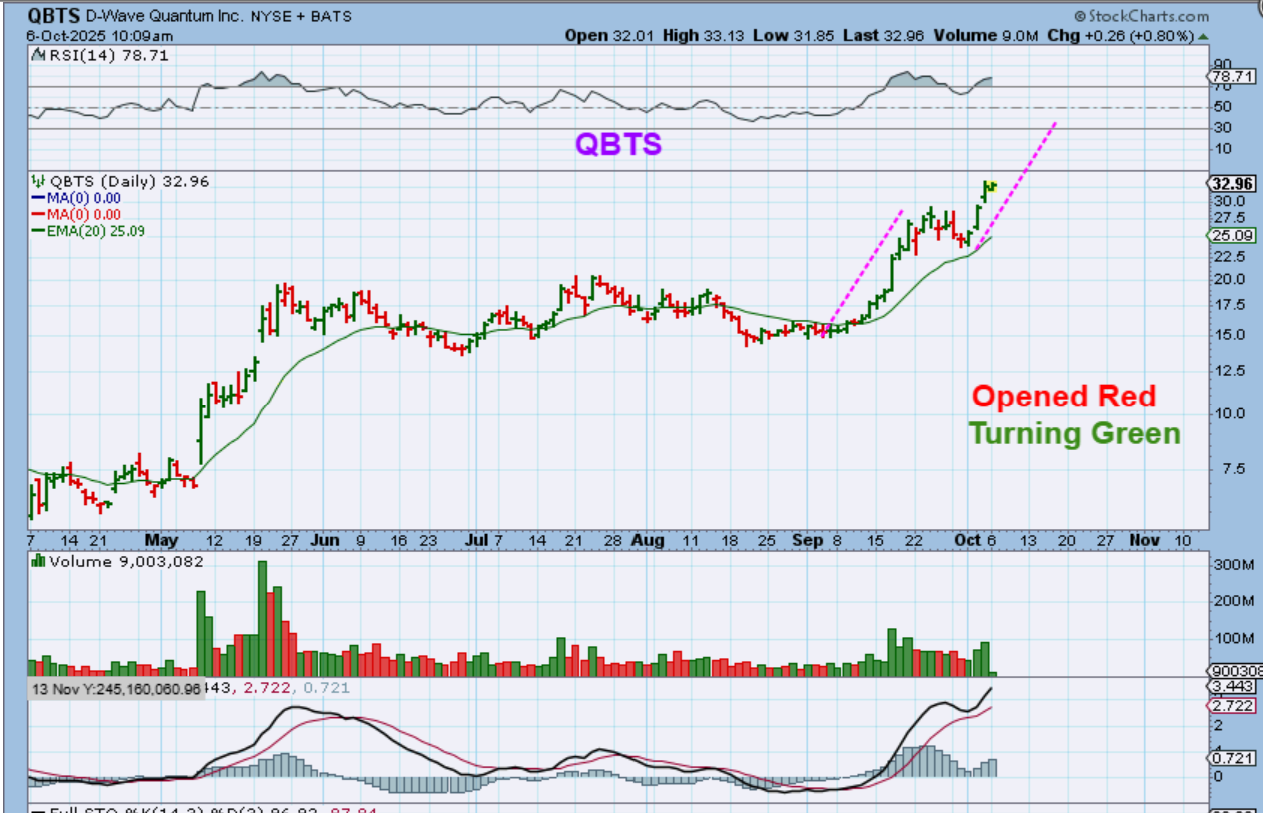
QBTS for example: This was a buy near $15 to $17 and it rocketed to a double from there. After a small pull back to the 20ema, it reversed higher and broke out again last week. I grabbed this chart to show that it dipped red to green on Oct 6 by 10sam and drew those magenta lines to show price projection too…
.
QBTS was up 10% that day, and now…

.
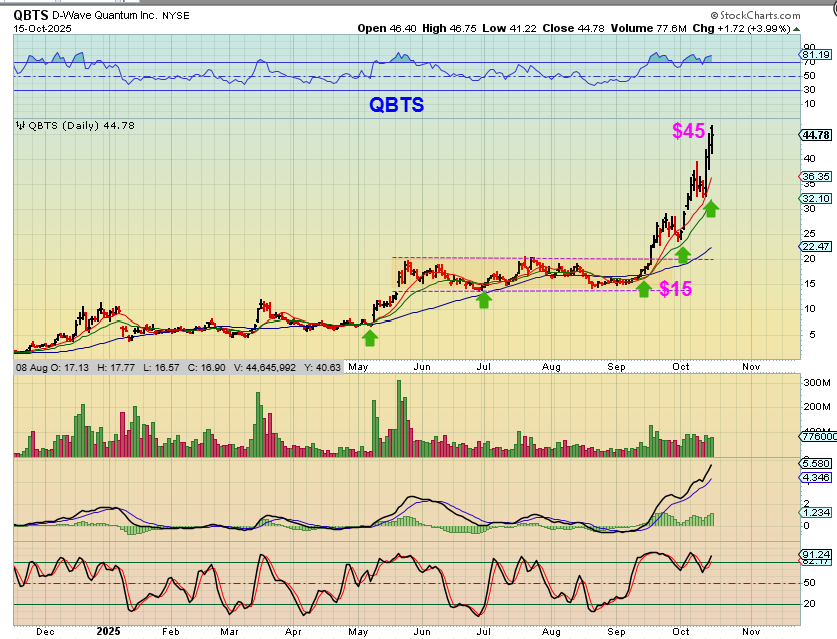
QBTS hit $46.75. QBTS was a buy at the consolidation, a buy at the dip to the 20ema, and when you look at this chart you can see that it doubled out of our buy at $15 and that it has now tripled, since Mid September! That is only 1 month. These quant stock have been amazing on this run, though the choppiness can make it hard to hold on.
.
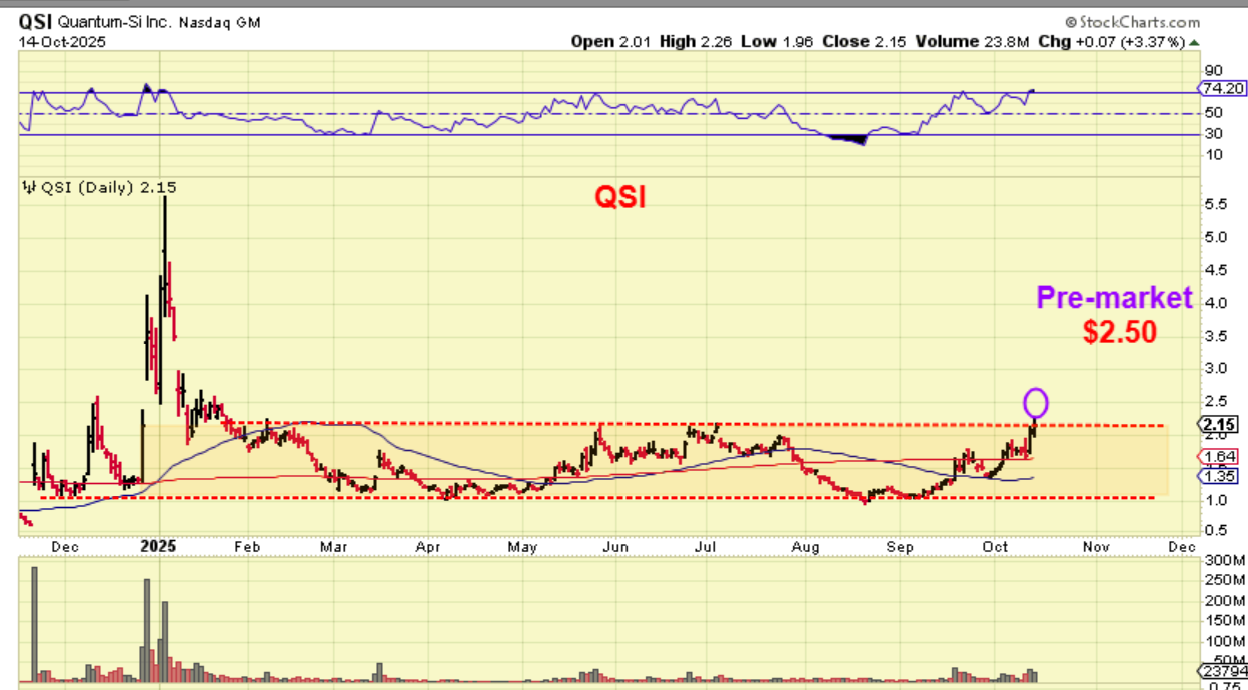
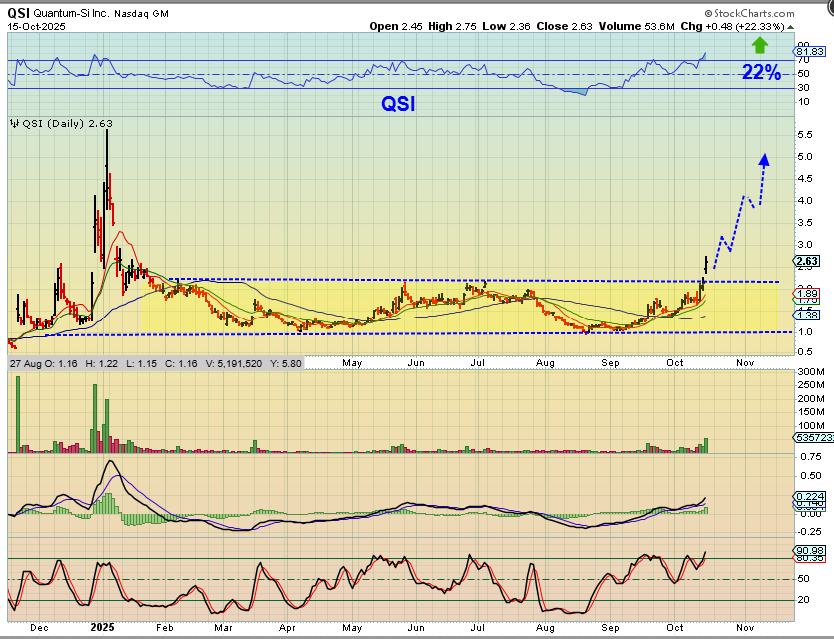
QSI was in the reports as a lagger and here yesterday I saw it up in premarket, so that would be a breakout. I posted this chart in the commenting area…
.
QSI did break out and gapped higher yesterday, closing up 22%. It may or may not fill that gap, and it can work its way higher over time, as shown here on the chart.
.
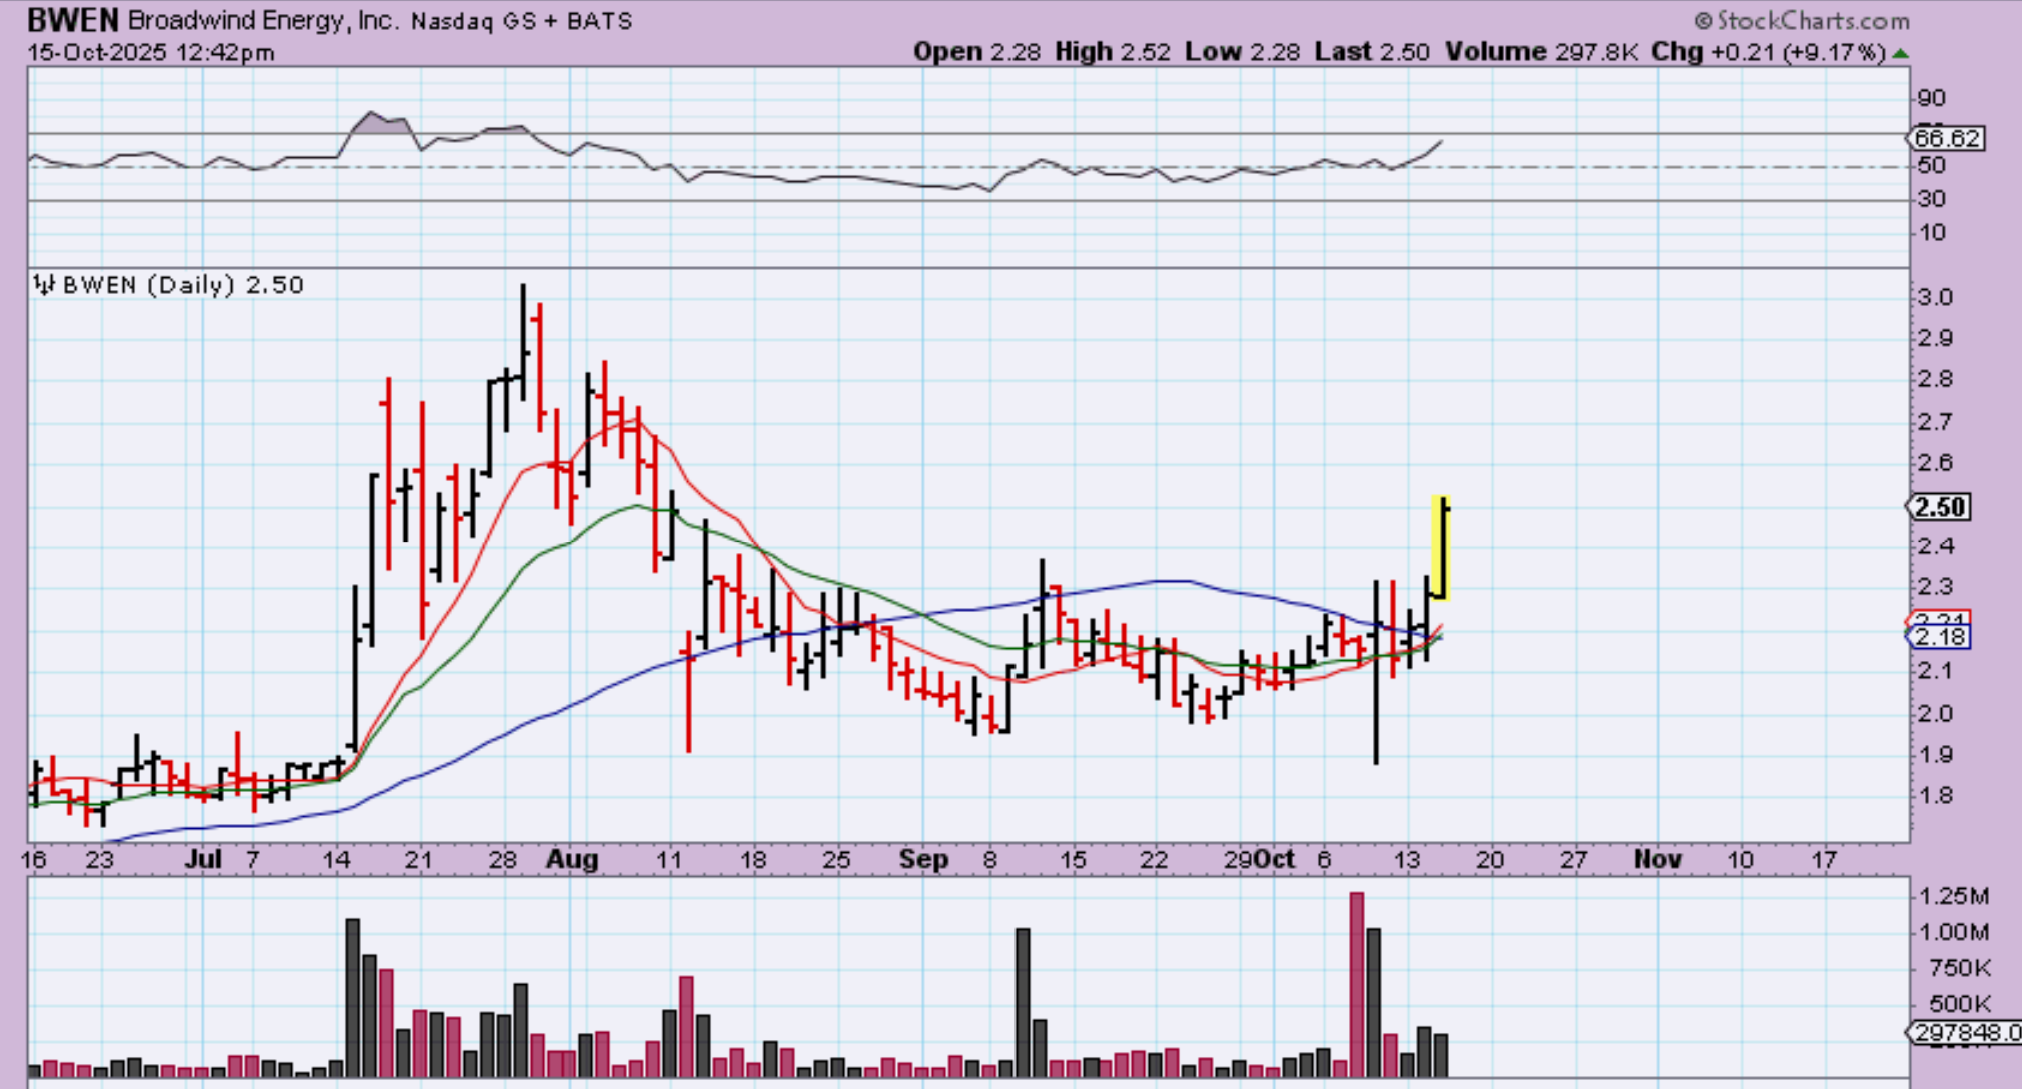
We’ve seen outstanding gains in BLDP, WWR, PLUG, FCEL, Lithium stocks, etc. So I was watching CLNE, GEVO, BWEN, etc too.
.
BWEN was finally breaking higher yesterday, so I grabbed this chart midday. It was already up 9% so it could be ready to run away, or maybe it’ll dip lower first and we could add on the dip. I’ll be watching BWEN today, I didn’t take a position yet.
.
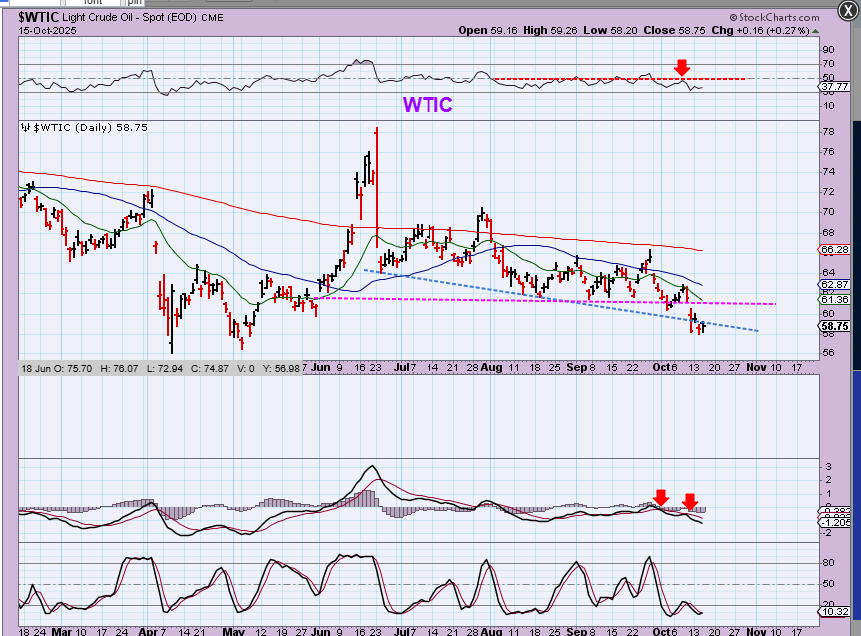
WTIC remains at the lows after breaking down recently. The ‘peace talks’ in the Middle East may be adding to the continuous weakness.
.
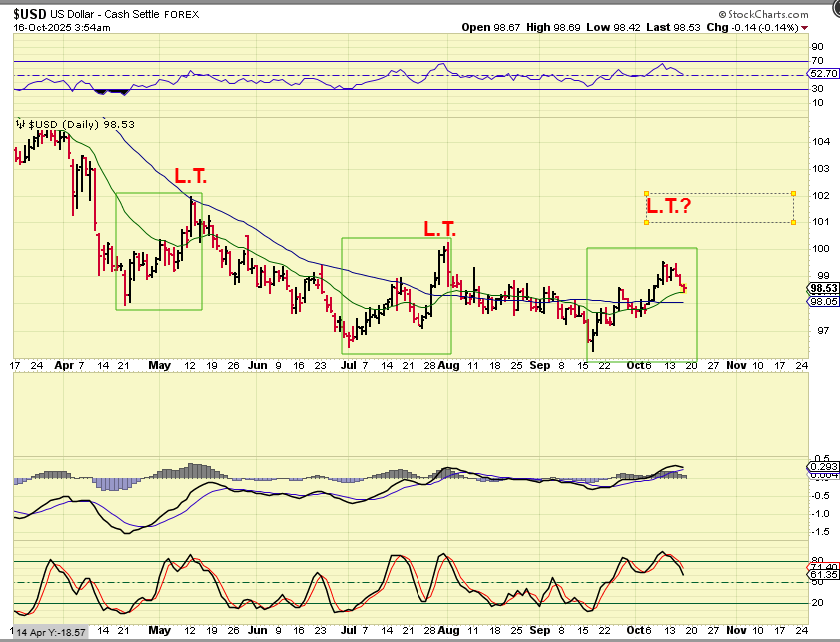
I have been discussing y thoughts with the USD. The past 2 lows gave us lower lows, lower highs, so I wanted to see if this bounce ‘peaks’ as a lower high again. So far, it has, we’ll see if it can bounce here at the green 20ema or find support at the blue 50sma.
.
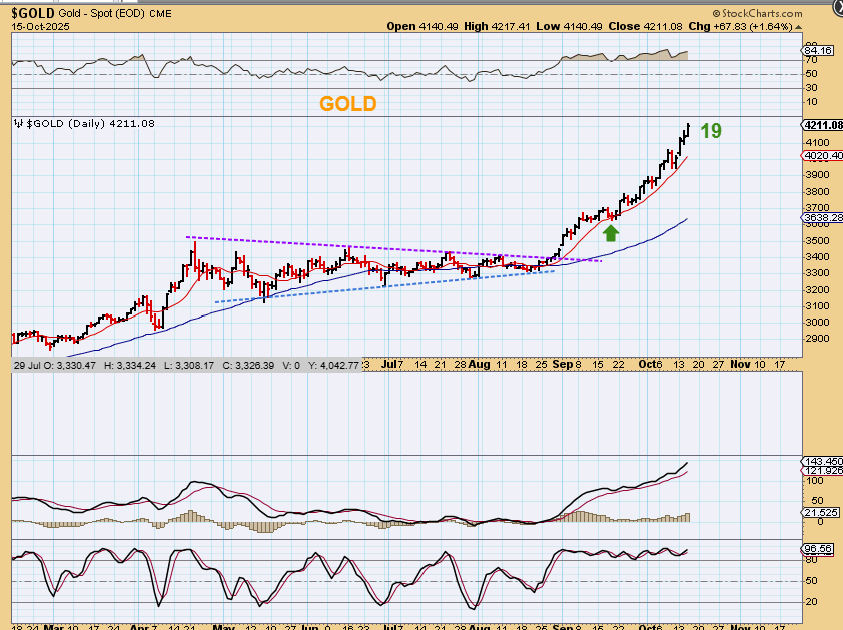
GOLD continued on its bull run out of that triangle and Wednesday was day 19 of the newer daily cycle. Gold has now pushed above $4200 and even though it may be on a track to tag $5000, I’d expect a dip when we get into the day twenty something area, to give us another dcl. So far, the dips barely break that 10 sma. This has been a very strong run.
.
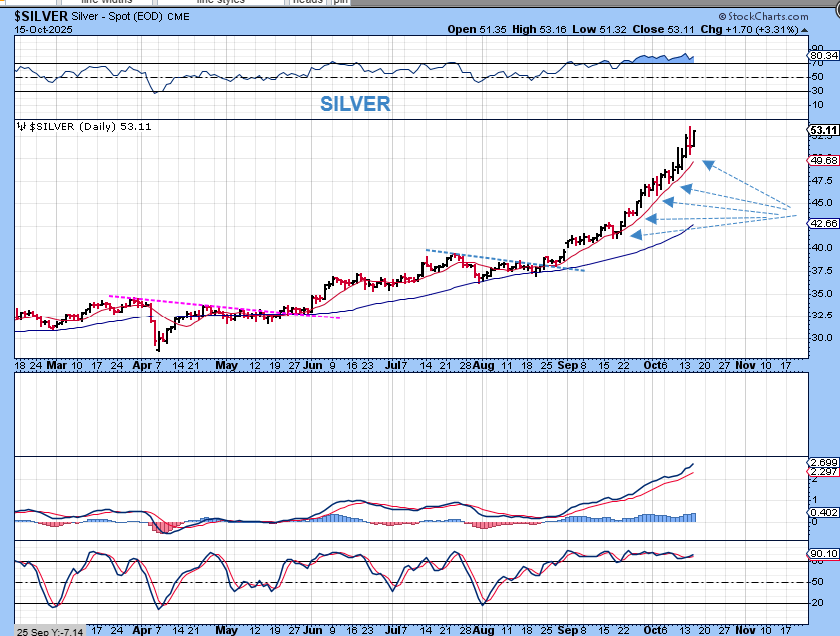
SILVER dipped on Tuesday, but it wasn’t time for a dcl yet. It pushed higher again on Wednesday and is up ner its highs at $53. Silver stocks looked really good yesterday too, after that ‘pause’ on Tuesday.
.
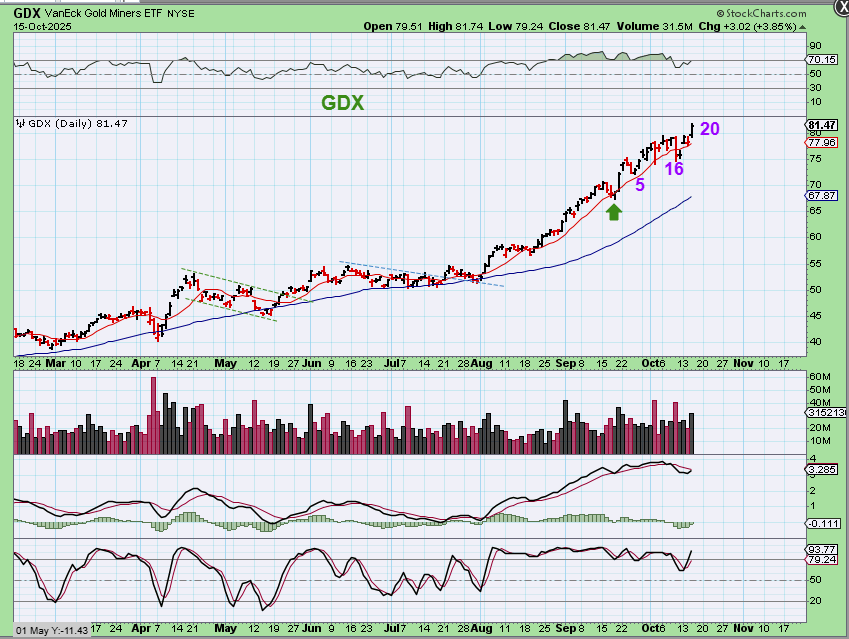
GDX looked like it might be giving us a rounding top, it even started to break below the 10sma, but then it Popped on Wednesday with Gold & Silver pushing higher.
.
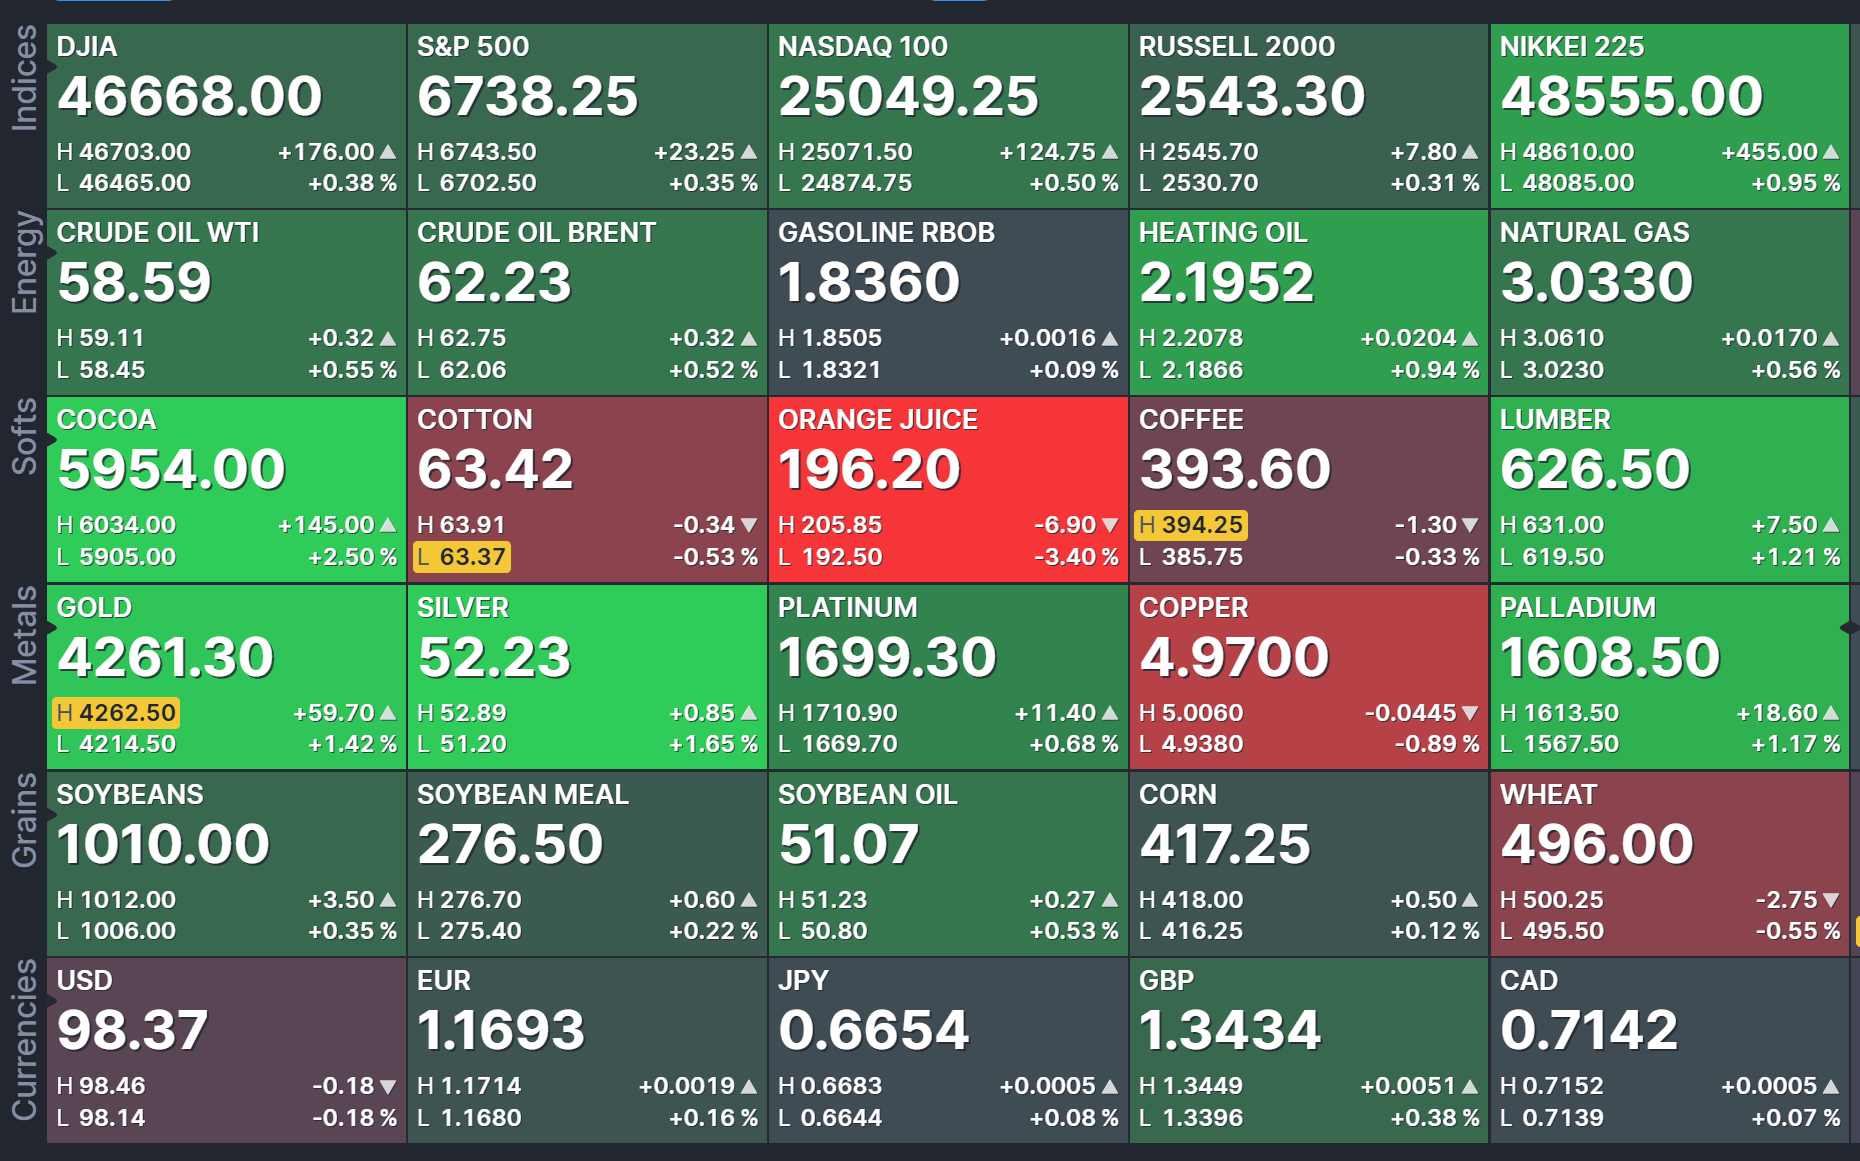
The Bulls again remain in control, especially in the General Markets and Precious Metals sectors. We were scheduled to have a lot of data released today, but so far the data with Red Asterisks should be delayed due to the U.S. Government shutdown. The futures are green as of 7 a.m., shown here on this chart.
.
Enjoy your Thursday trading!
.
~ALEX
.
YESTERDAY I MENTIONED IN PART:
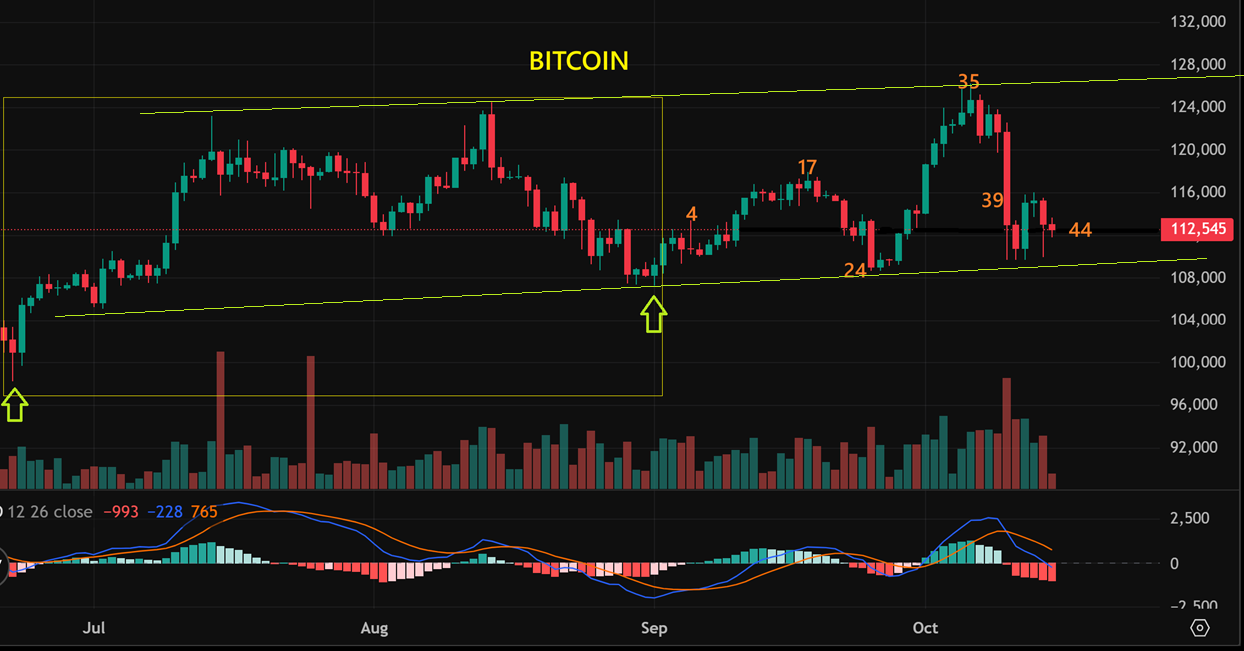
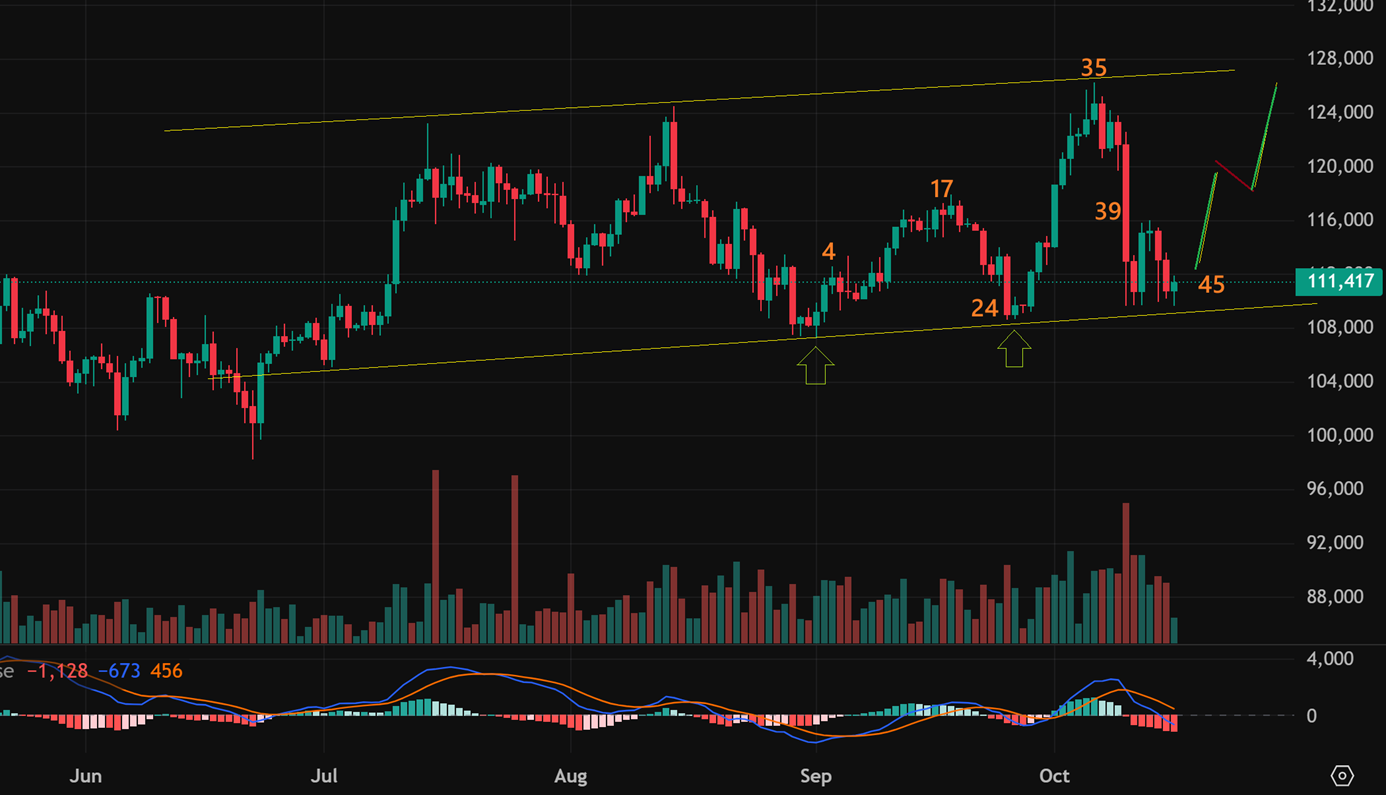
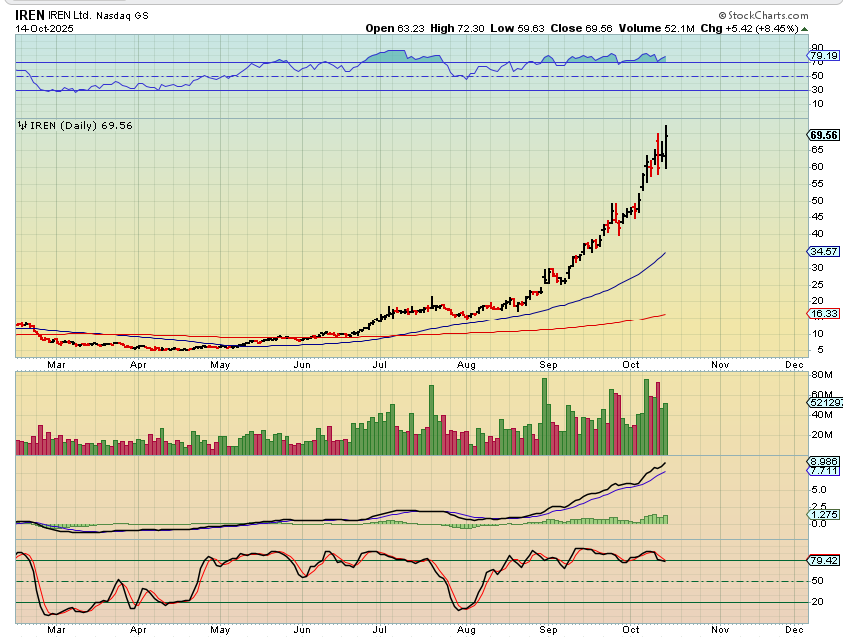
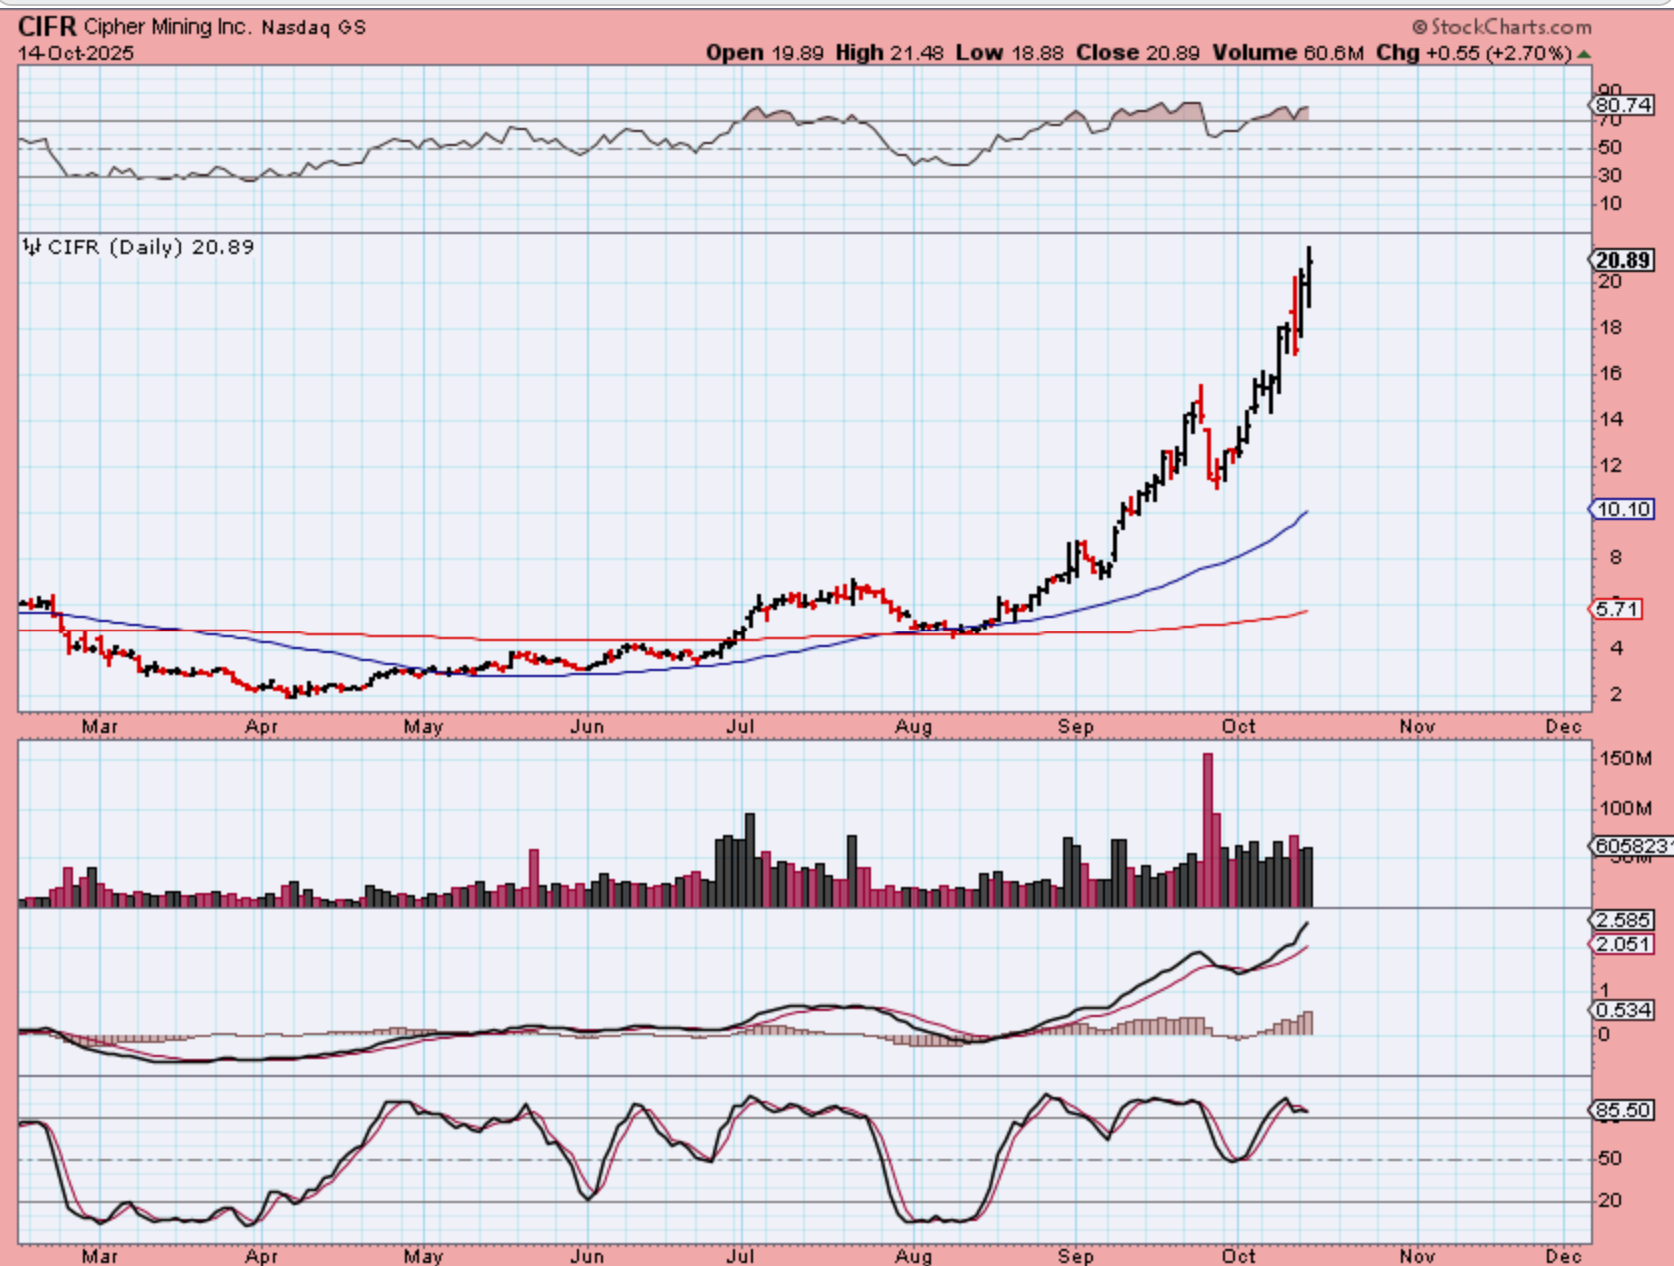
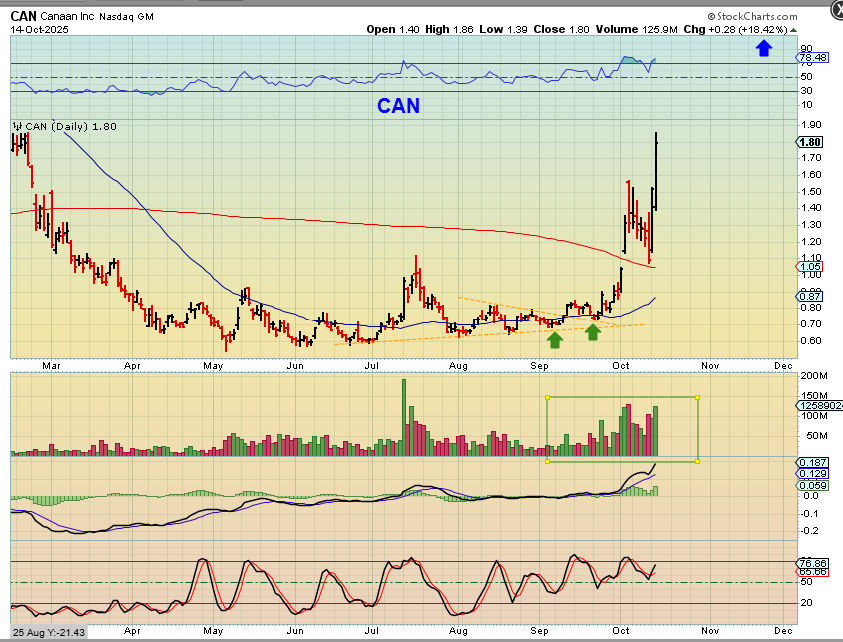
BITCOIN is on day 44 of a possible 60 today, so that is roughly 15 days from today to the next low. We’re running out of time for a strong run to new all-time highs that keeps on running, but we could do another run to the upper trend line. What I want to point out is that over the last 2 days (Monday and Tuesday) We saw Bitcoin sell off at the lows, but Crypto Stocks like CIFR, IREN, BKKT, CAN, HUT, WULF, HIVE, etc have been green on both days…
.
BITCOIN seems to be stabilizing at the lower trendline and it does have enough time left in this daily cycle to make a run to the upper trend line, so I think that we could expect that. Even as it lingers at the lows though, those Crypto stocks are on the run higher!
.
Yesterdays report discussed the strong run in Crypto stocks, and I mentioned a couple of laggers too. So even as Bitcoin lingers at the lows, those Crypto stocks are on the run higher! I posted these charts…
And then you have CIFR & IREN looking like this, so Crypto stocks are still running despite Bitcoin lagging at the lows. If Bitcoin runs higher for day 44 through 56 or so, I imagine this would only help the sector, but then many of these could be parabolic.
.
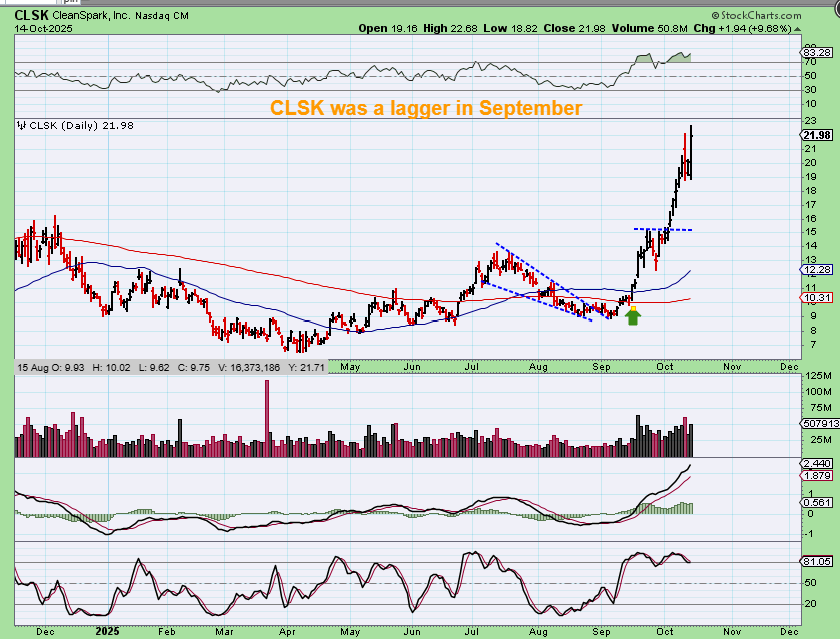
I had pointed out CAN, CLSK, and others as laggers and look what they have done since mid-September.
.
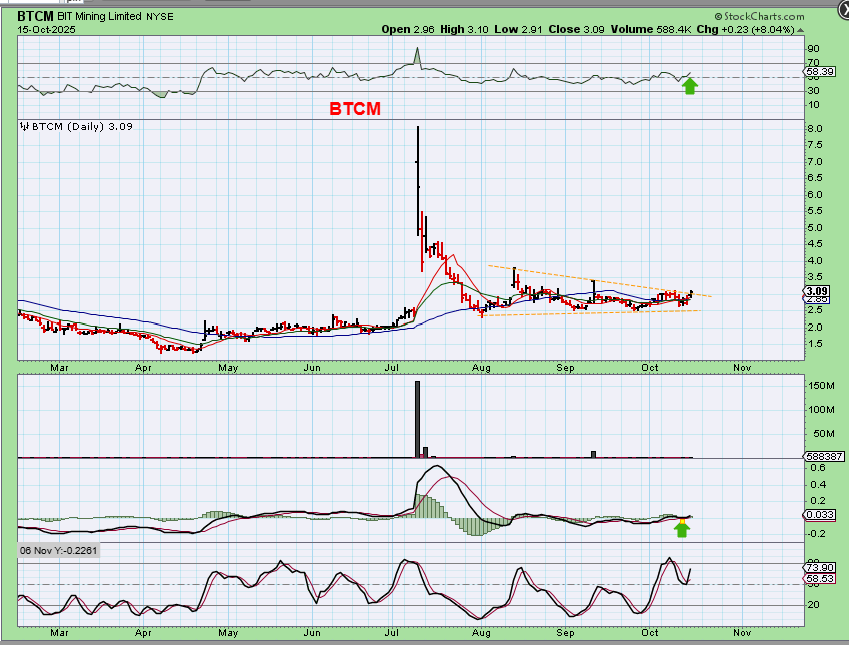
I then mentioned BTCM as a lagger, saying:
BTCM has volume of 295,000 (kind of light) and hasn’t really broken out or popped yet. If it does pop it might be a buy and volume may flood in, but if you buy this right now without a sign of life just because it is a lagger? It may just continue to do what it has been doing from August until now.
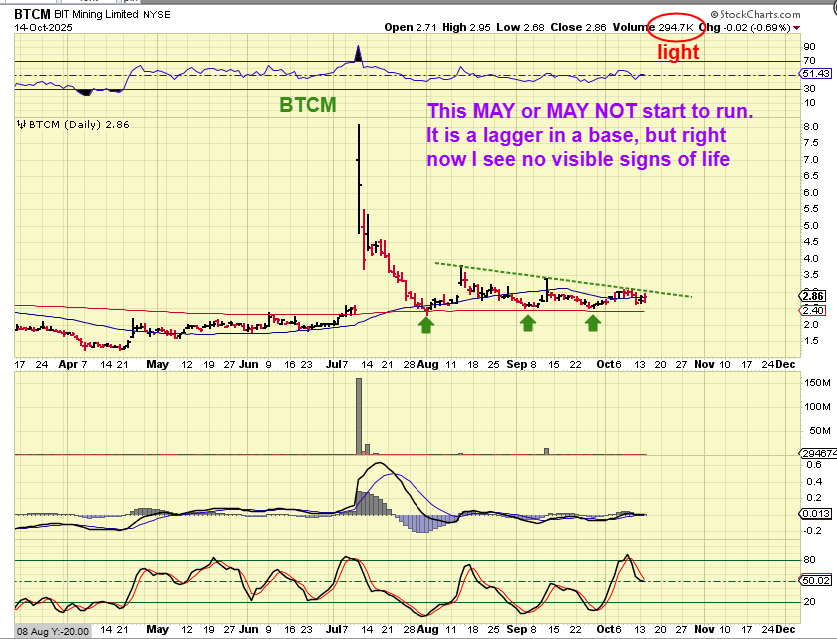
BTCM has now moved up 8% yesterday, so it actually may be ready to run now. We may be seeing signs of life, so it could be bought in this area with the hope that it is starting to break higher with other Crypto stocks.