
October 4th Weekend Report
The last couple of weeks have seen tremendous buying opportunities, with prices surging in a big way in MANY different sectors, and thankfully in MANY of the stocks that I have had in my reports. I will cover that Briefly at the end of the report, simply to boost confidence in the set ups. That will help many just in case this kind of bullishness continues.
Some stocks in my reports, Like RR, LAC, DNA, RGTI, etc., for example, have made 40-60% gains last week alone, and that was on top of prior week’s gains. It has been amazing and rewarding, so we’ll just review a few more later in the report.
.
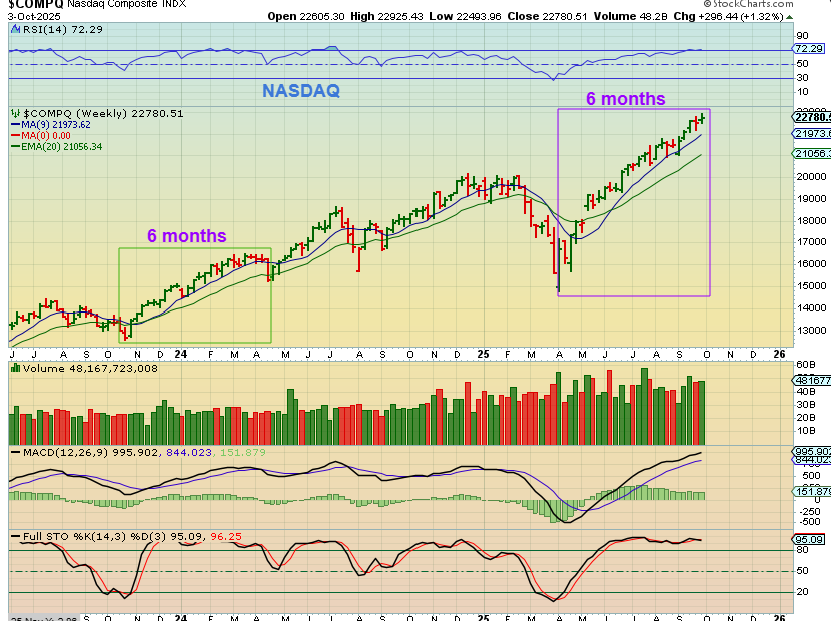
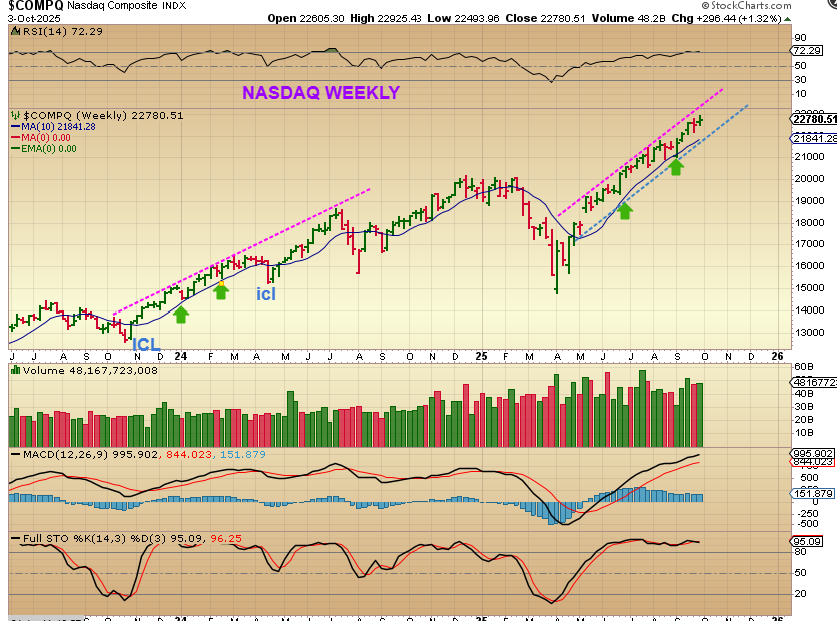
NASDAQ WEEKLY – We usually see a dip into an ICL roughly on average every 5-6 months. You can see that this run has been very strong, it has never broken the weekly 9 ma, and it is 6 months long at the all-time highs.
.
So THE NASDAQ has been running very strongly and that can continue.
Take a look at that 2nd blue ICL dip in 2024. It was really just 3 sideways red weeks on the 10 week ma, and then a sharp 1 week drop, right? I was thinking that MAYBE we’ll see more of a pullback like that (1-2 week slam down) at the next Fed Mtg if we don’t see a rate cut? We’ll have to wait and see. Oct 29 is the next Fed Mtg, so the rally can continue.
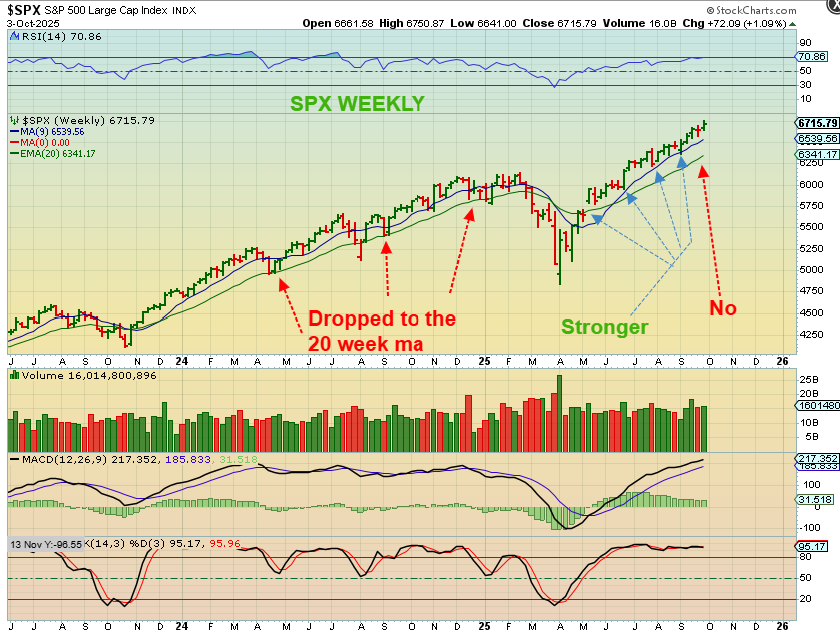
I also noticed that when you look at The SPX Weekly chart,
In 2024 The SPX dropped to the 20 week ma from time to time. That has not happened since the April ICL, so the next ICL may even take us down there.
.
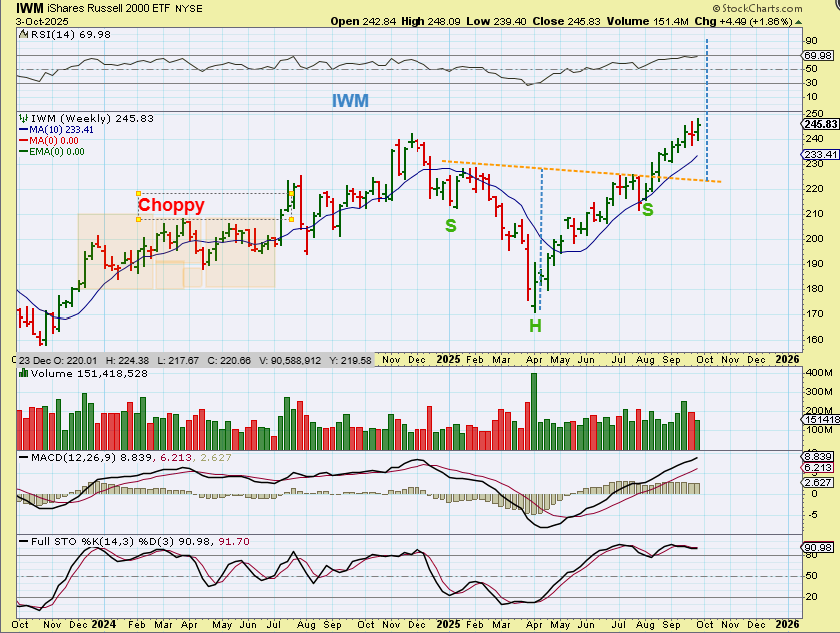
I also took note of the big difference between small caps coming out of that low in late 2023-2024 and now.
You can see that The IWM moved up and then became very choppy and moved sideways in most of 2024. Coming out of this recent ICL, the IWM has rallied very strongly too. We are seeing small caps running strongly now and the IWM is now at all-time highs too.
.
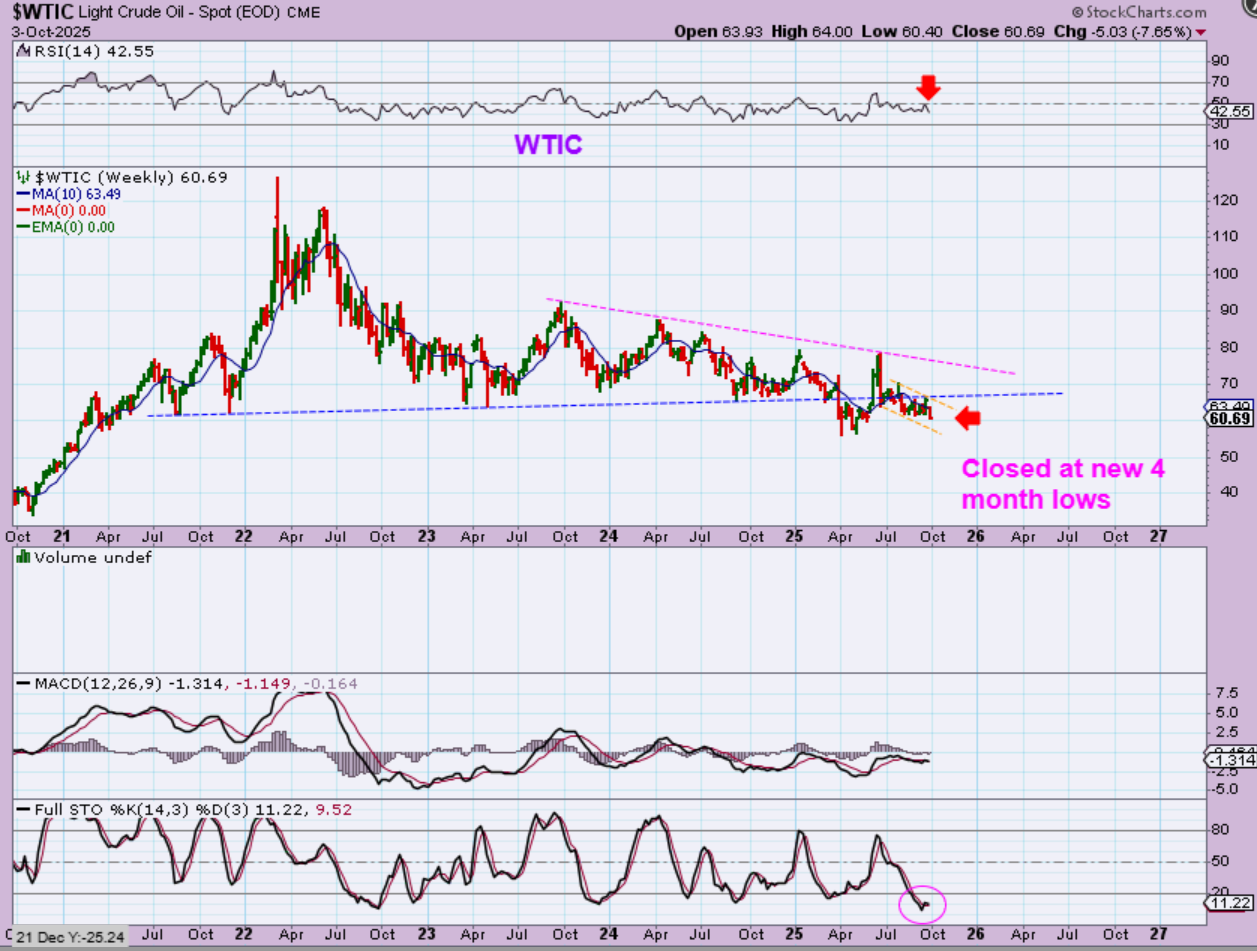
WTIC – Oil has remained under the long-term trend line for a while, and this week it broke below the lows of the last 4 months. This would indicate that we are dropping into an ICL. The Oil stocks are barely affected by Oils lack-luster performance and that MIGHT be an indication that Oil will bottom and rally out of that ICL. For now we conclude that Oil is choppy and weak.
.
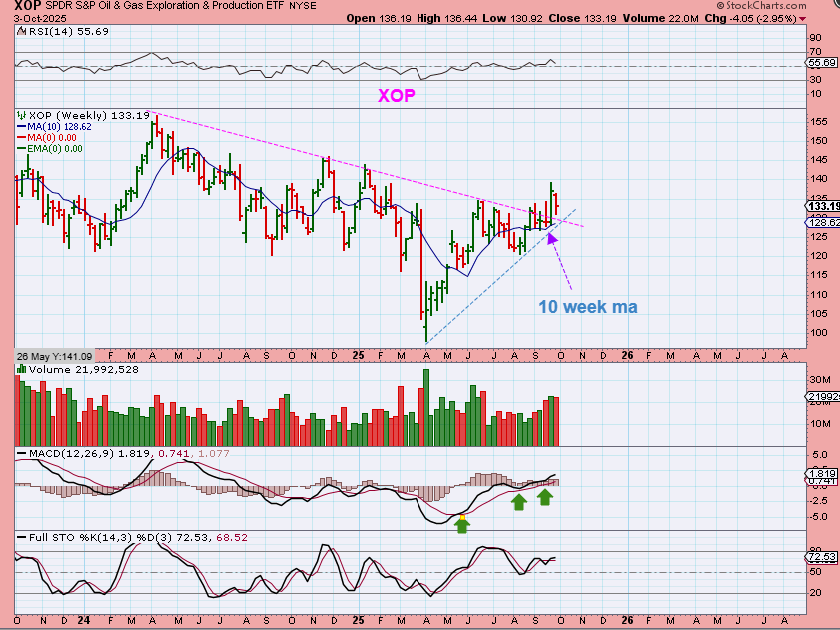
XOP WEEKLY – Oil stocks, as seen in recent reports, are not choppy and weak, but they are a little choppy. In recent reports I pointed out that many Oil stocks (WTI, PUMP, VET, APA, etc) look bullish, so how can that be? Well her we see that Oil stocks broke out in September and may just be doing a back-test when oil drops into that ICL. When Oil puts in a final low (ICL), these may rally more swiftly.
.
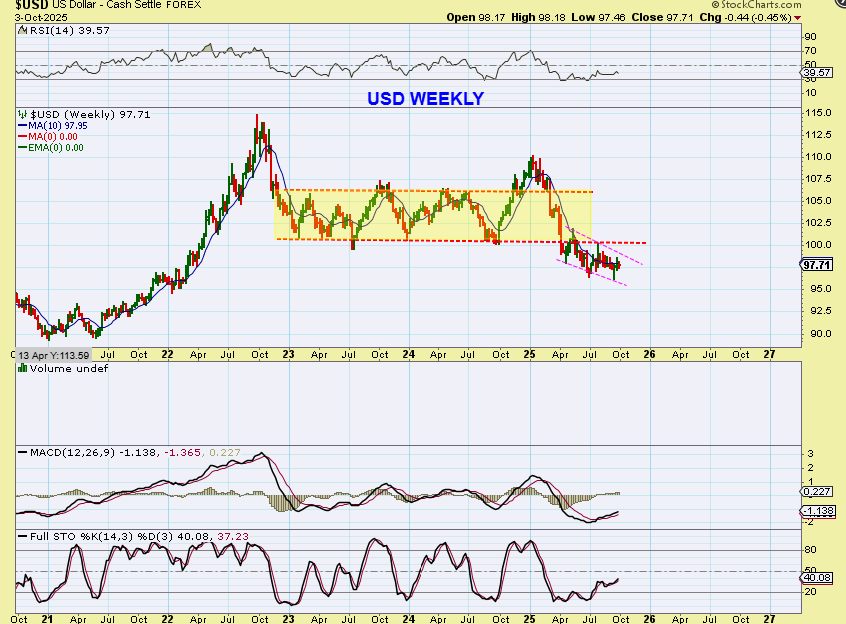
THE USD has not recovered from the 2025 breakdown, and it has simply been chopping lower and lower with each mini rally attempt. This price action has barely affected Gold, Silver, and the Miners, but the Dollar has been chopping lower. Notice that the USD has bounced out of the lows for the last 3 weeks, so has Gold dropped over the last 3 weeks?
.
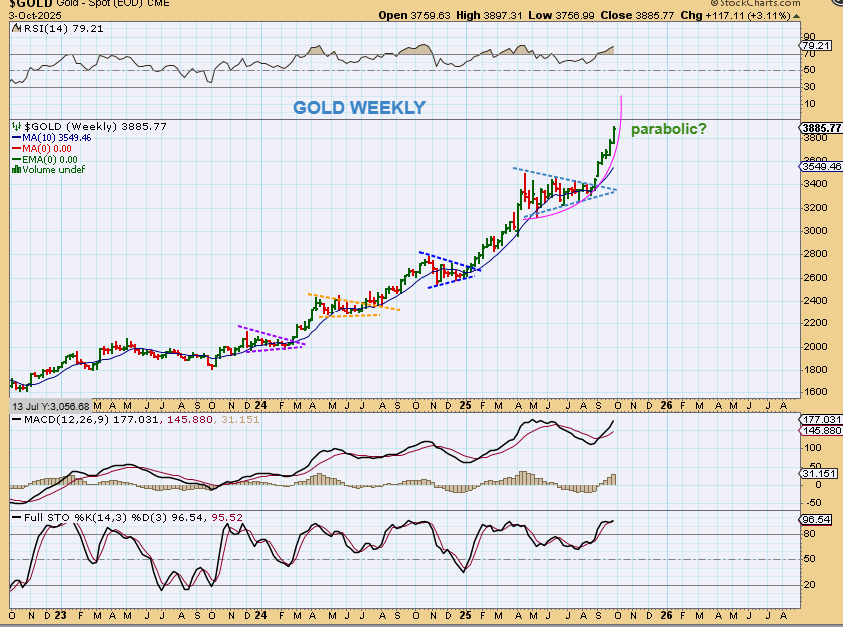
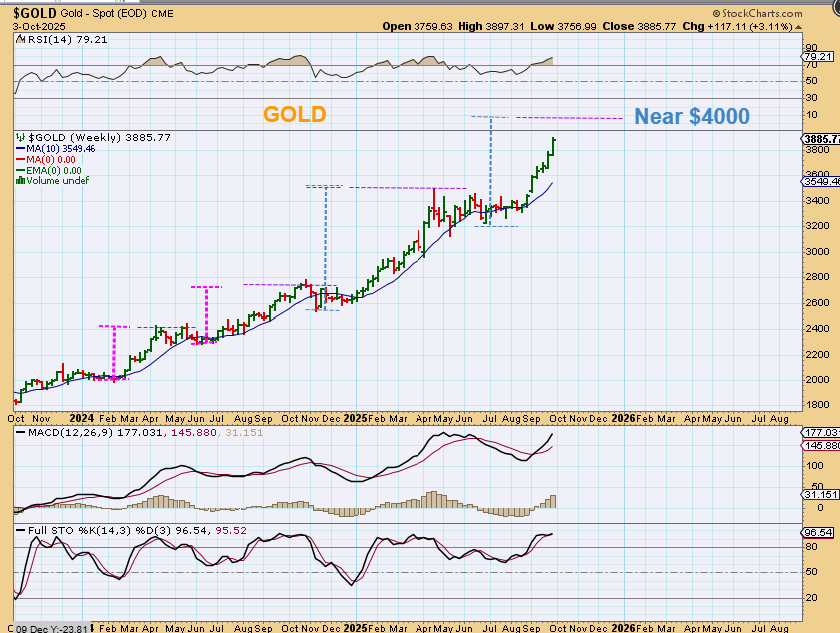
GOLD has NOT dropped over the last 3 weeks, it is in fact very strong and hit all-time highs of $3897. I’ve been thinking that it could run to that nice round $4000.00 number and then sellers/ profit takers may start to sell (unless we just continue on a straight up parabolic move).
.
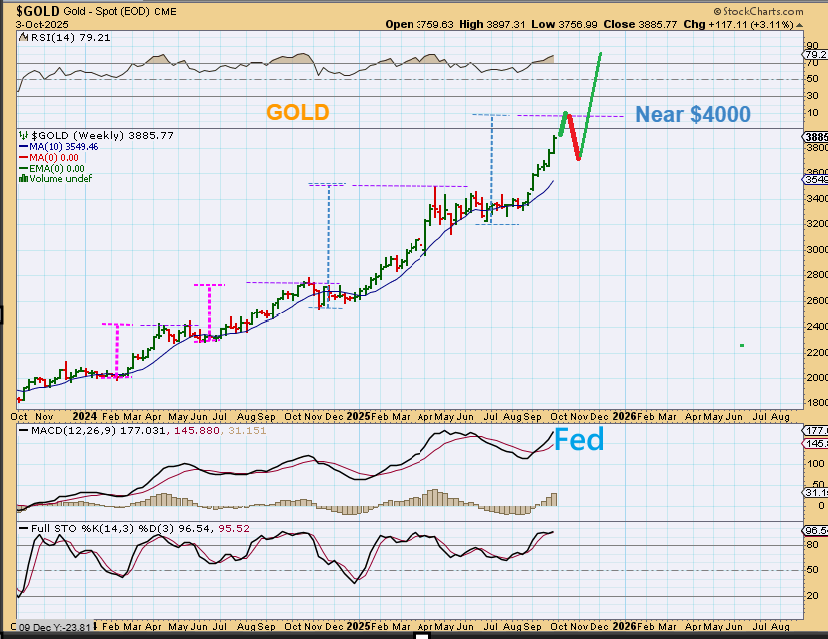
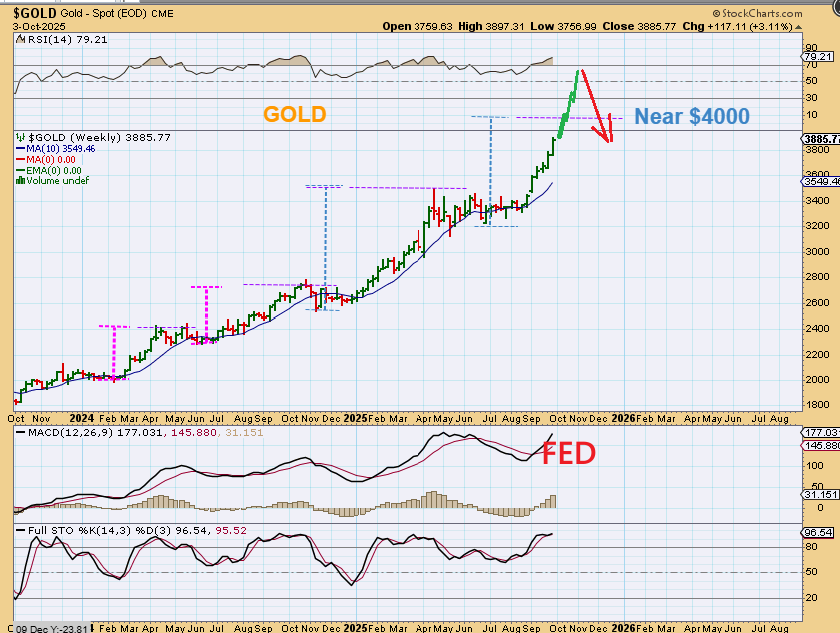
GOLD – Taking a look at measured moves, that $4000 area is roughly a target on this run. It would be reasonable to tag that area, drop lower into an ICL, and then start running again at the next Fed Meeting on Oct 29. So…
,
1. It would be reasonable to tag that $4000 area and then drop into an ICL for the Oct 29 Fed Mtg, and then start running again toward $5000 after that Fed Meeting on Oct 29.
,
2. Another thought is that Gold is so overly exuberant ( I do see T.V. commercials and other areas advertising to buy gold now), that it just keeps running higher into the Fed Mtg, maybe up to $5000 as it really stretches out, and then drops after ‘no rate cut’ is made.
.
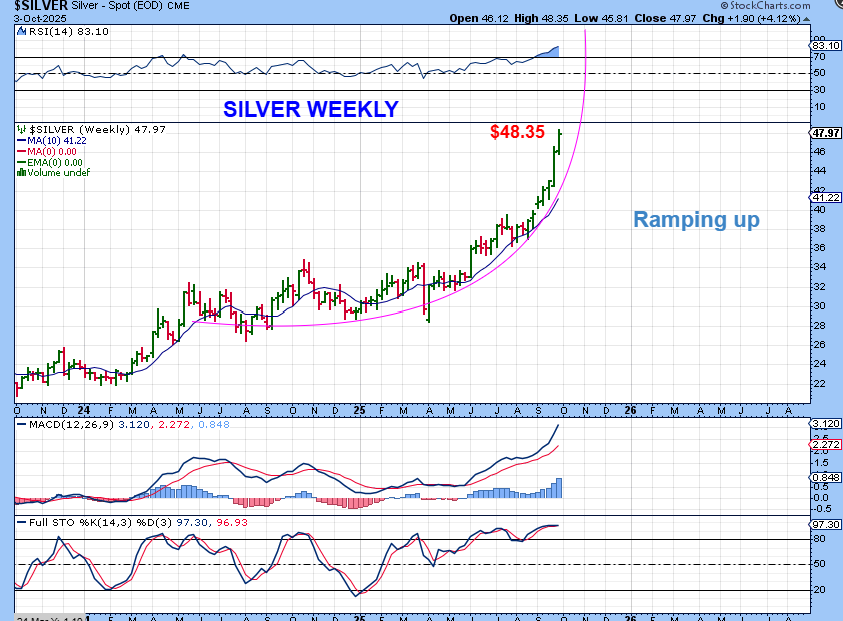
SILVER is now really ramping up too, and this scenario is what was also seen as a possibility. A parabolic move can ignore rules of ‘normalcy’ and just gets over heated and overly exuberant too. We were entering a 4th daily cycle when Silver started to get really strong and now we see 7 straight weeks higher. Though it is rare, these kinds of moves (if going parabolic) can defy a cycles normal anticipated count. We are also near the former $50’s area, but this can blast beyond that before pulling back too.
.
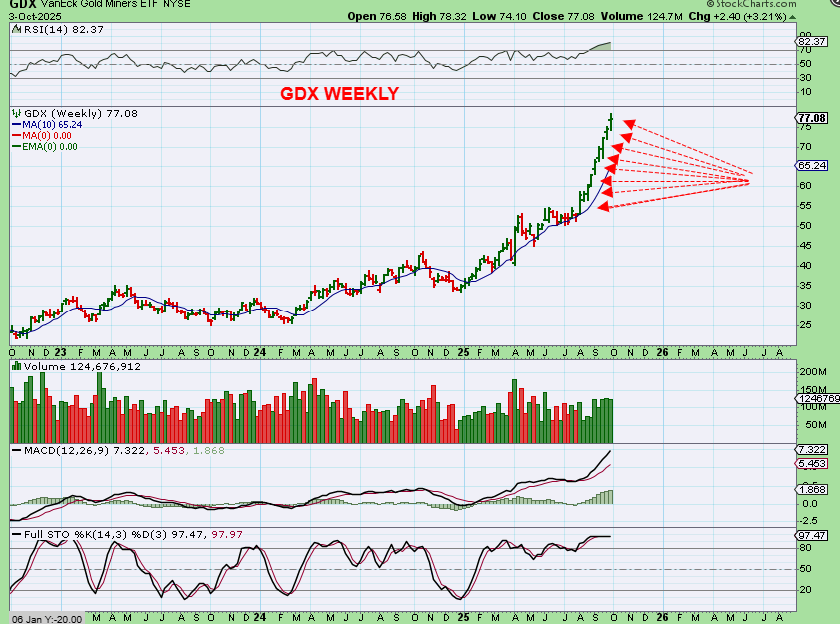
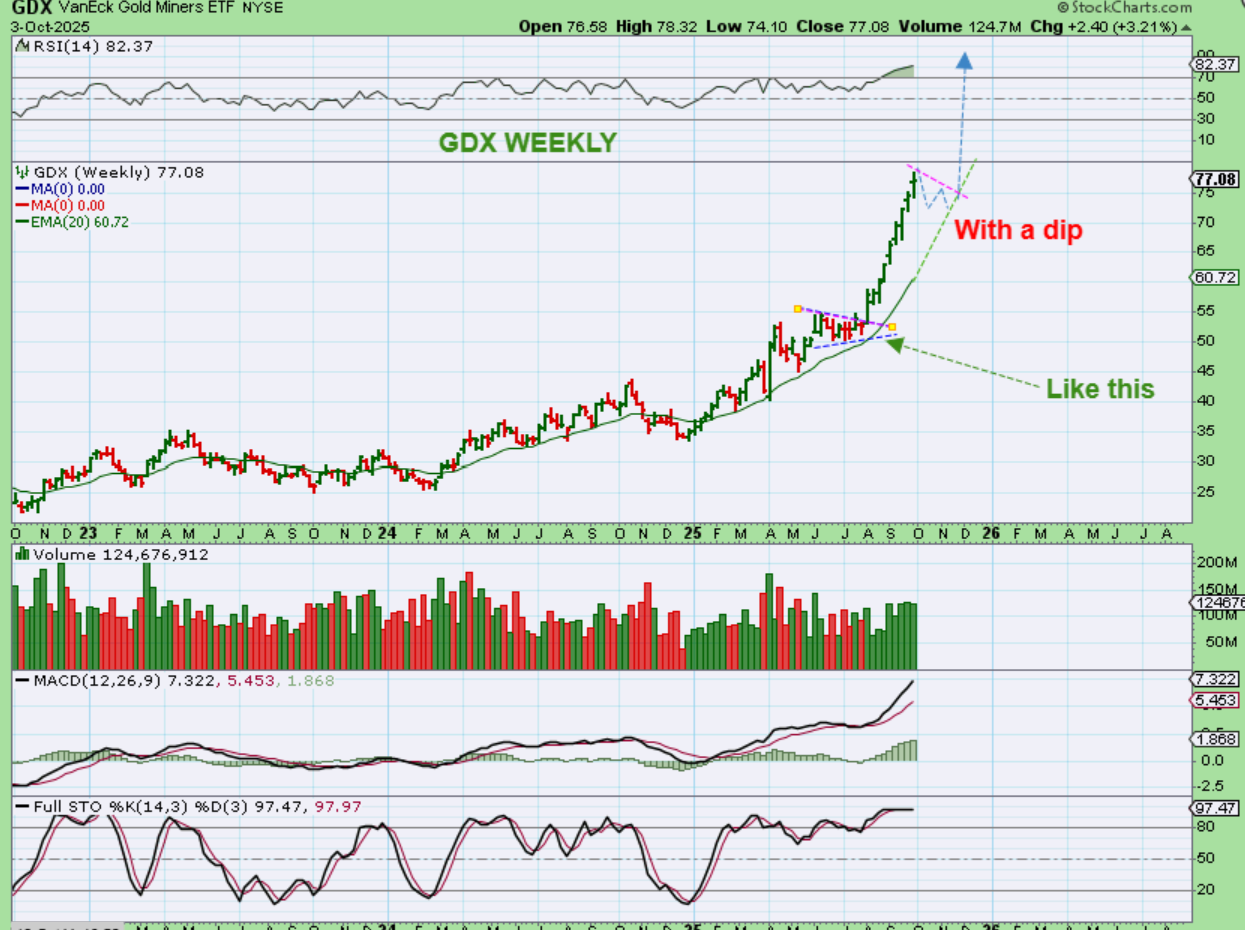
GDX – 9 straight green weeks in a row! This week I said that I saw a gravestone doji on the daily charts, which is often signaling that a pullback is coming. The weekly chart also has a topping candle (Spinning top candle), so we may see a peak and a pullback in October, up to the Fed Mtg on Oct 29th.
.
THE GDX pullback may just be a choppy bull flag or pennant pattern when the selling is all said and done.
.
So Now I just want to briefly run through a few charts of the kinds of gains that we are seeing in the stocks picks from the reports. I don’t want to spend too much time on it, but this helps us to see that some of the ones that popped CAN still run even higher, and also the ‘laggers’ that are set up bullishly, may Pop and put in a strong run like these too. Let’s do a quick review….
.
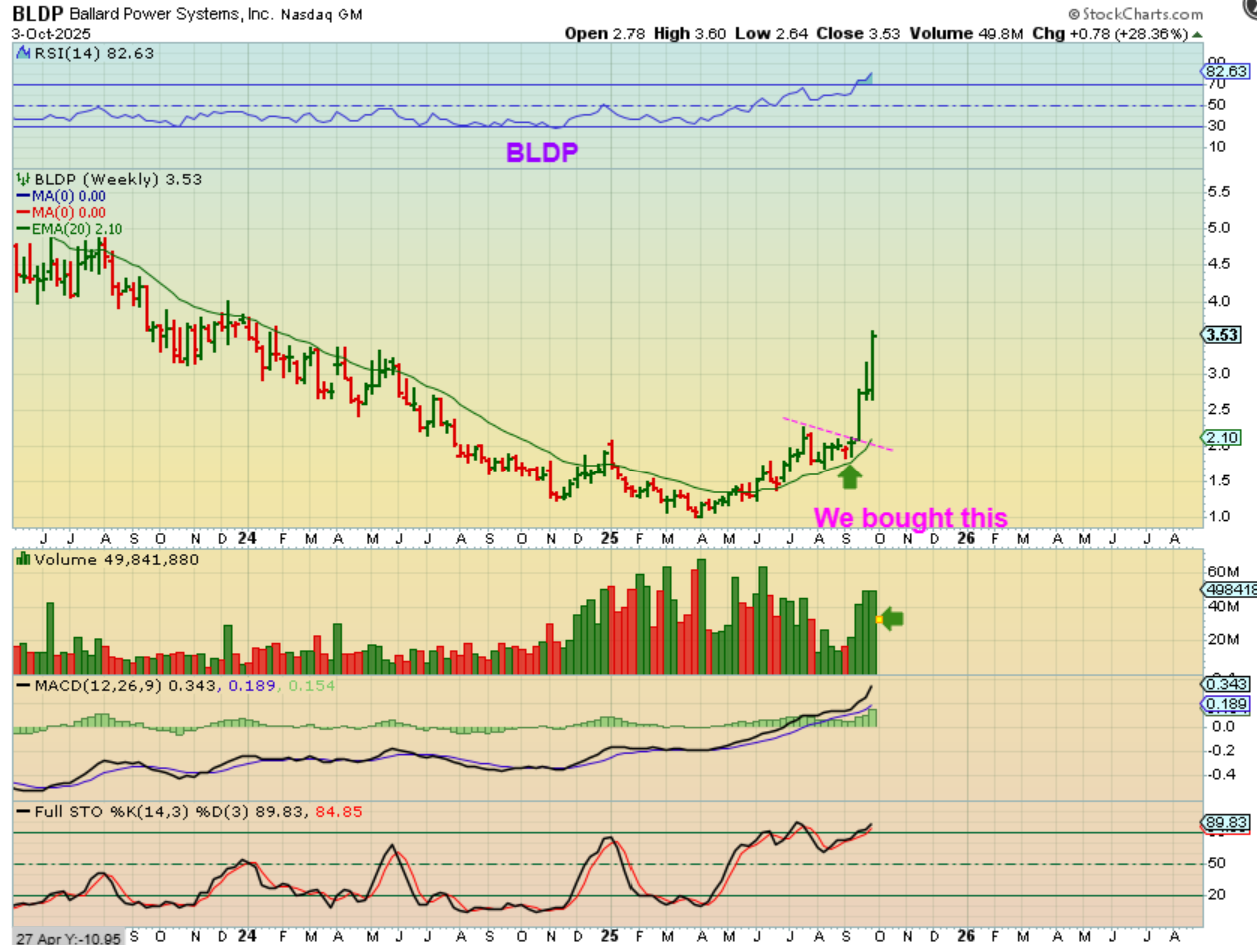
I actually had BLDP in the reports 3 weeks ago after PLUG popped from a consolidation, and it was up 43% that following week alone. This week it was up 28% too, so this is showing us that these can POP and still run even higher, so the buy and hold-or selling a portion on the larger Pop and letting some ride is working out.
.
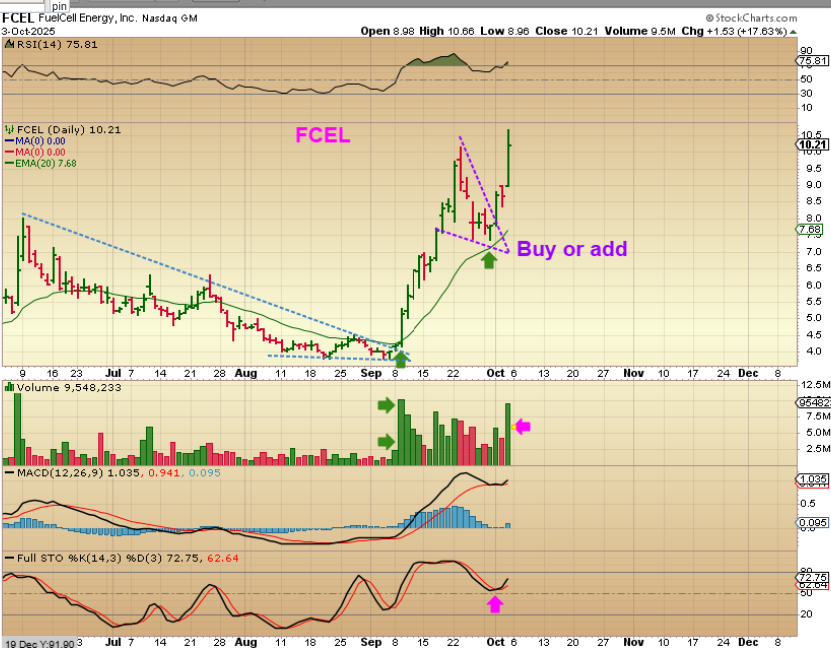
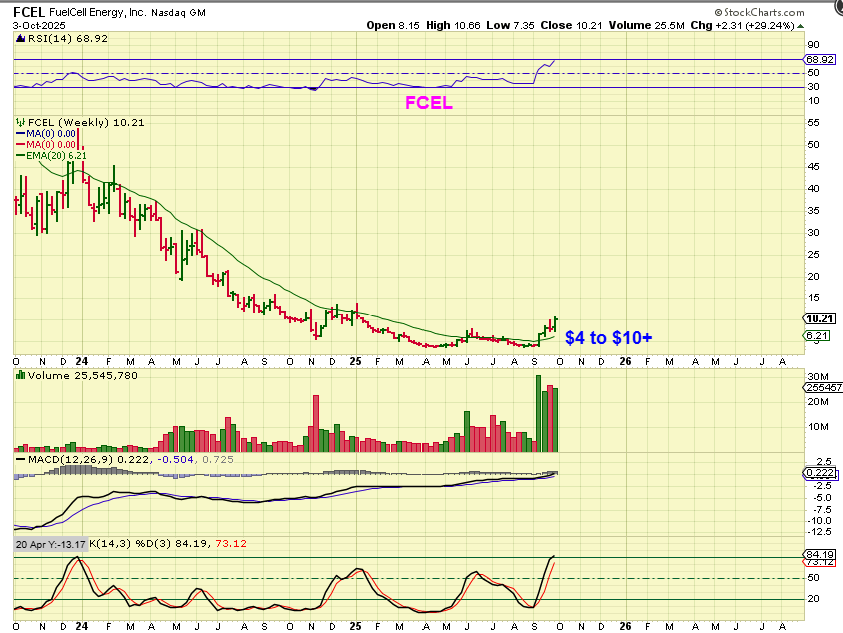
FCEL has been flying, and we’ve made great gains on this one twice, but you almost wouldn’t know it from the weekly chart.
.
FCEL has been flying, but you almost wouldn’t know it from the weekly chart. That said, FCEL jumped 60% on that first week higher and it was also up another 29% last week alone. Wow. It has moved from roughly $4 to $10. This chart makes it look work holding some for a while if ‘buy and hold’ is your style.
.
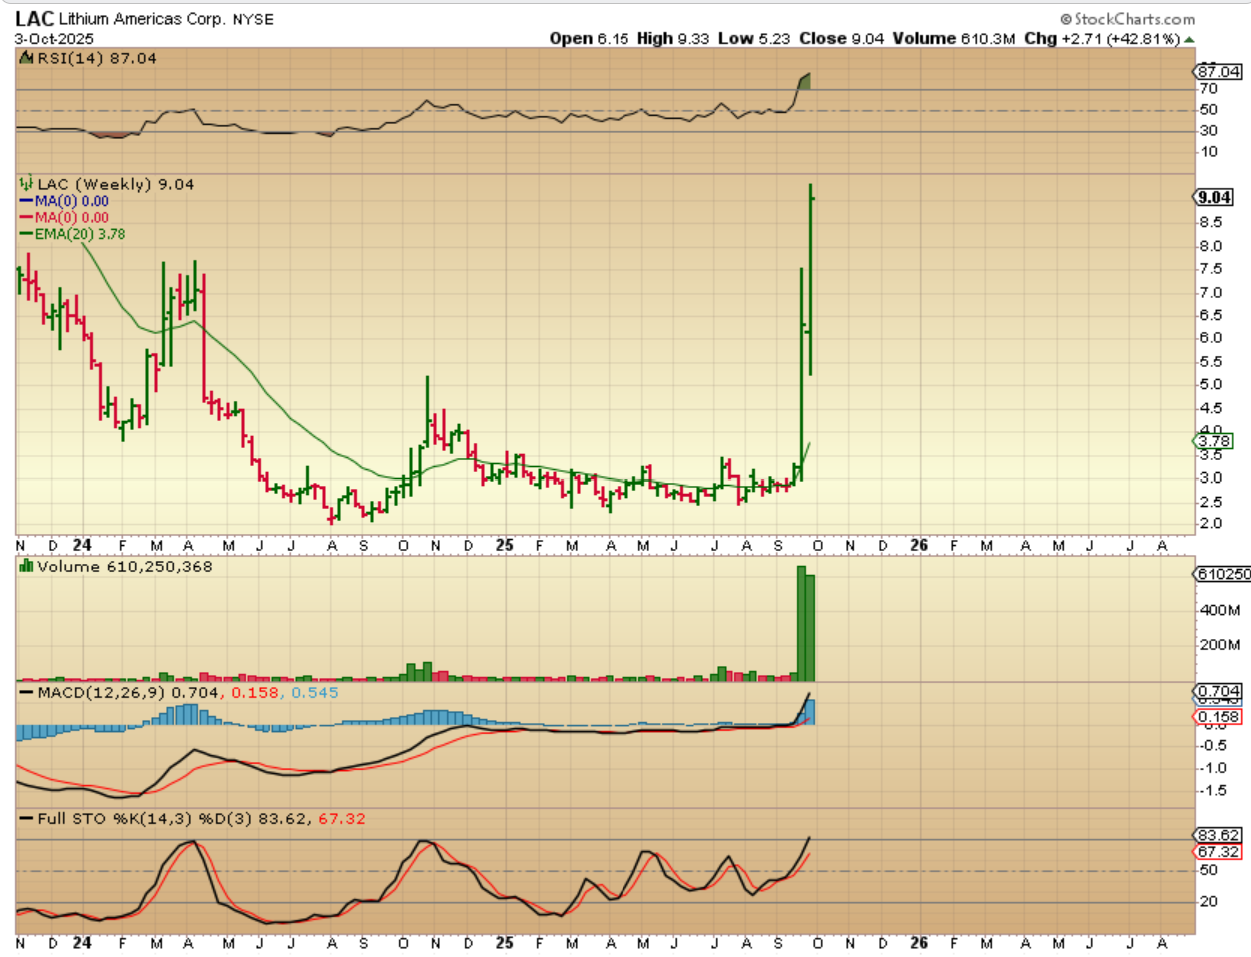
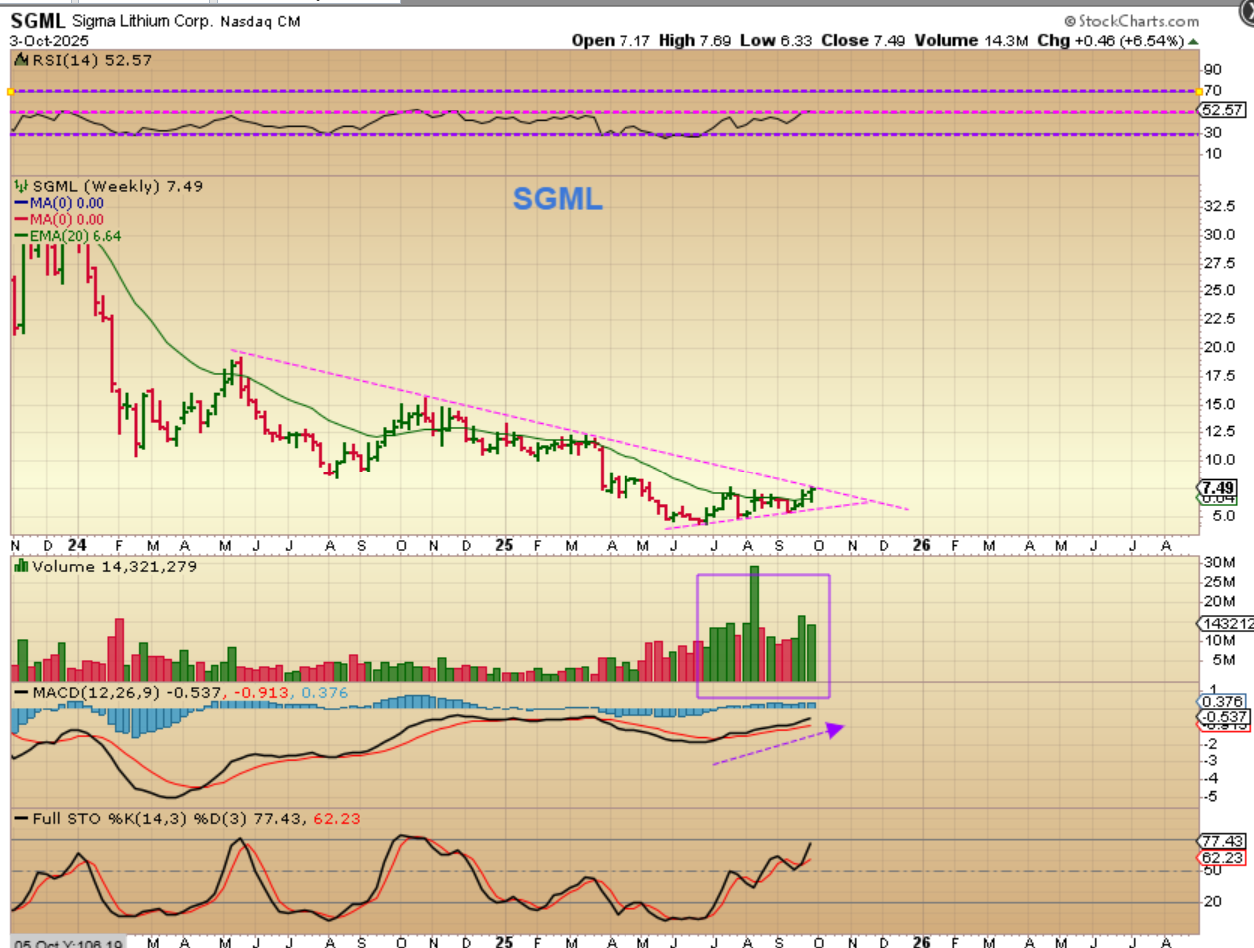
LAC (& SLI) are Lithium stocks that are flying too. I owned it, but I sold mine too early, but it went on to tack on another 42% this week! Amazing! SLI has moved up 33% in the past 2 weeks too. With that, I pointed out SGML, a Lithium stock bullishly set up that has not quite caught on fire yet…
.
SGML WEEKLY – you can see that this looks ready to go, so I had this in the reports this week and it is up 6.54% for the week, but if it does what LAC & SLI did, you may want to own some. It looks ready to break the trendline next week. LOOK AT THE VOLUME.
.
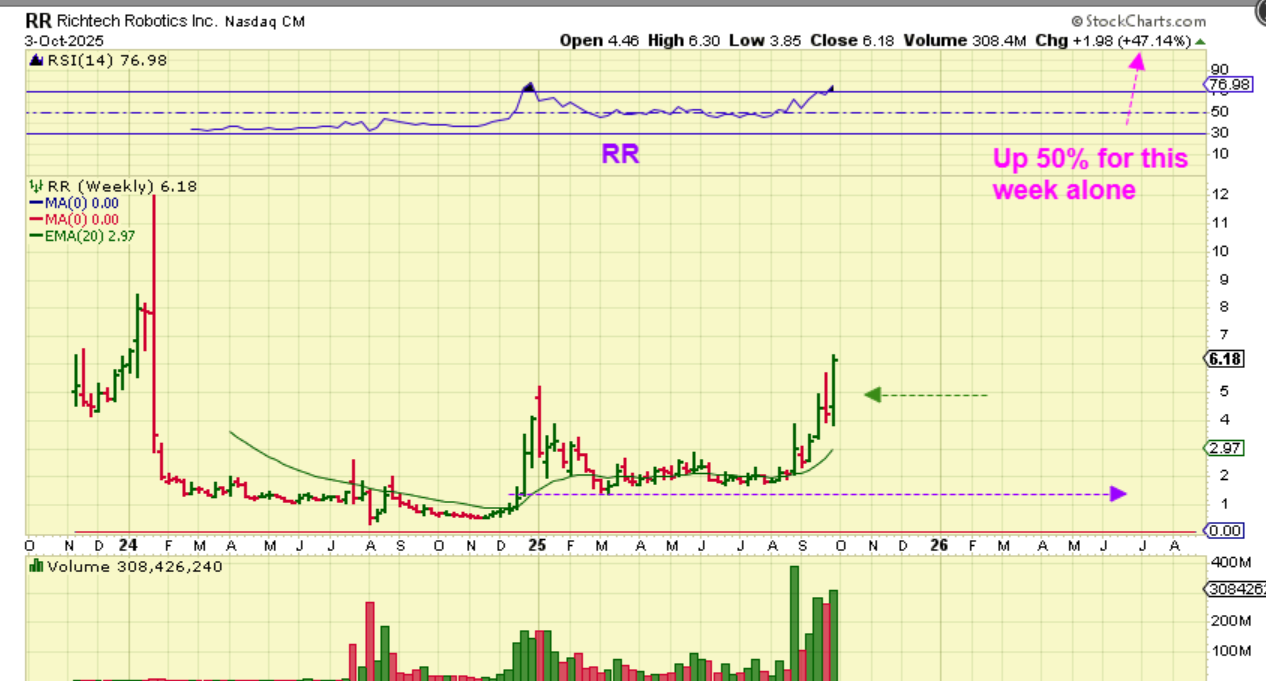
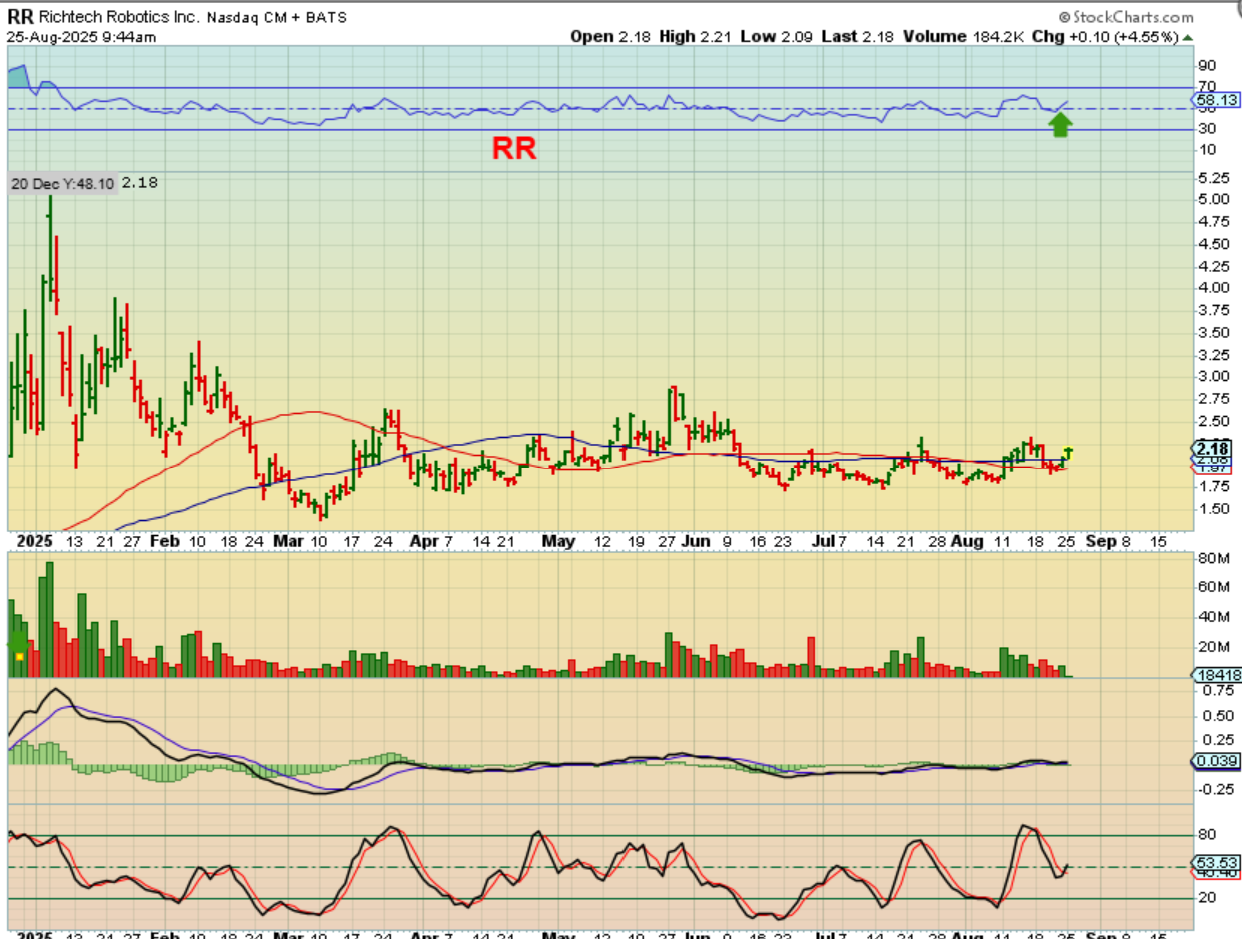
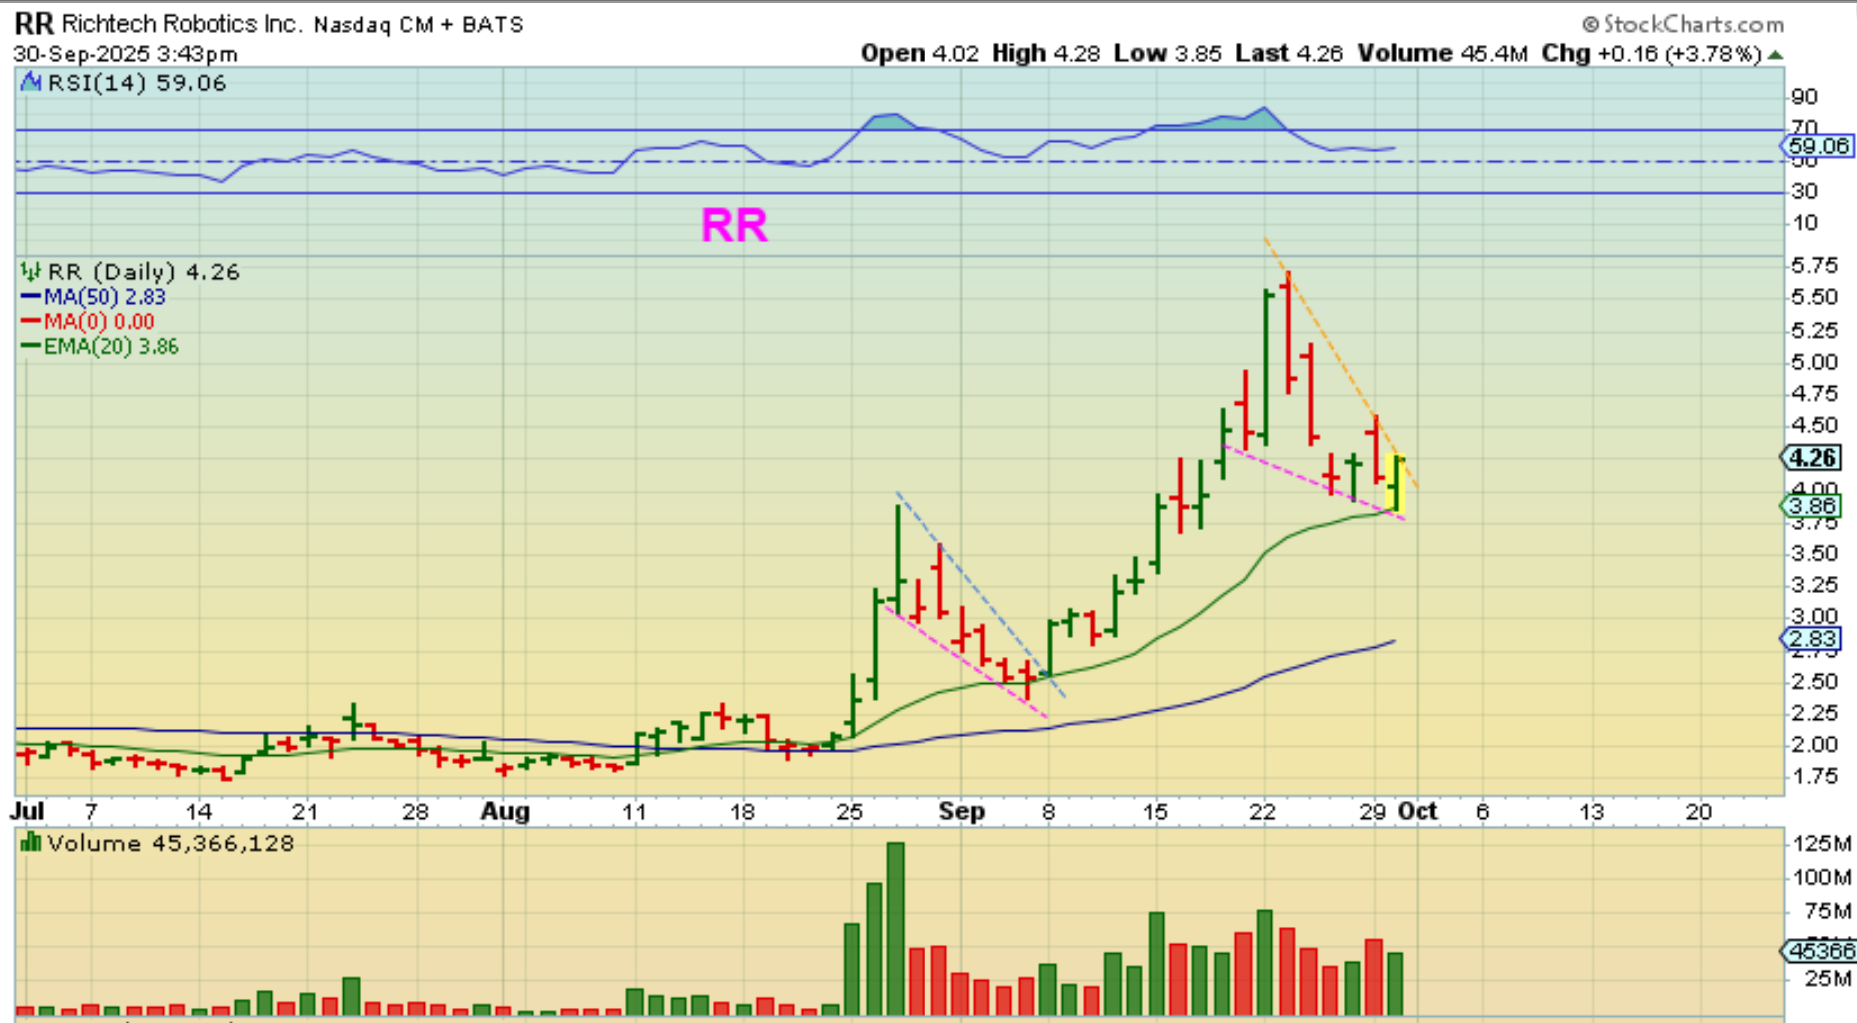
RR had a very long base and was a buy in a few of my reports in this area as it crossed the 50 & 200sma…
.
RR ran swiftly, pulled back forming a bull wedge, and then ran swiftly again. It keeps forming bullish wedges on the pull backs to support, so I pointed this out last week as a buy and I re-bought it.
.
RR was up about 50% this week.
.
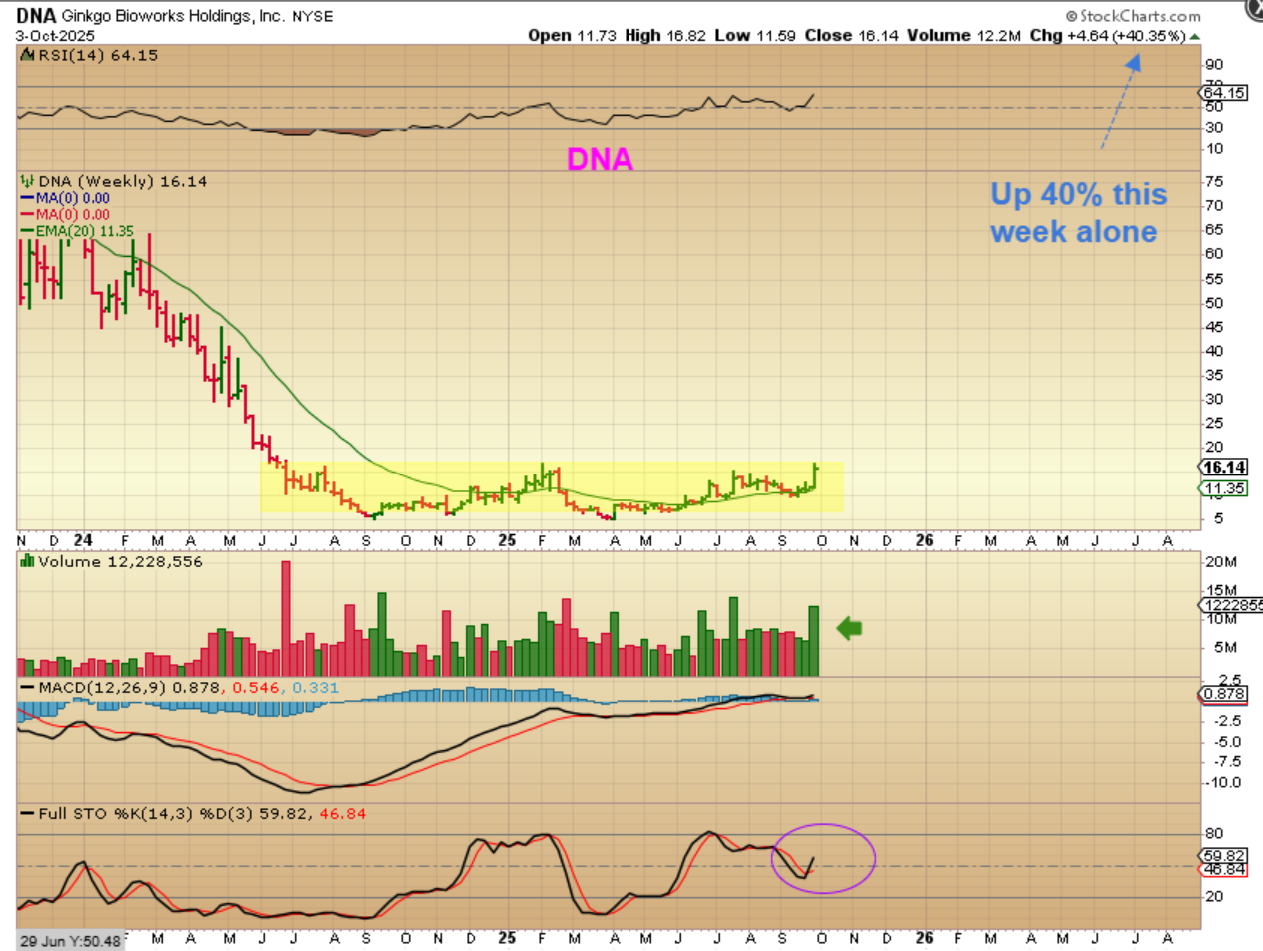
DNA was up another 40% this week, and this was a buy or buy & hold weeks ago-I had it in several reports saying that I really liked the way that it moves. This chart makes it look like it has a lot of upside to offer over time. Biotech stocks can be tricky longer term though, if they fail and the FDC rejects them, etc.
.
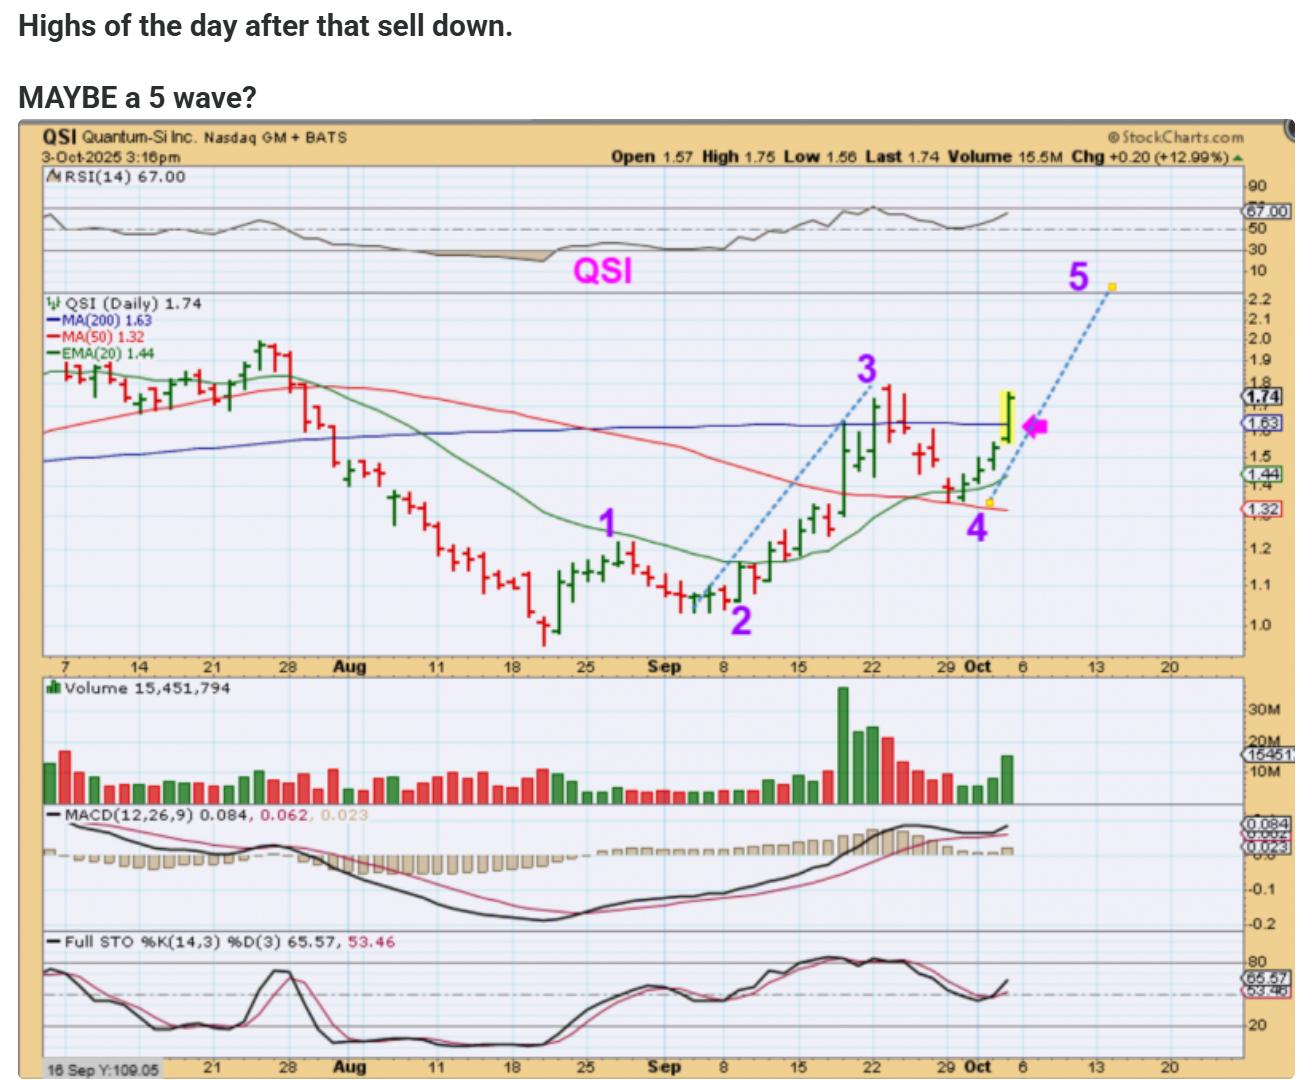
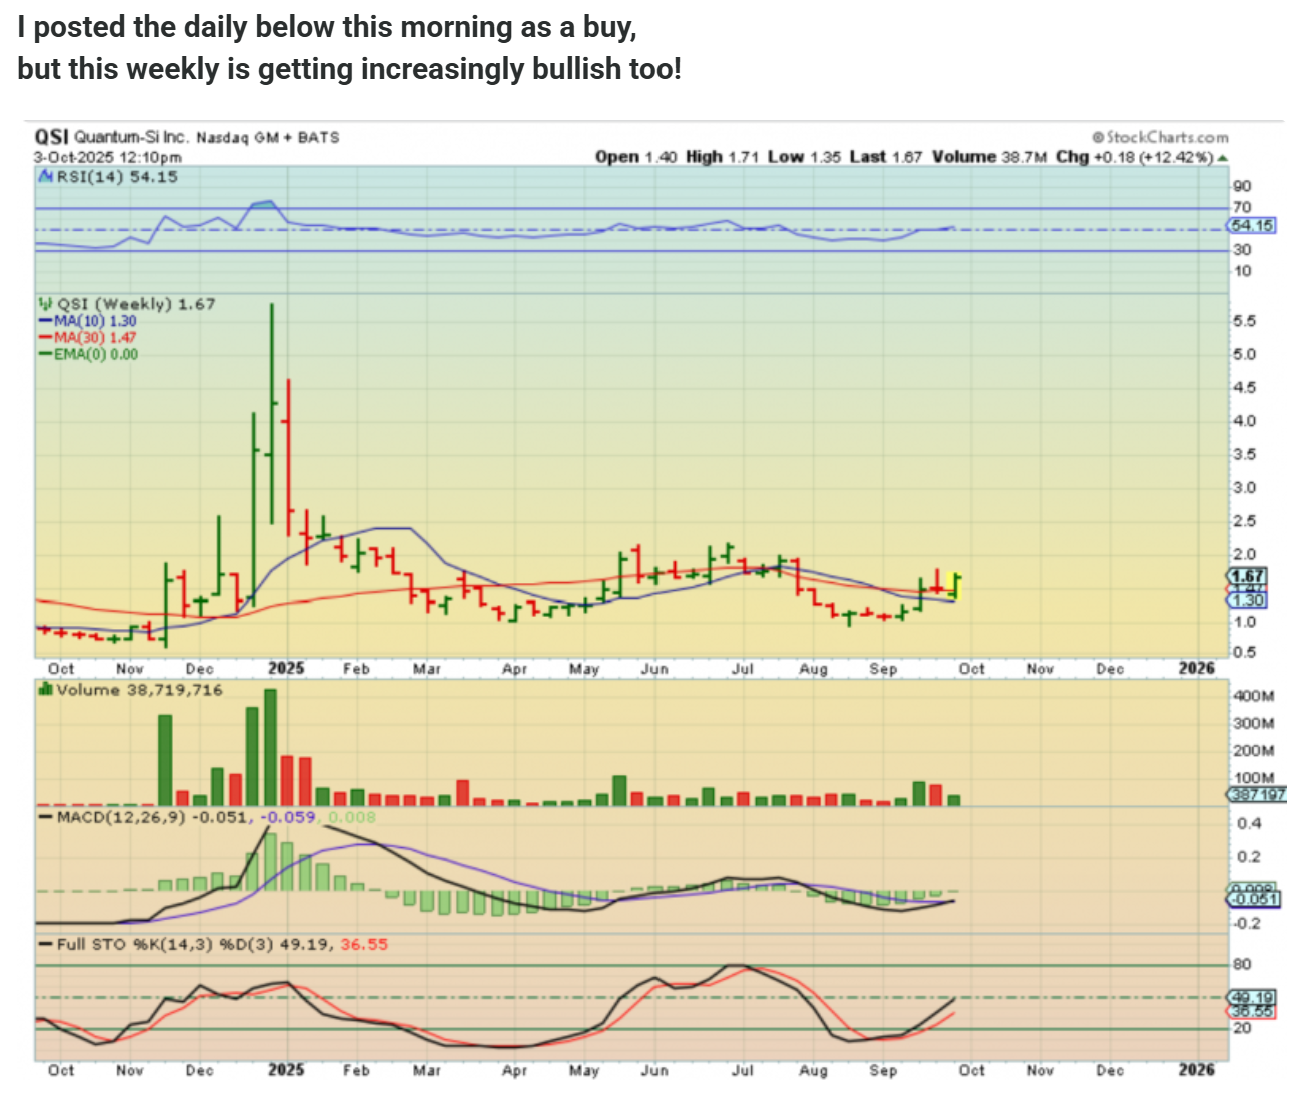
QUANT STOCKS HAVE BEEN ABSOLUTELY EXPLOSIVE (RGTI, QBTS, QUBT, ARQQ,IONQ, etc. QSI is a bit of a lagger, so I put it in recent reports and I posted this in the comments to show upside potential:
QSI –
.
.
And then later I posted this weekly chart. It gave me a WOW moment, after I saw what the other Quant stock weekly charts have done. If this plays catch up, it can Fly.
QSI –
.
.
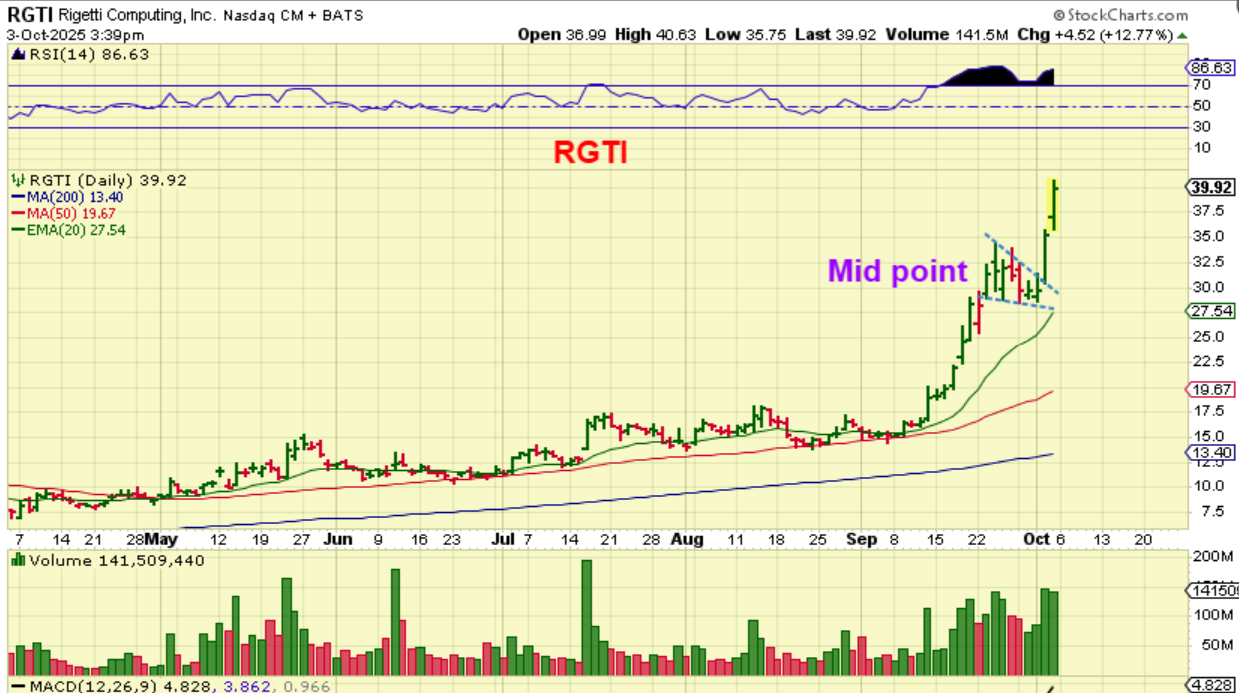
FOR EXAMPLE:
RGTI rallied from the base, then it formed a bullish pennant, and that was a buy point for another run. It broke to new highs and kept going. It also may be a mid-point consolidation that will see price continue to run higher, so…
.
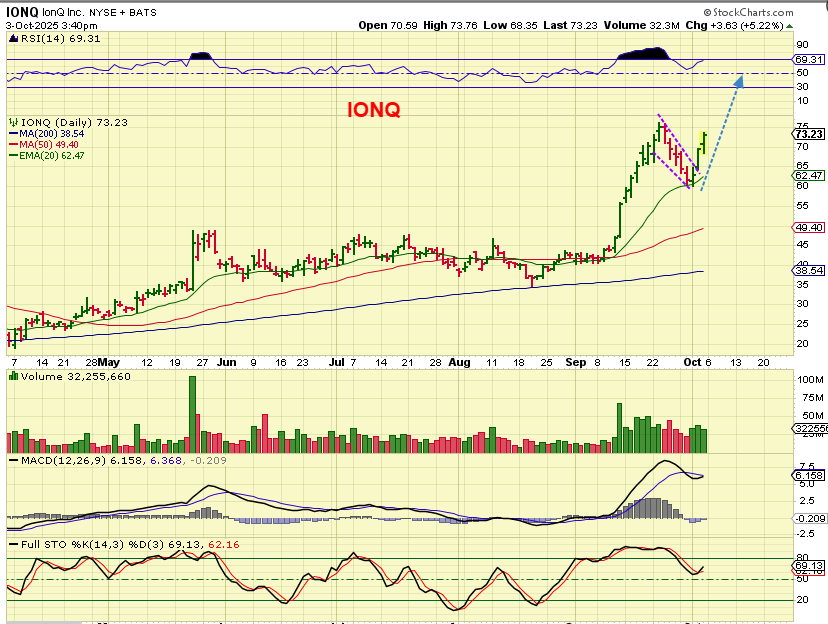
So this is IONQ right now. It was a buy at the 20ema too, but doesn’t it look just like RGTI as it ran toward new highs? I think that IONQ can run like RGTI and make new highs and more. ALSO…
.
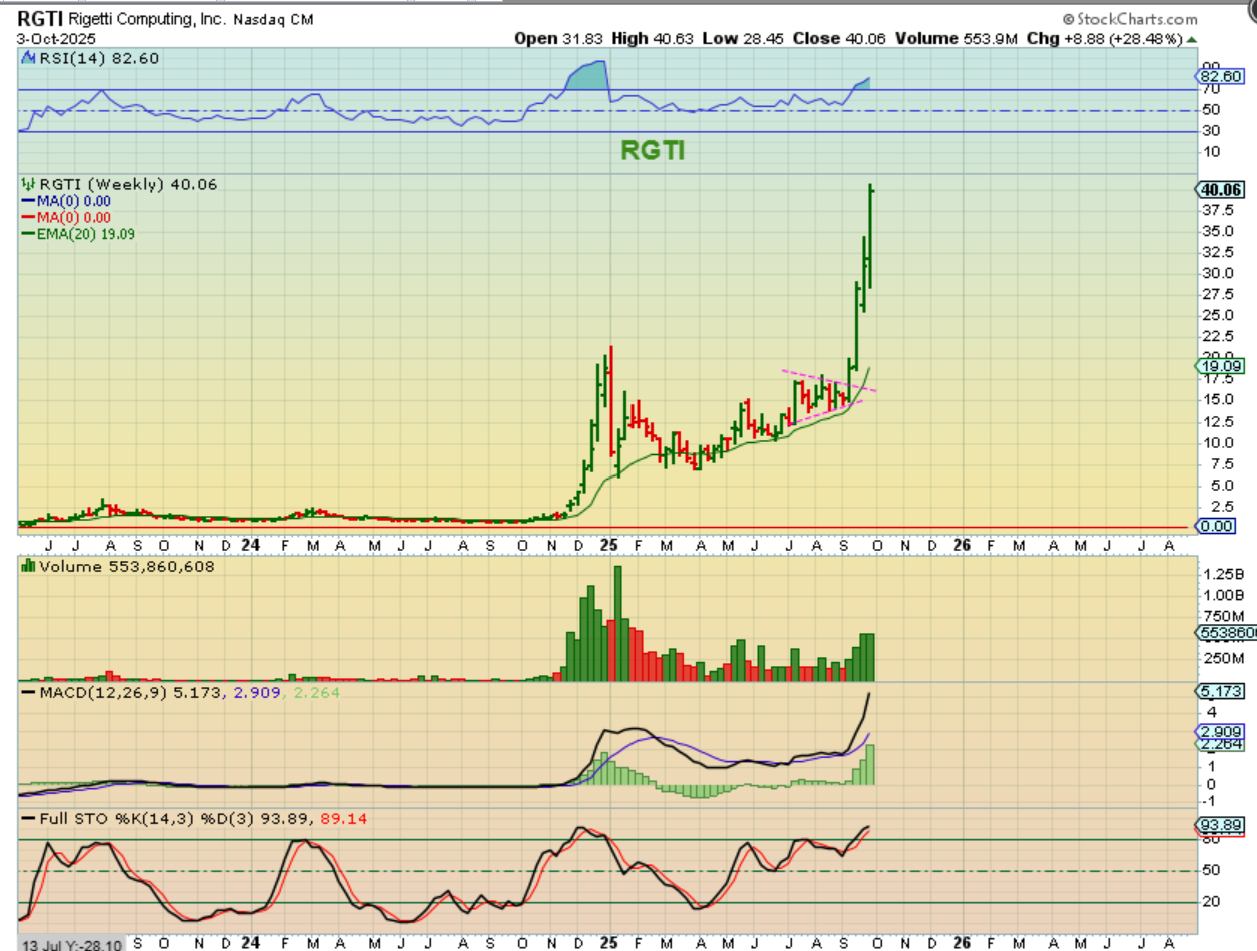
THE WEEKLY CHART FOR RGTI IS PRETTY RIDICULOUS!
These straight up rallies are usually not sustainable, but RGTI was up another 28% and has been running for 4 weeks out of a consolidation. Quants are on fire, so that QSI is looking pretty promising.
.
All of the bullish sectors that I have been discussing continue to remain very bullish. Even with the recent pullbacks, the moves out of those lows is fast and furious. They call it a bull, because it tries to knock you out of your positions, but so far the gains have been very rewarding, and the ride hasn’t been all that bad at all.
I’ll continue to cover everything in the daily reports, enjoy your weekend everyone!
.
~ALEX
.
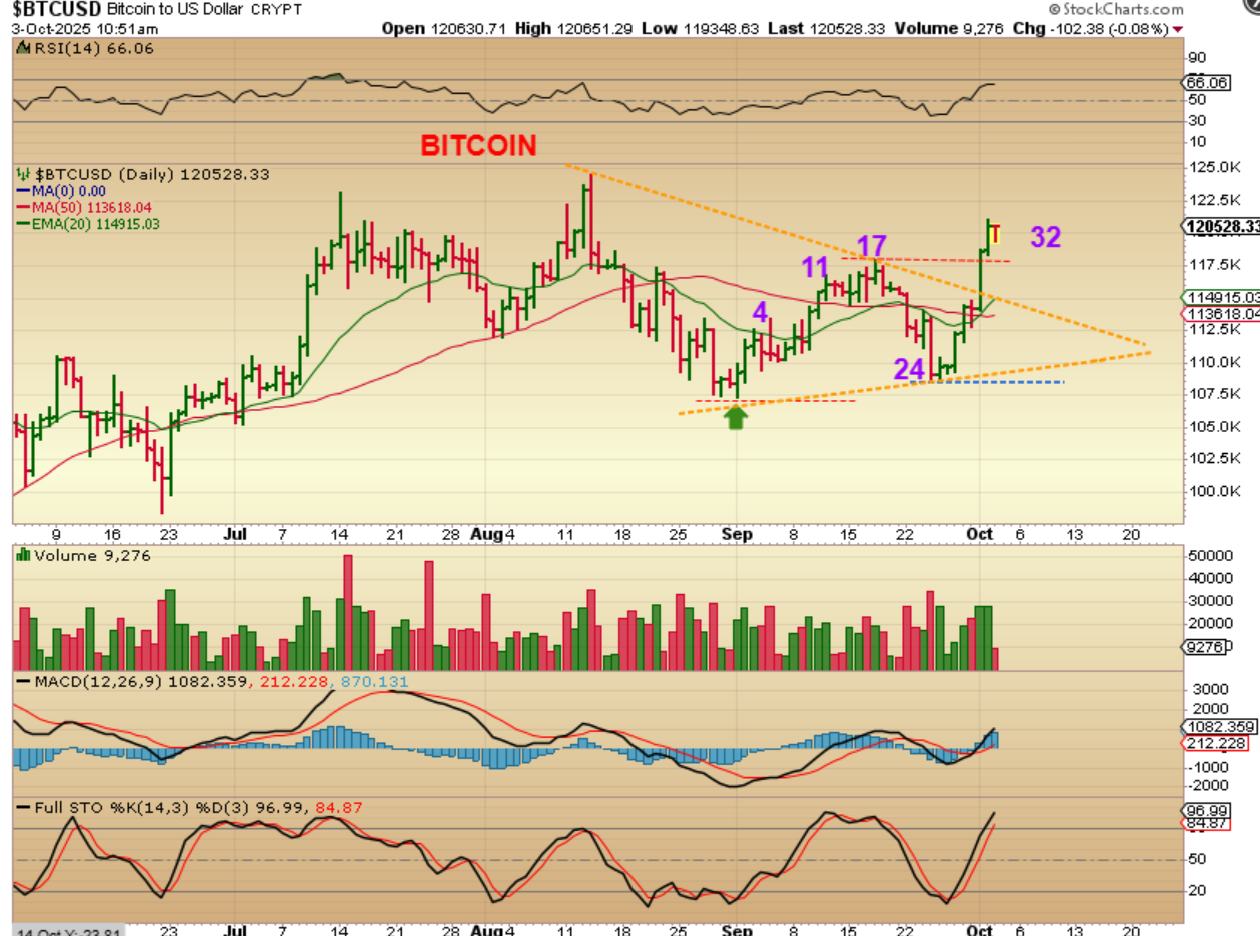
To help identify the cycle count, This was Bitcoin from Fridays report:
BITCOIN has been pushing strongly higher this week, and it broke from a triangle pattern. It now has higher lows and higher highs (possibly starting an uptrend) and on day 32 of possibly 60, it definitely has a low of time to rally higher.
.
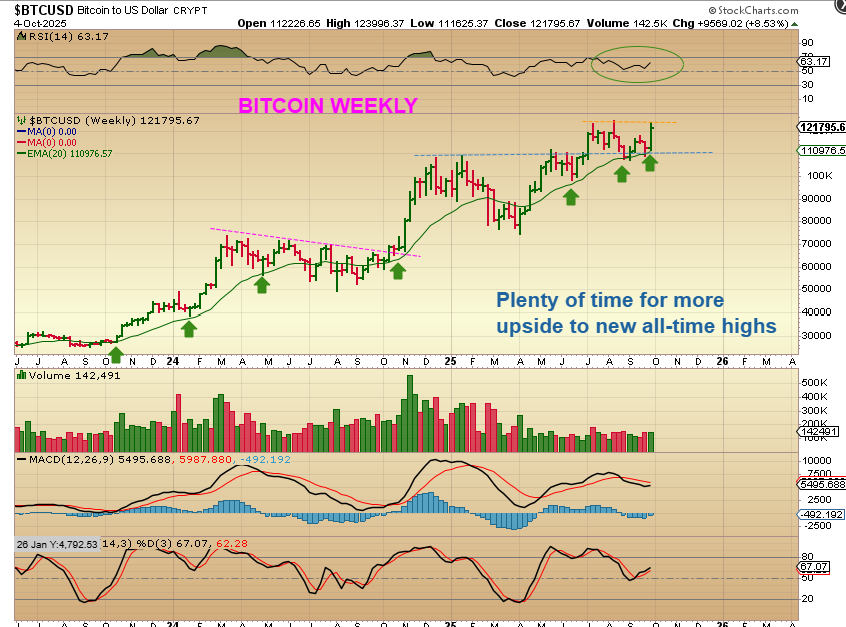
BITCOIN WEEKLY– We were watching bitcoin at these recent lows and waiting for a sign of life. Thankfully it started to run last week and is now almost back at the highs. Friday was day 32 of 60 or so, so it has plenty of time to run. Think about that: 30 days to run is a month! Crypto stocks are a bit choppy, but they are doing well and they could REALLY start to kick it into gear again when Bitcoin runs to new all-time highs.
.

