October 30th – Post Fed Direction
.
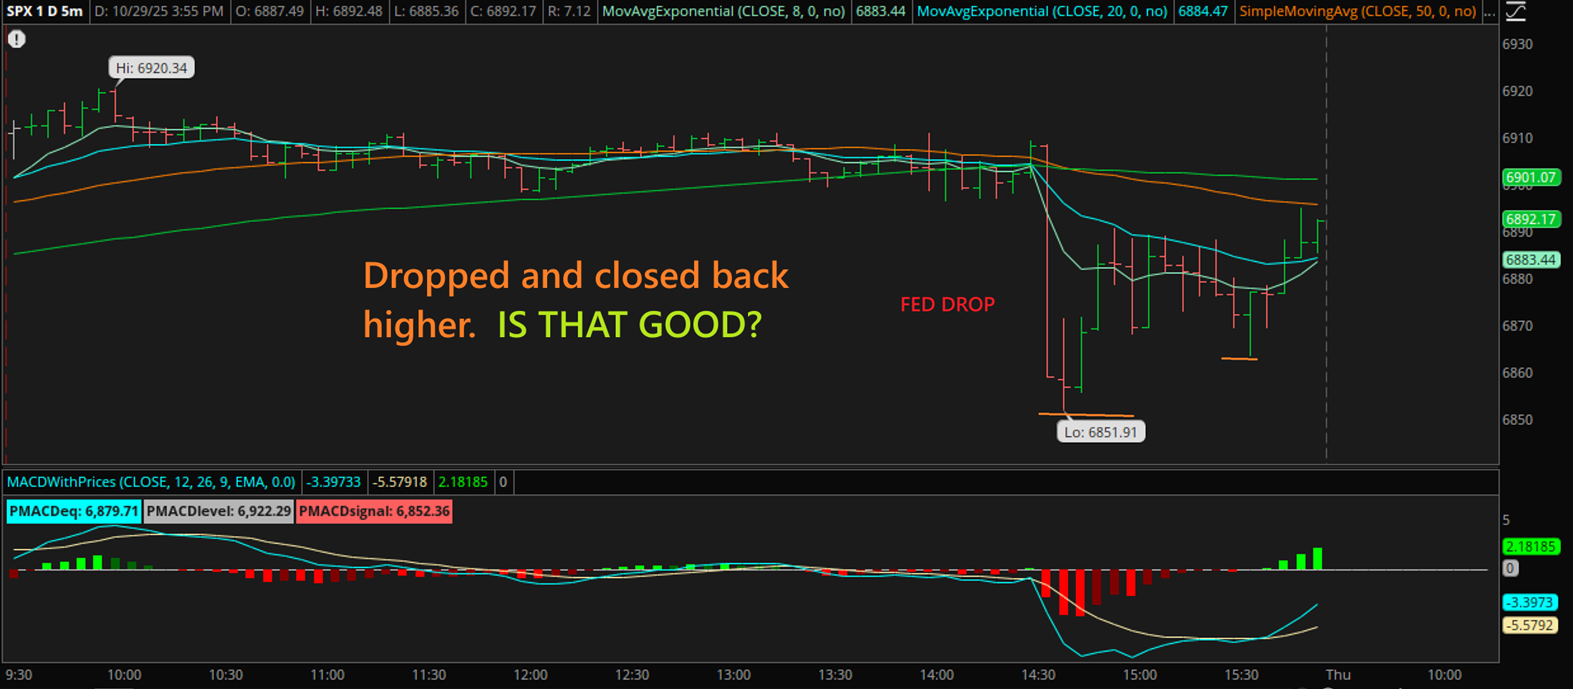
The markets dropped sharply with the Fed Speech. This is The SPX intraday and you can see at 2:35 p.m., when Chairman Powell started to speak, he spooked the markets. Well, it gradually ran back up, so is this a good bullish set up now? MAYBE, MAYBE NOT, because…
.
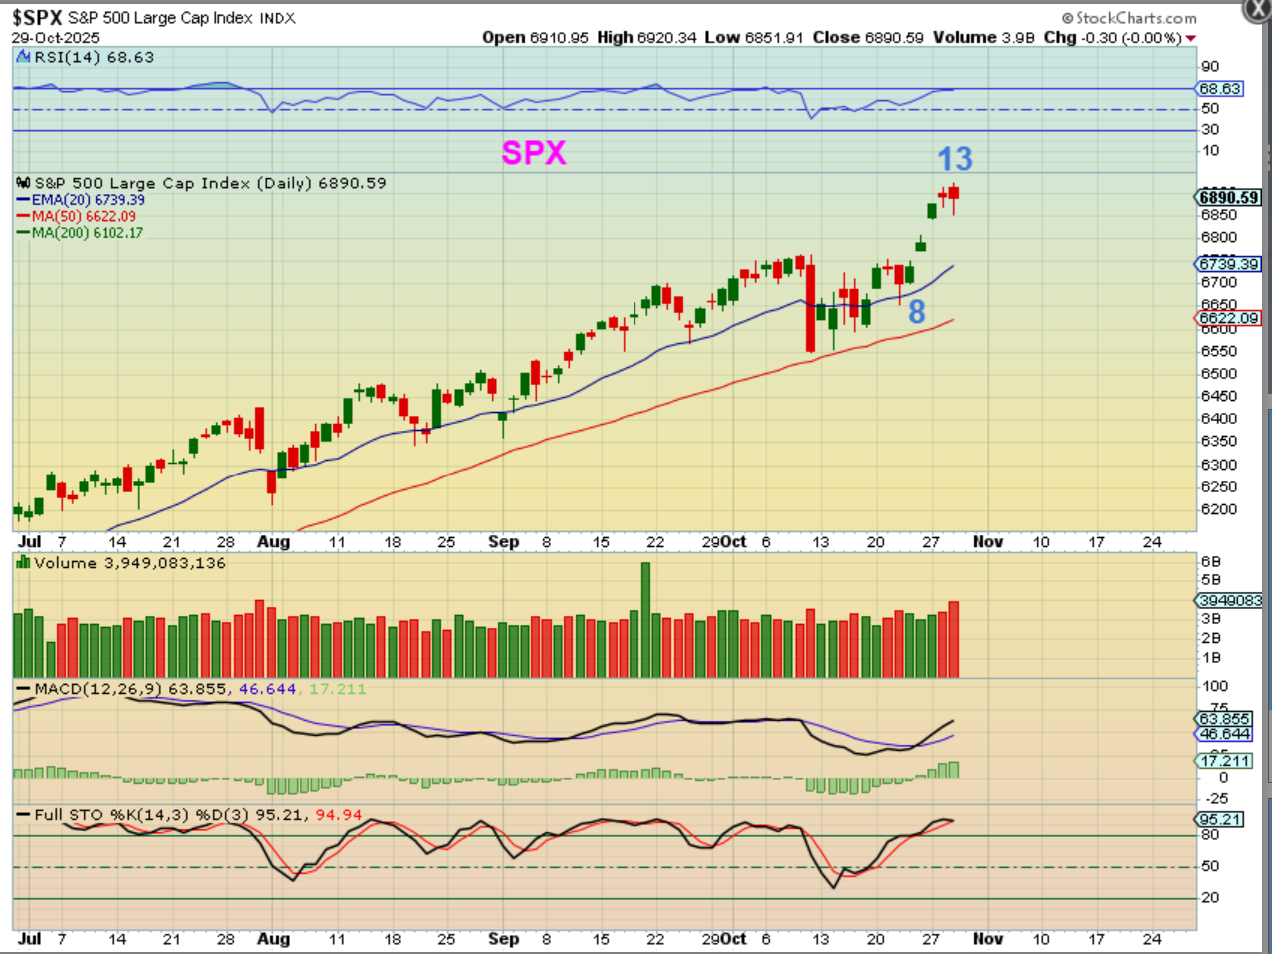
SPX –
Well, it gradually ran back up, but that gave us a form of a topping candle with 2 open gaps below it, so this could be inclined to pull back (at least short term).
.
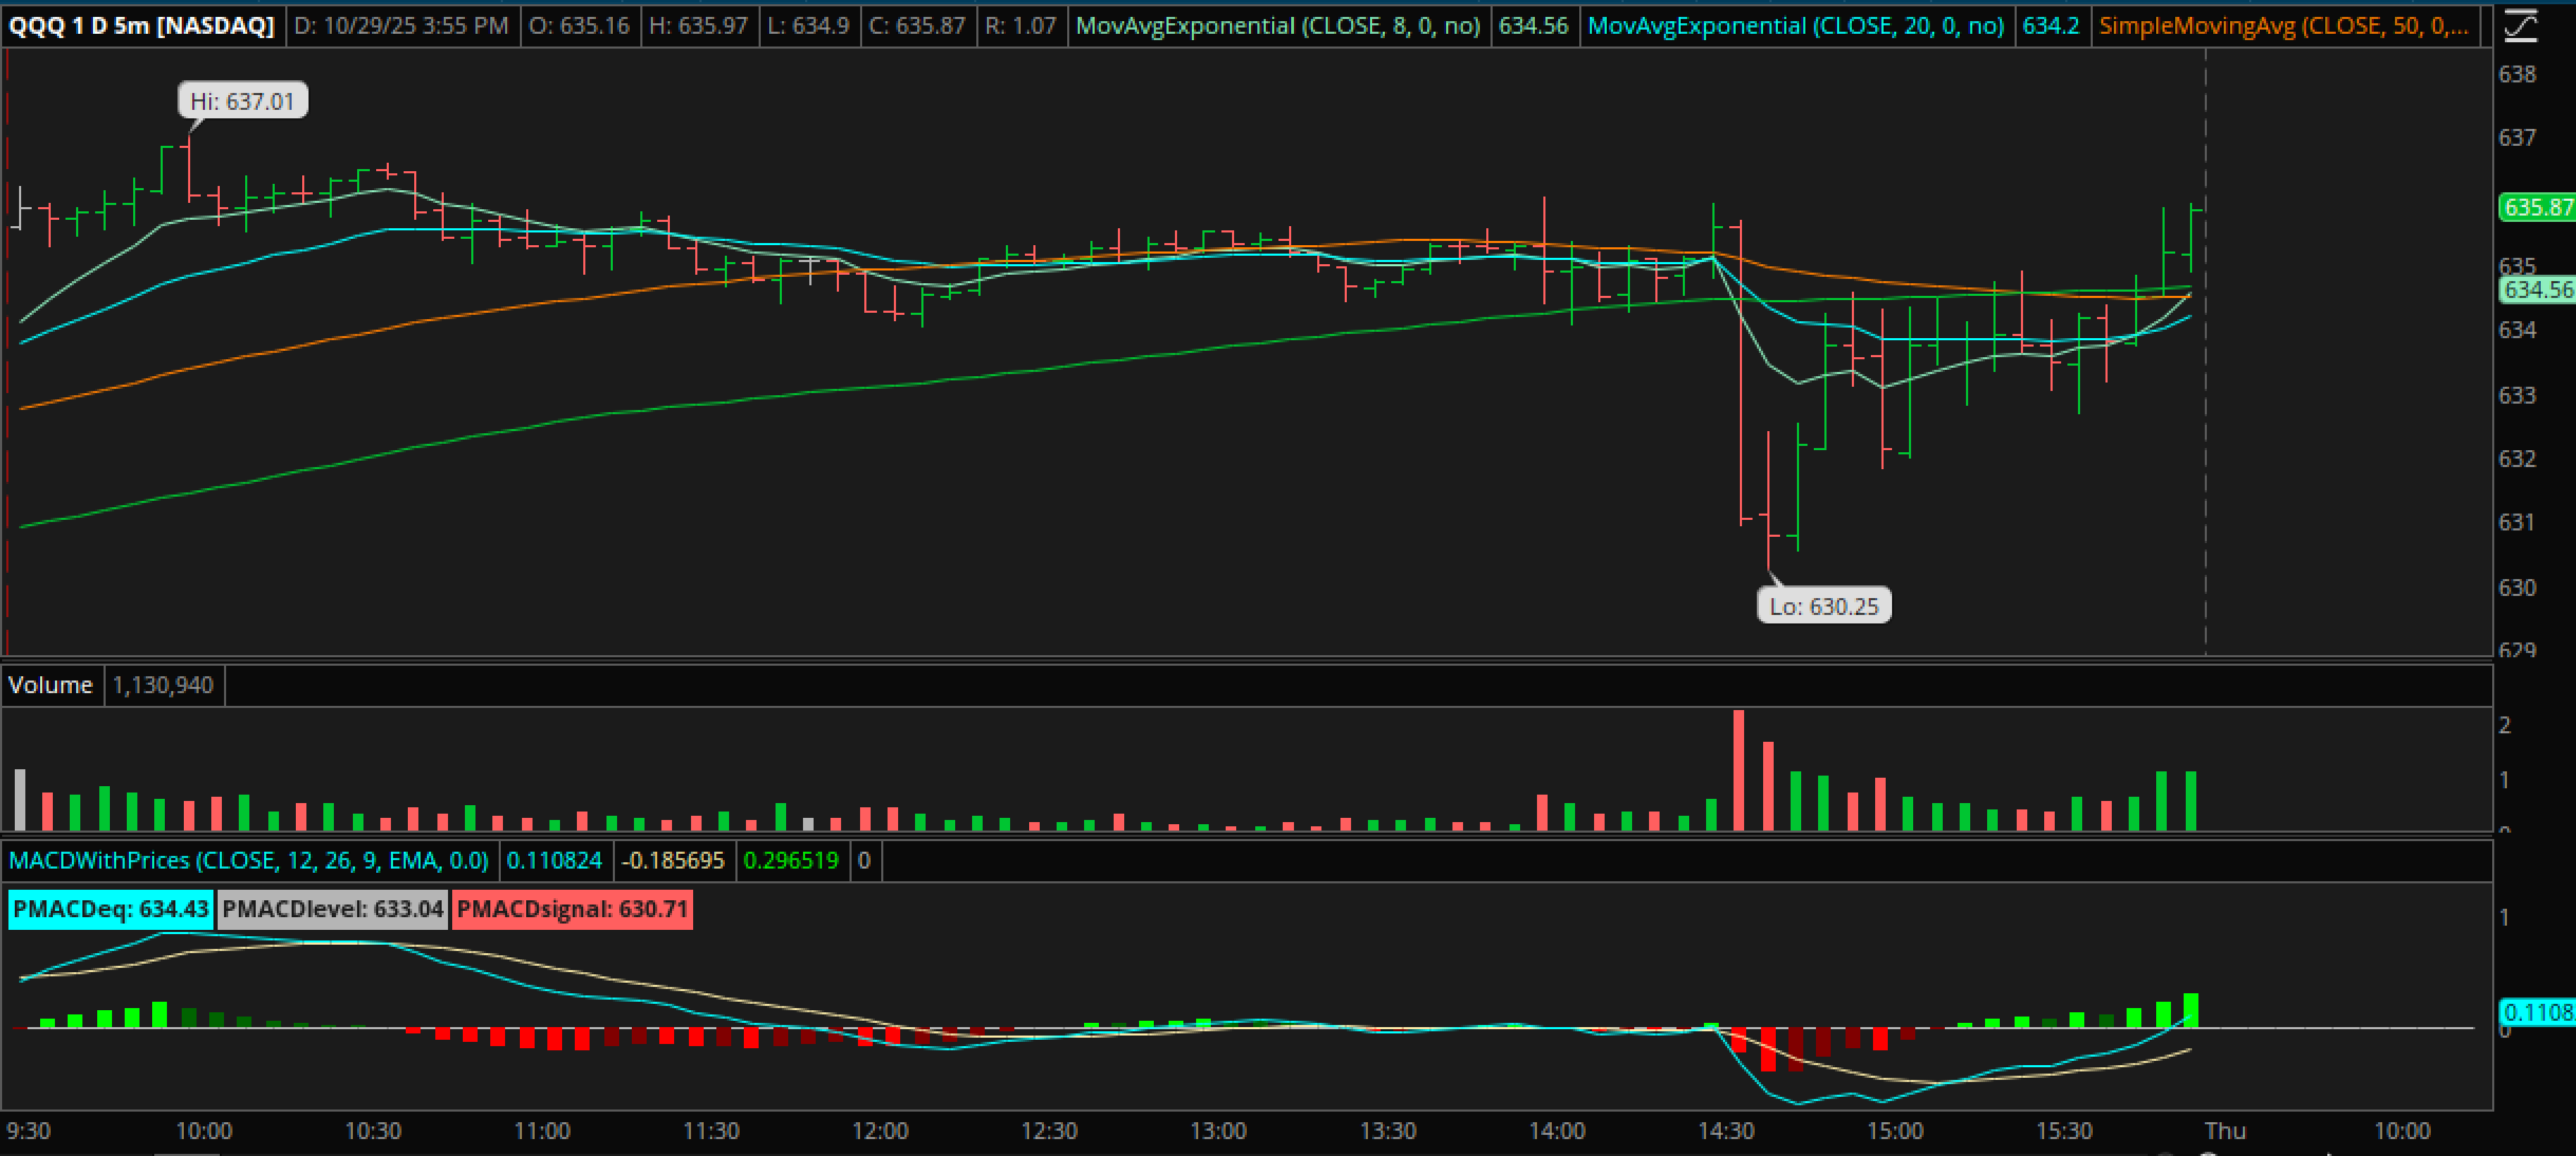
QQQ INTRADAY did a little better than the SPX, because it actually rallied almost right back to the highs of the day after that sharp drop. I know that this looks very bullish, but a buyer of this intraday chart might use a stop at the Fed crash or Wednesday lows, because…
.
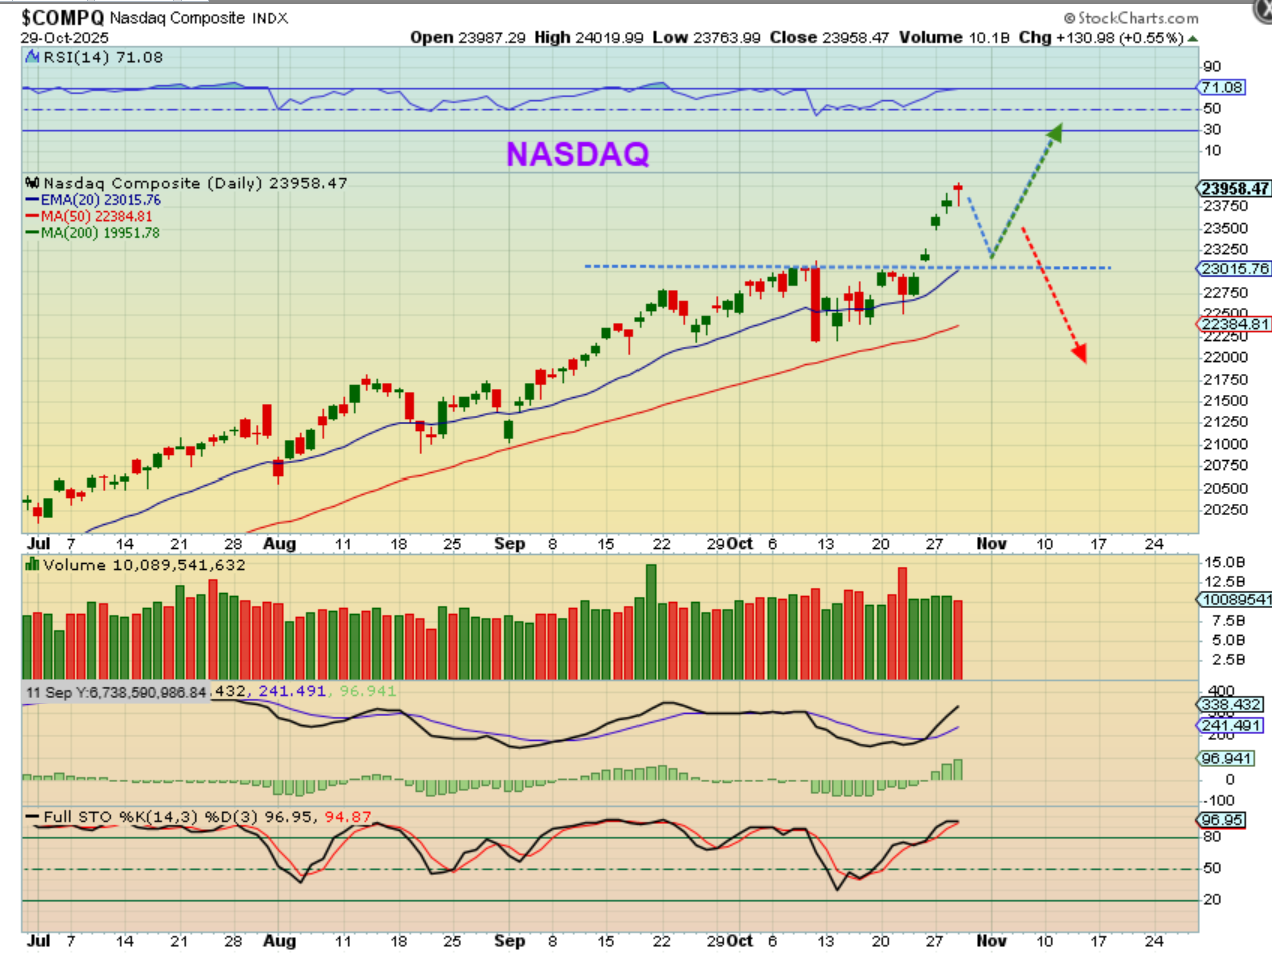
THE NASDAQ now also has what is normally a topping candle. When I say ‘topping’, it can be temporary, because we could fill those gaps and then head higher as drawn. That said, we are at month 7 out of the April ICL, so keep that in mind. We now just have to see what the POST FED RATE CUT DIRECTION becomes.
.
With the Fed speech, you get the idea that parts of the economy are weakening (jobs, layoffs, etc), and other areas remain strong. That said, it was enough weakness in the economy that they did a rate cut DESPITE increasing inflation in certain areas, right? So that catches my attention. Maybe we just do pull back into a mild ICL and then the bull continues–we’ll see! SQQQ and SOXS are bearish etfs, just in case we start to pull back and someone wants to scalp a trade or hedge.
.
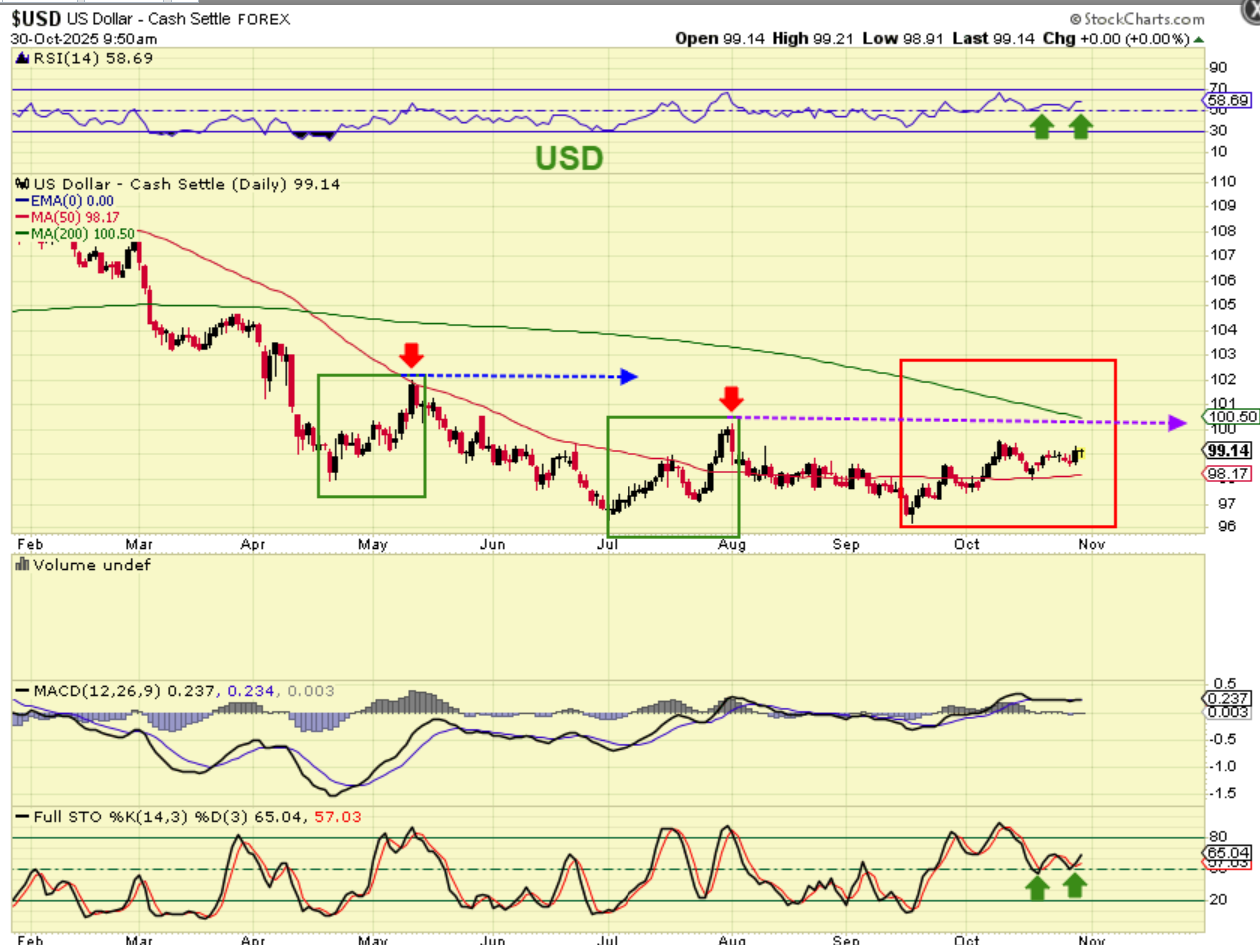
THE USD has the look that it wants to move higher. The RSI, the 50sma, etc has a bullish look, so we’ll see what happens after the Fed Rate Cut. After the September 17th rate cut, the USD rallied.
.
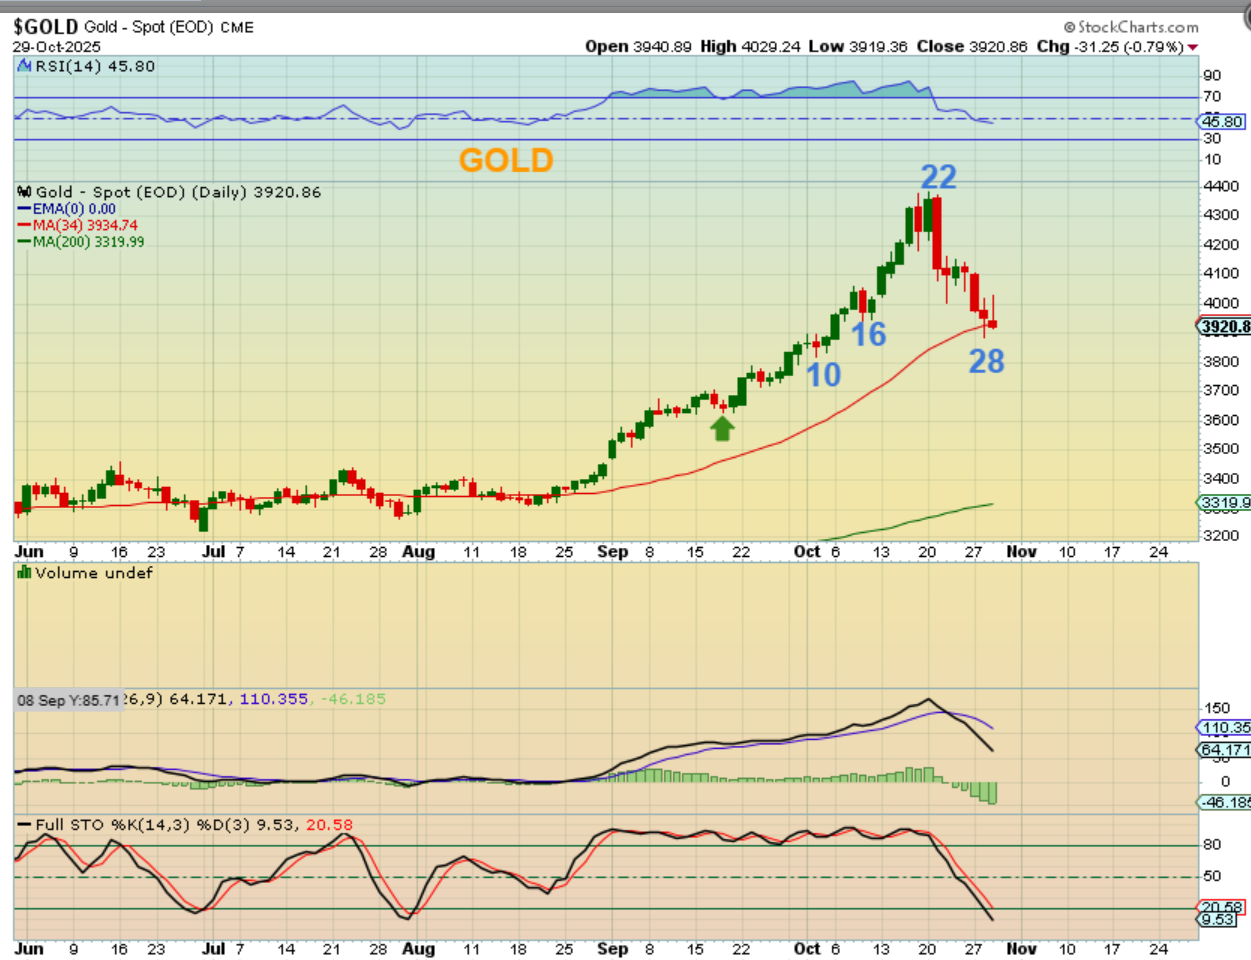
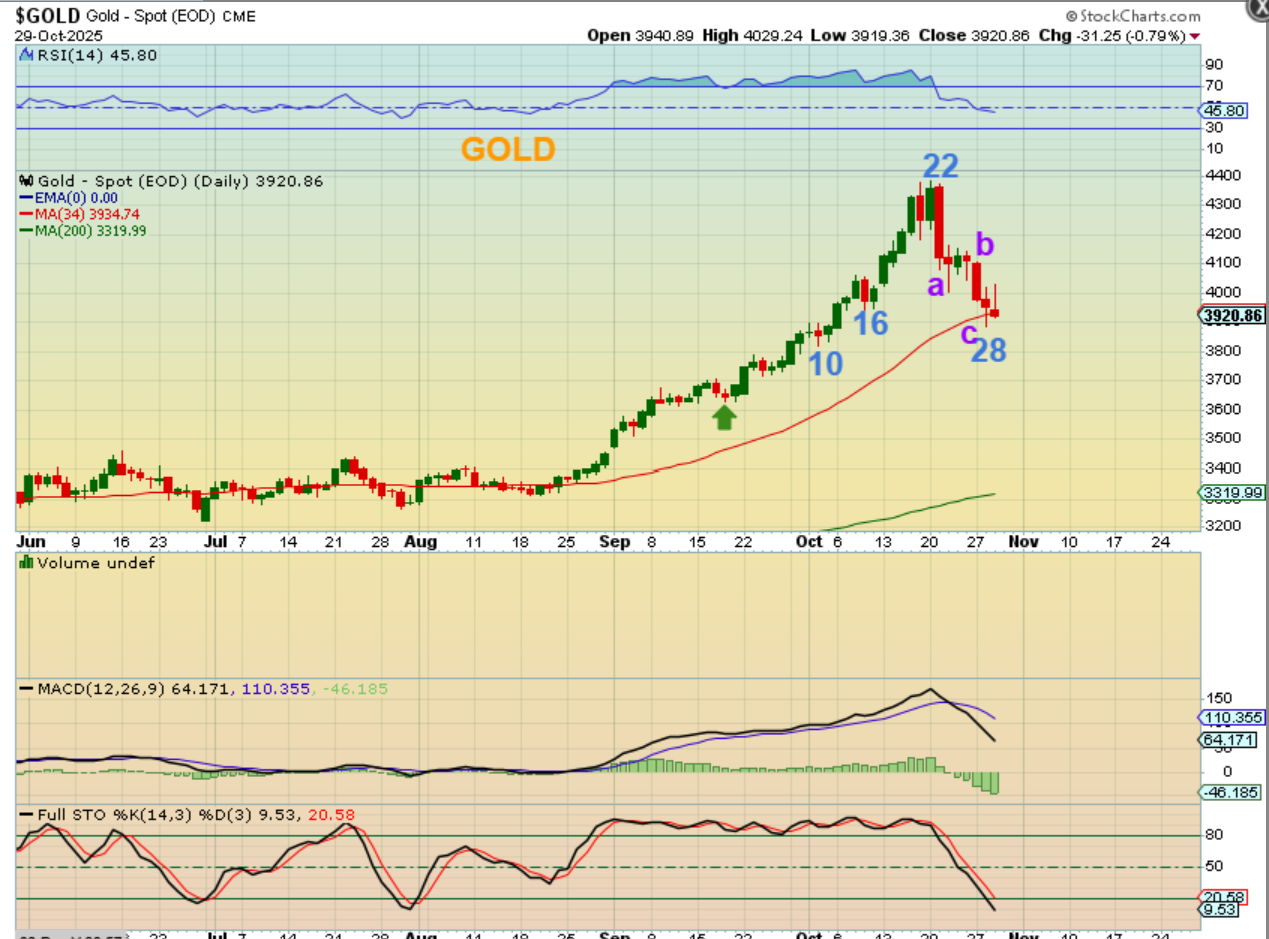
GOLD – I think that we may be looking at the dcl, because the 34 sma held up at day 28 and…
.
GOLD – We also saw the a-b-c that I was looking for, and
.
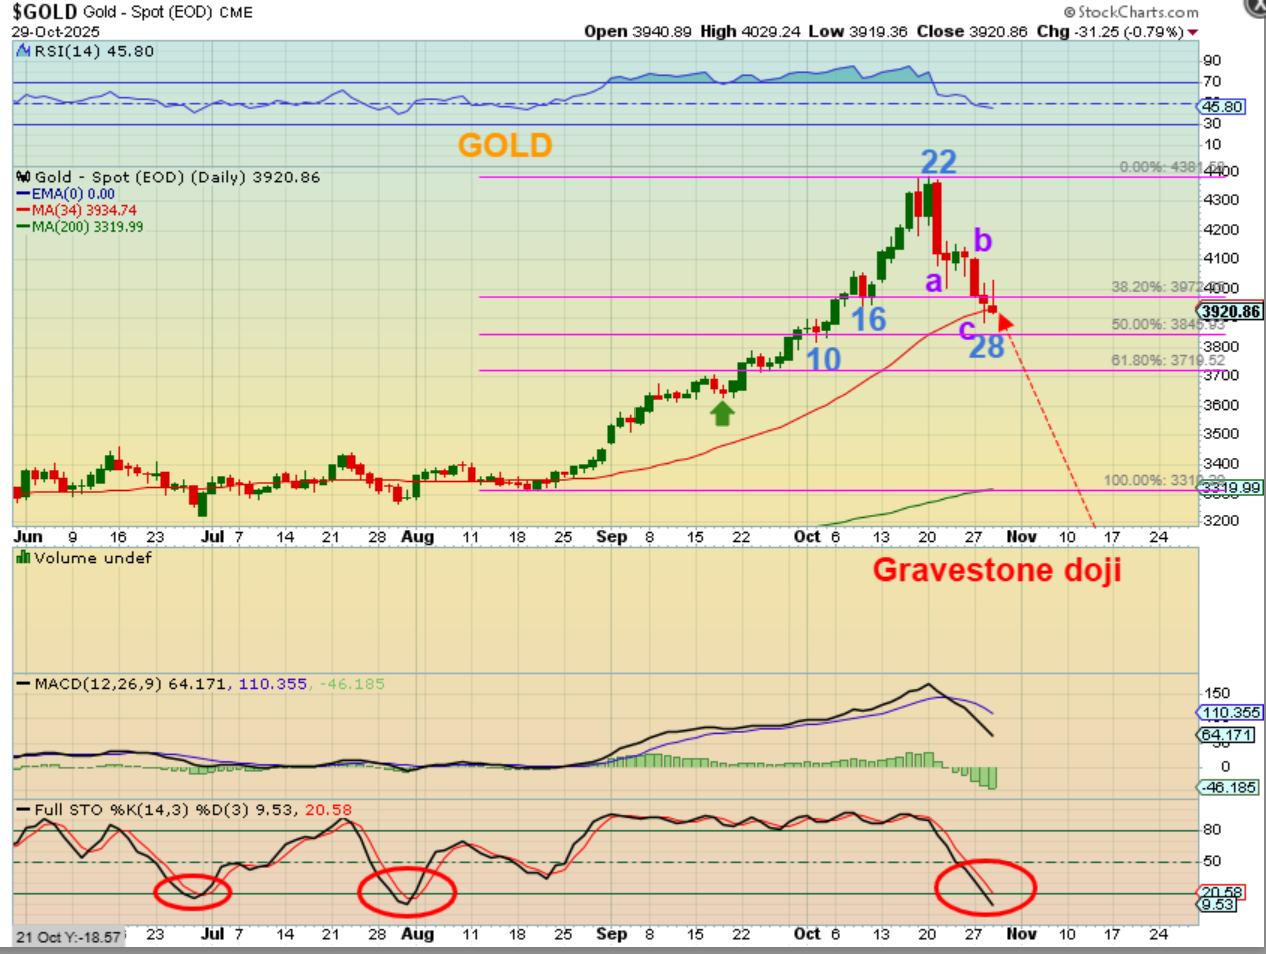
GOLD actually has a gravestone doji, it is oversold enough for a low, and the 50% Fib retracement has pretty much been reached. We may have a dcl in place and how did Gold act after the September 17th rate cut? It dropped for 1 day and then rallied higher.
.
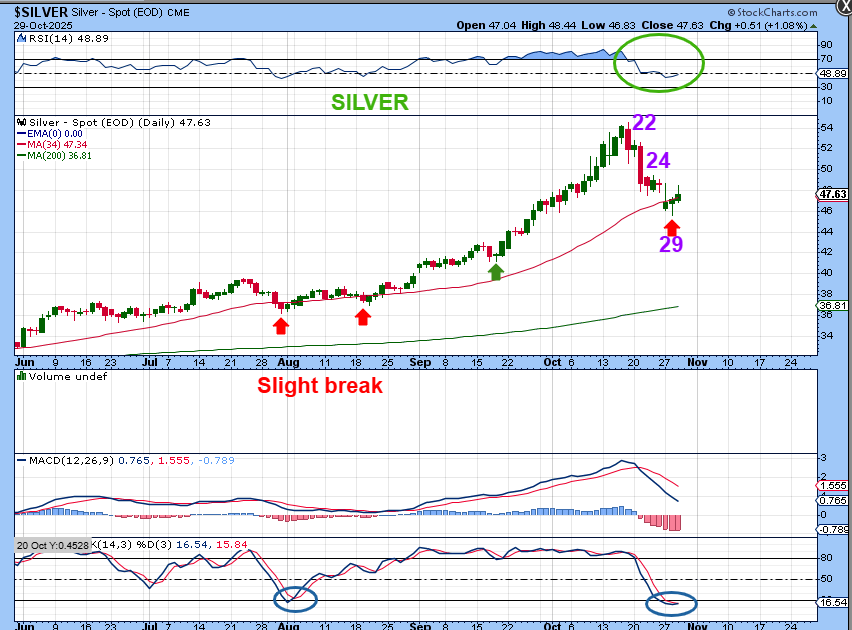
SILVER dipped below the 34 sma and crawled over the past couple of days. The last time it was this oversold it did the same thing, so we’ll see what the Post-fed rate cut reaction is…
.
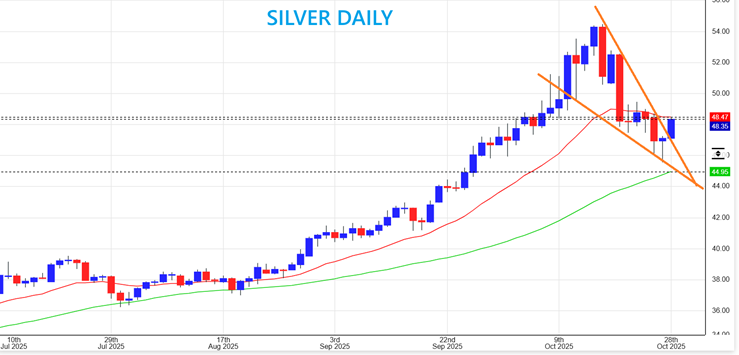
SILVER BULLISH WEDGE?– Yesterday in the morning we were breaking what looks to be a bull wedge. That would be bullish if buyers continue to step in, and…
.
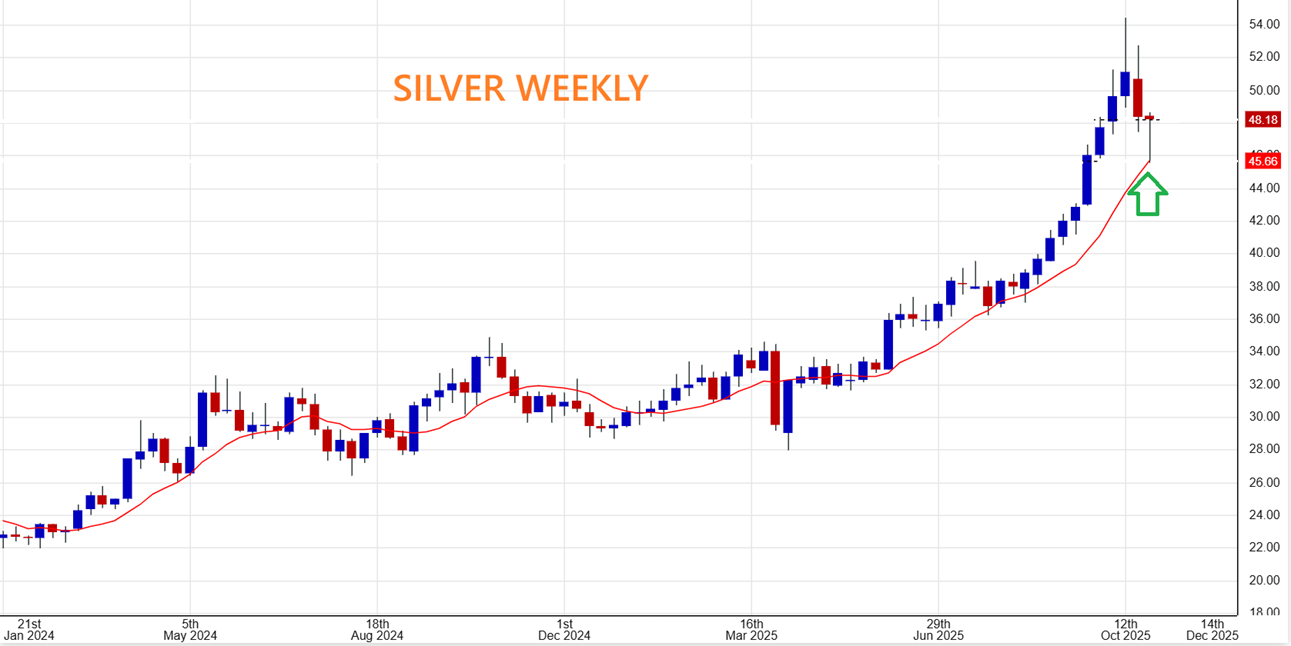
SILVER WEEKLY! – TAKE A LOOK AT SILVERS WEEKLY CHART 🙂 Even a drop on Thursday shouldn’t hurt this candle unless Silver drops $3 on Thursday and Friday (weekly candle).
.
YESTERDAY I POSTED THIS CHART:
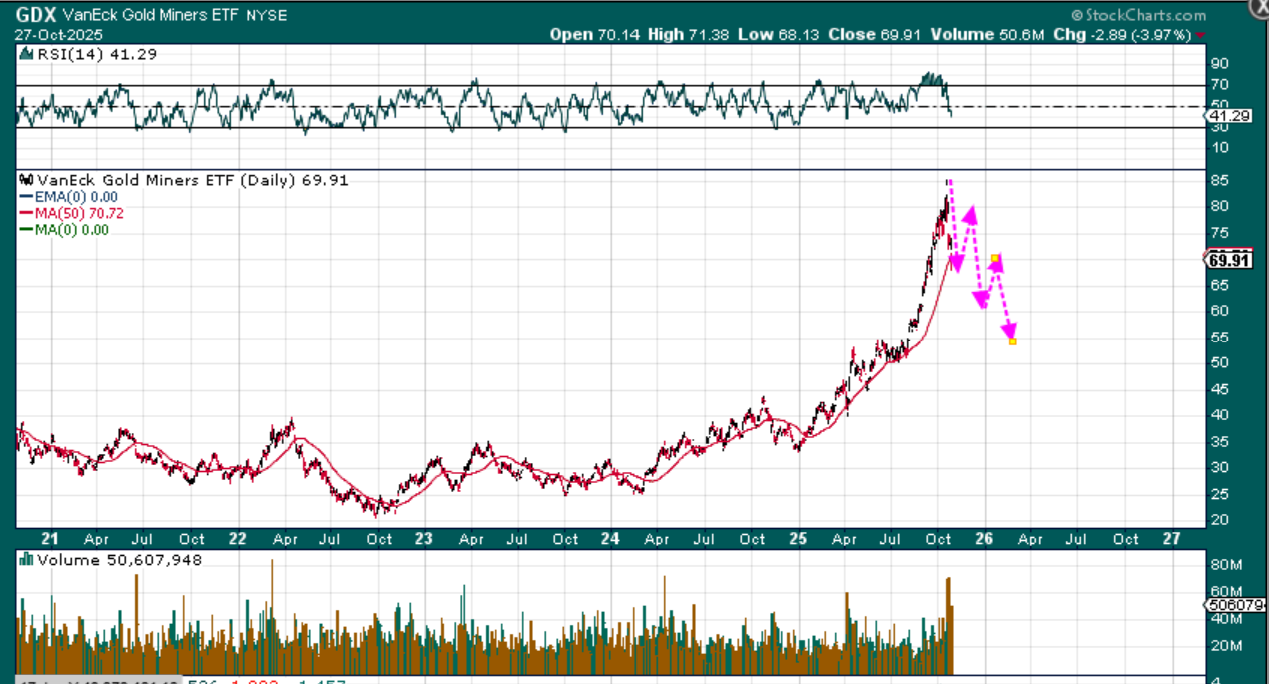
GDX was at the 50% fib retrace, but wow that was fast!
GDX lost 50% of a 3 month rally in just 4 red days and volume was high.
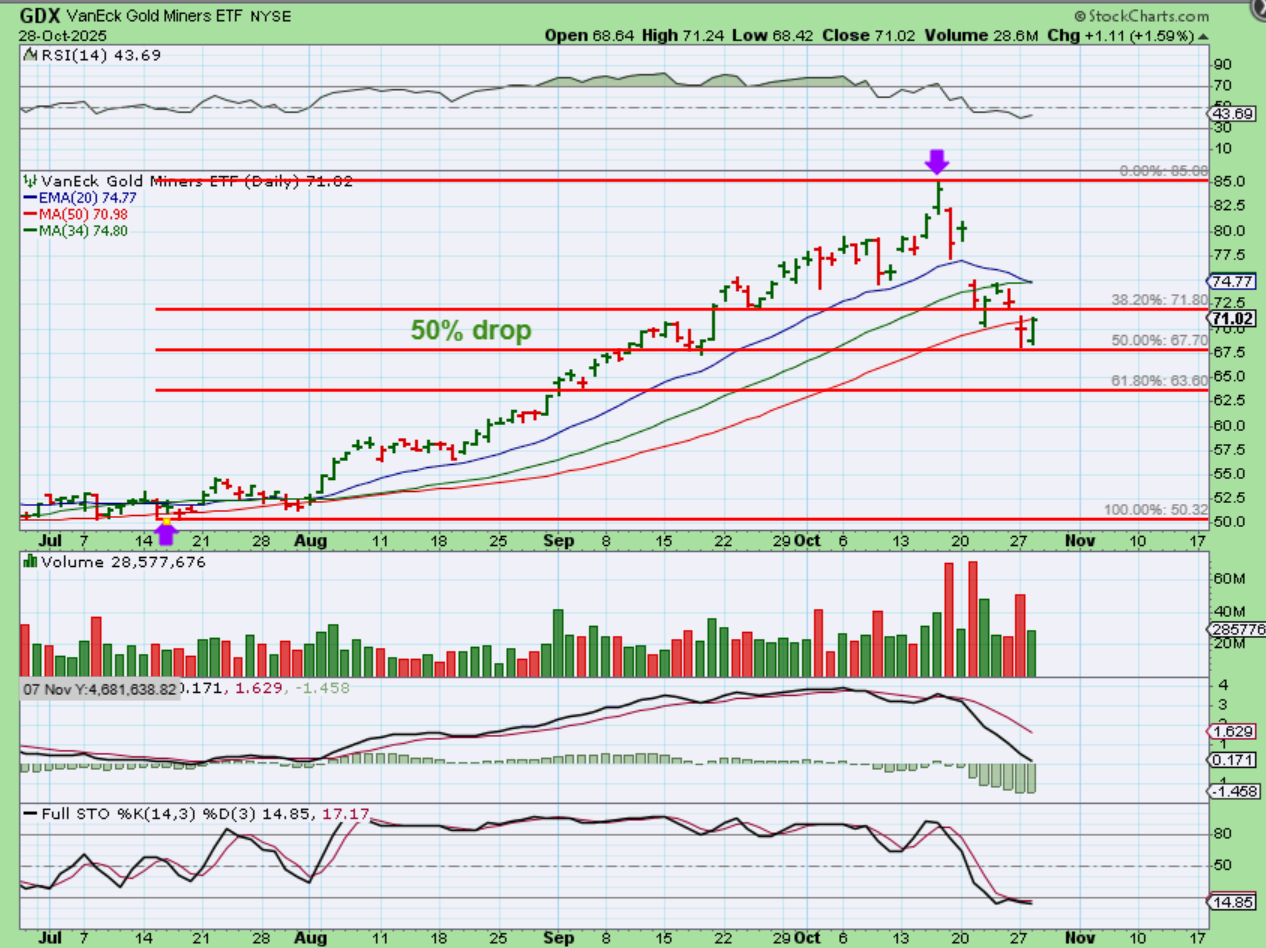
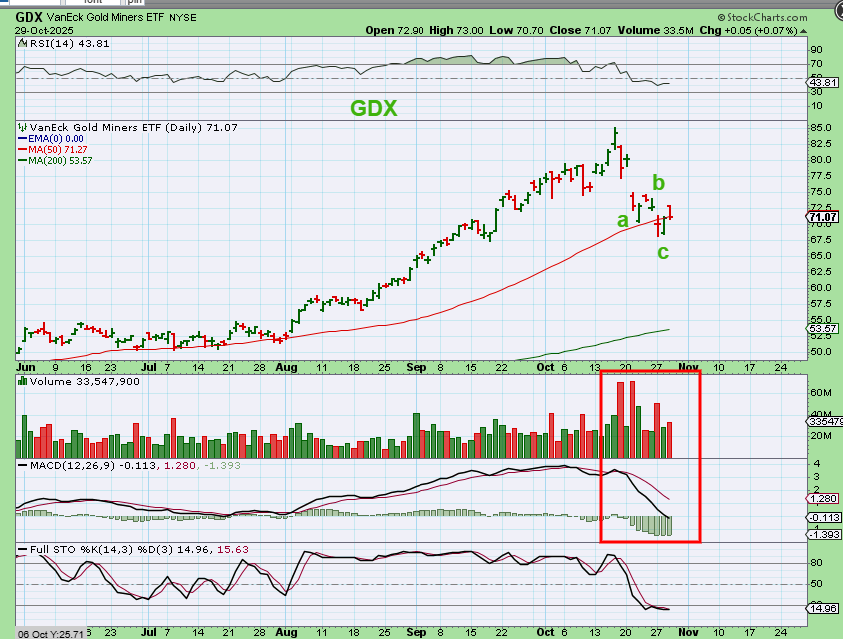
GDX has an a-b-c drop and it did close under the 50sma for 3 days, but that can be a shake out. I am a little worried about that volume set up, because it means that if we bounce, we need to at least be cautious. In fact I posted 2 charts for long term thinking…
.
In fact, I posted 2 charts for long term thinking:
1. A bounce and a double top, or
2. A rally to parabolic heights
.
GDX has pulled back, and it could sling shot higher again, to finish up a blow off top move that we have discussed.
.
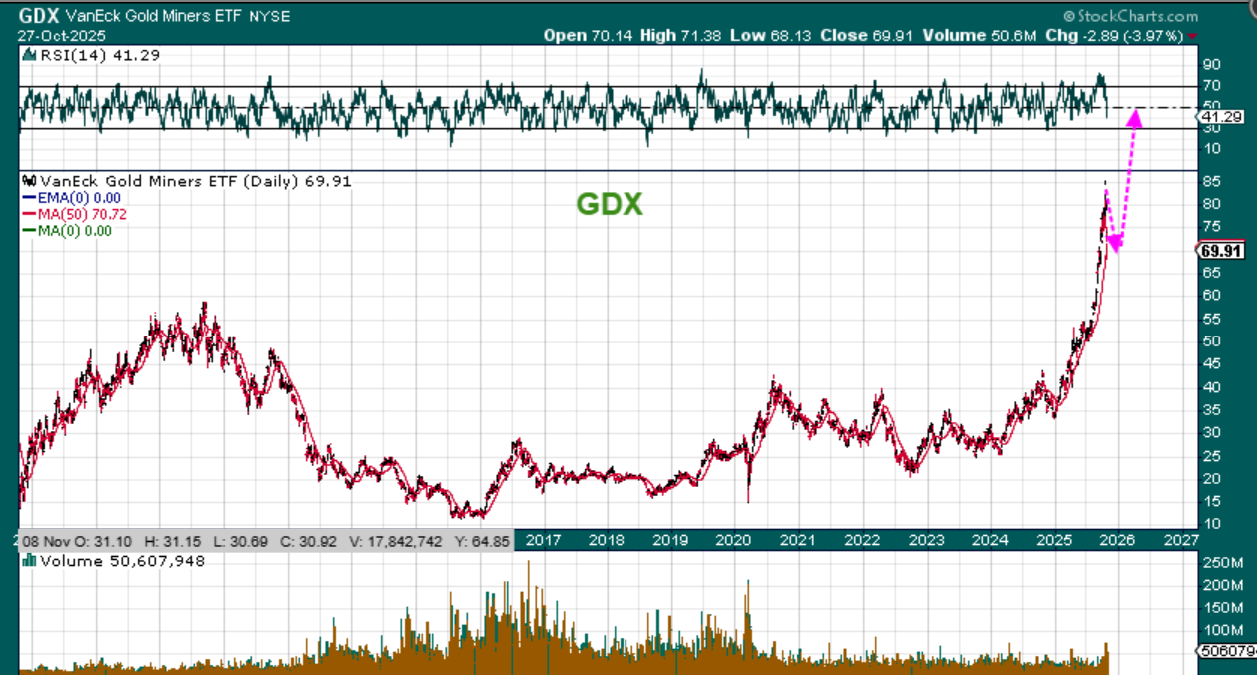
GDX – I also discussed what the Nasdaq did after it ‘peaked’. It ran back toward the highs, formed as L.T., and then began to chop lower, so we’ll keep that in the back of our minds too. This move looks parabolic, so we just need to see if it is finished / peaked? or one more run?
.
So far, the Fed Day price action had that normal volatility intraday, but the charts really didn’t look bad at all, although we may be seeing a topping candle in the General Markets. The Precious Metals actually look good at this time. And now we watch and see how the ‘Post Fed Rate Cuts’ direction unfolds. Maybe you took positions, maybe you want to try adding now? That is fine, we use stops on new positions anyway, and if things move against your position, you can sell and wait and see what kind of dip is taking place. Bitcoin is below, Enjoy your Thursday trading!
.
~ALEX
.
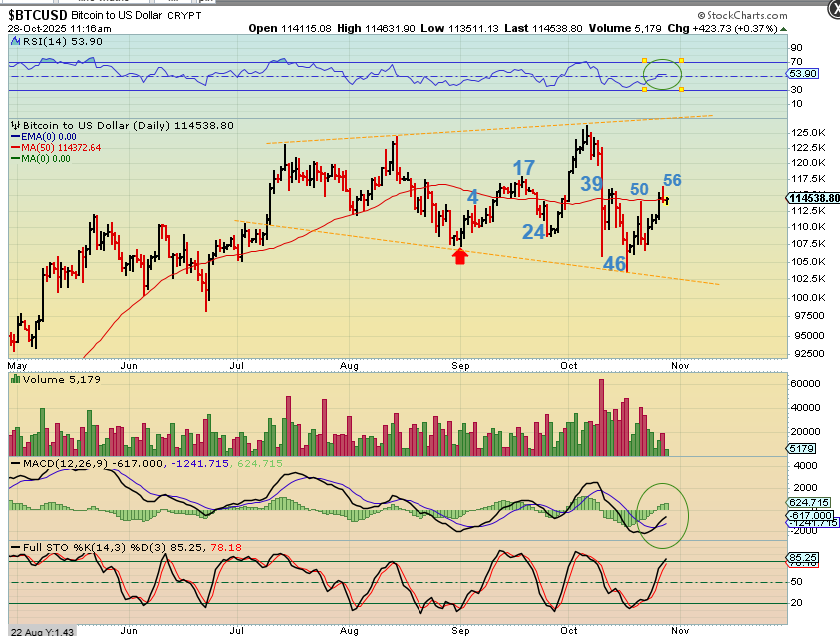
When I showed this chart, I was saying that a day 46 low seemed too early and I expected bitcoin to drop to a day 60+ dcl, likely at the lower bullhorn trendline.
.
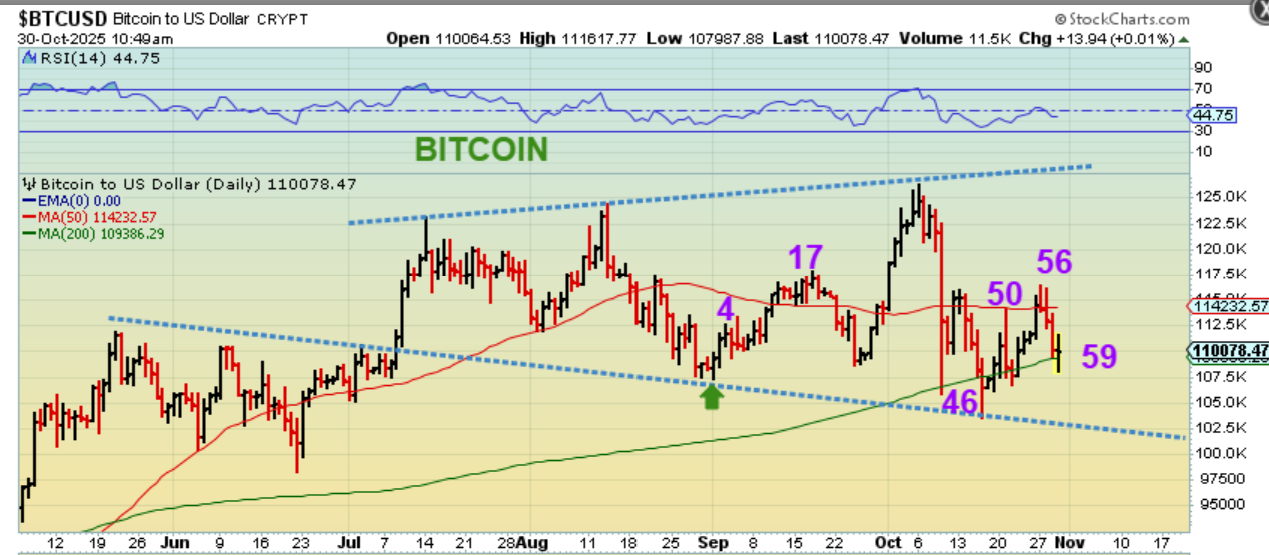
BITCOIN actually sold off for 3 days and even overnight last night, but it has bounced back this morning. We have a little price support at the 200sma.
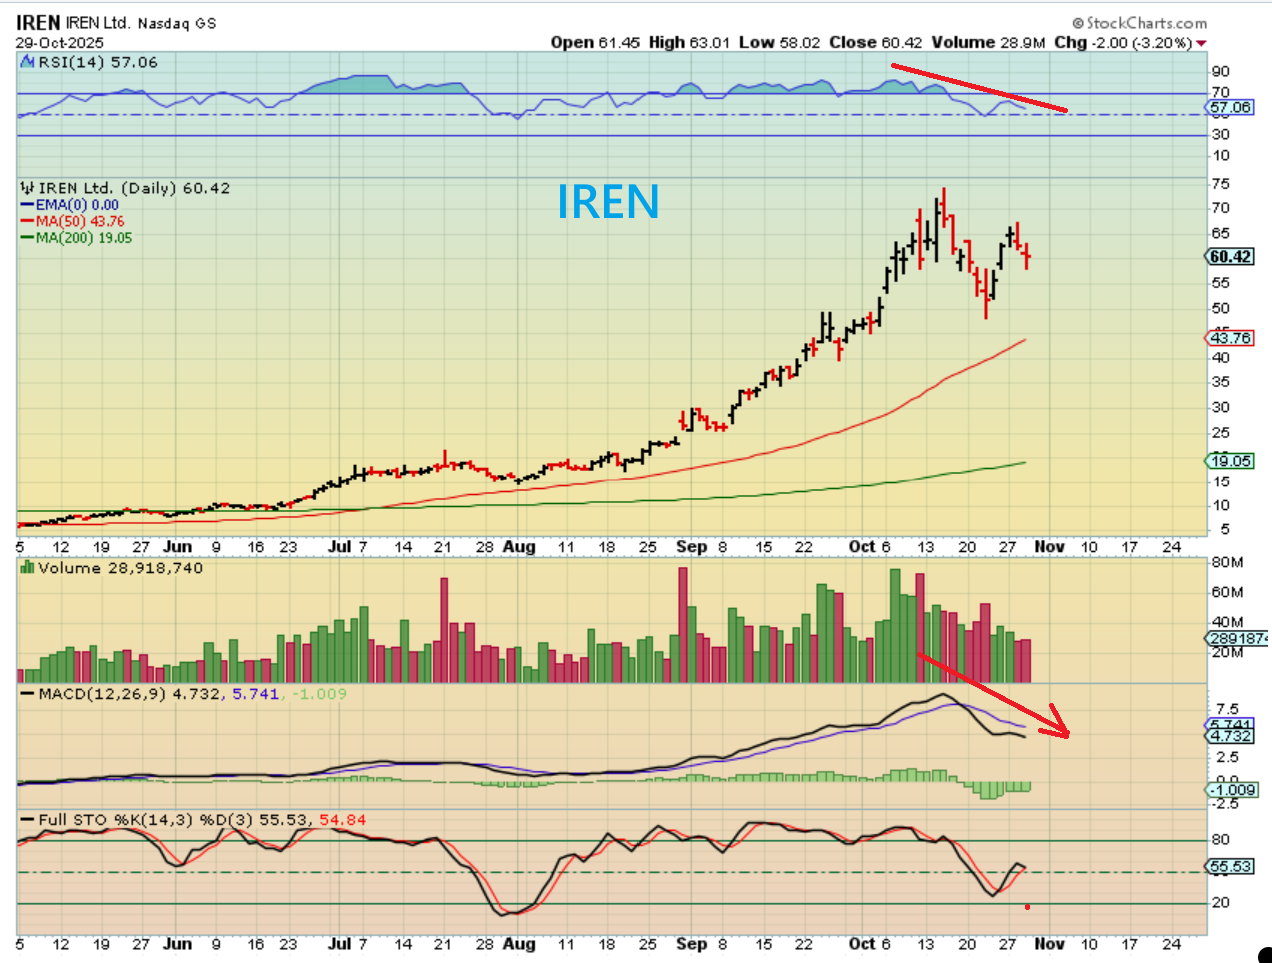
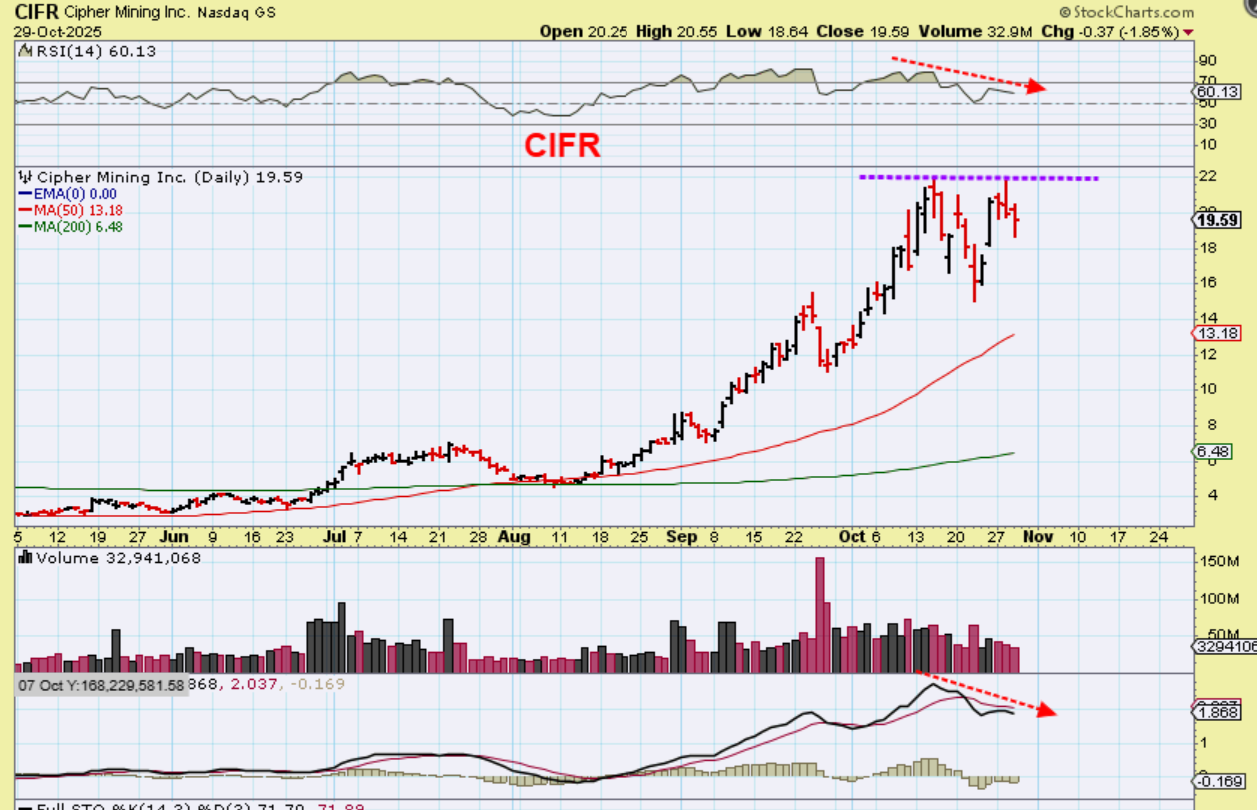
As A SIDENOTE: On September 17 when the Fed cut rates, Bitcoin rolled over the following weekend. I’m still cautious here and several of the crypto stocks look fine, but I do see divergence at new highs. I remain cautious for now.
.
I’m still cautious here and even though several of the crypto stocks look fine, I do see divergence at new highs. I remain cautious for now, but divergences CAN correct over time if it chops around and builds strength and momentum. I’m hoping that a quick Bitcoin drop and bounce back would do that.