I am going out and will not have time to proofread the report. If there is anything unclear, you can let me know in the comments and I’ll fix it later. Thanks!
.
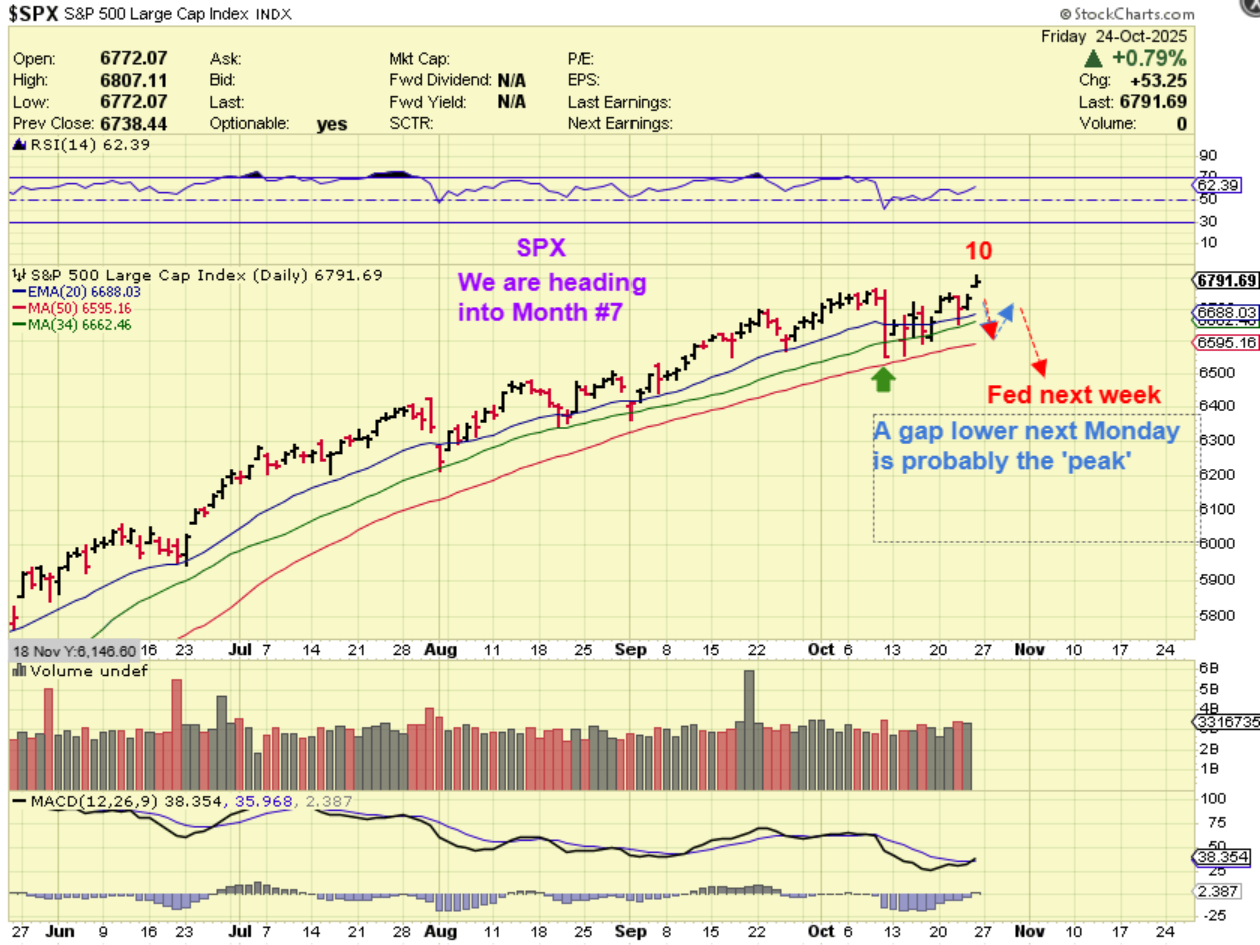
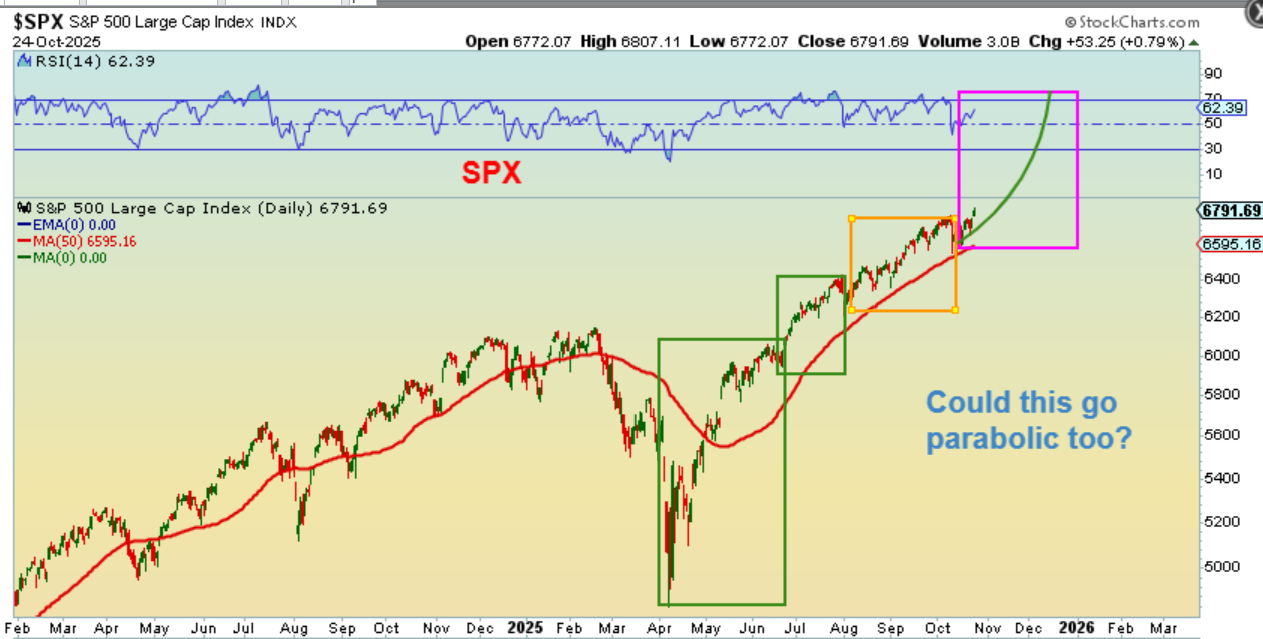
SPX – I’ll start by saying that this CAN continue higher, since it is still relatively early in the daily cycle, and a runaway parabolic move in the markets could rush in. I drew it as dropping however, and this is why…
1. We are heading into month 7, and an ICL is due. We just need to keep that in mind.
2. We gapped up to new all-time highs on day 10 and if this gaps down on Monday, that is usually a bearish ‘abandoned baby’ candle (a top) or a bearish ‘evening star’.
3. This would then also become L.T. with a ‘peak’ on day 10 and sell off into that ICL on month 7.
.
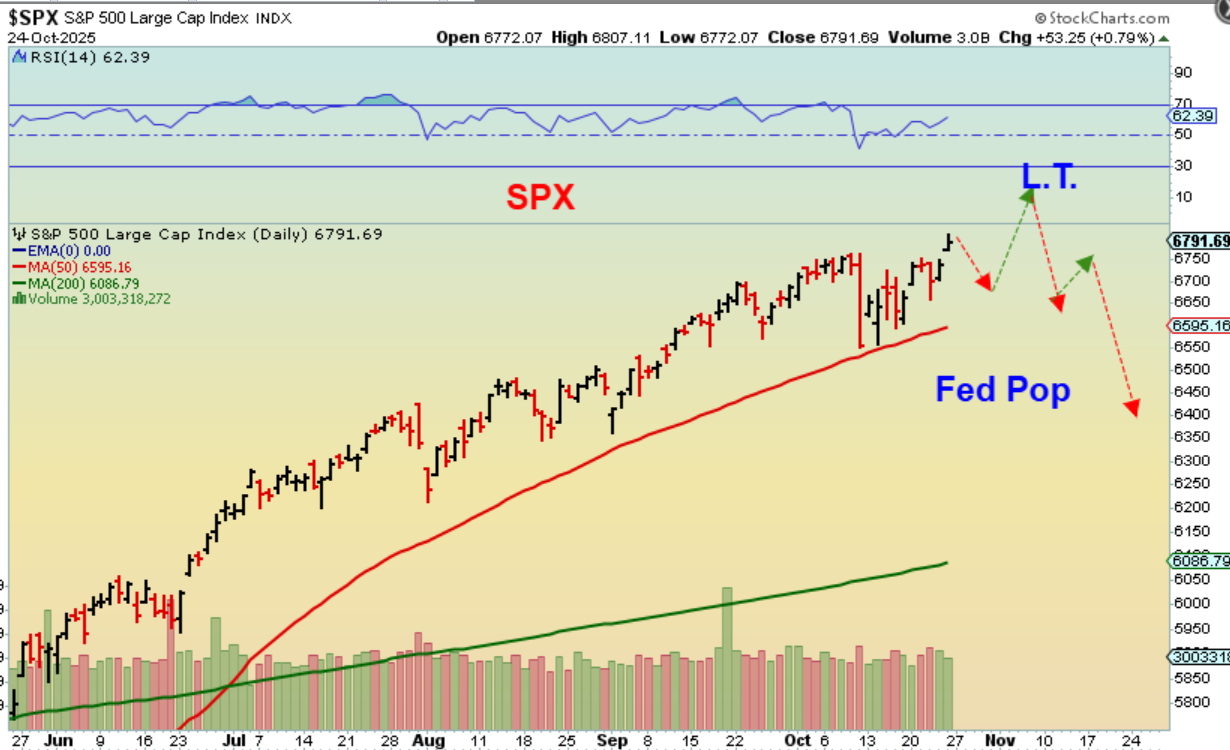
SPX: As mentioned, it CAN still run higher. We also might see something like
1. An abandoned baby drop into the Fed Mtg
2. That dip lower into the Fed Mtg could be followed by a Fed Pop and run higher, and yet still become L.T. later on day 16 or so, and drop into that ICL too. Maybe a Fed pop and bad data released later or just a pop & drop and sell off. This IS a tough call.
.
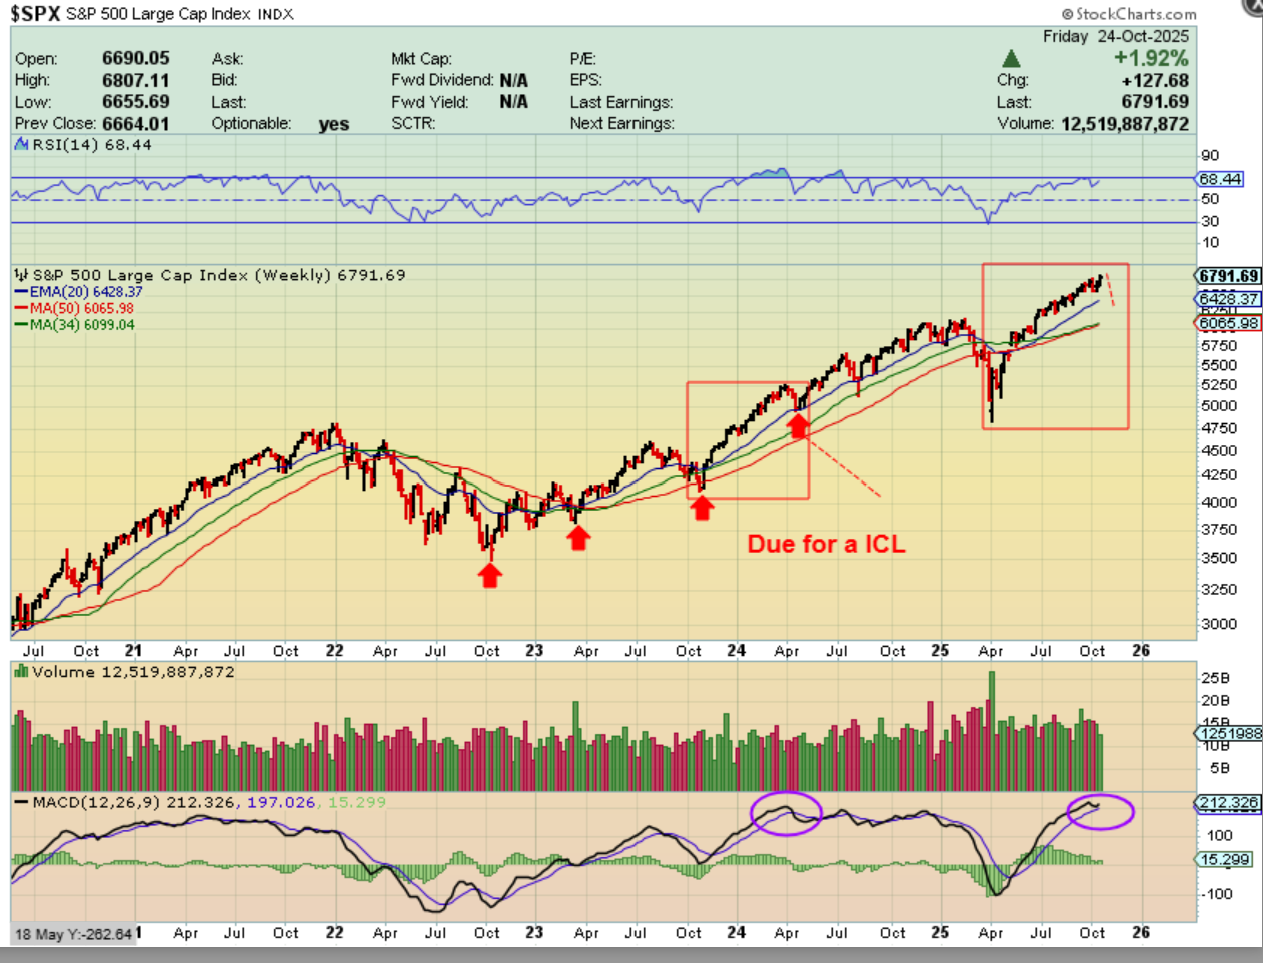
SPX WEEKLY – The weekly chart is where we see that we are due for an ICL. They come roughly every 6 months and seem to drop toward the blue line (20 week ema). See the Red boxes as a guide.
.
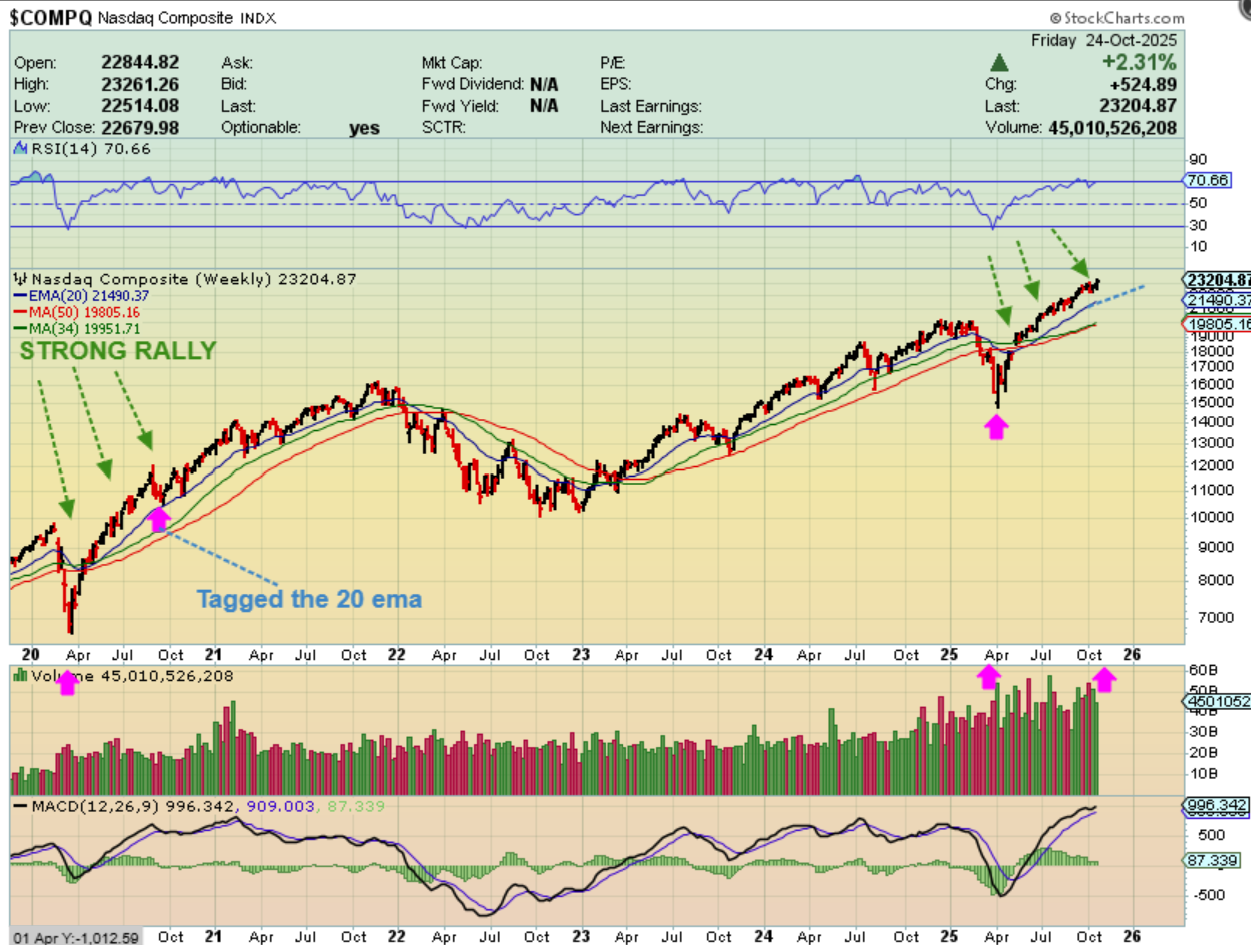
NASDAQ WEEKLY – I have been pointing out the 2020 covid rally since our recent crash and April ICL and they have become similar. Well, you can see that the rally then had a sharp sell off to the blue line too, and then the rally continued.
.
FINALLY, is it at all possible that the general Markets go parabolic too, into the end of the year?
.
SPX WEEKLY – This has already been a steeper run than the last one in 2024. We are on the 4th daily cycle and they can have 5. The general markets are due for an ICL here on month 7, but Silver was due in October, and it has blasted higher. I can’t completely rule out a rate cut rally higher.
.
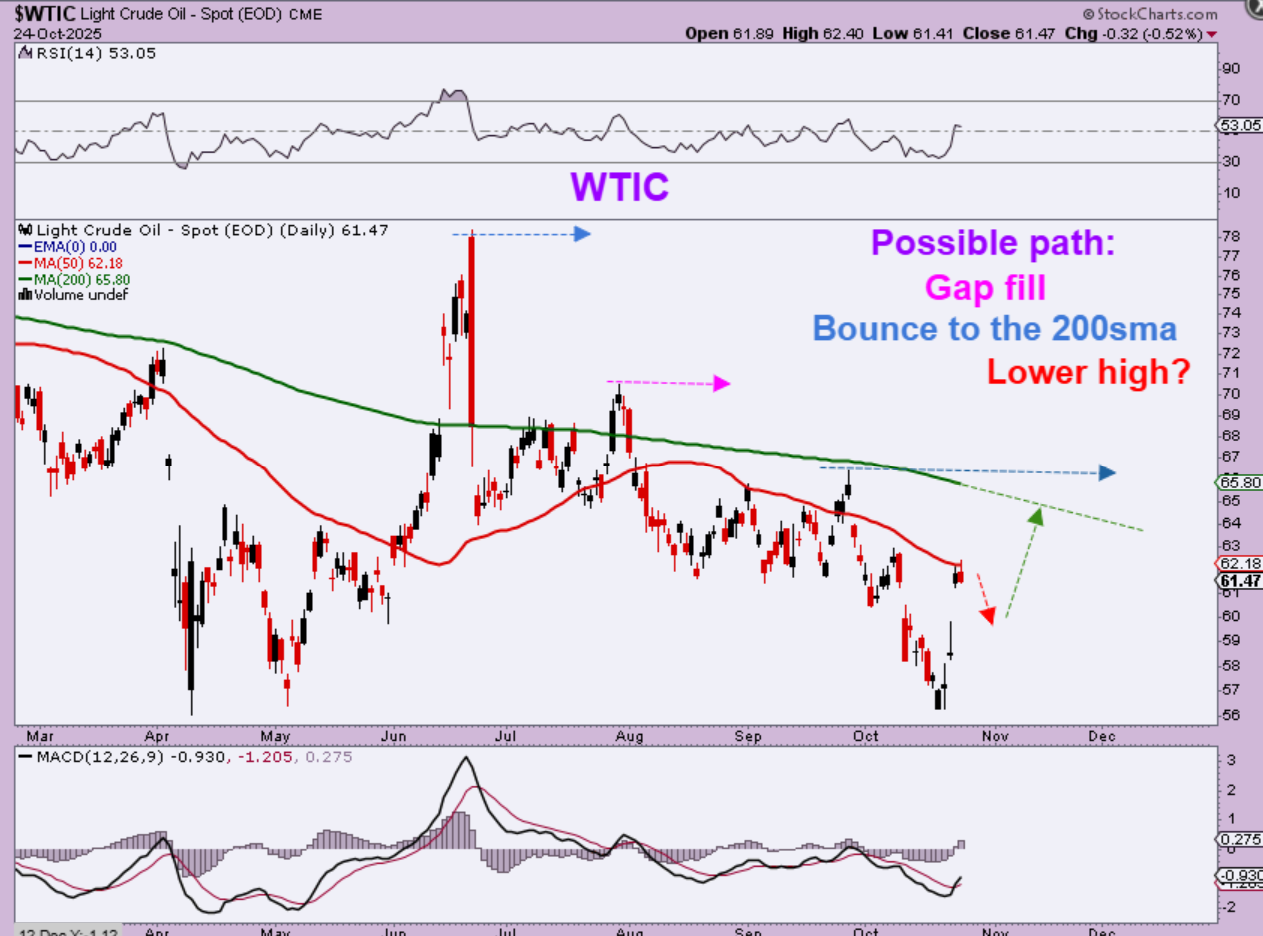
WTIC – Oil has spent the last 2 days pushing on resistance. Even if it breaks above it over time and reaches the 200sma, it would still be a lower high, so I am watching this bounce, but it could still roll over. Oil has been weak and choppy.
.
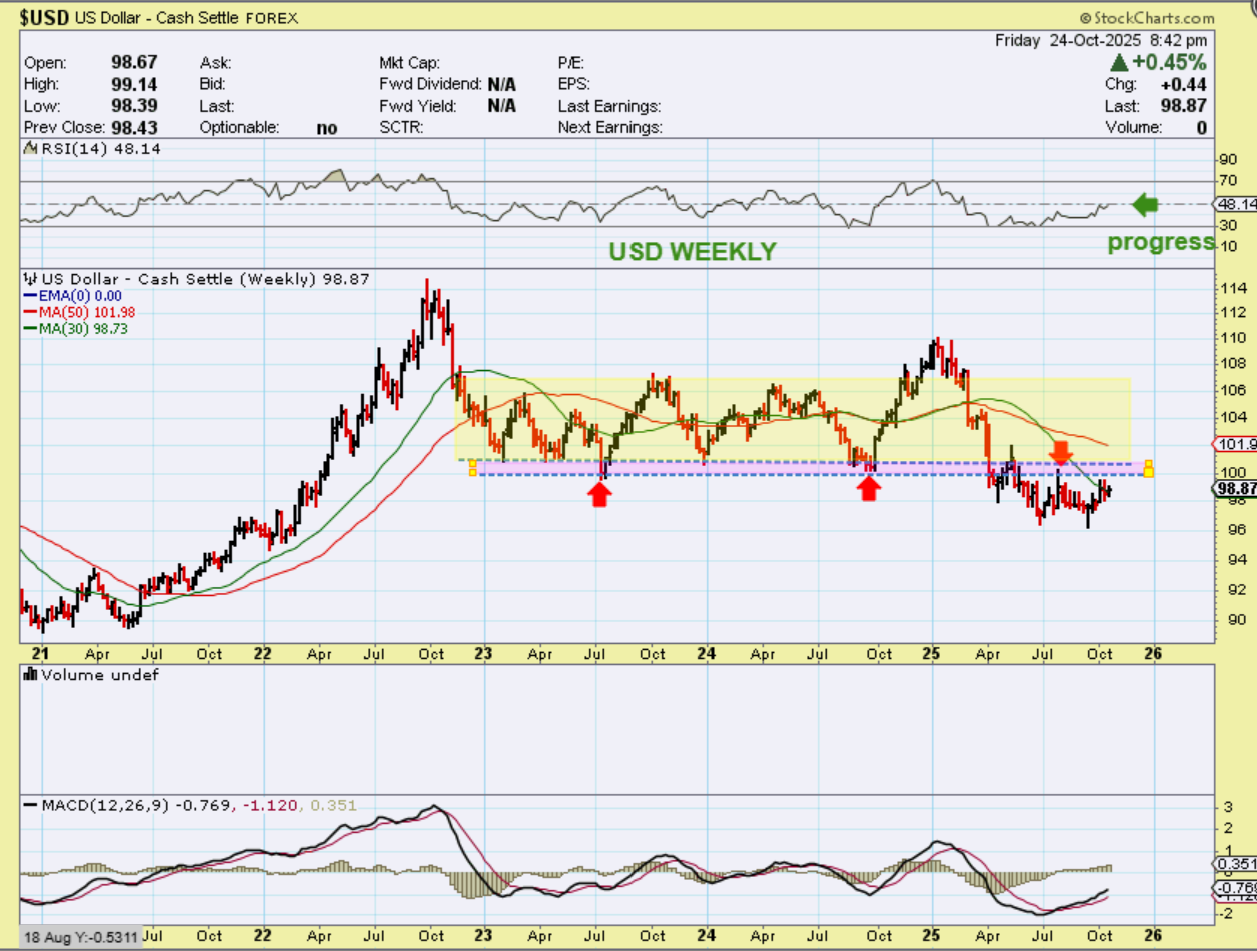
USD WEEKLY – I see improvement with the USD. It is starting to resemble a round bottom base, and the RSI has reached 50%. price also closed slightly above the 30 week ma, and that is a bullish sign on a weekly chart, so the USD may try to get back above the 2025 Breakdown.
.
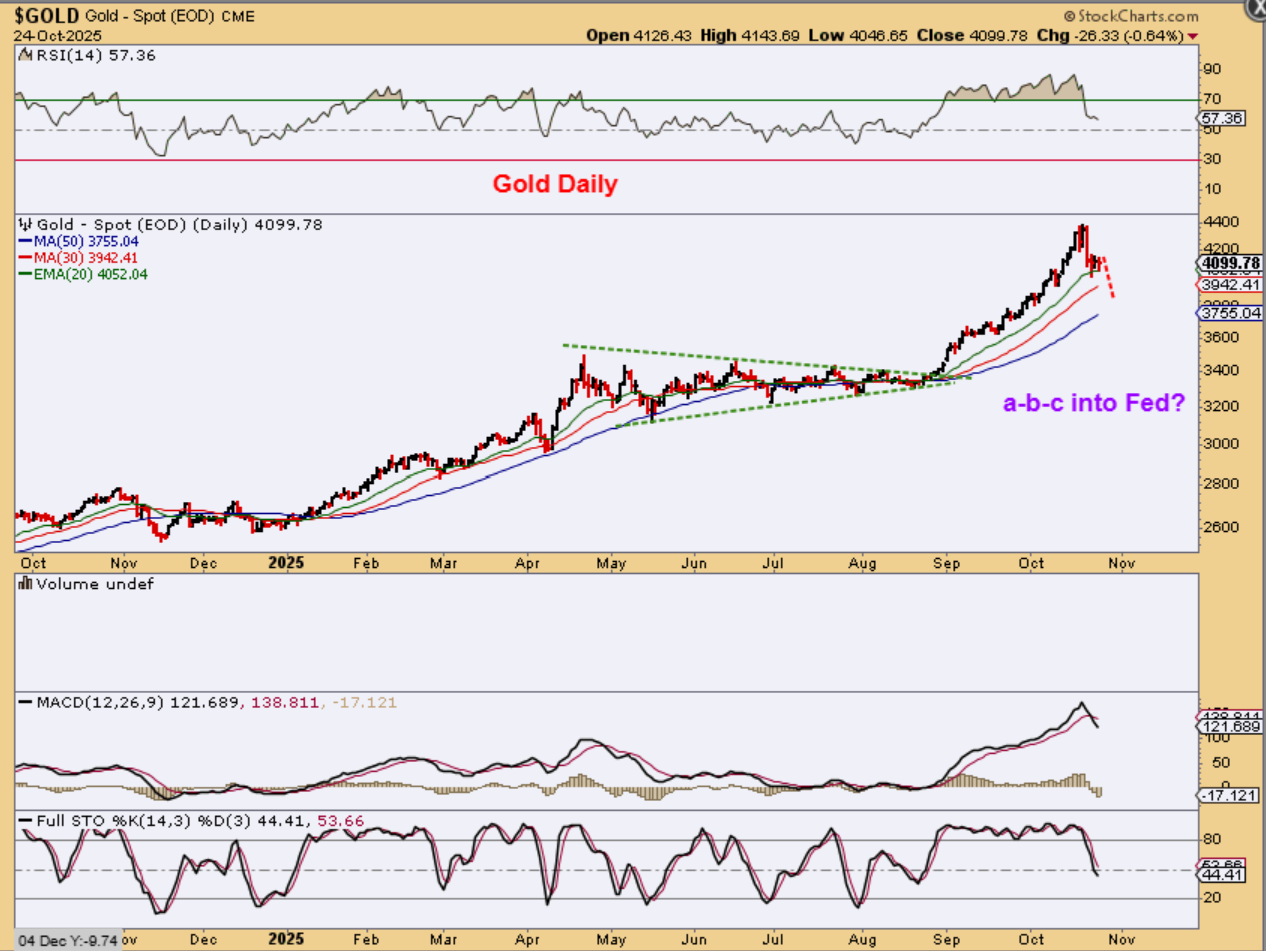
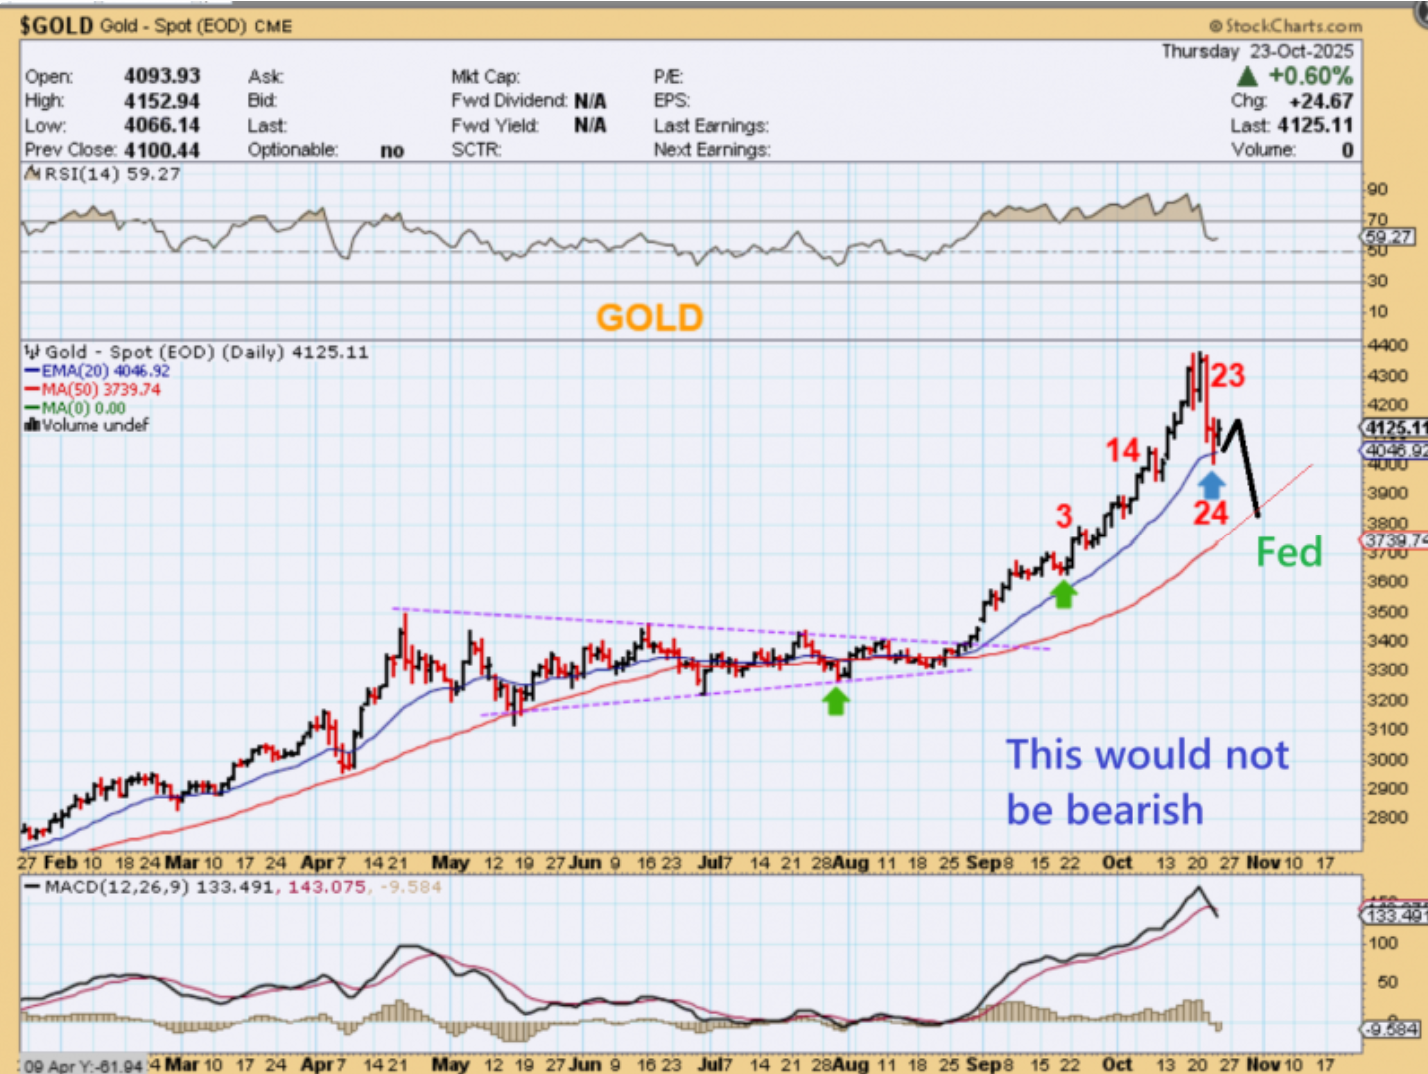
GOLD DAILY – Gold was on day 24 when it reversed this week, so we either have a day 24 dcl, or this could fall further next week as we head into that Fed Mtg. If Gold drops, it could get that RSI to 50% and the stochastics to oversold.
.
GOLD – This is a close up of a drop to the 50sma by Fed Wednesday. That would not make this bearish with day 28 or 29 as a low.
.
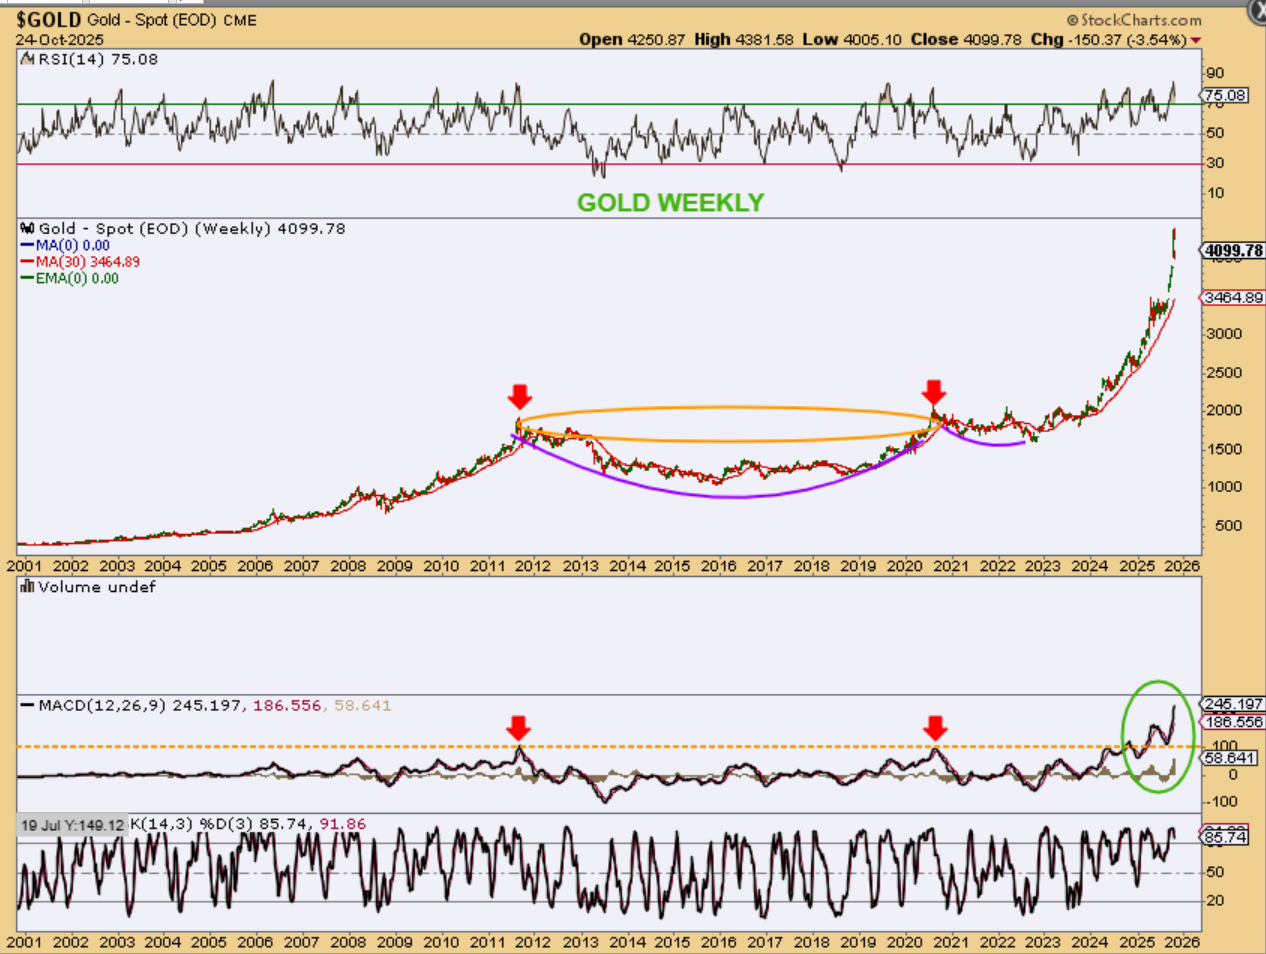
GOLD WEEKLY – Of course, stepping back and looking at the weekly chart, we do have a parabolic type of a move. It looks somewhat straight up since that run out of the long choppy consolidation in 2025. This will not be sustainable for much longer, so it could peak at any time.
.
Also, take a look at the MACD compared to the 2011 and 2020 rallies. That is extreme, and so again, this will not be sustainable for much longer. It could peak at any time and may have peaked already.
.
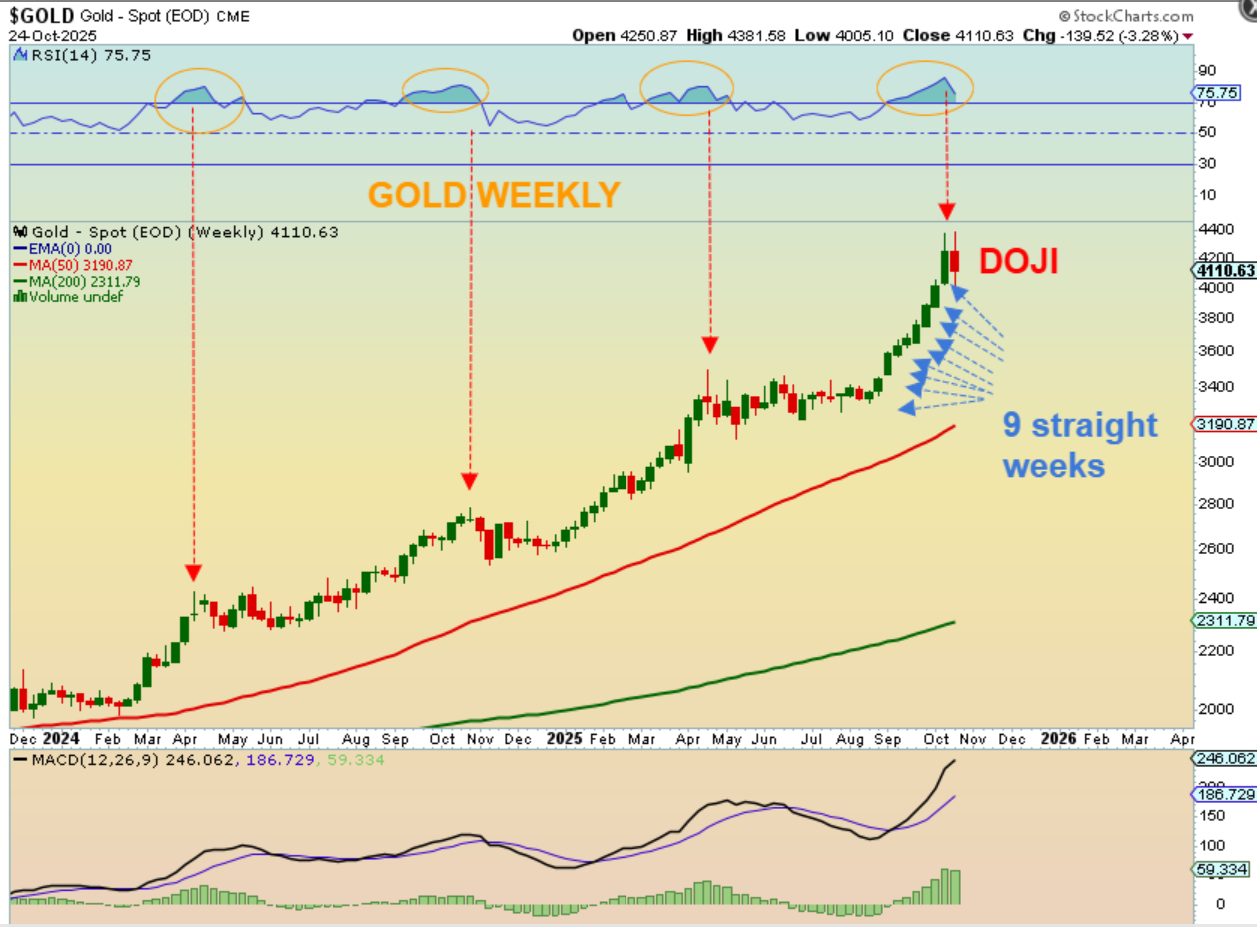
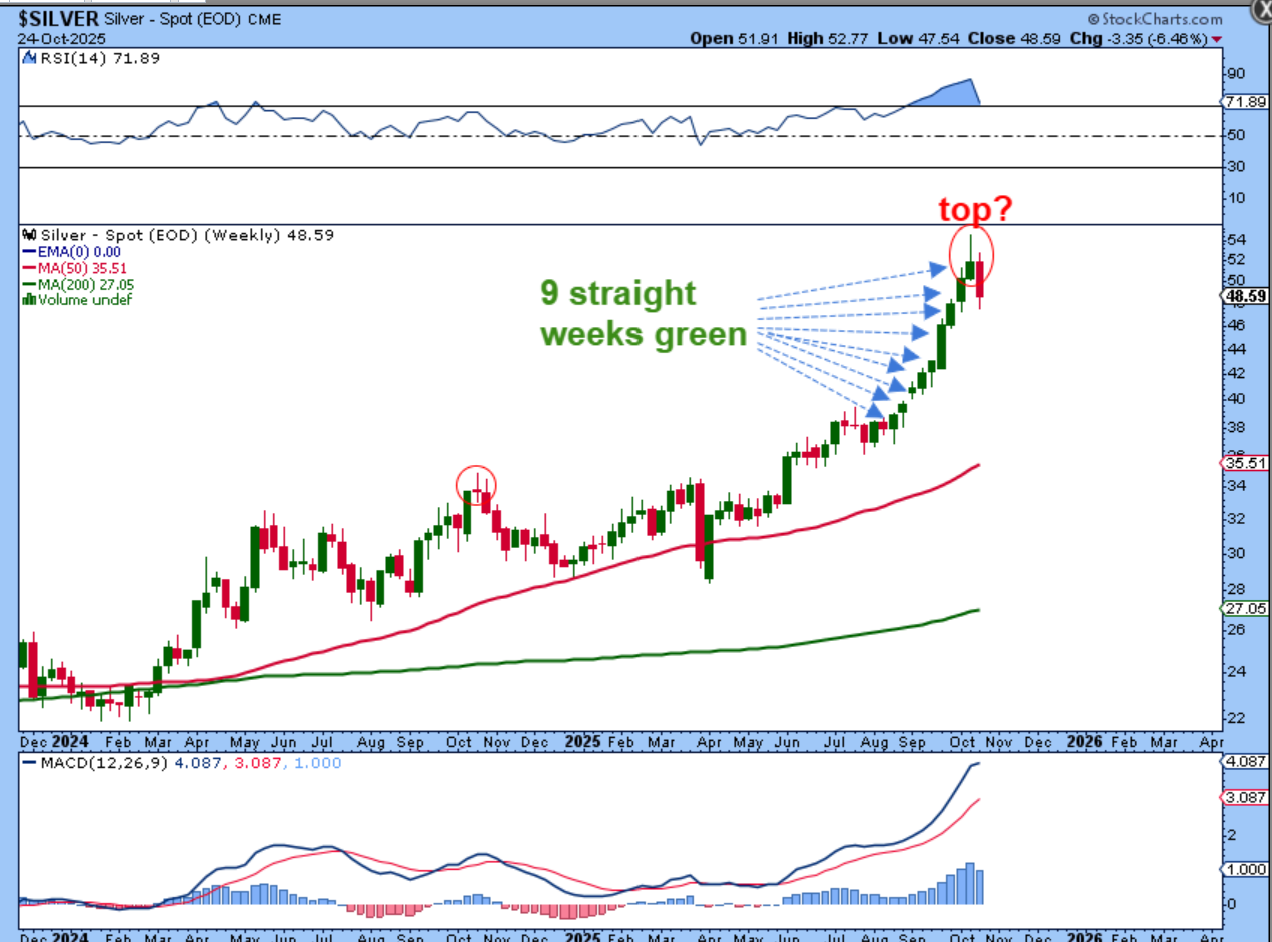
GOLD WEEKLY – A 9-week rally is why that looks straight up on a big picture chart, and a DOJI starts the selling. I think that it is very possible that Gold is topping or forming a peak here and will begin a drop into the ICL over time.
.
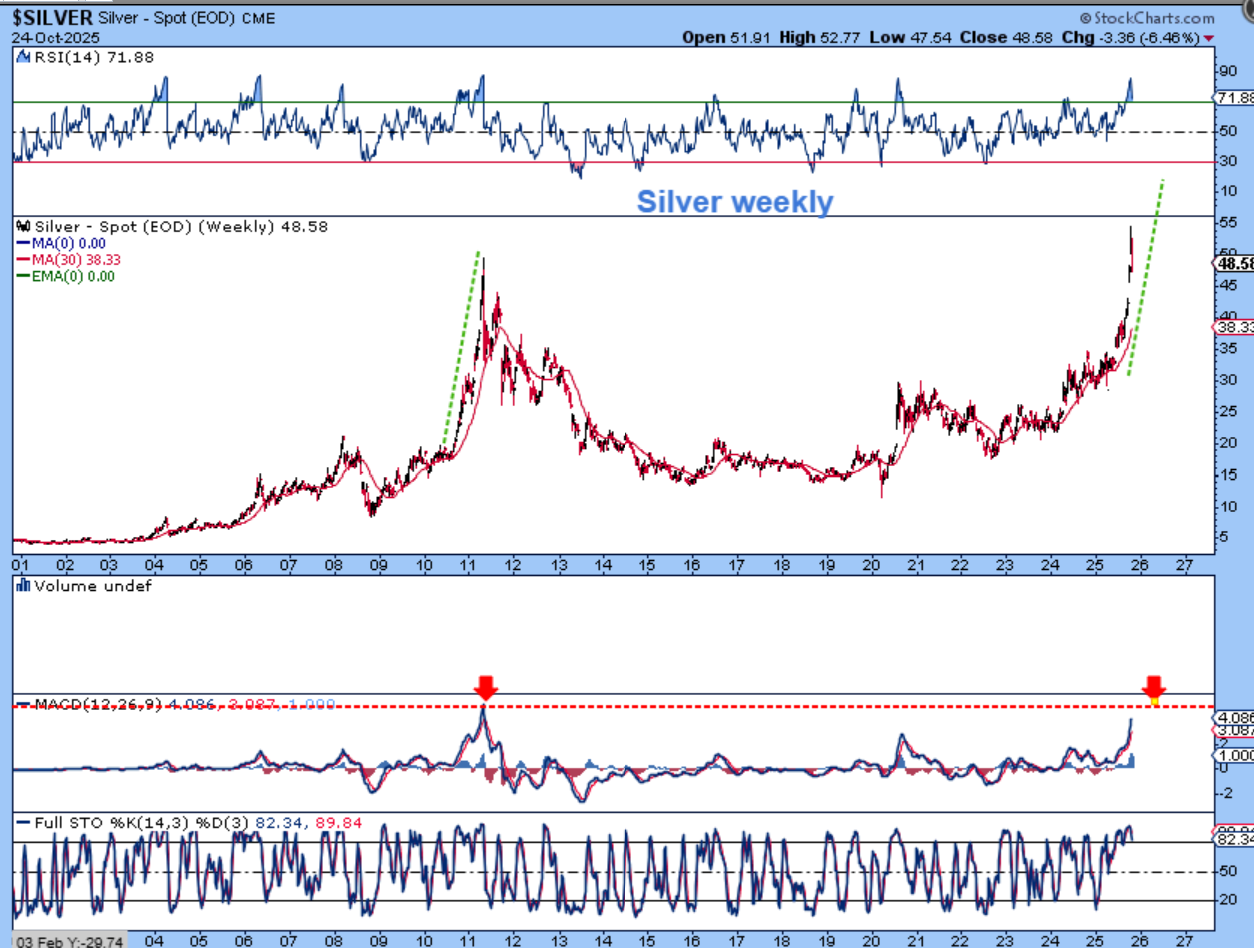
SILVER lagged Gold, but it has been playing catch up and is also looking rather straight up on the big picture chart. The MACD here is not as overheated as it was in 2011, but it is above the 2020 rally and all other times except for 2011.
.
SILVER had a topping candle last week, on top of 9 straight weeks higher too. If you look at this chart, where would you find the deepest low in 2025 (The ICL)?. It is easy to see that the last ICL was in April, over 6 months ago. Our daily charts showed this as a 5th daily cycle, so Silver is due for a pull back and we had a 6% drop last week. Even if we get a ‘Pop’ with a fed rate cut, we may have seen the top already. An ICL is due. Buy the rumor, sell the news.
.
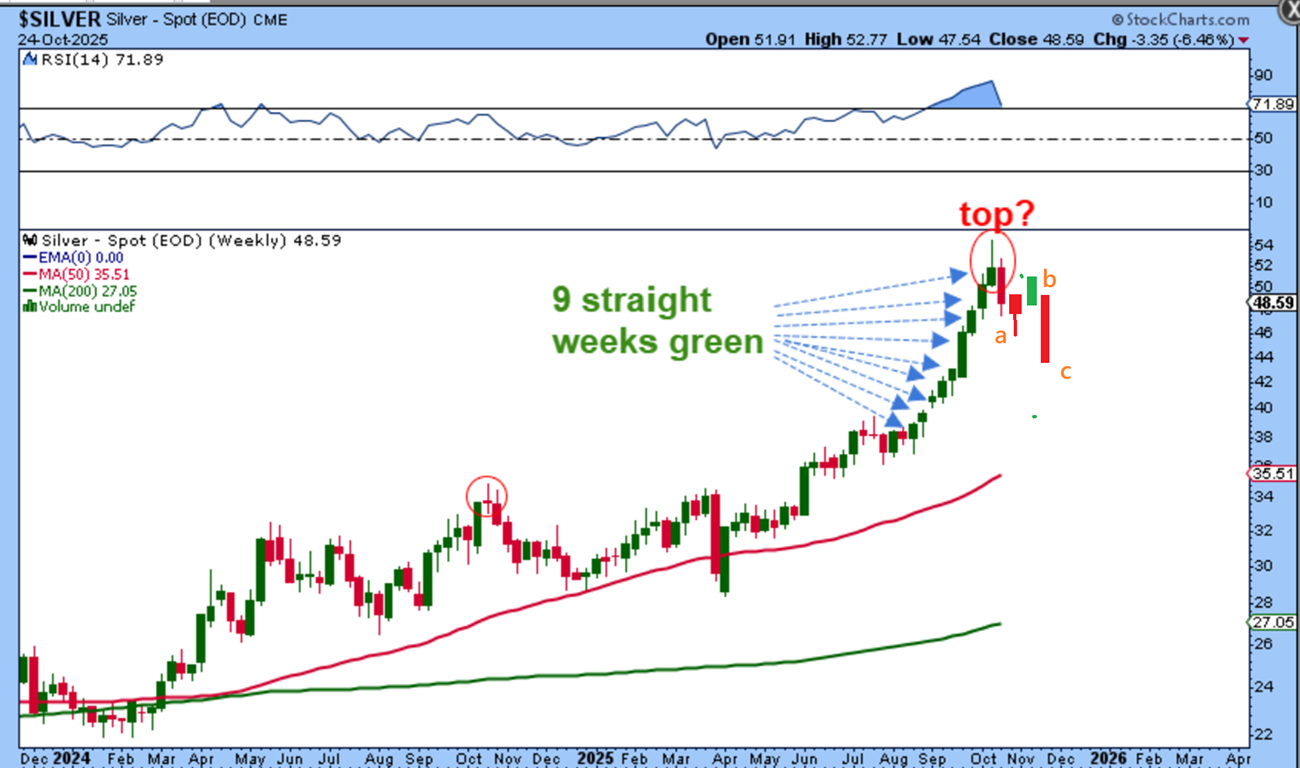
SILVER WEEKLY: I drew a drop next week that reverses after the fed (reversal candle at ‘a’). Then a pop that rolls over before making new highs. a-b-c down. Just an idea of how this could play out, not a prediction.
.
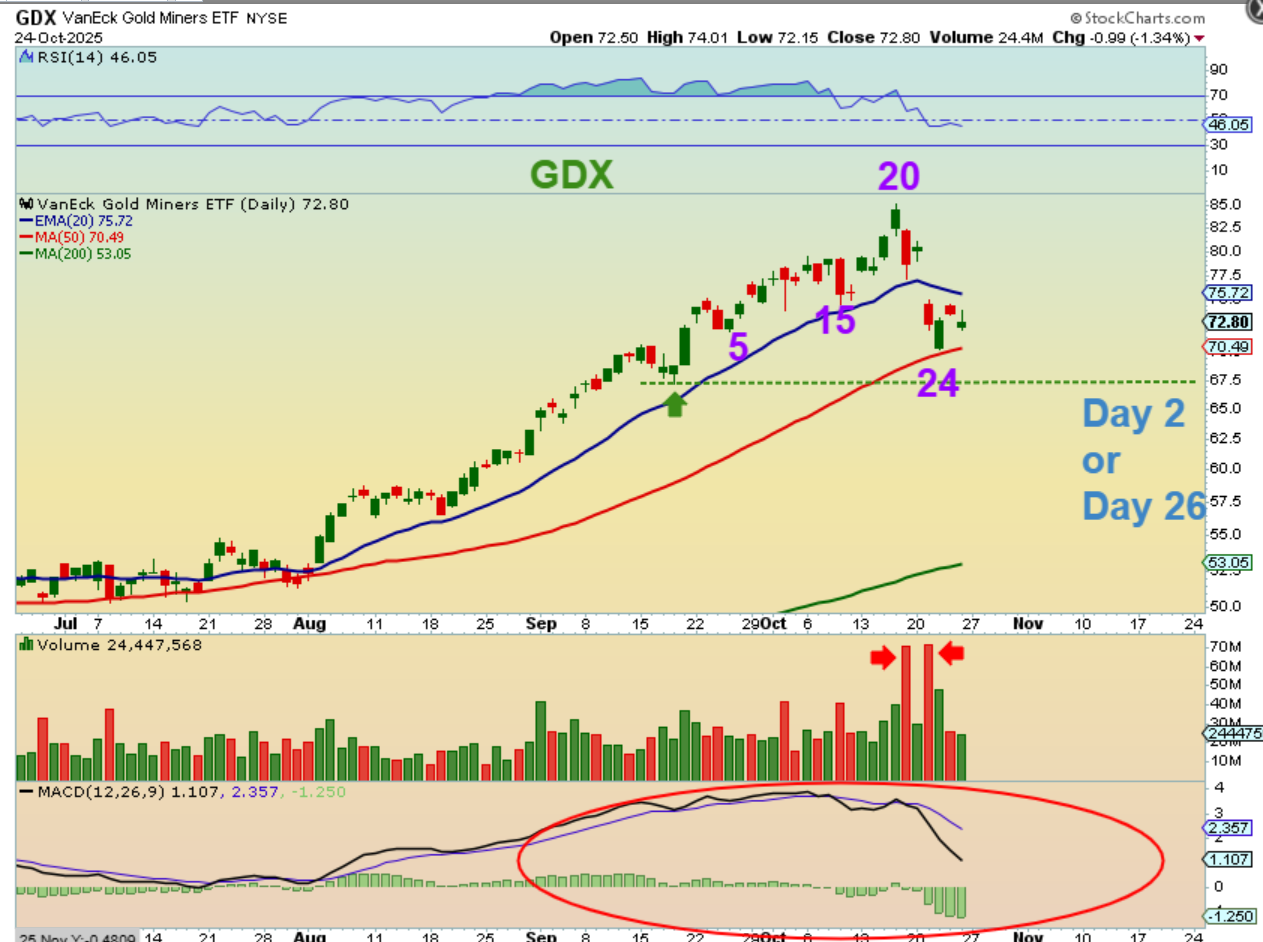
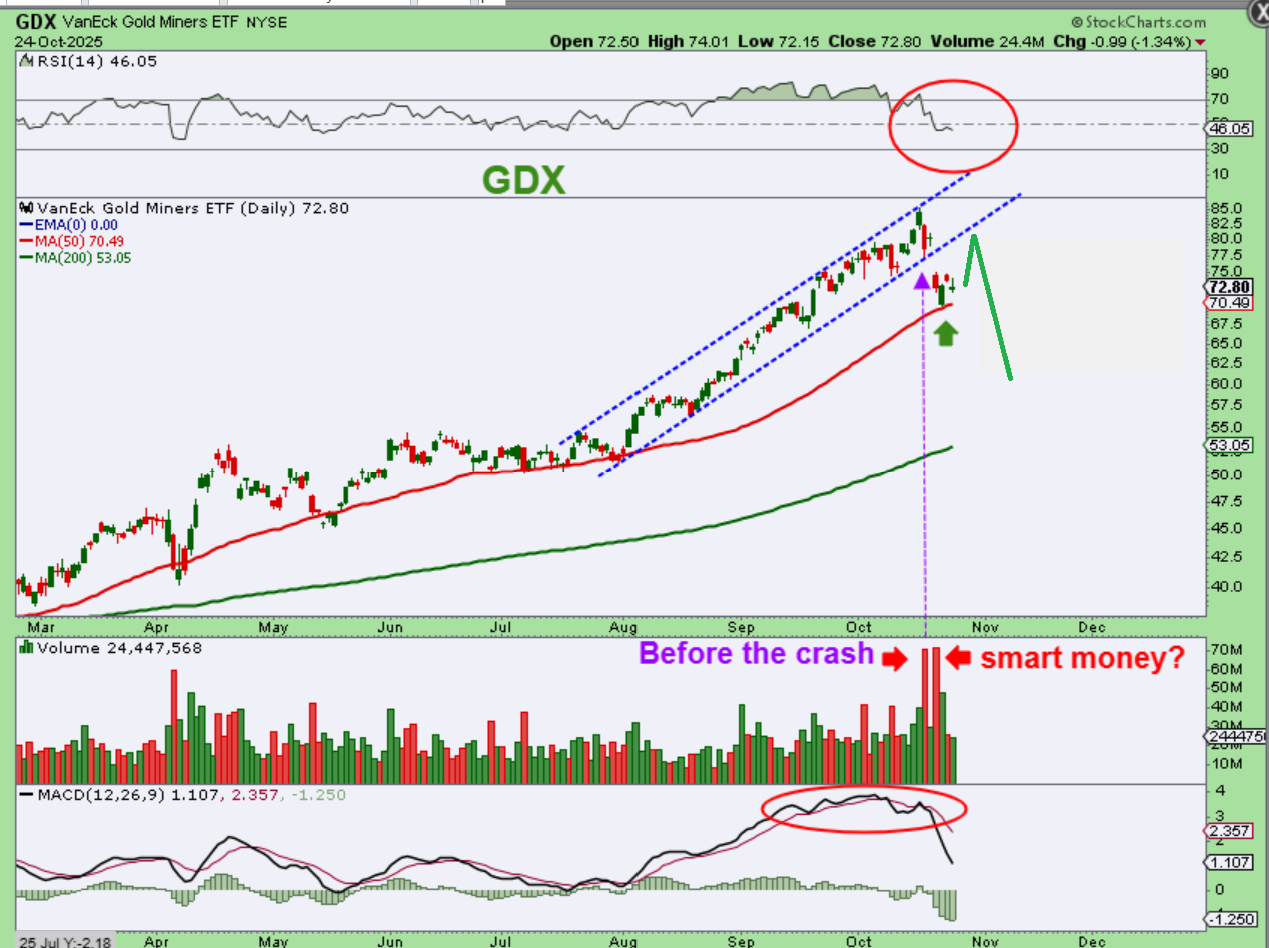
GDX – I did not like the MACD on GDX. The Miners dropped sharper than Gold & Silver. They often lead the way when smart money is buying or selling. We currently have a peak on day 20 and a low at day 24, but this also could drop one more time to give us a day 30ish dcl rather than day 24. Now take a look at that volume…
.
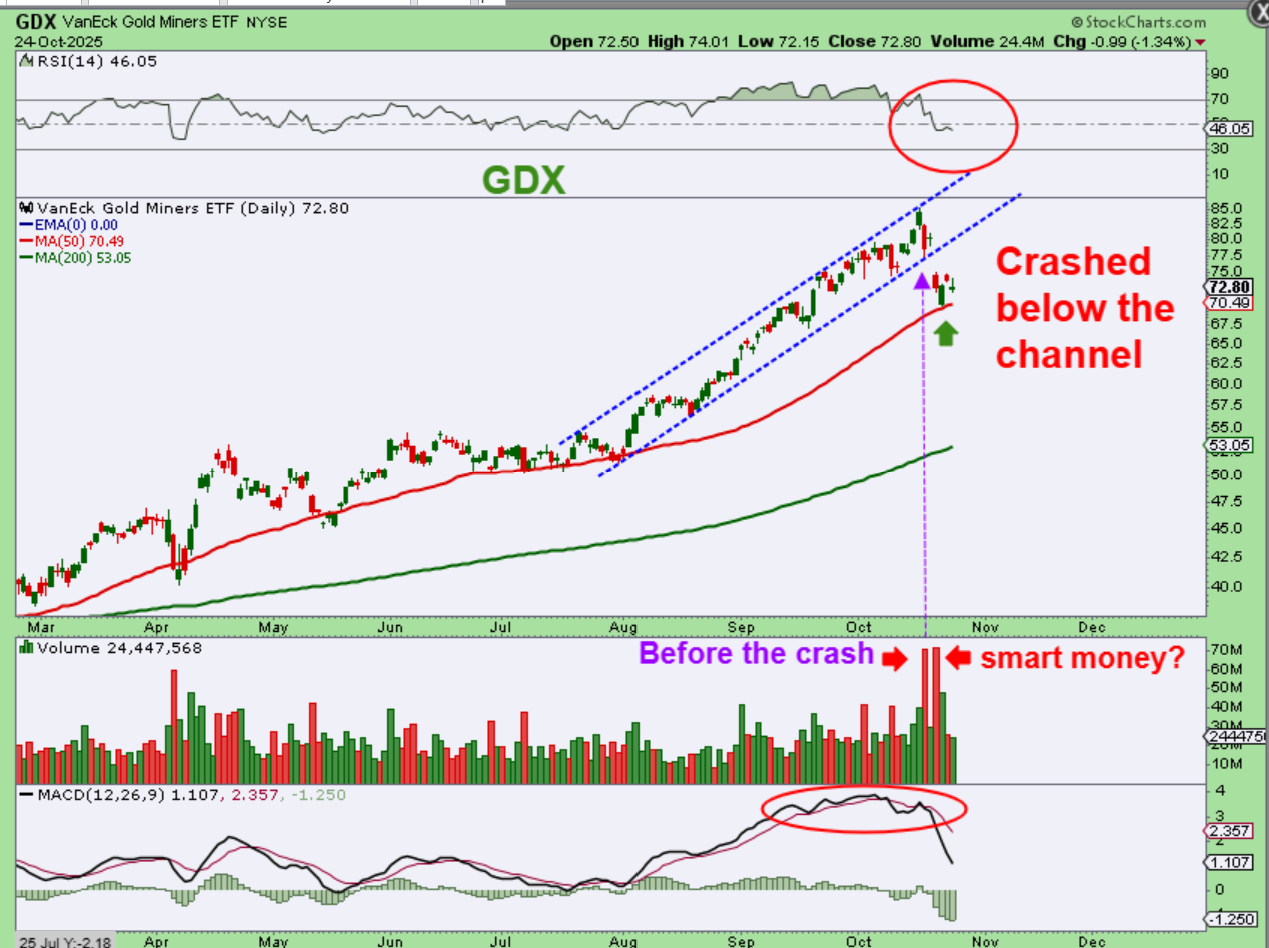
GDX – Even before breaking that trendline, Volume surged. GDX paused for a day and then gapped down below that trendline with massive volume again. This looks like a top.
.
GDX – Additional ‘Buy the rumor, Sell the news’ could be that we’d see buying or a bounce into the Fed Mtg, and then a sell off after. A back test of that lower trendline. I know that landing on the 50sma as support is bullish looking, but I also keep looking at the next chart…
.
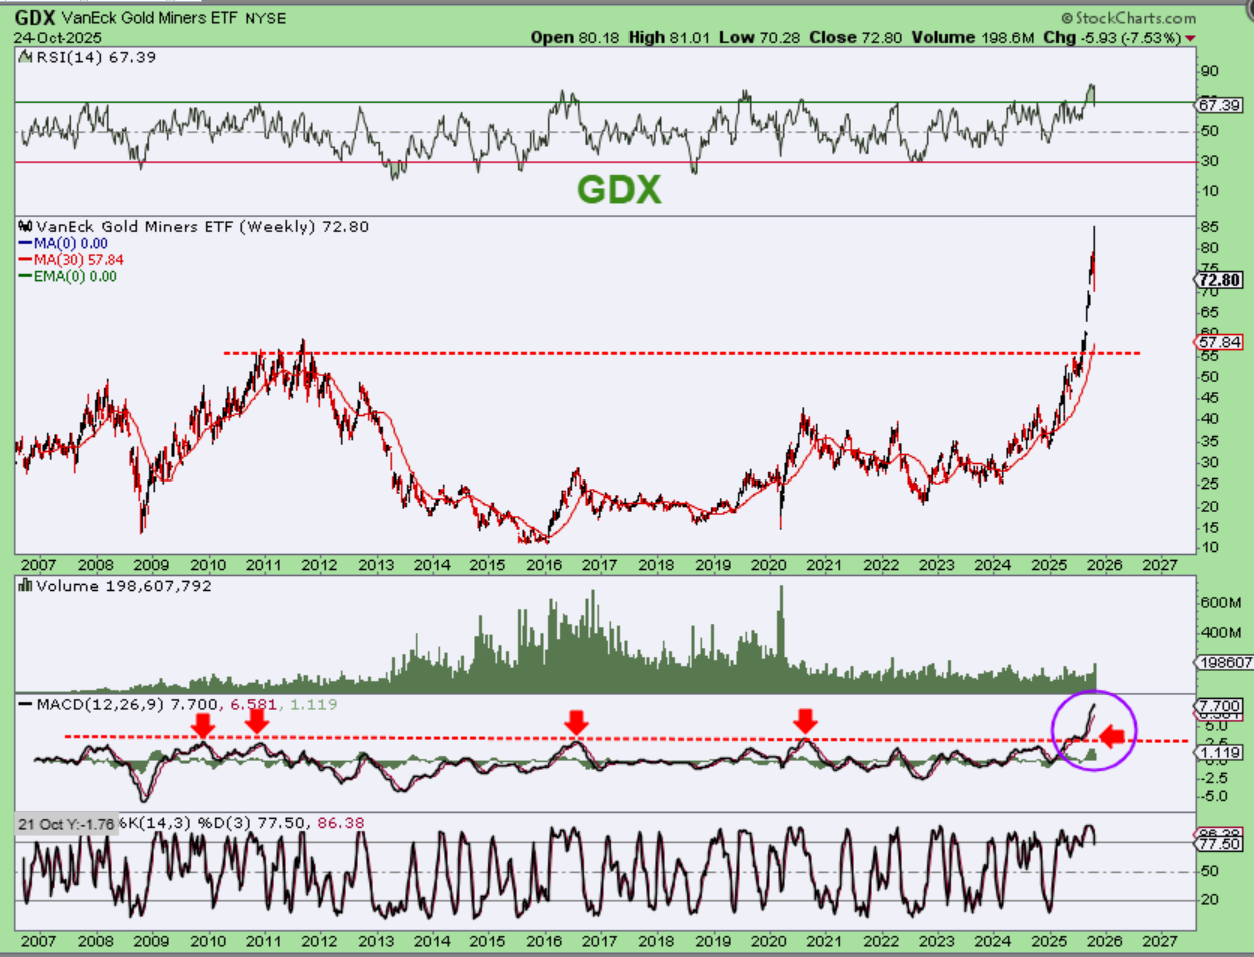
GDX WEEKLY – Again, take a look at the MACD. That is EXTREME as price moves sharply higher. Prior peaks for the GDX chop lower, so it is possible that we do not see a higher high if we bounce from here. We are due for an ICL and this could just chop lower.
.
A deep ICL pullback in any sector is not fun to ride lower, but they can be very rewarding if you buy once they are in place. Think about that steep April crash into an ICL. We have had some GREAT trades out of that low, with many stocks dropping in price quite a bit, yet doubling or more out of the lows. Gold is due for an ICL. Have you begun to lighten up until we see how this plays out? We can bounce heading into the Fed Mtg, or we may bounce after the Fed Mtg (a cut is expected), but timing is not on our side to be ‘all in’, in my opinion.
Each will have to make their own choice based on the set up, my reports, their own experience or analysis, but I think that a buying opportunity is ahead AFTER an ICL drop takes place, and the timing is here for a peak. We may put in a choppy top, since things can bounce and pop & drop with news being presented, but there have been good gains throughout this rally out of the ICL in April. It may be time to sell or adjust position size to lock in gains and be in a good position to redeploy at the next significant low.
Bitcoin is below, enjoy your weekend everyone!
.
~ALEX
.
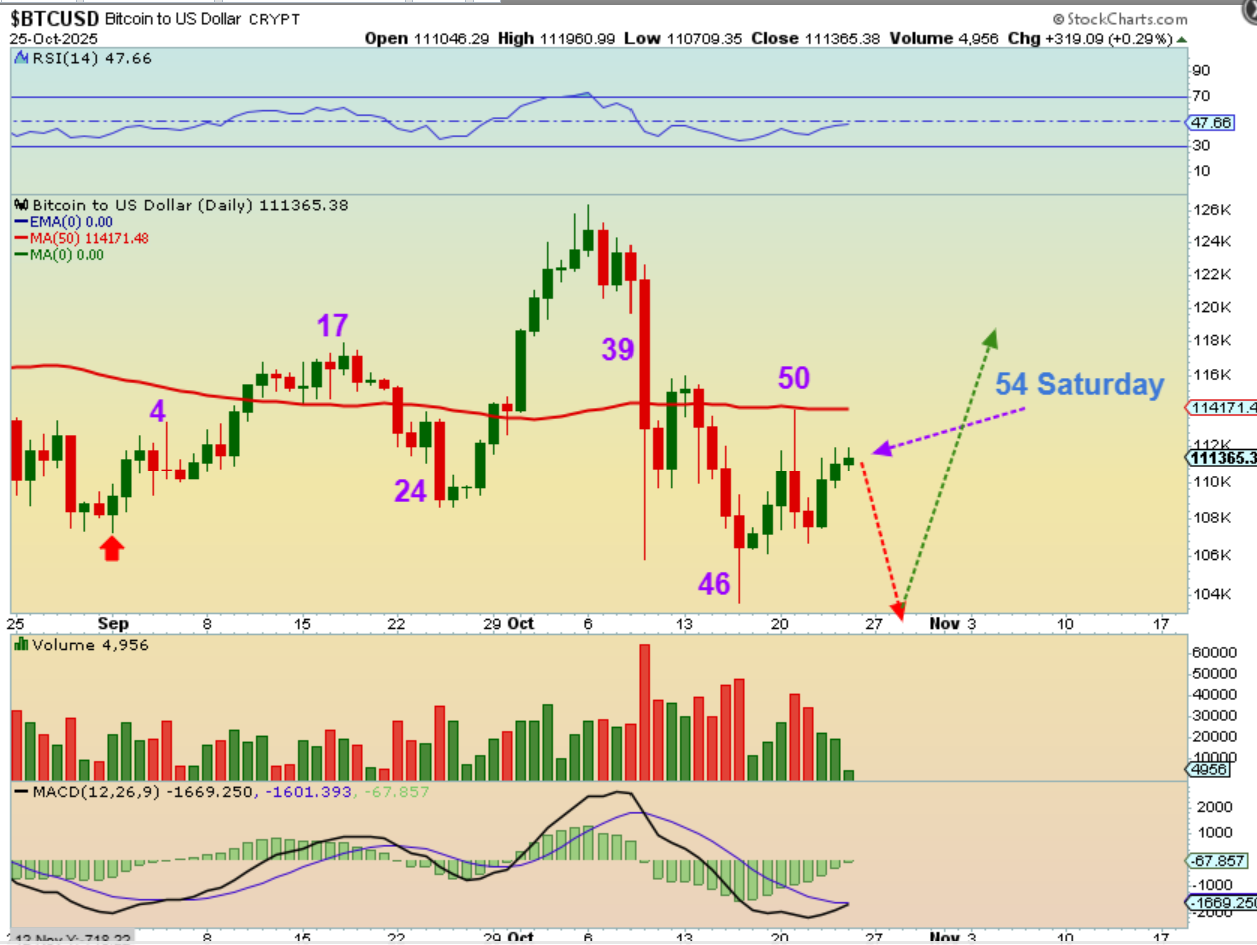
BITCOIN bottomed on day 46, which is really too early for a low, so I would expect a drop next week and then a rally later. I have been saying that with the 4 year cycle, we would expect a larger correction to start sooner than later. Late this year or maybe early next year? The weekly chart seems to tell the same story.
.
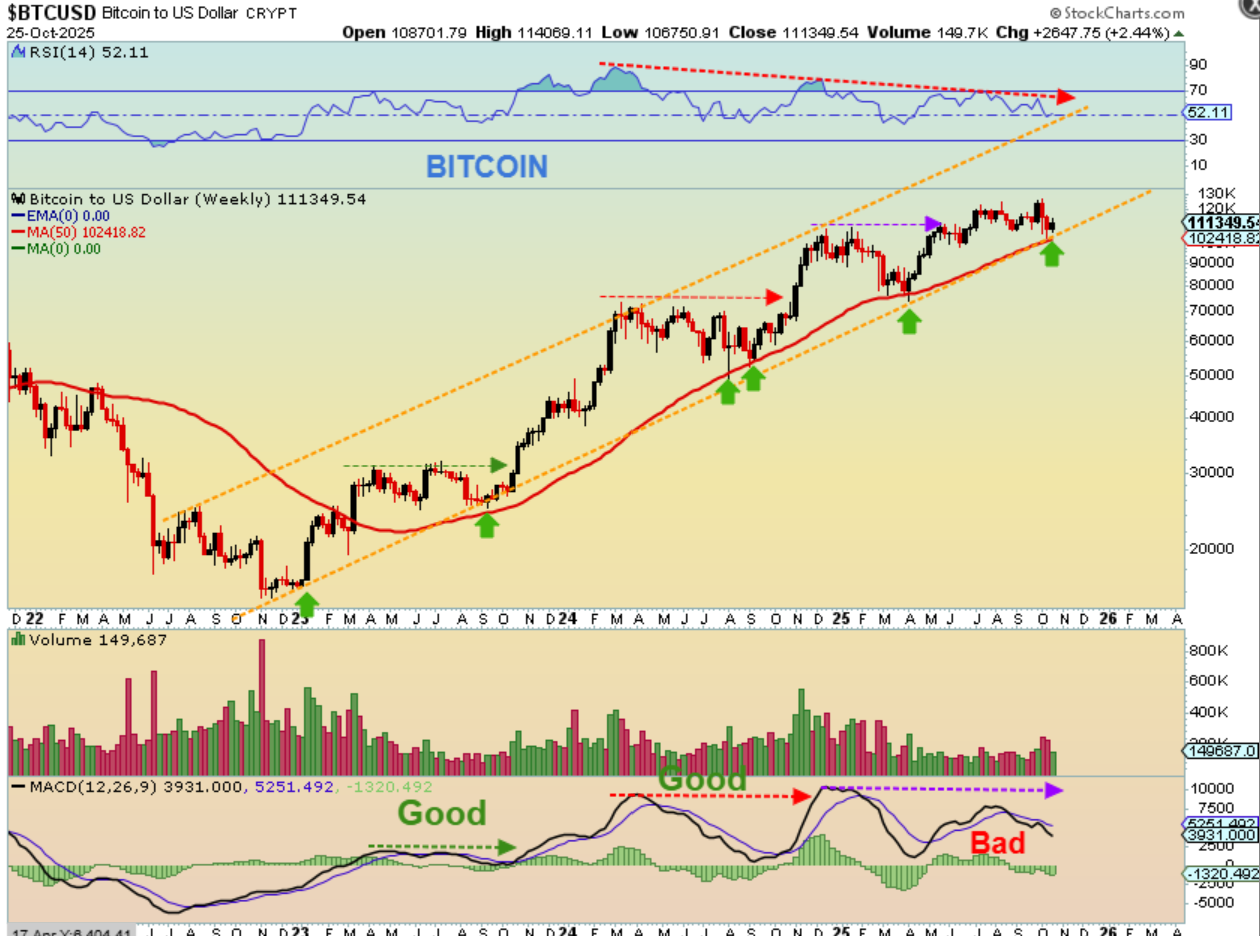
BITCOIN WEEKLY – Take a look at my horizontal arrows. Each new all-time high was matched with the MACD until the last one. The RSI is also confirming weaker bounces and not stronger ones, so time is running out for Bitcoin. The daily chart showed us that we are near a 60 day low, and then a good bounce can take place, but that may be the peak of the 4 year cycle. This chart actually looks weak to me, like it wants to sell off now, but another bounce and daily cycle is likely based on the count.
Friday October 24th 
 Tuesday October 28th – At This Point
Scroll to top