October 18th Weekend Review – Behind The Beauty
In some areas of our Bull Markets, I find that ‘Behind the Beauty, cracks appear’. These are the things that we look for, not to call a bear market, but to anticipate a pullback or consolidation and take it from there. Let’s review our charts.
.
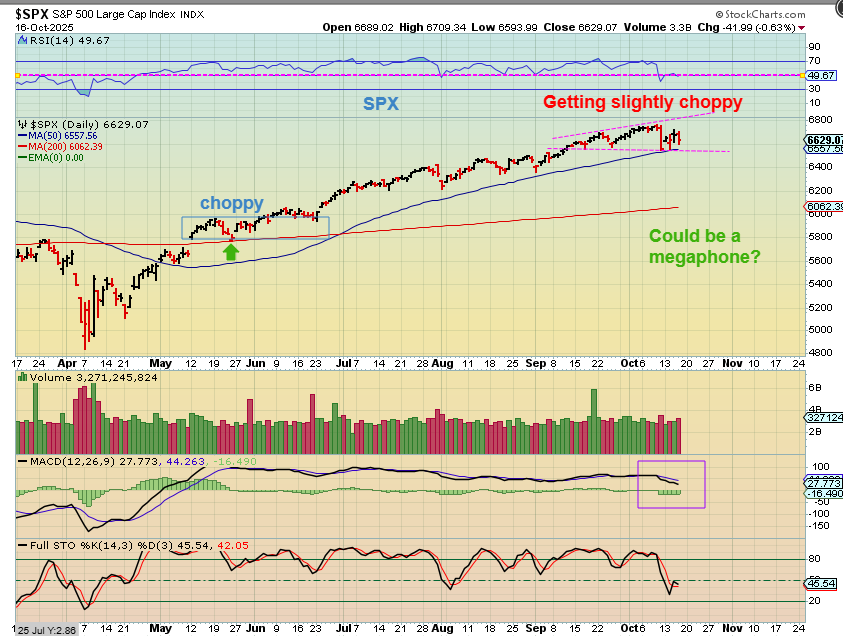
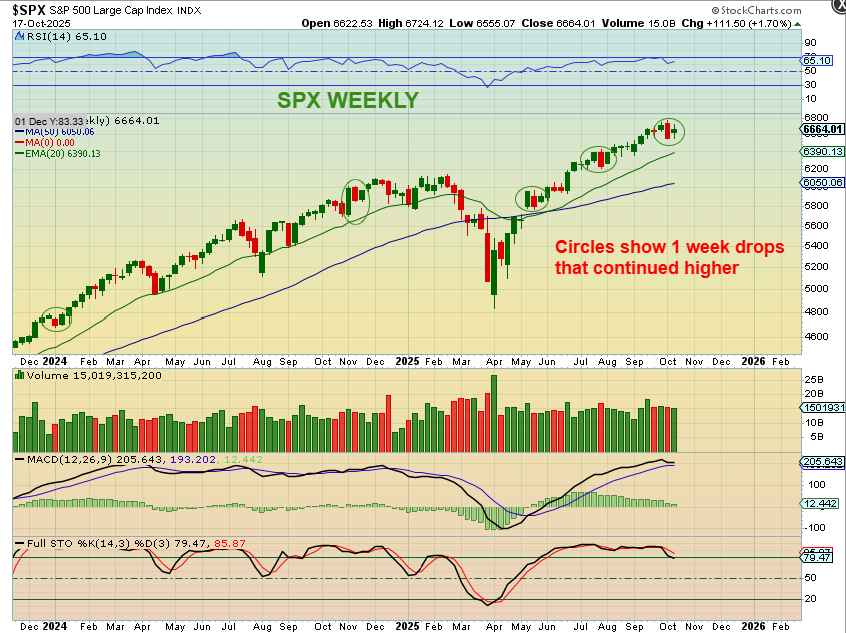
On Friday I mentioned the possible bullish bullhorn and the choppiness of THE SPX with this chart. If you look over at May and June, you can see that this kind of price action is normal, and it is not really bearish unless the lows are broken.
.
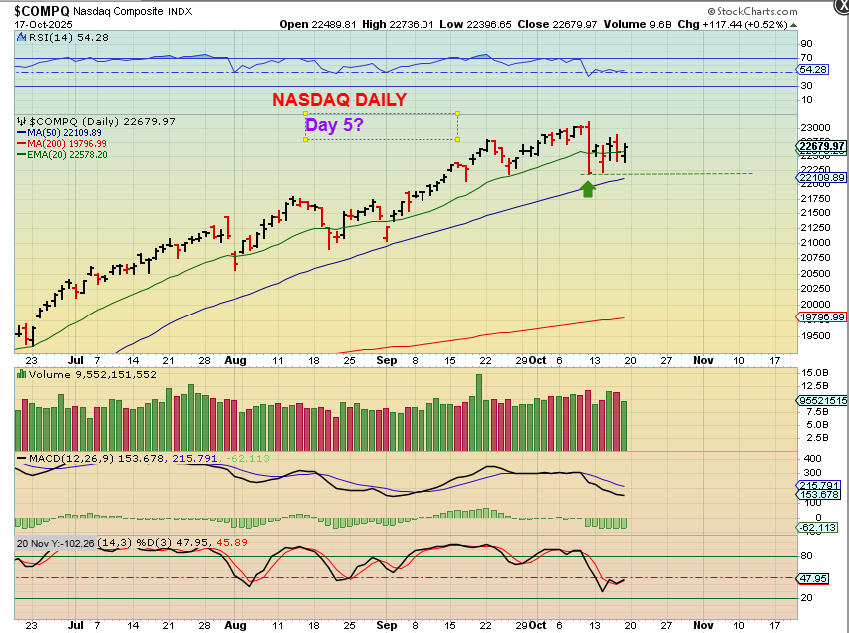
NASDAQ Day 5? – On Friday we moved higher and I’m not finding any real Cracks here at this point. We were due for a dcl and the drop a week ago may be that dcl. It doesn’t get confirmed until we move above that large candle so all you can do is buy with a tight stop and hope that we move higher. The Fed Mtg is in 8 trading days.
.
What if the markets dropped on Monday?
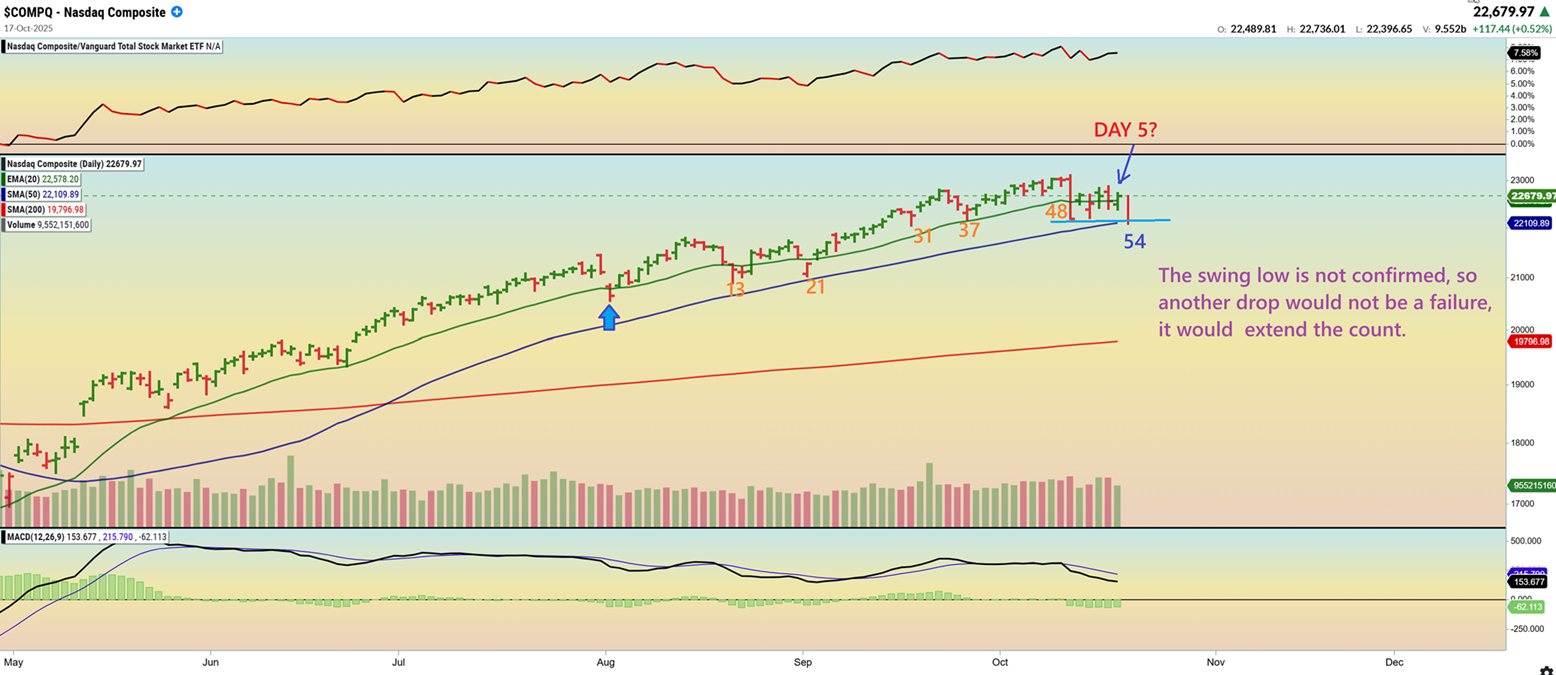
The NASDAQ could be on day 5, but even if the markets drop below day 48, that doesn’t mean a failed daily cycle necessarily. We were on day 48 at the low and it is possible that we could make the real dcl at day 54 with a tag of the 50sma. We just have to take things as they come until things clear up.
.
THE WEEKLY SPX: We have seen a few of these 1 week drops (1 red candle) followed by a small green one and then a push higher, so again, I don’t see anything standing out as bearish cracks here yet. That said, some of our individual stocks DID take a hard hit. My Energy and some Tech stocks lost over 10% in a day, so the caution flag is up. We are starting a 4th daily cycle and we are 6 months ahead of the April ICL, so a deeper dip after the Fed is possible. I’ll cover things in the daily reports and we can all STAY FROSTY!
.
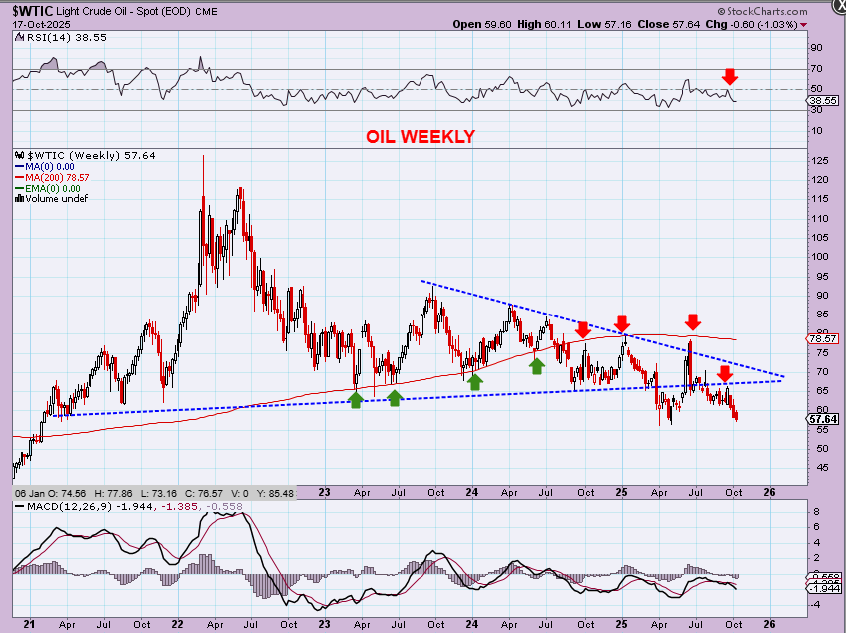
WTIC broke down and recovered with the war breaking out in the Middle East, but things have settled down for now and Oil broke down again. Oil is back at the lows in the $50’s and it can continue lower.
.
Very Interesting.
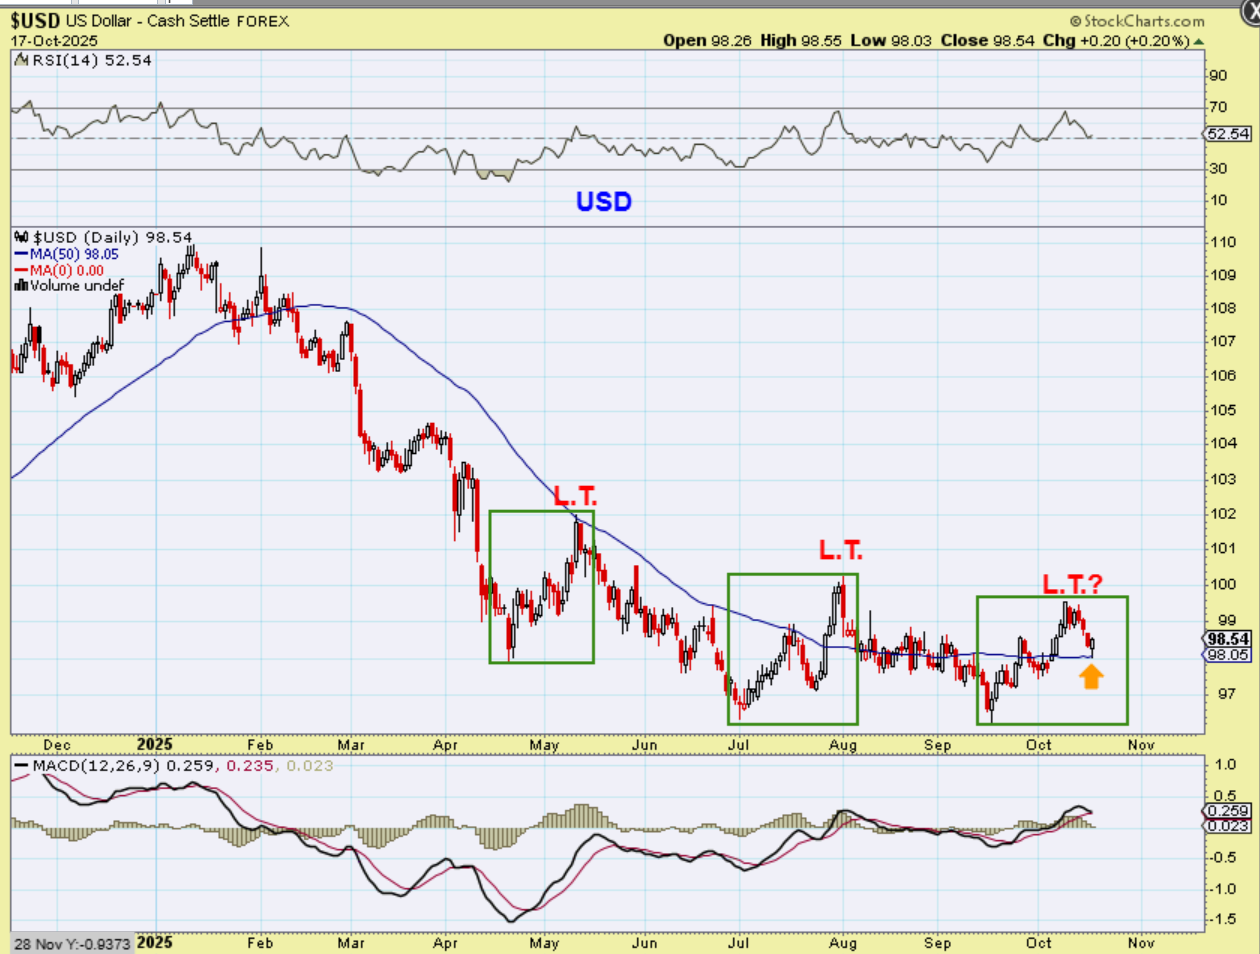
The USD has done what I was thinking it would do, rally higher in choppy fashion and put in a lower high. But on Friday it DID find support at the 50sma. That means that it can move higher with a bounce and break to a new higher high and even become more likely to be a right translated daily cycle. Stay tunes, but no real cracks here yet either.
.
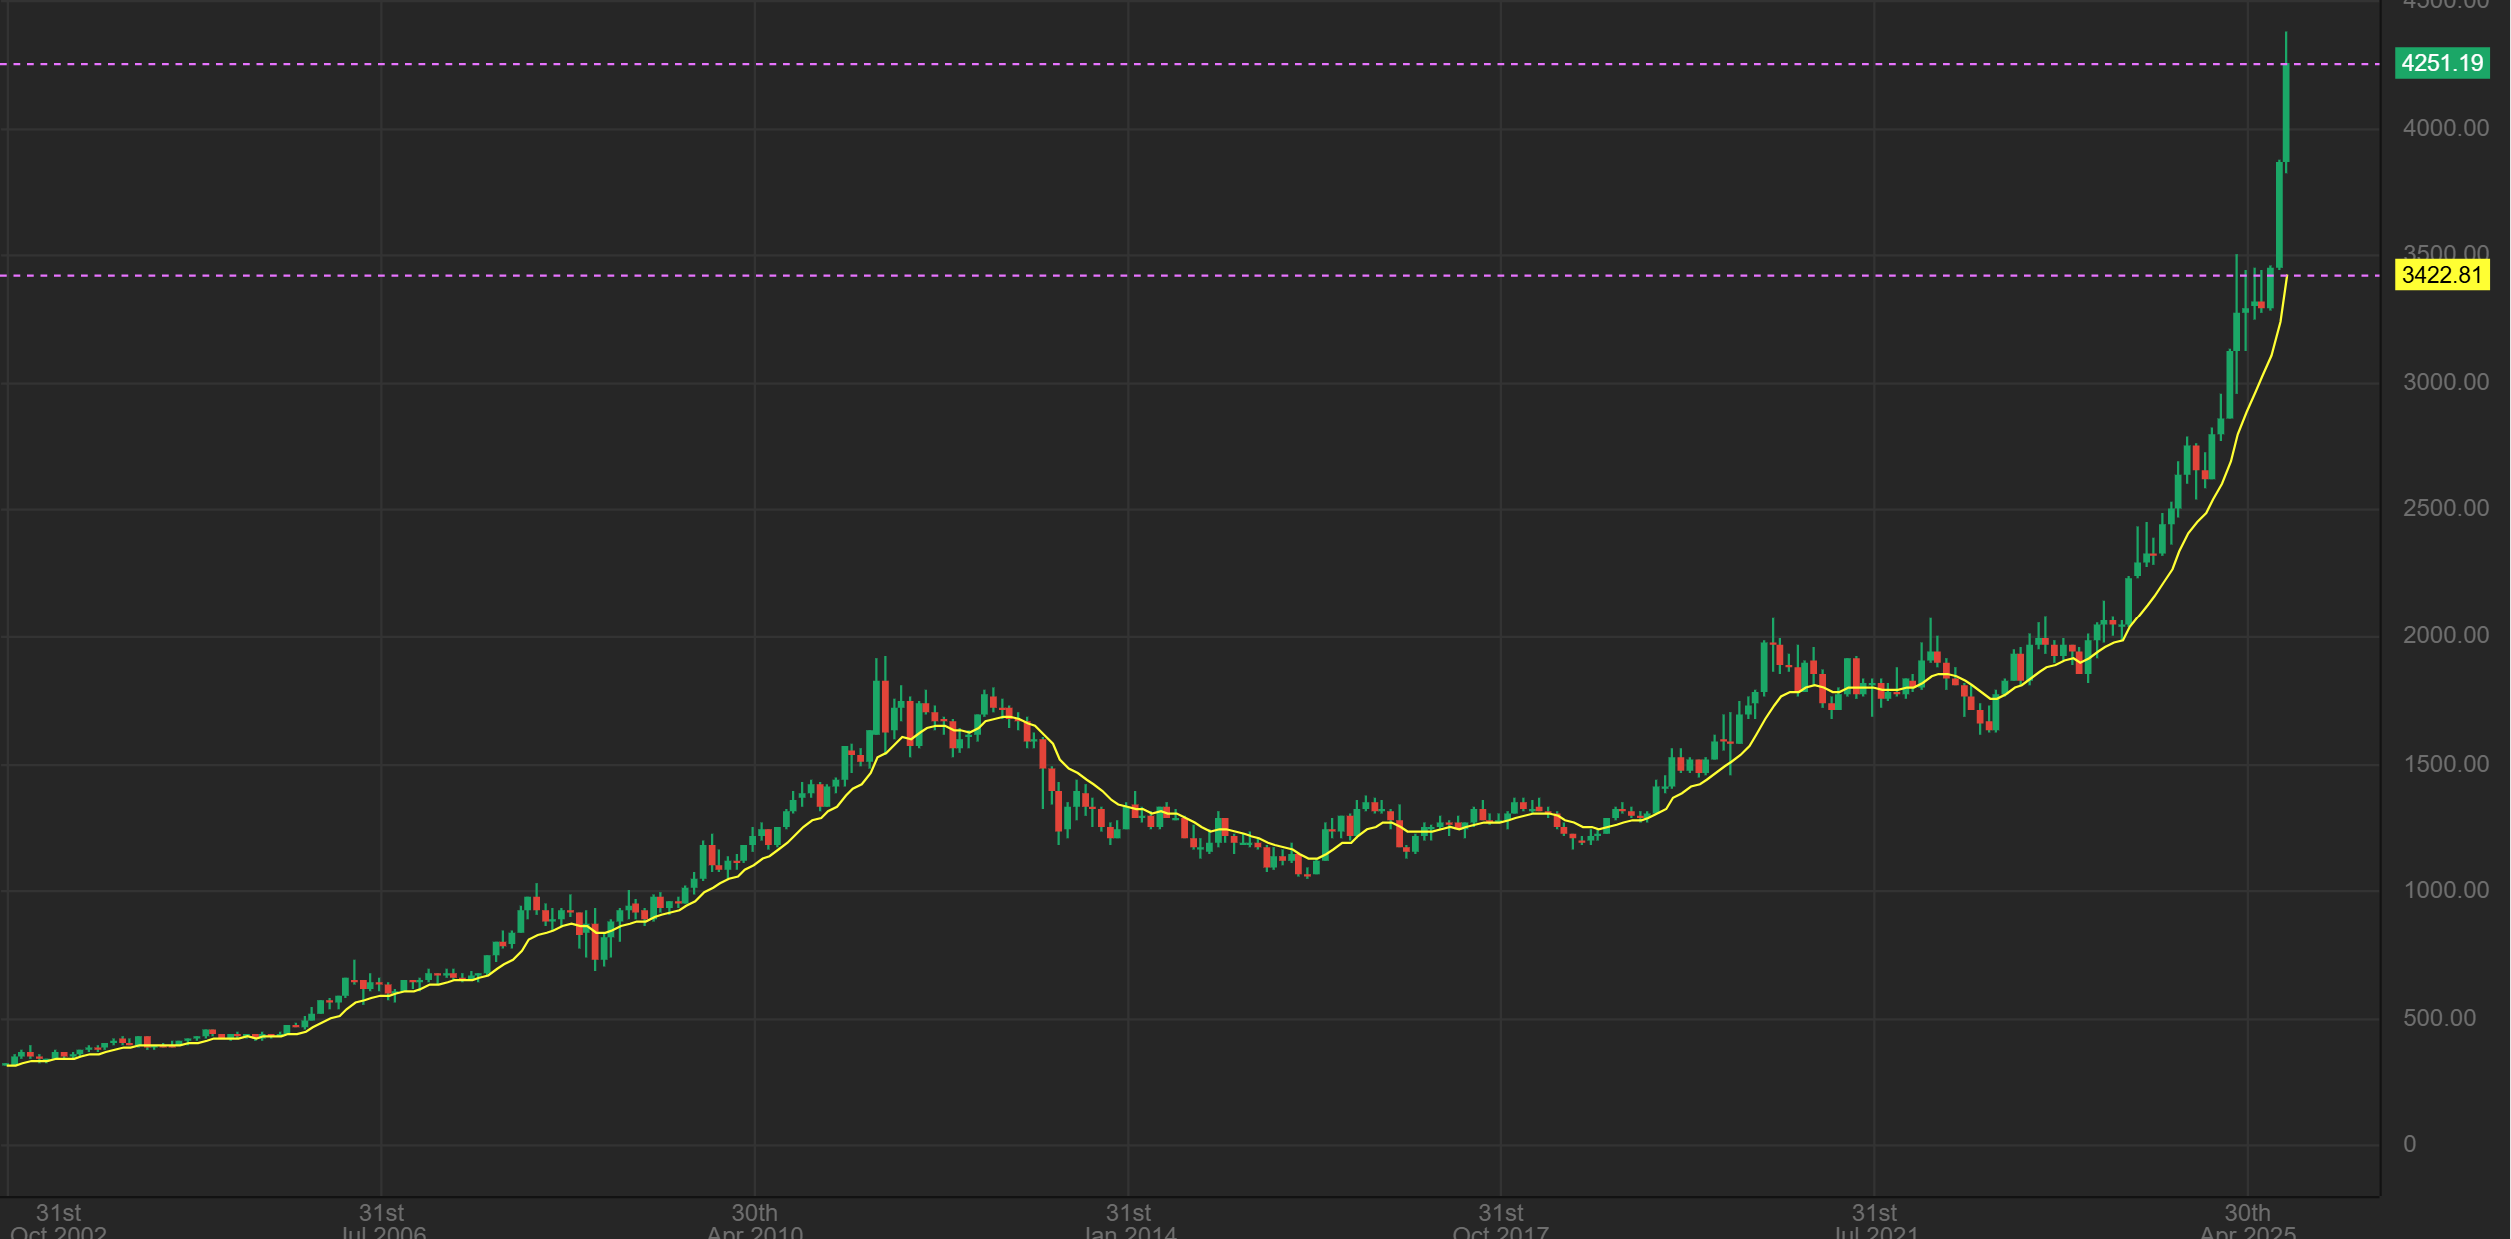
With GOLD on this Monthly chart, we’ll just keep in mind that this looks like a parabolic blow off top. They don’t end well, but it’s also hard to say when they’ll end, and that is where we are now. Another week or 2 higher into the Fed? The last 2 weeks were the biggest candles on this chart by far, and THAT should say a lot about this move. It may be the ‘end move’, so I will have a special lesson in this report later.
.
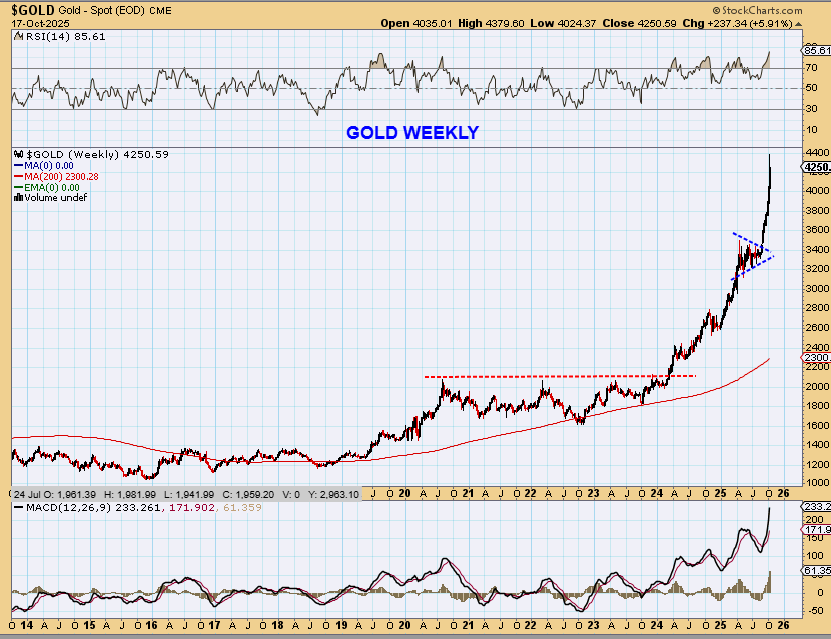
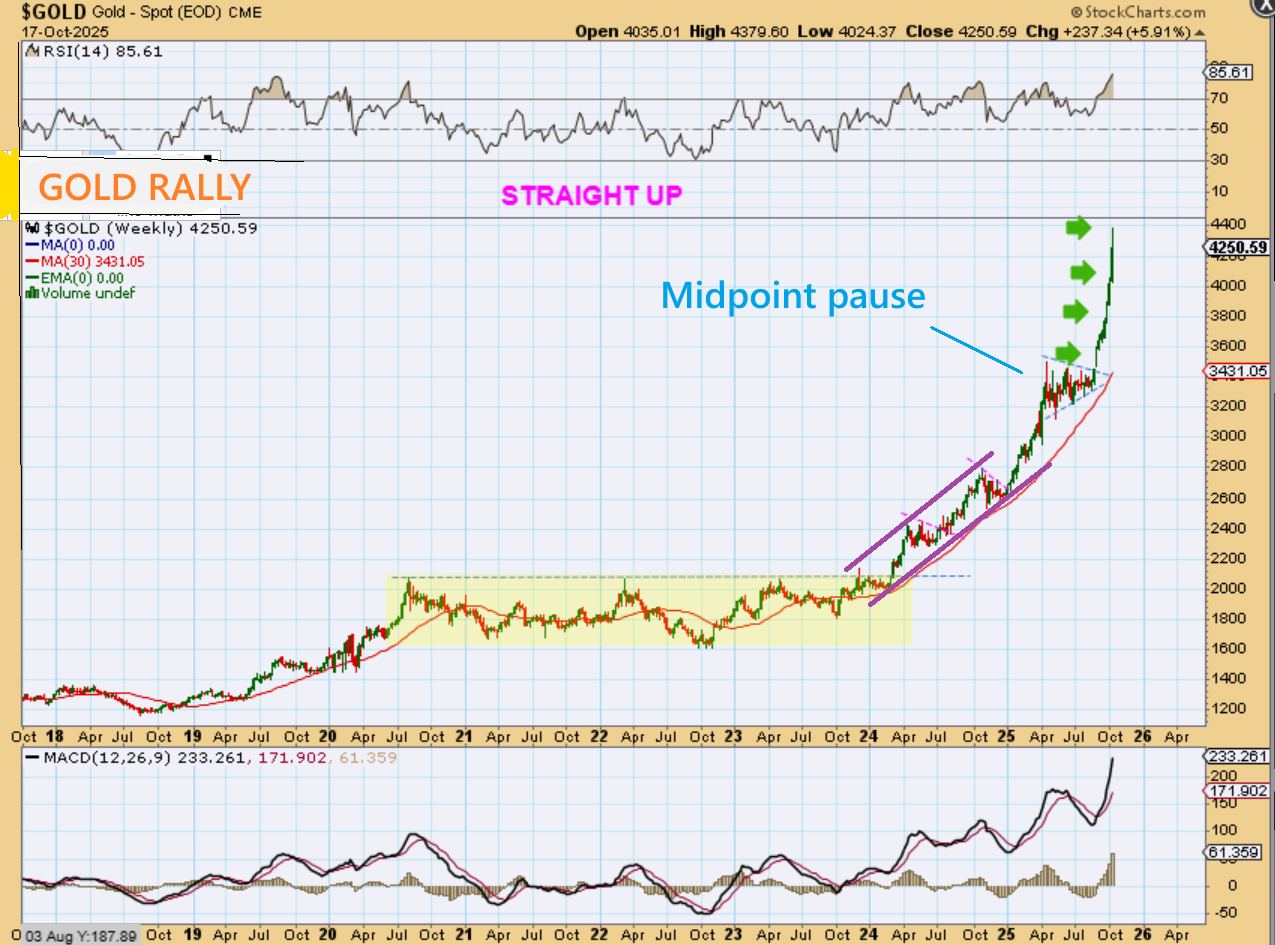
GOLD WEEKLY – It is very possible that the LONG consolidation that we saw on the daily charts, that turned into a triangle or pennant was a halfway point or mid-point consolidation of a rally that ends with a blow off top. That is what it is starting to look like now, to be honest. This move is straight up, right?
.
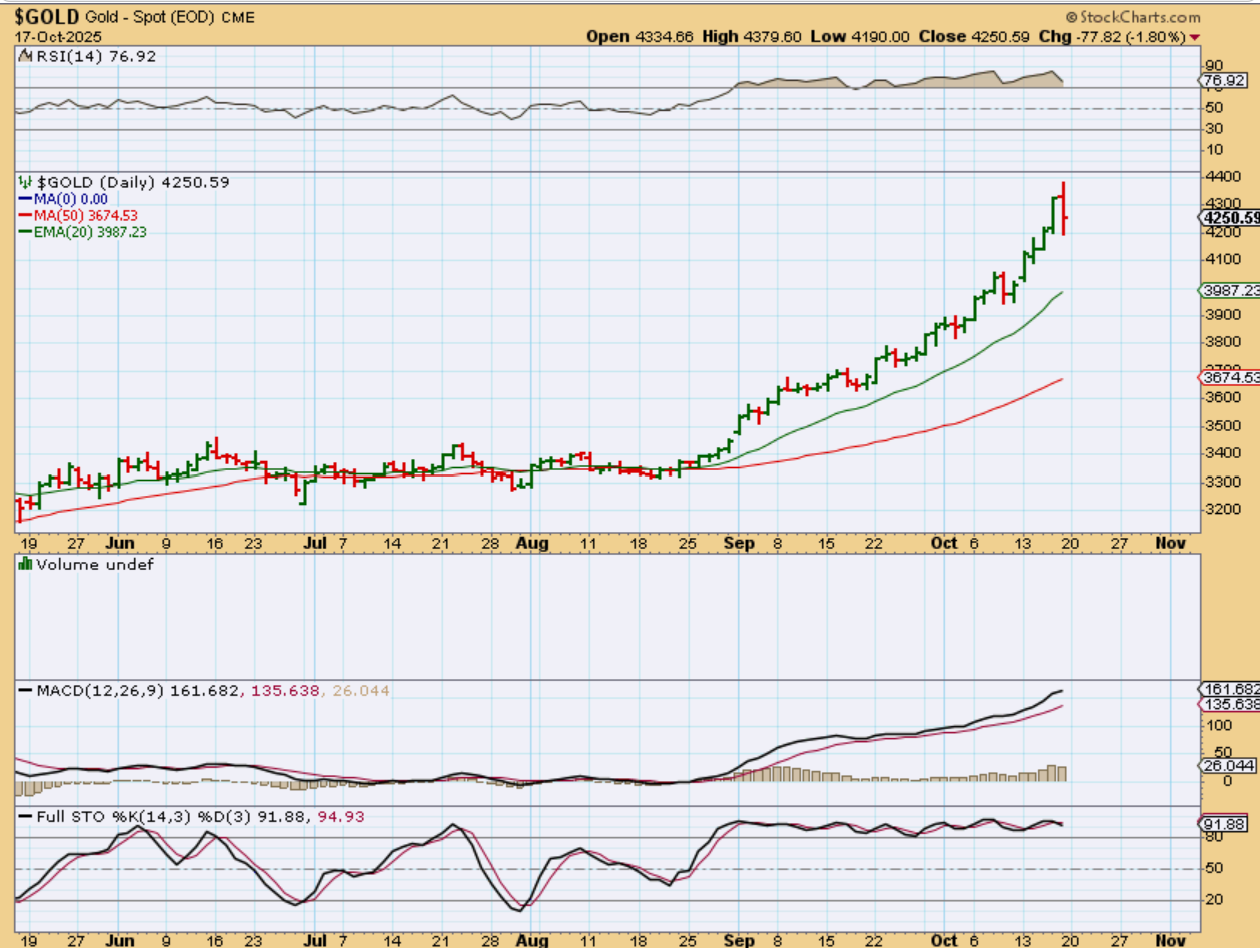
GOLD DAILY– Gold was on day 21 Friday and it certainly looks like it is starting a dip into a dcl. It may just be a short drop into the 20 ema, and then rally into the Fed Mtg as a 3rd daily cycle. That is where we may start to see some cracks appear. Why?
.
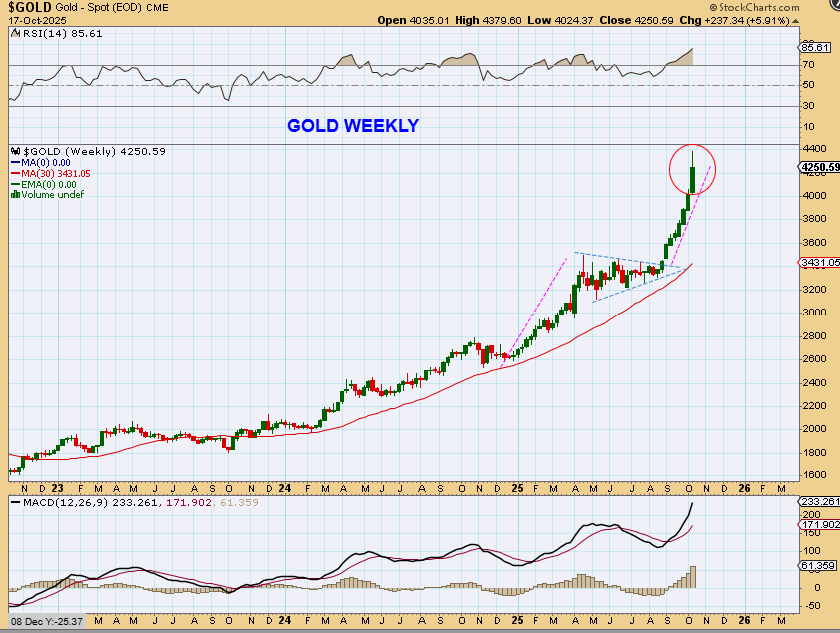
GOLD WEEKLY– Gold was on day 21 Friday and pulled back for a 2nd daily cycle dcl. Since that gave us a sell off into the end of the week, that also gives us what is often a topping candle on the weekly.
1. So Gold is due for a dcl on a daily chart, and this looks like a reversal candle
2. We may see Gold sell off down into the dcl before the Fed Mtg,
3. And then Gold may rally in a 3rd daily cycle, but will that be just as strong as the 1st and 2nd daily cycle? We’ll just have to wait and see.
.
Again, I will have a special section in this report to discuss this further.
.
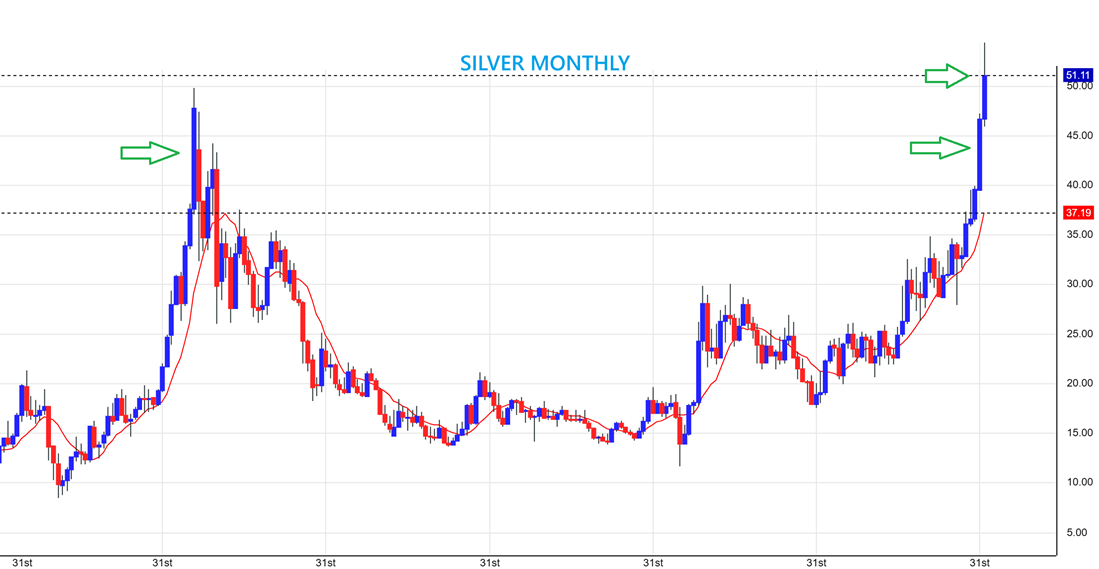
SILVER MONTHLY is also a reversal candle, but it is NOT the end of the month, so this doesn’t really count yet. It is just good to take note of it.
.
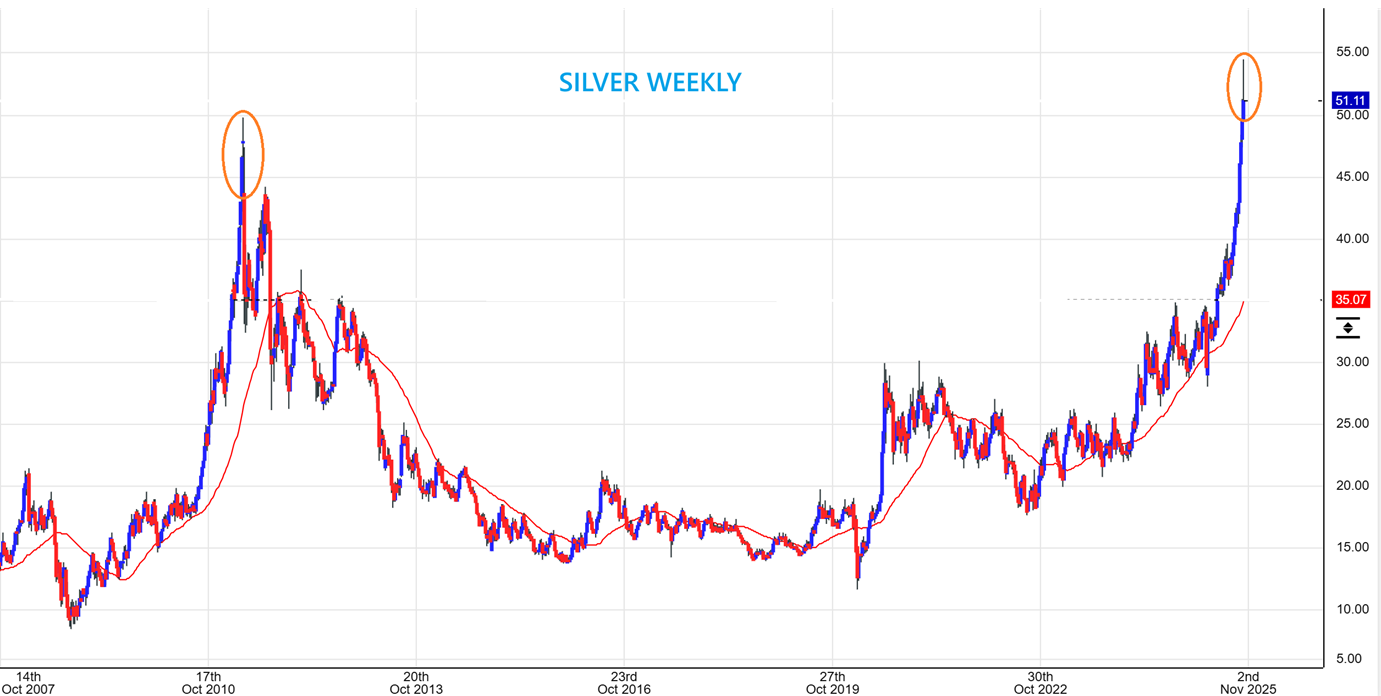
SILVER WEEKLY is a reversal candle too.
.
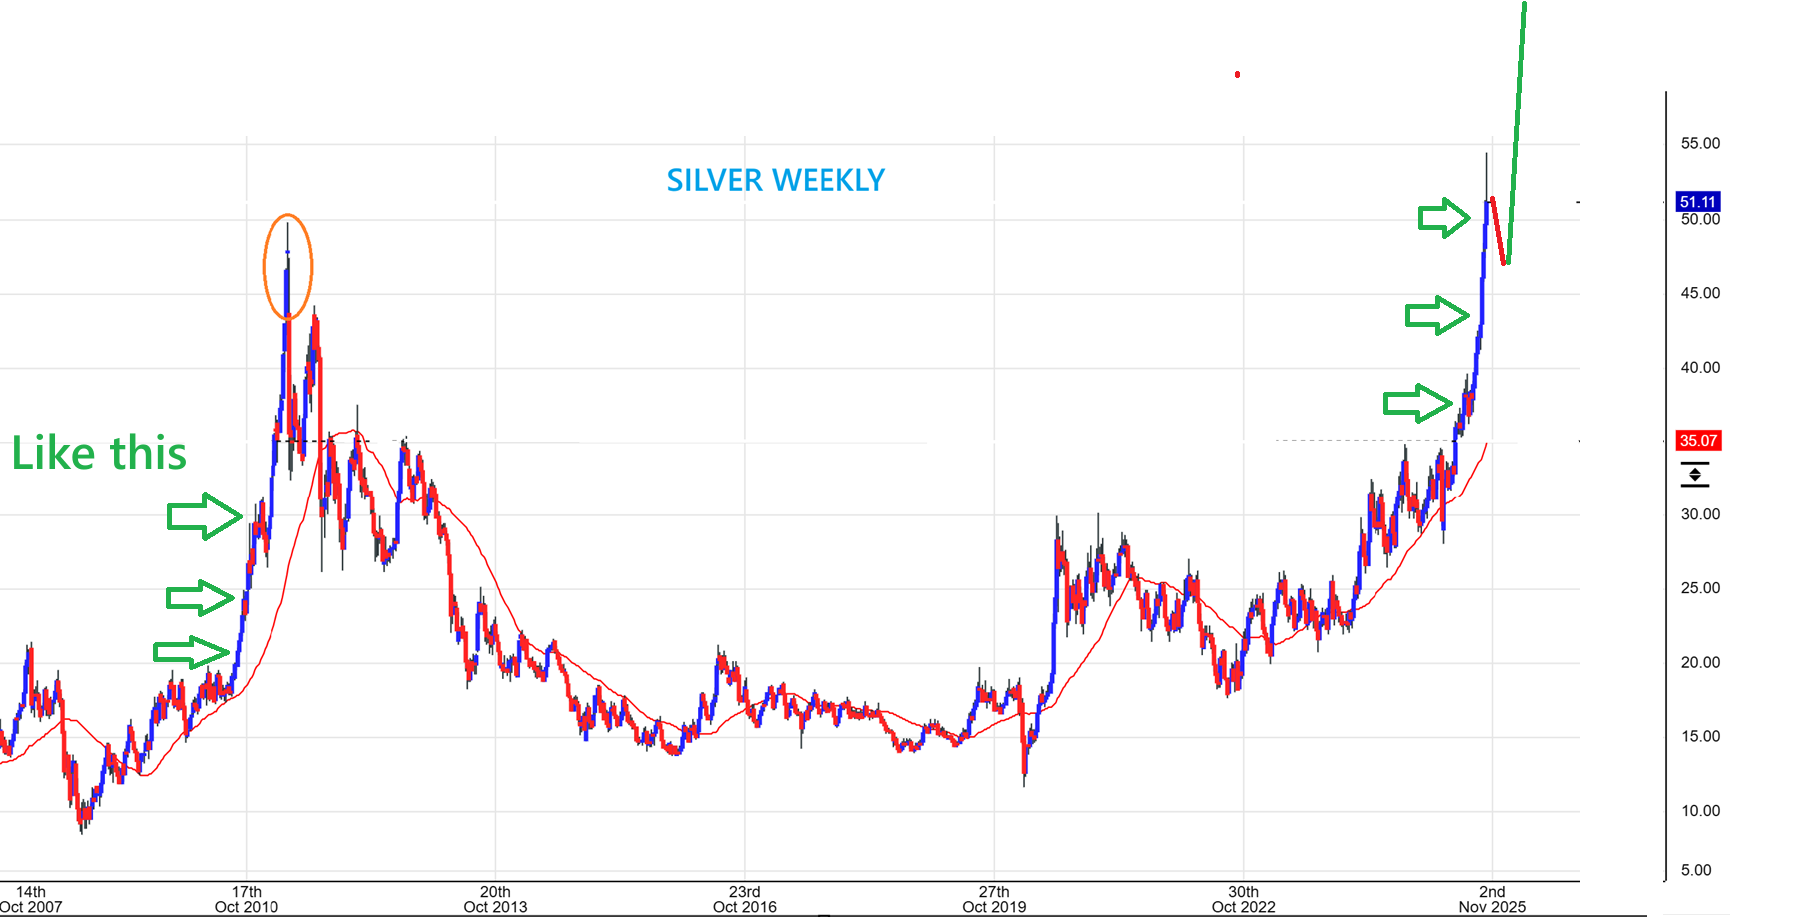
SILVER may do a midpoint consolidation or ‘pause’ of its own and then run higher. It did that in the 2010 parabolic run.
.
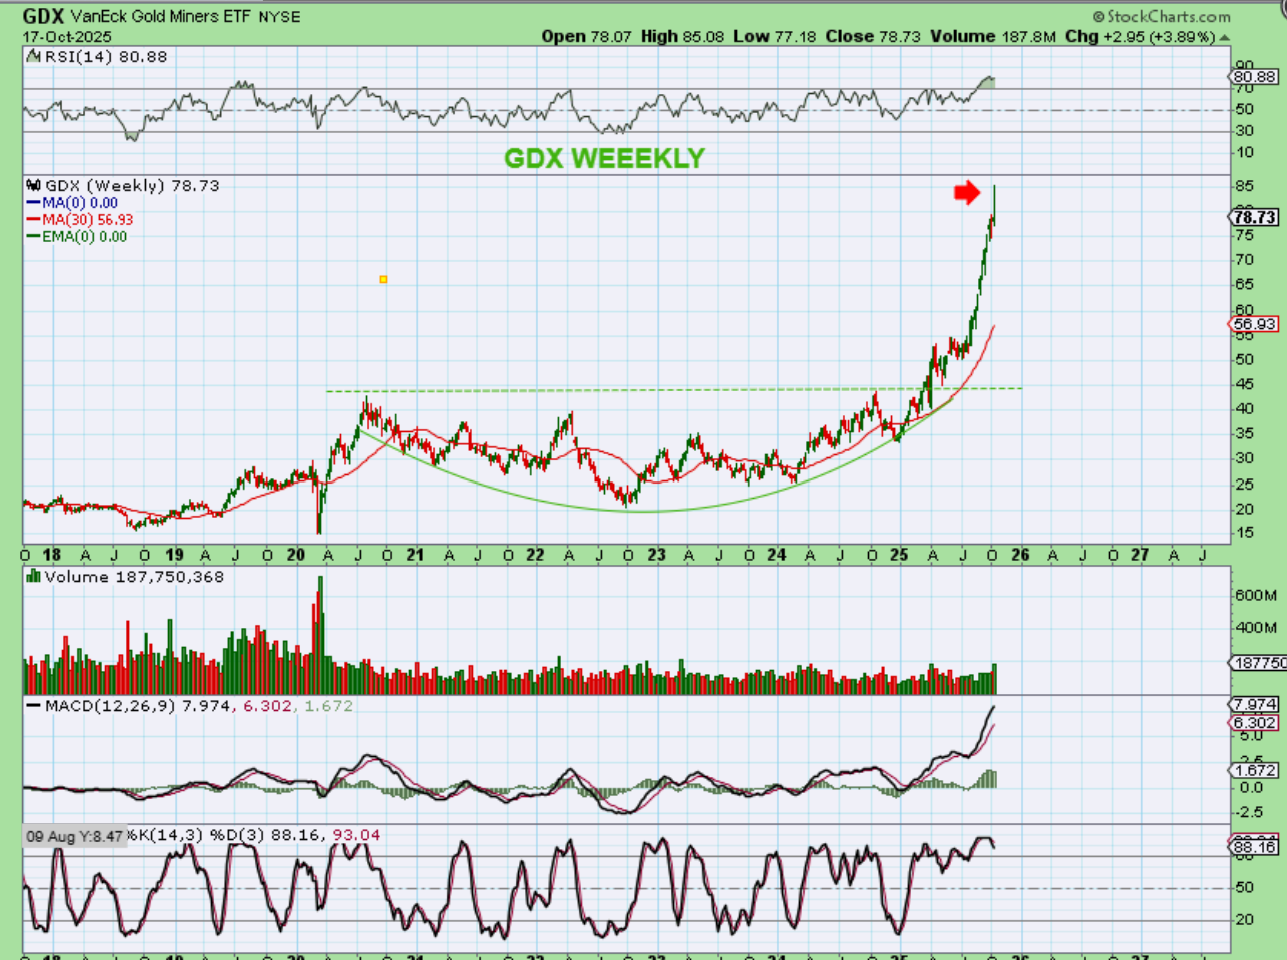
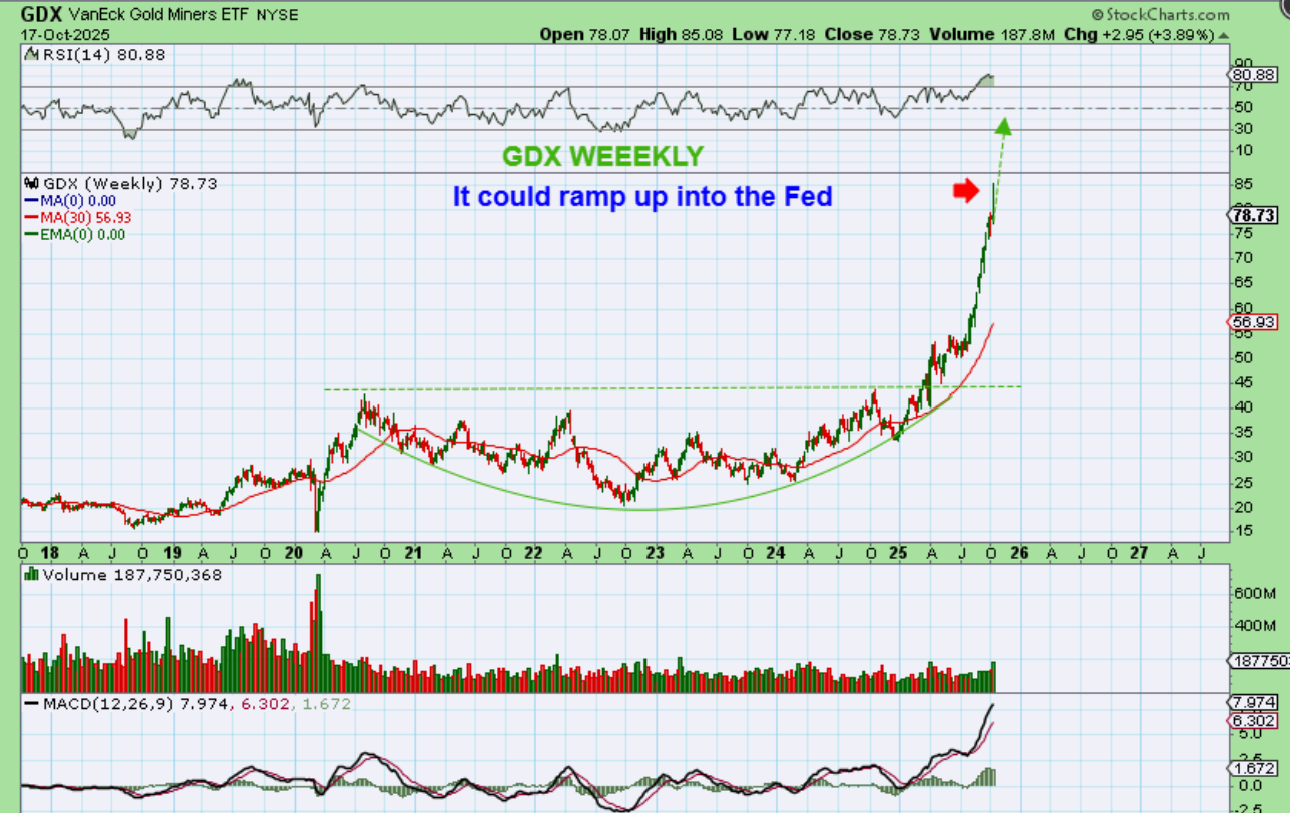
GDX WEEKLY also really does look a bit parabolic too.
.
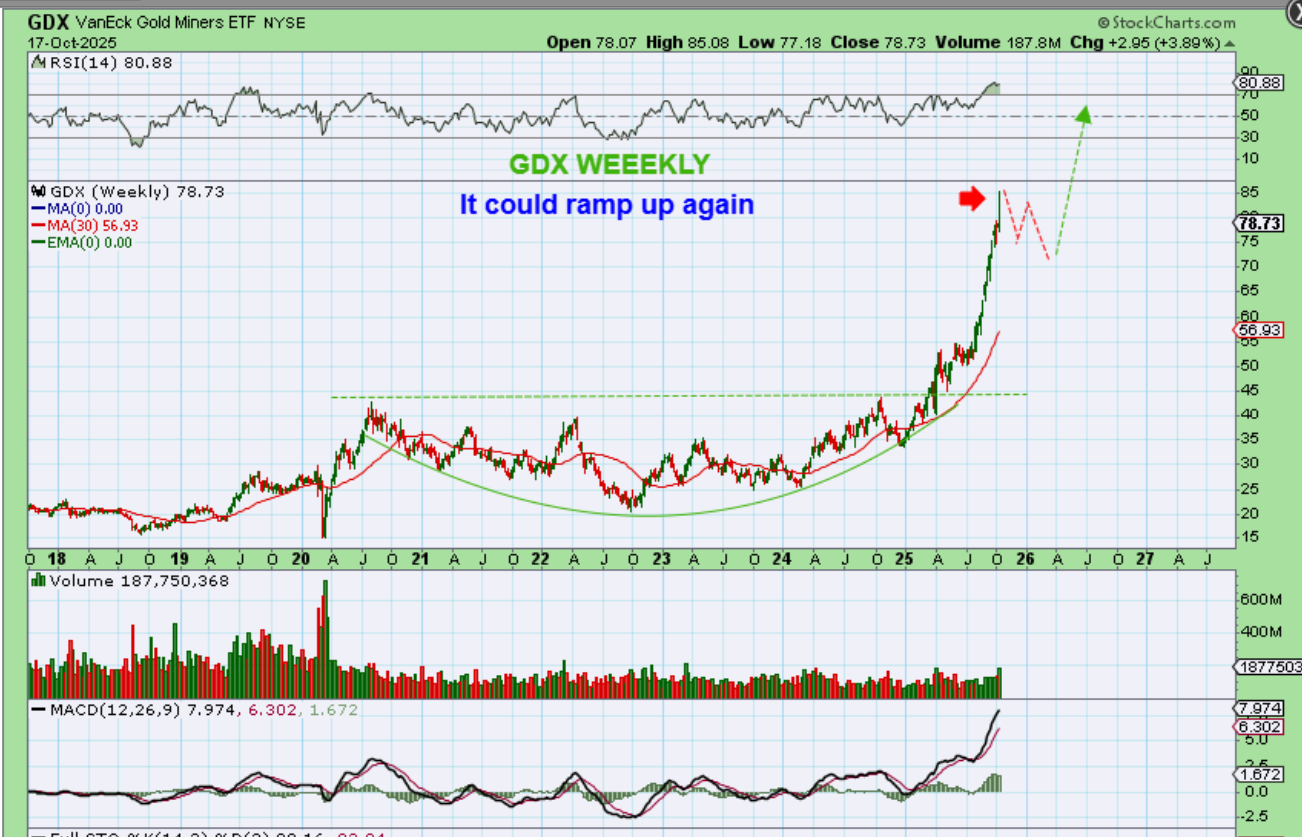
GDX could sell down into a dcl or even an ICL and then rally up again, as shown here…
.
GDX : Or it could just keep making new weekly highs until it blows off, maybe even as soon as the Fed Mtg. THIS PARABOLIC LOOKING MOVE IN GOLD & THE GDX IS WHY I SAID THAT I WANTED TO HAVE A SPECIAL LESSON IN THIS WEEKS REPORT.
.
A special Lesson: Let me show you something:
Just take a look at Gold and the Miners right now. This move is straight up. I want to show you something about that and tell you a story that I think is important at this stage of the game. 🙂
Take a look at the 2 charts below and look at the similarities. Scroll up and down and up and down. Does one look steeper than the other to you?
.
#1. GOLD: Rally, midpoint pause, rally…Crash? Look how steep this recent surge is, and then look at chart #2
.
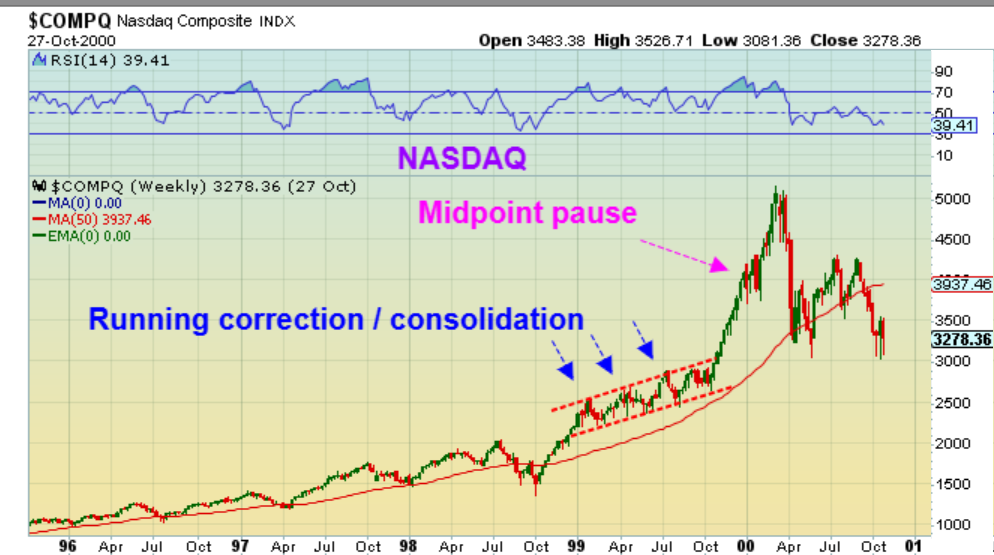
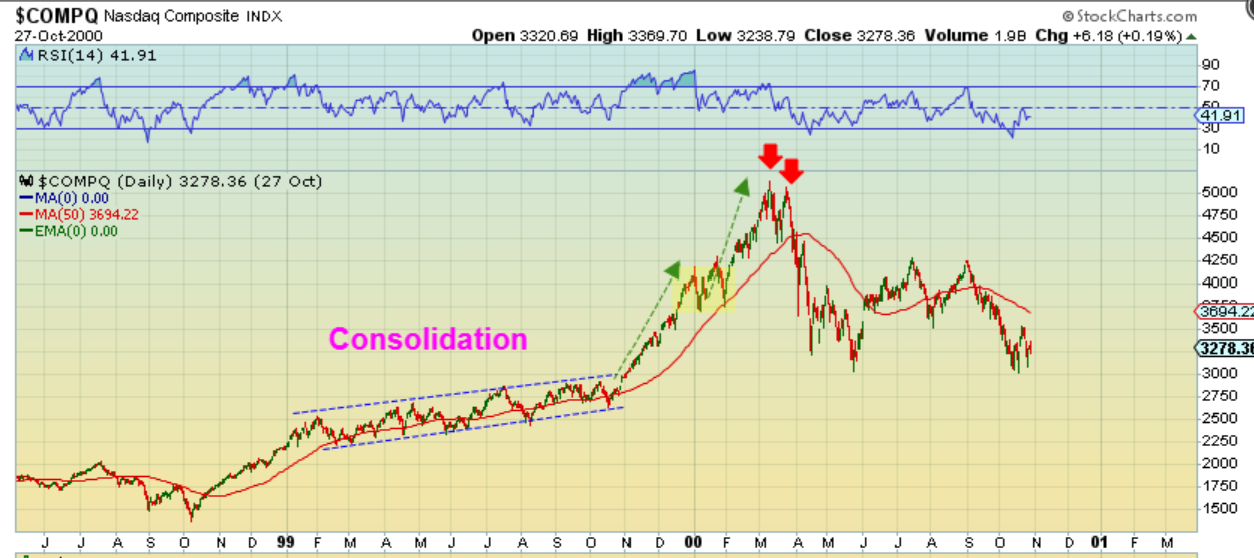
#2. NASDAQ 2000 BLOW OFF ‘TECH BUBBLE” – Notice the final Rally, midpoint pause, the 2nd Rally, & then the Crash.
.
Again, look how steep this recent surge is, even when compared to the Nasdaq blow off top. Doesn’t Gold look steeper than the Nasdaq 2000 top? Something else that you should just keep in the back of your mind…
.
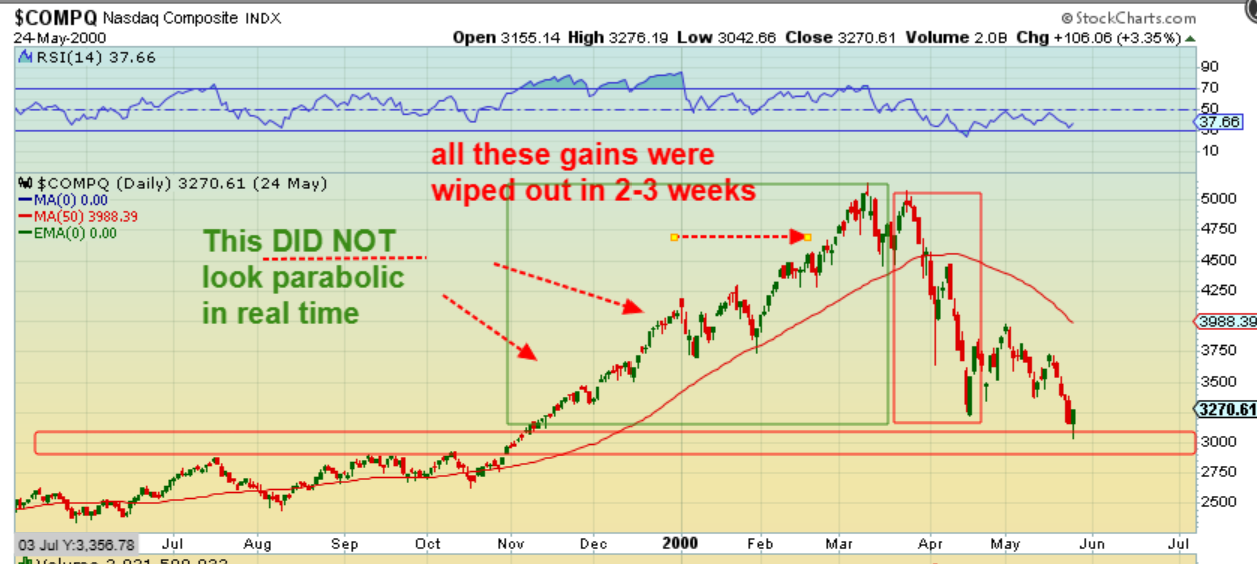
Something else that you should just keep in the back of your mind is that the NASDAQ rally didn’t seem all that steep if you were looking at it close up on a daily chart (below). That DOESN’T Look parabolic, right? It looked choppier than Gold does now. I was trading back then, and I only started with about $3000. I very clearly remember buying Juniper Networks (JNPR), EMC, CSCO, NTAP, Nortel, Lucent, Nokia, etc etc…They doubled and tripled, and so did my account. It was great, I probably went from $3000 to $15,000 or so, but then I rode that first crash down when it happened. Well…
Well, I stayed invested & actually added. I bought that dip, because everyone was saying that the ‘NASDAQ at $5000 was surely going to $8000 with these new high-tech companies. We survived Y2K! Everyone was buying computers and cell ph0nes, etc. The dial up internet was gaining traction with AOL Emails everywhere 🙂 The hype was very high, and I was new to investing. I wanted to be ‘all in!’ Then the next crash happened. I kept buying the dip adding more EMC, CSCO, JNPR, because computers were the next big thing! …and each dip would crash again and again. I gave a lot of good gains back, hoping that the Bull in tech has to come back. Live and learn, Tech was dead for a while. Thankfully I found GOLD at $380/ oz and bought HL, BGO, and GG. Another bull market started to emerge & helped me to slowly recover, but more importantly, it taught me trading and technical analysis. I’ll never forget the way a parabolic blow off top can act, despite all of the bullishness & hype around it. It had all of the right reasons to go UP when it crashed.
.
So here is my next point. Everyone will be saying that Gold should go much higher with rate cuts coming. I mean, look what it just did with the last rate cut! Surely 4 more cuts will send Gold to $10,000 – right? Well, maybe over time, but please use stops for your Miners just in case it takes a good-sized break / consolidation from this parabolic run. Bitcoin has done the same thing many times over, in its 4 year cycle. It looks SO BULLISH in the 3rd year, but then it crashes. I’m not saying that it’s time to sell everything, I’m just saying – Let’s Stay Frosty my friends, and keep this bubble in the back of your mind!
.
Again, that NASDAQ chart did NOT look like a bubble close up to me in the year 2000. It double topped with a L.T. Daily Cycle and crashed hard in March though. Then it bounced and crashed hard again in April. My Point? If you don’t usually use stops, Use stops in the next 3rd daily cycle for Gold with your Miners, just in case we are in a parabolic topping area. 🙂
.
Bitcoin has some cracks that appeared this week too, so I’ll cover that below. Have a great weekend everyone!
.
~ALEX
.
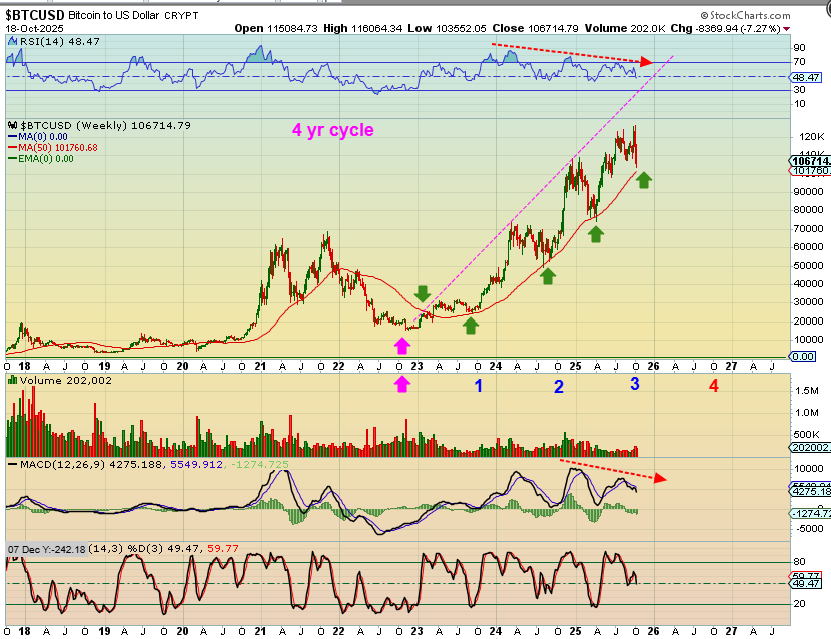
BITCOIN WEEKLY-
In the 3 years of this 4 year cycle, Bitcoin has had its share of choppiness and consolidations that took it over to the 50 week ma. Even though we see that happening here again, there are caution signs.
1. For one thing, look at the RSI & MACD with the recent all-time highs. A sign of weakness as we finish up year number 3.
2. We just got a failed daily cycle, so even if we bounce now, I have to expect that we should see Bitcoin head lower over the next several days. So there is weakness showing up, behind this beauty cracks appear, but is it all bad? Maybe not quite yet …
..
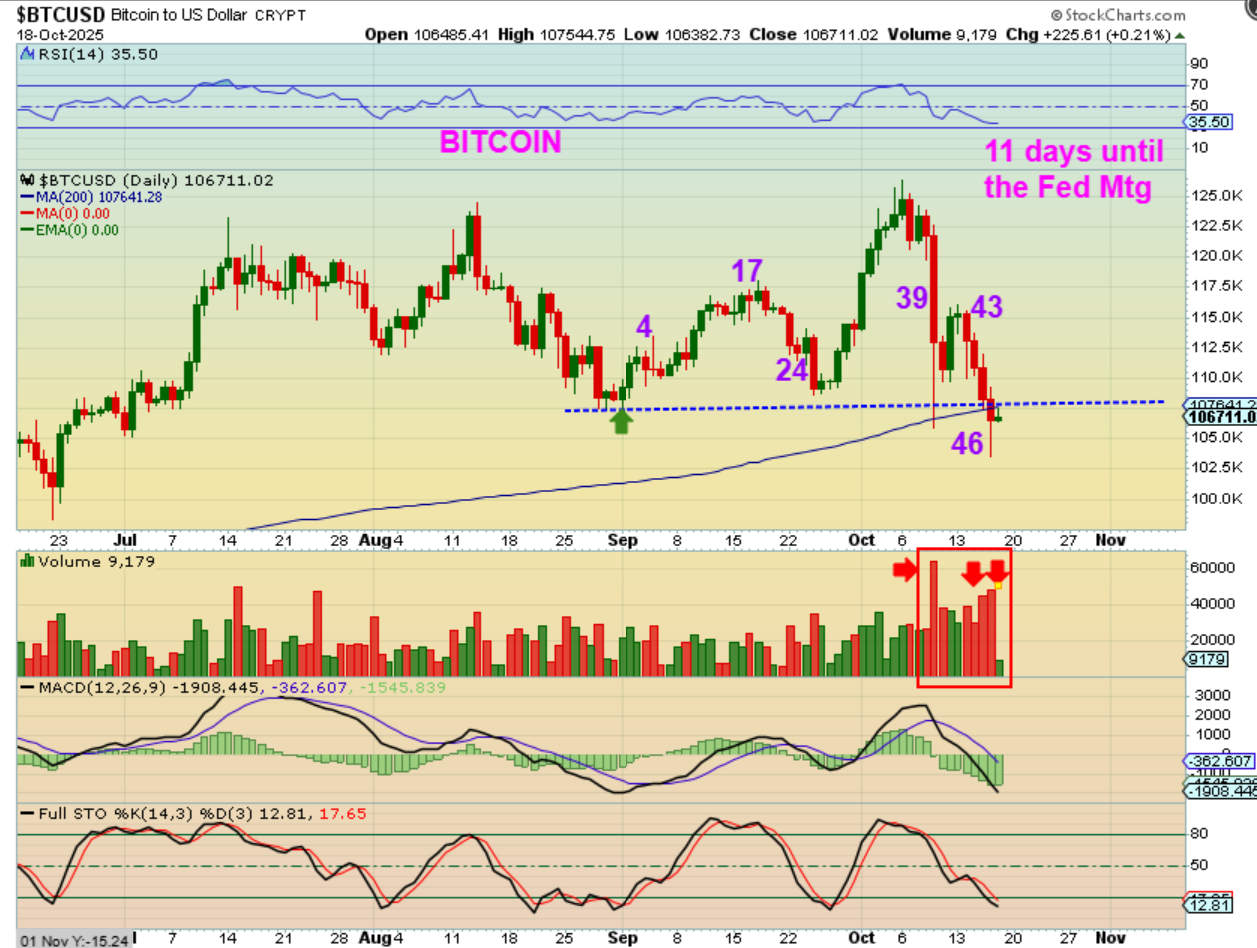
BITCOIN ‘failed’ on day 46 of a possible 60 day cycle, so from here we kind of expect a possible bounce or maybe even just choppiness lower, but then a lower low should form as we get closer to day 60. Now take a look at the volume with the selling. That stands out to me and could be a warning of distribution and selling by some smart money.
.
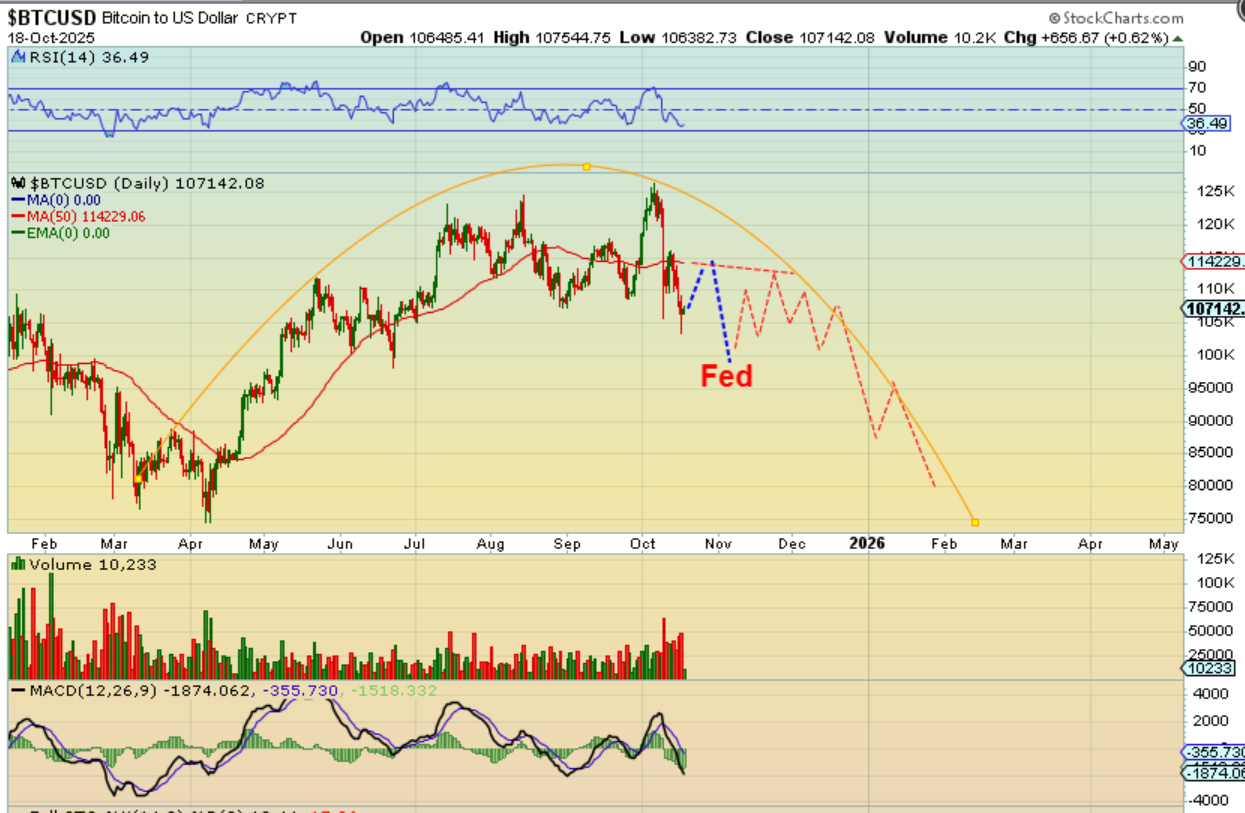
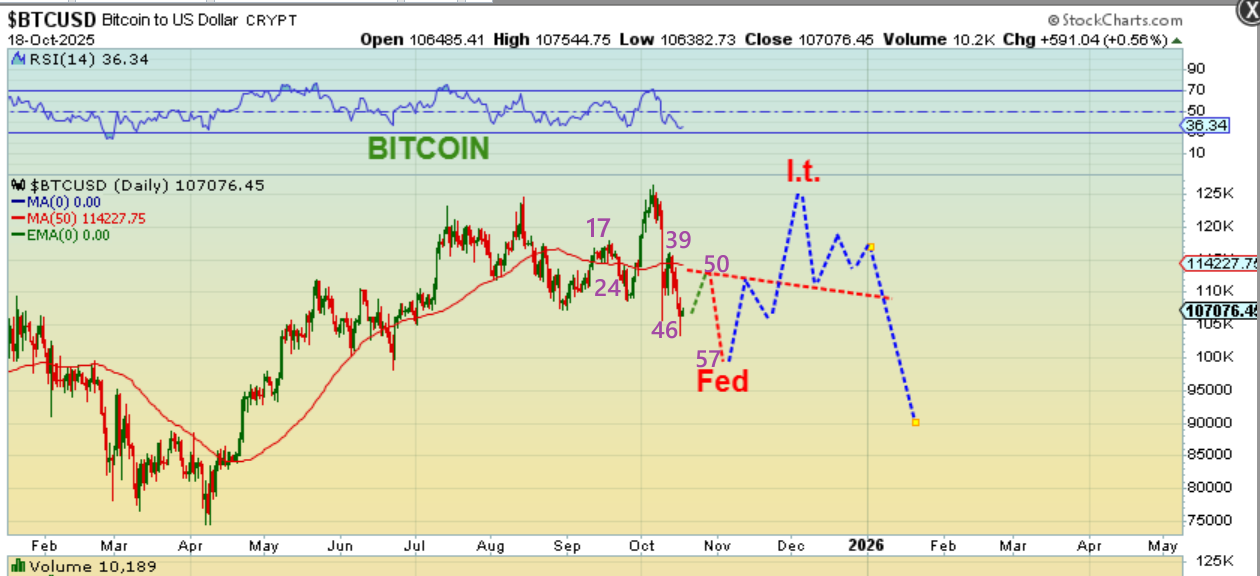
BITCOIN DAILY – So we could bounce from here heading into the Fed mtg, or it could sell off into a day 60 low. This is worth watching, because the Fed Mtg is 11 days away, and 11 days added to Bitcoins day 46 is day 57. If a low forms around the fed mtg, we could then see Bitcoin rally out of a new daily cycle and give us day 1.
.
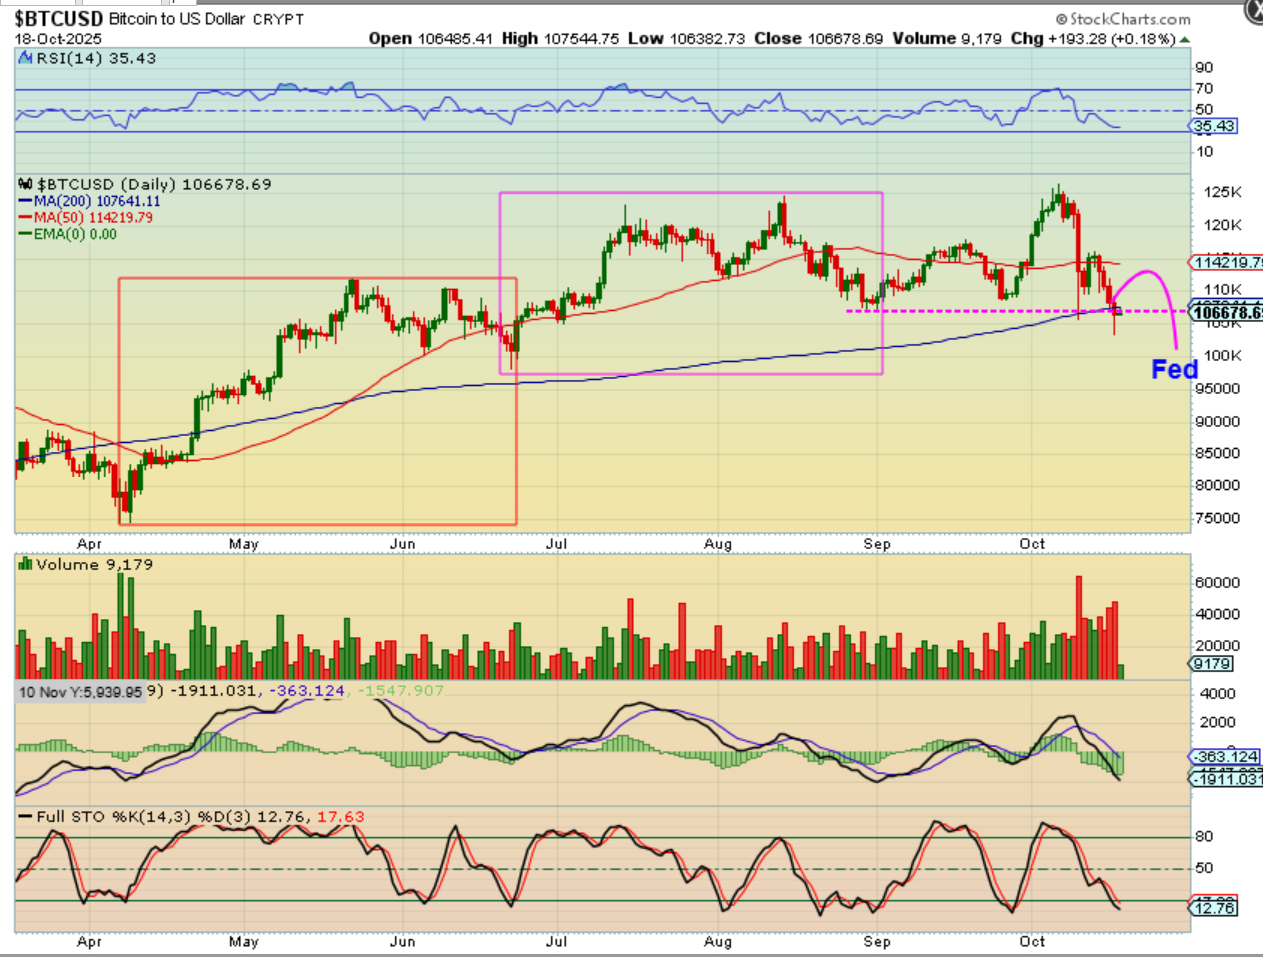
BITCOIN DAILY – We could bounce out of day 60 or so and rally Post-Fed to the highs or even new highs, but if it is L.T. it can peak there and start to drop into year 4 of the 4 year cycle. THIS IS JUST A GUESS SHOWING RENEWED STRENGTH AFTER THE LOW, but …
.
THAT WAS JUST A GUESS SHOWING STRENGTH, but it could very well be that Bitcoin just stays weak in the move out of day 60ish, and only gets halfway to the highs before rolling over too. We’d begin to see a rounding top, as drawn here. We’ll take this one a day at a time.