Friday October 31st
Recently as we gapped higher in the general markets, I discussed a trade that I used to take called a ‘3-gap play’. It assumes that immediate buyers are mainly in after 3 gaps higher and the move exhausts, so you short it for the gap fills or wait and buy after those gaps fill. We do seem to be seeing that taking place ‘post-Fed’.
.
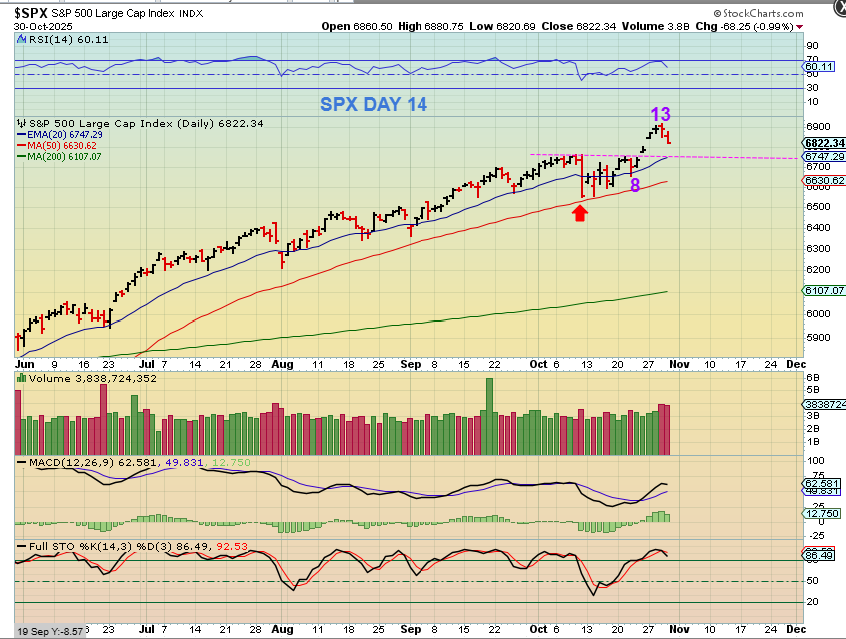
SPX – It is easy to picture this dropping down to fill the open gaps, back testing the 20 ema and breakout, and then reverse higher. THAT MAY HAPPEN, So…
.
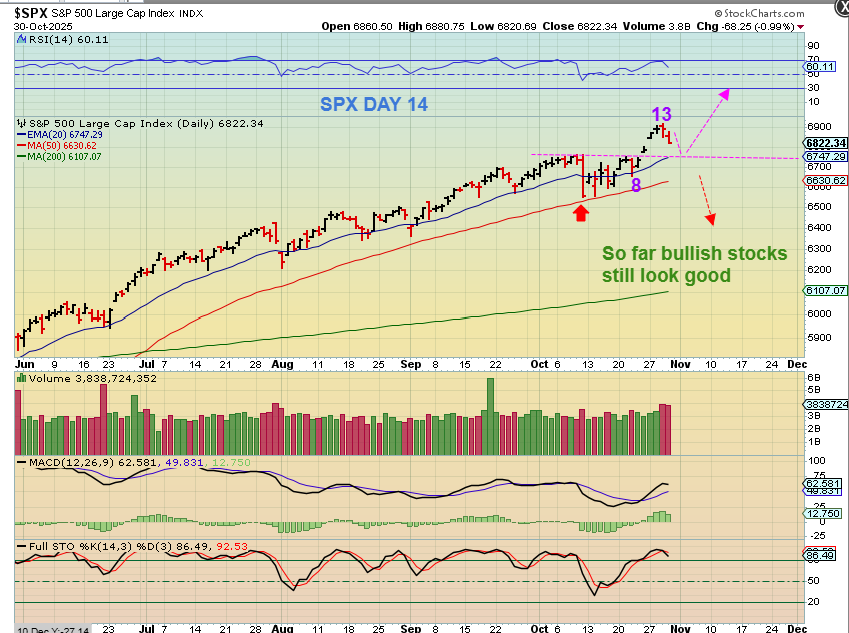
I have drawn The SPX with
1. A back test / gap fill dip and then rally resumes.
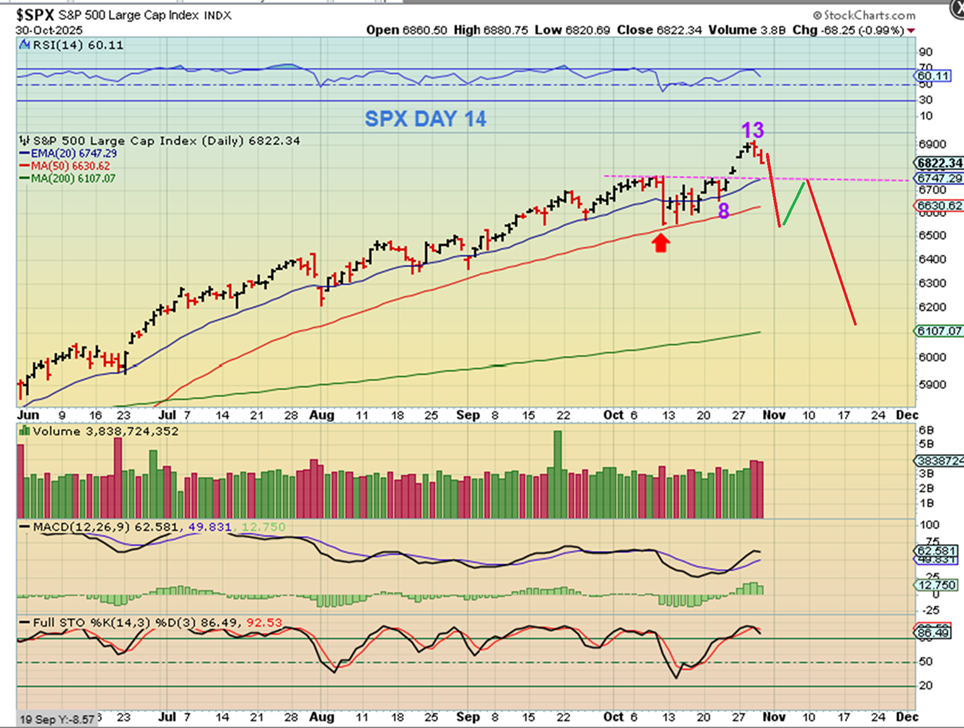
2. I have also drawn it as a peak on day 13, L.T. and then it starts to drop into an ICL.
.
SPX – At this point I am watching the bullish stocks to see if they can resist selling or hold up better. If so, we may just do a mild dip and then reverse higher. If this breaks down below support and the general market stocks start to look weak, this is more likely to break lower and start to drop into that ICL that I have been discussing (we are on month 7).
.
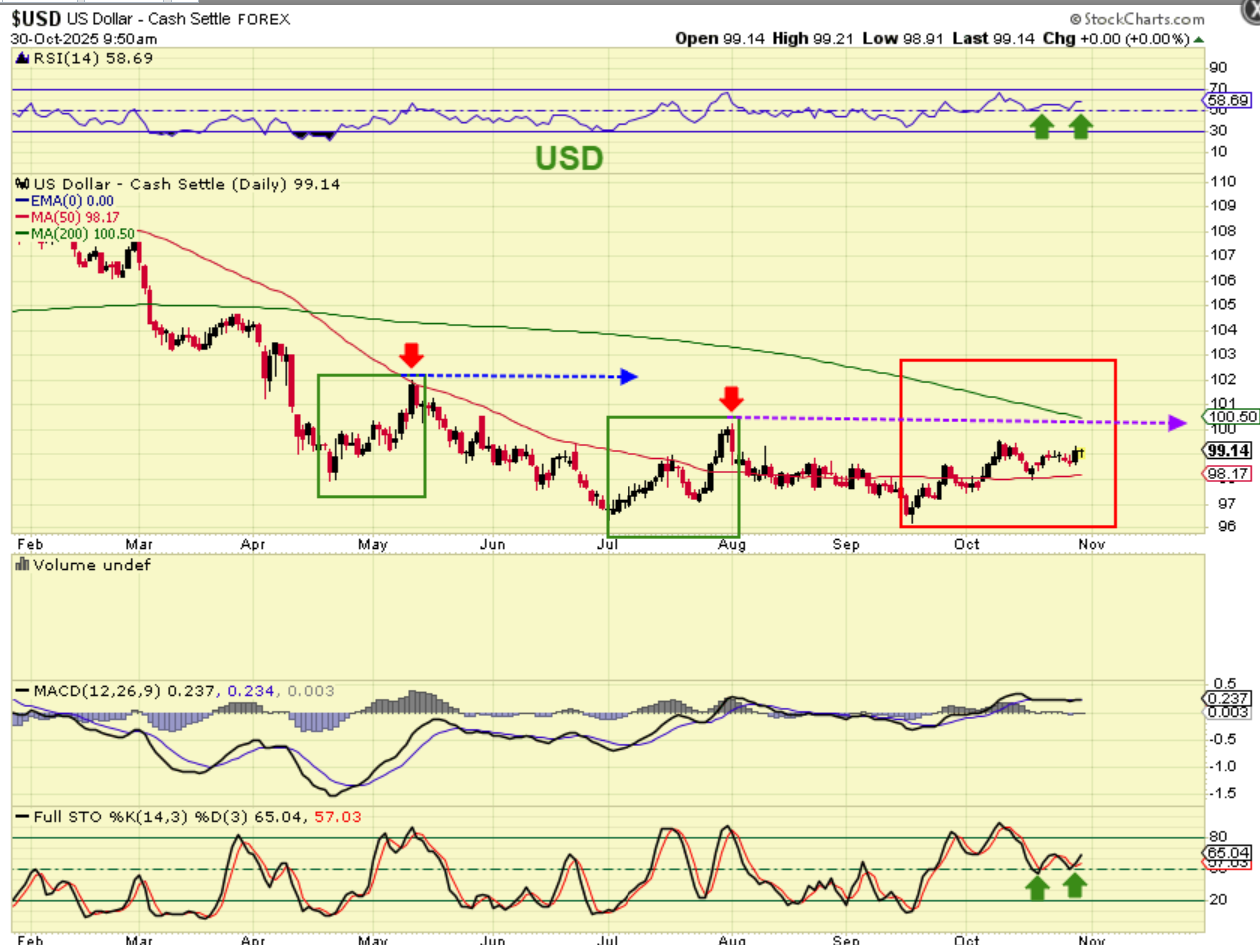
Yesterday I said that the USD was looking stronger or bullish. I said:
THE USD has the look that it wants to move higher. The RSI, the 50sma, etc has a bullish look, so we’ll see what happens after the Fed Rate Cut. After the September 17th rate cut, the USD rallied.
.
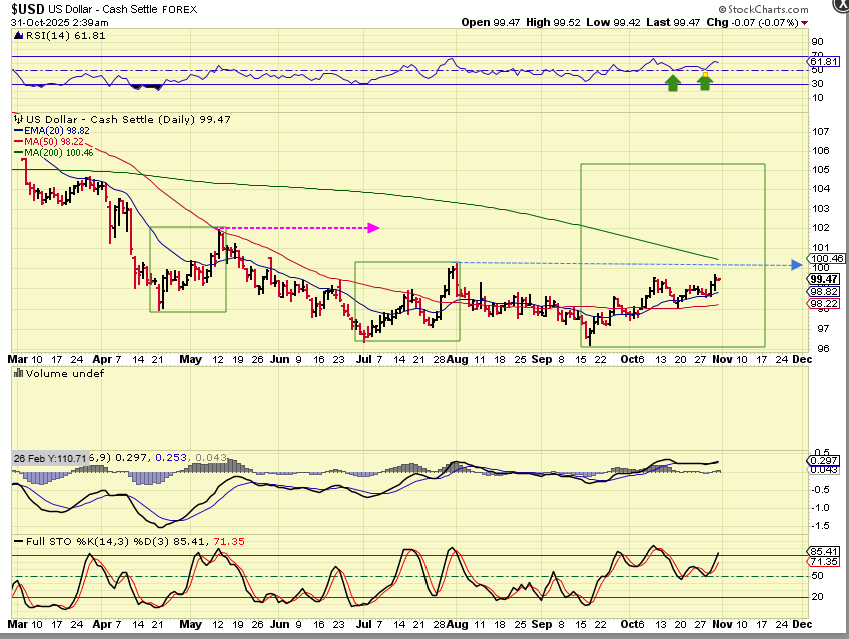
THE USD popped and that pop actually gave us a new daily cycle high, so let’s zoom in…
.
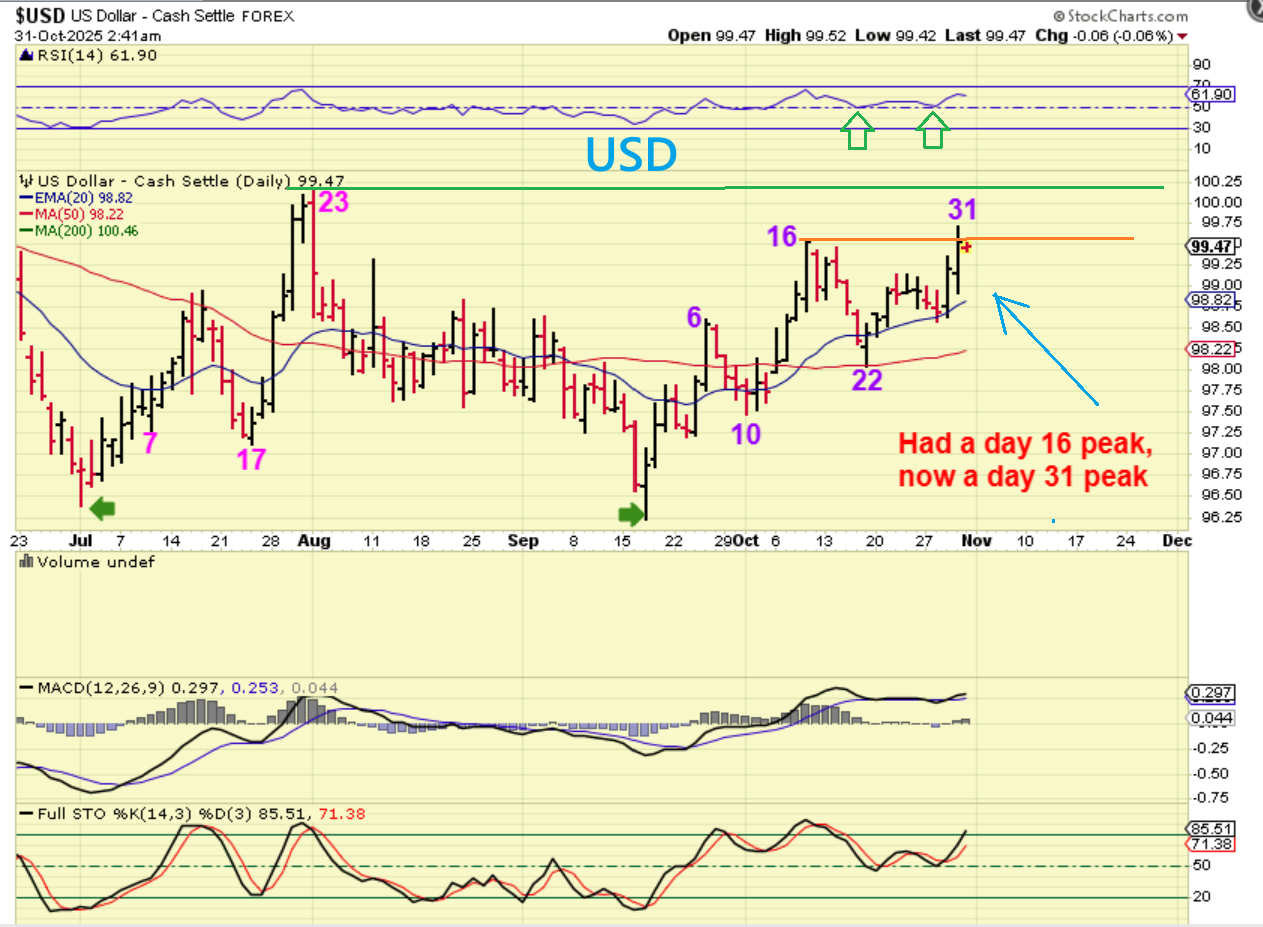
THE USD may have a day 22 dcl, but I drew it continuing higher. That doesn’t matter. My point here is that we now have a series of higher highs, and if it gets above that day 23 Magenta high, then that is likely to be an ICL in September and the USD can run higher over time. WHAT WILL THAT DO TO GOLD? So far Gold has ignored the USD, so we’ll have to watch and see.
.
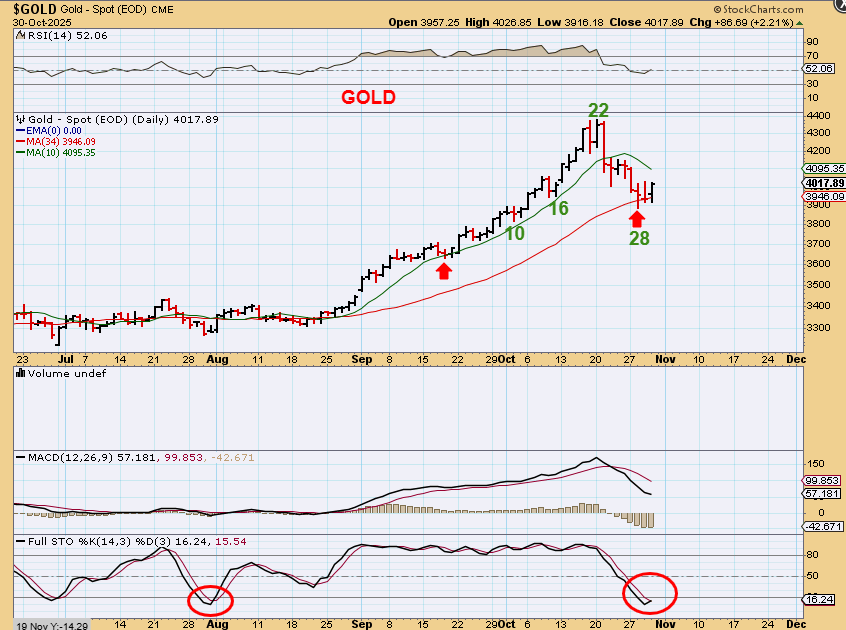
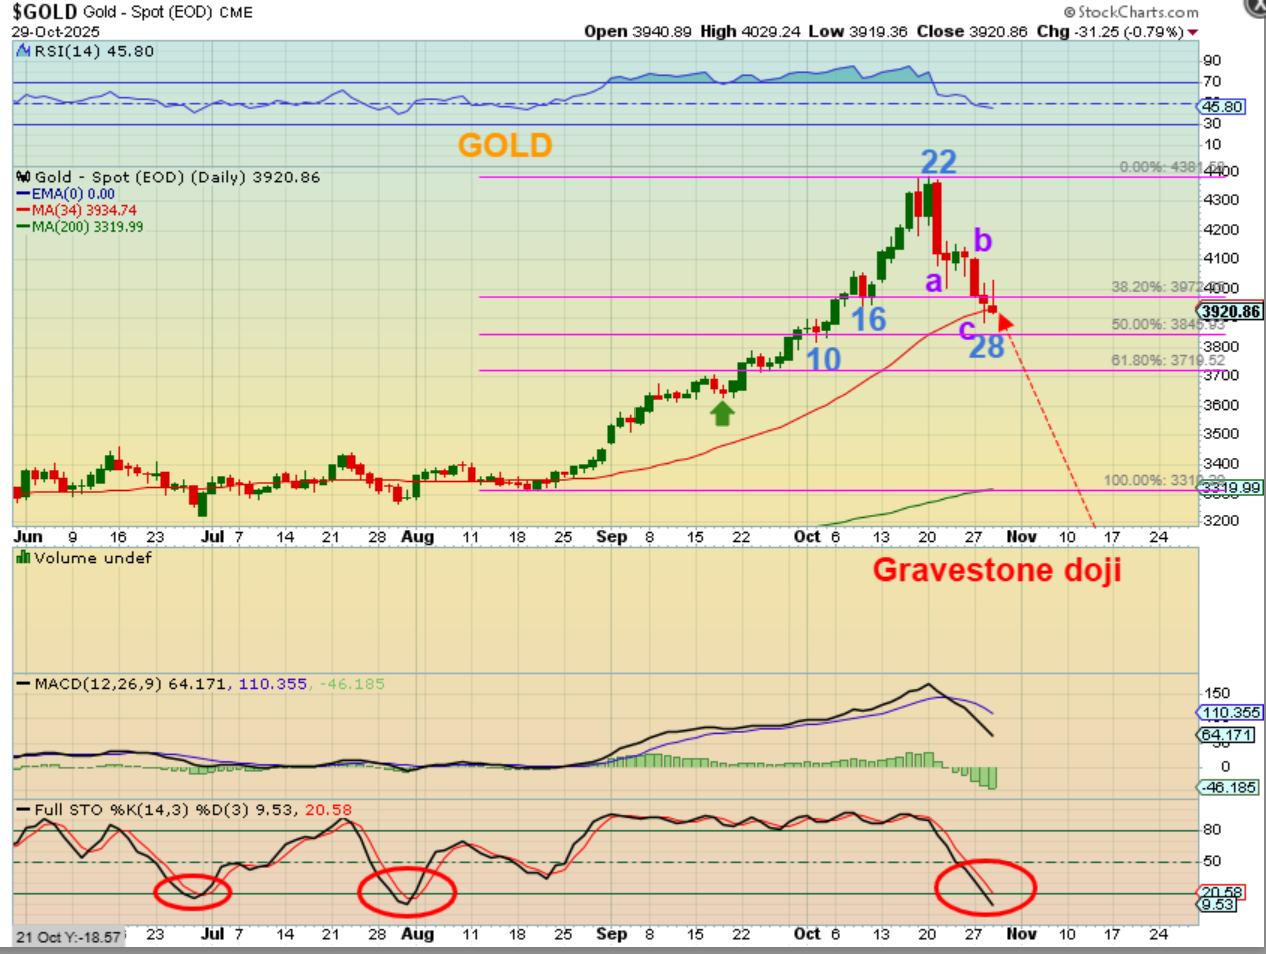
GOLD has a reversal at day 28 at the 34 sma. It looks like an a-b-c down too, so this is considered a bullish buy set-up starting to show follow through, and you’d use a stop under the low. In the weekend report I will discuss whether I think that this is a long-term buy or short-term buy. It was a buy yesterday too, when I showed the following chart…
.
I showed this yesterday:
GOLD actually has a gravestone doji, it is oversold enough for a low, and the 50% Fib retracement has pretty much been reached. I also see an a-b-c drop. We may have a dcl in place and how did Gold act after the September 17th rate cut? It dropped for 1 day and then rallied higher.
.
I showed the same bullish set up in Silver with the following 2 charts yesterday:
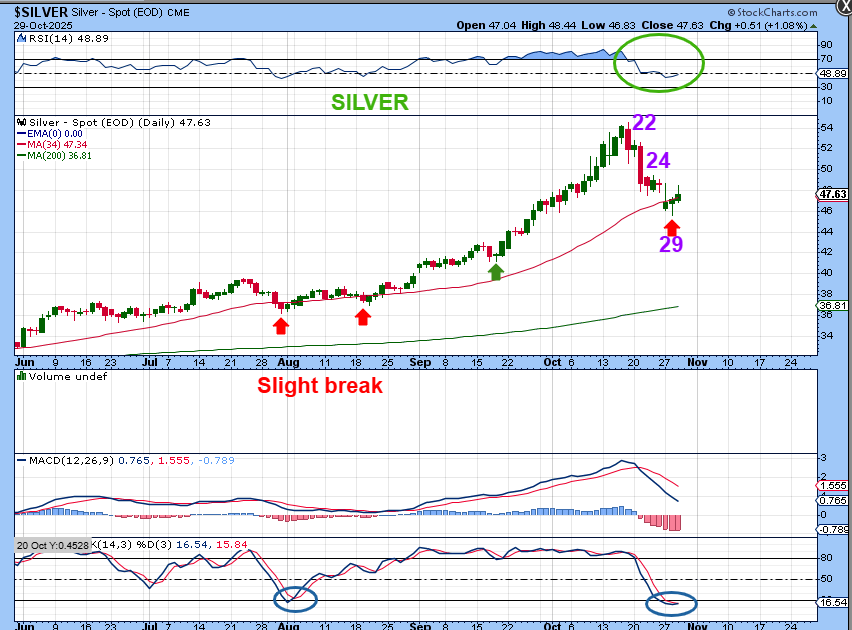
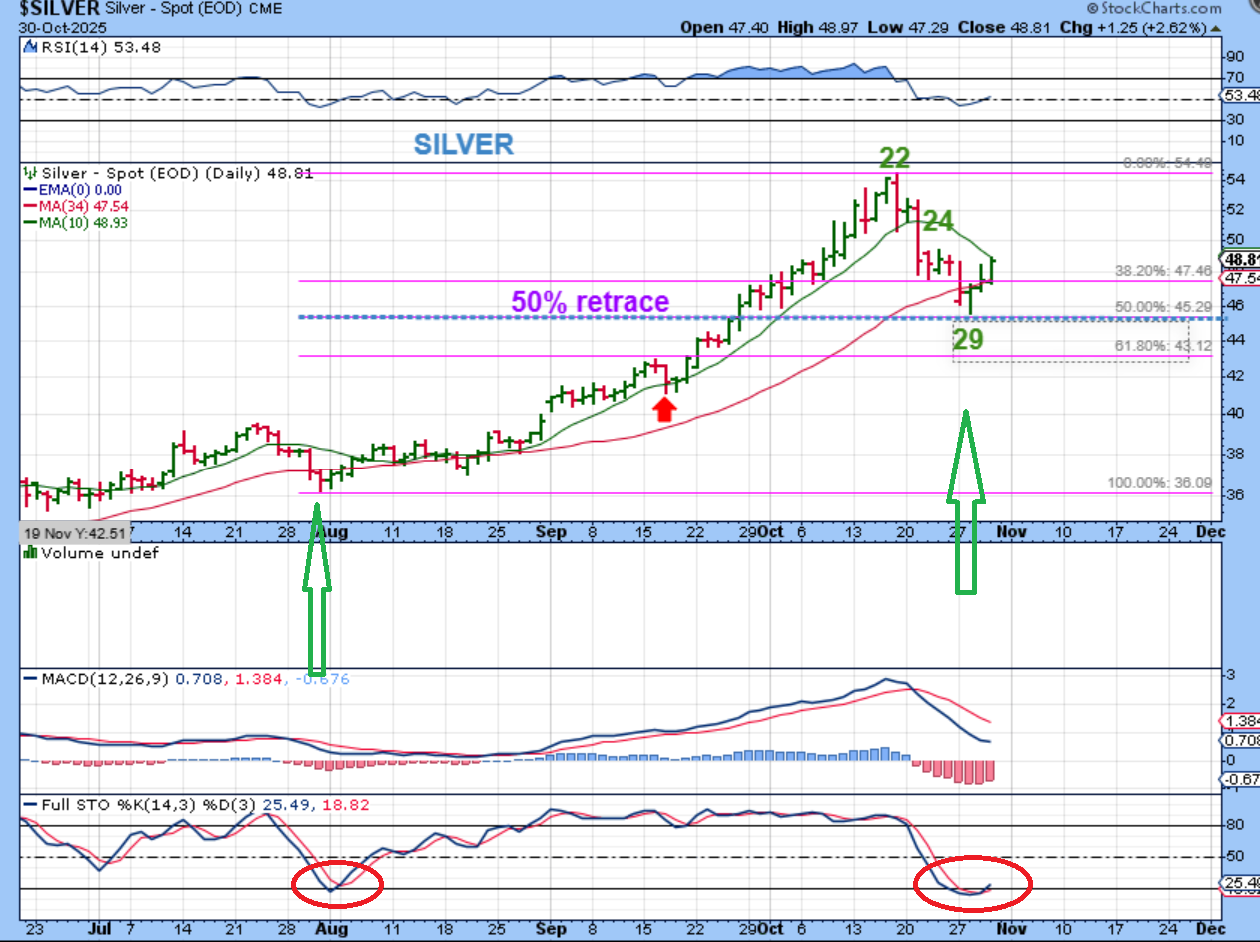
SILVER dipped below the 34 sma and crawled over the past couple of days. The last time it was this oversold it did the same thing, so we’ll see what the Post-fed rate cut reaction is…
.
SILVER BULLISH WEDGE?– Yesterday in the morning we were breaking what looks to be a bull wedge and a swing low. That will be bullish if buyers continue to step in…
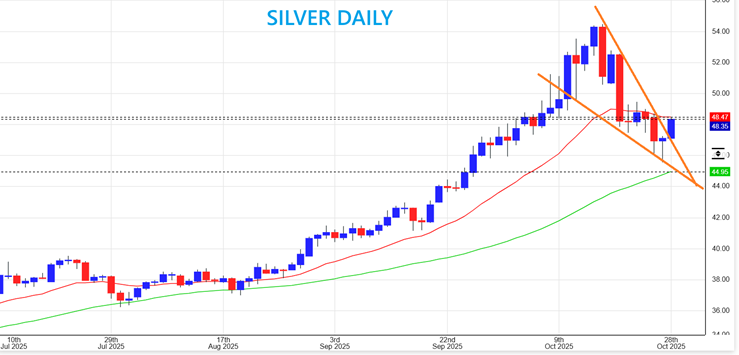
SILVER – Buyers stepped in on Thursday too, so I posted this in the comments as Silver broke above the 20 ema. This is now a swing low with follow through.
.
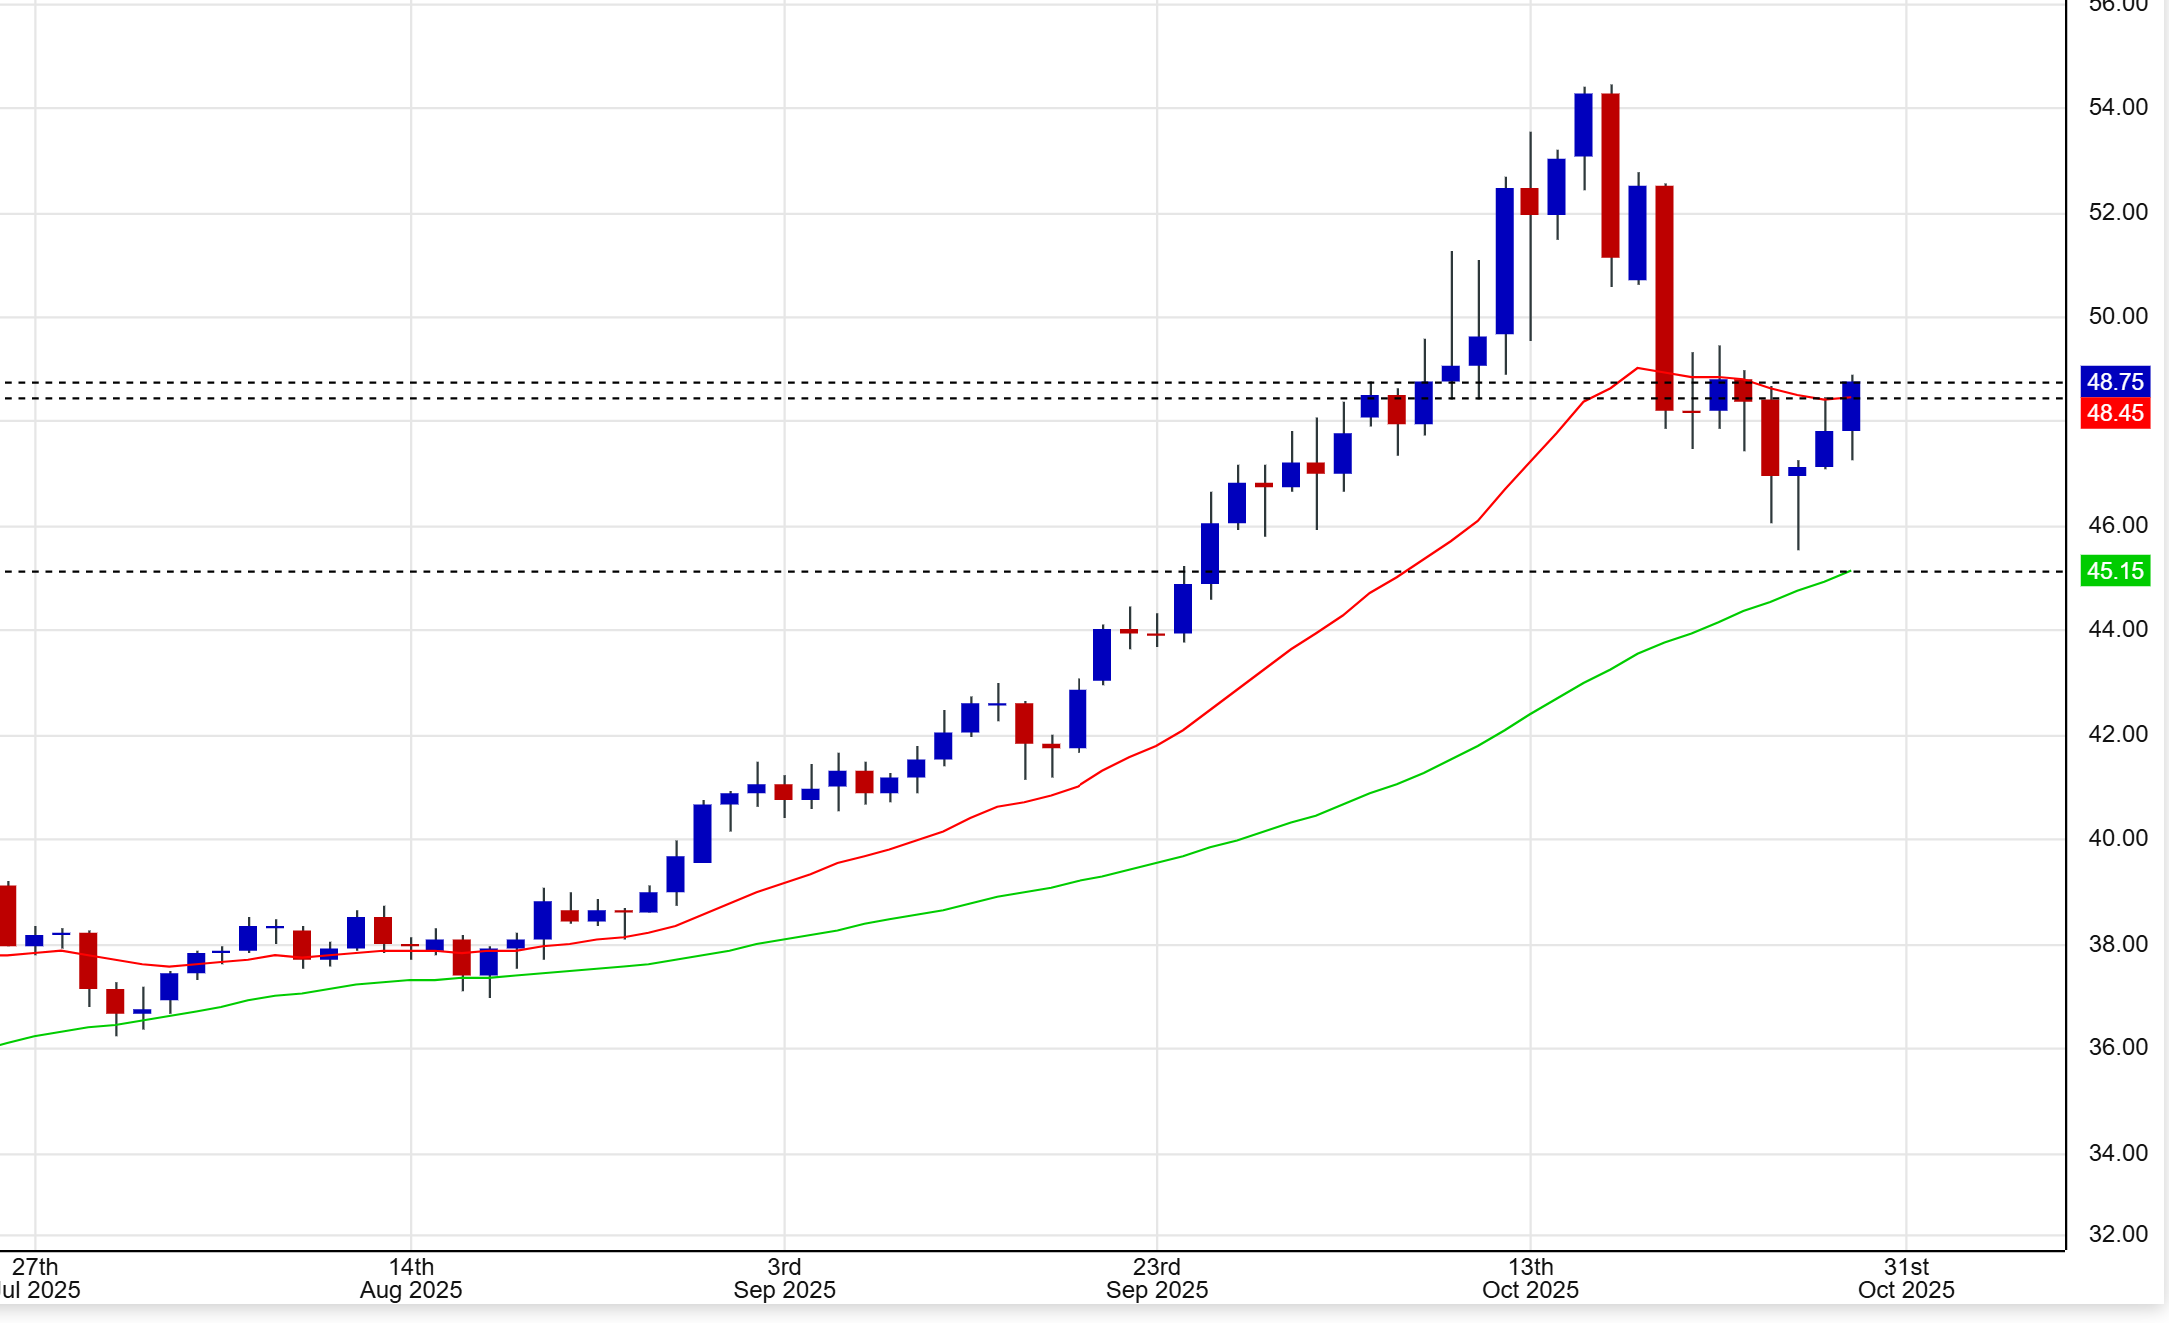
SILVER is pressing against the 10sma, and that can act as short term resistance.
Silver still looks bullish though, since it has a swing low at day 29, and that reversal at day 29 was on the 50% fib retracement level. It is very oversold, just like at the last low. Silver miners are slowly starting to follow. I’d like to see Silver break that 10sma on Friday.
.
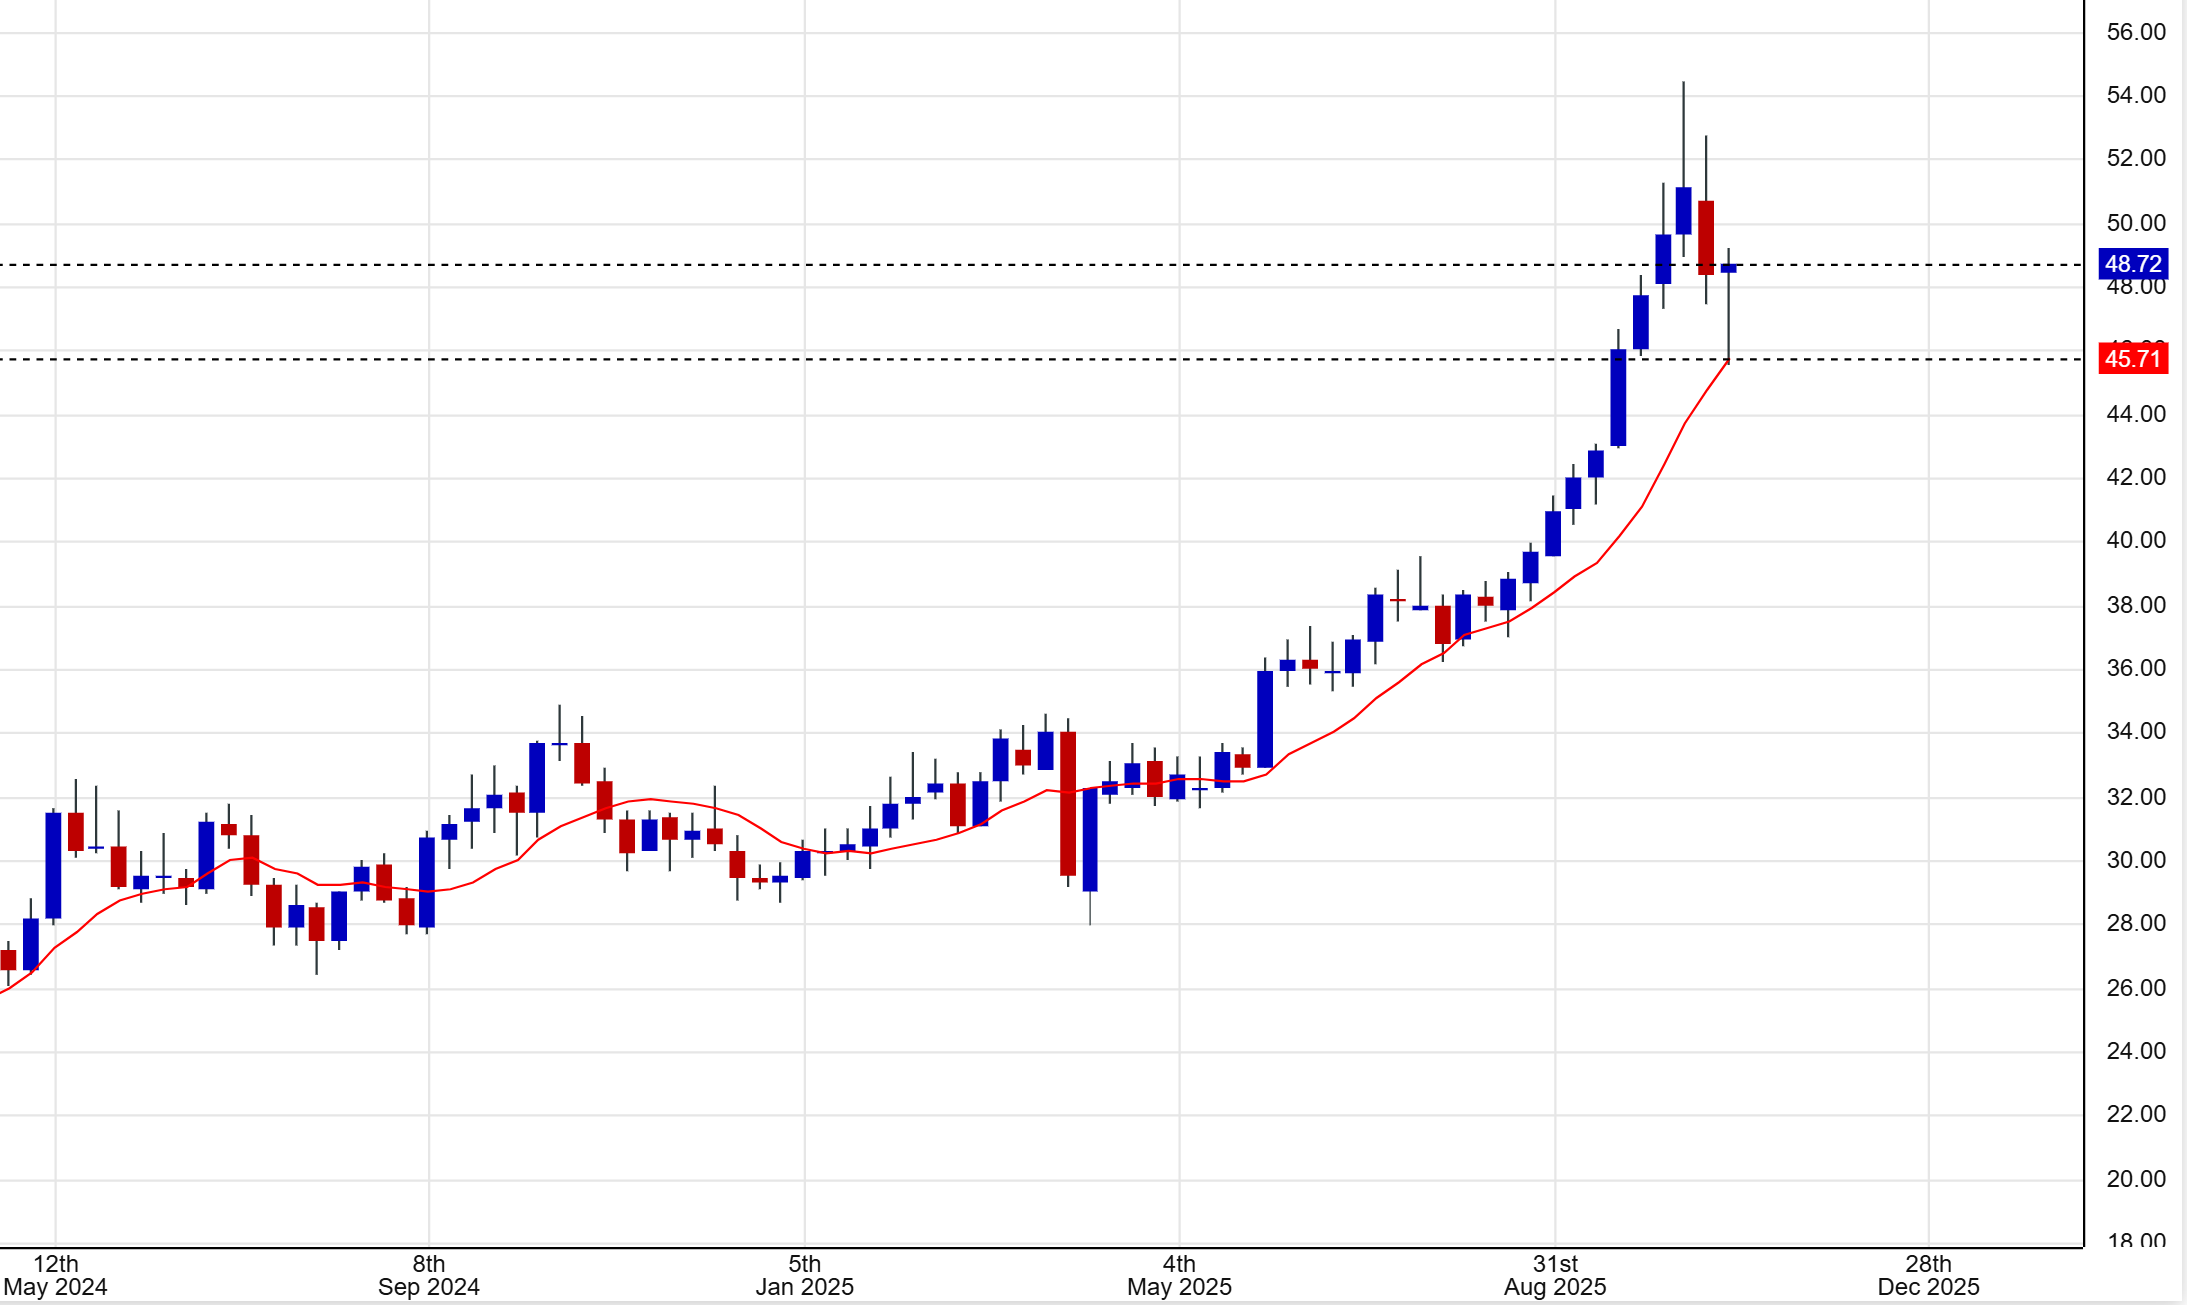
SILVER WEEKLY – Today is the last day of the week, and unless Silver now sells off by $3 on Friday alone, this is a strong weekly reversal off of support.
.
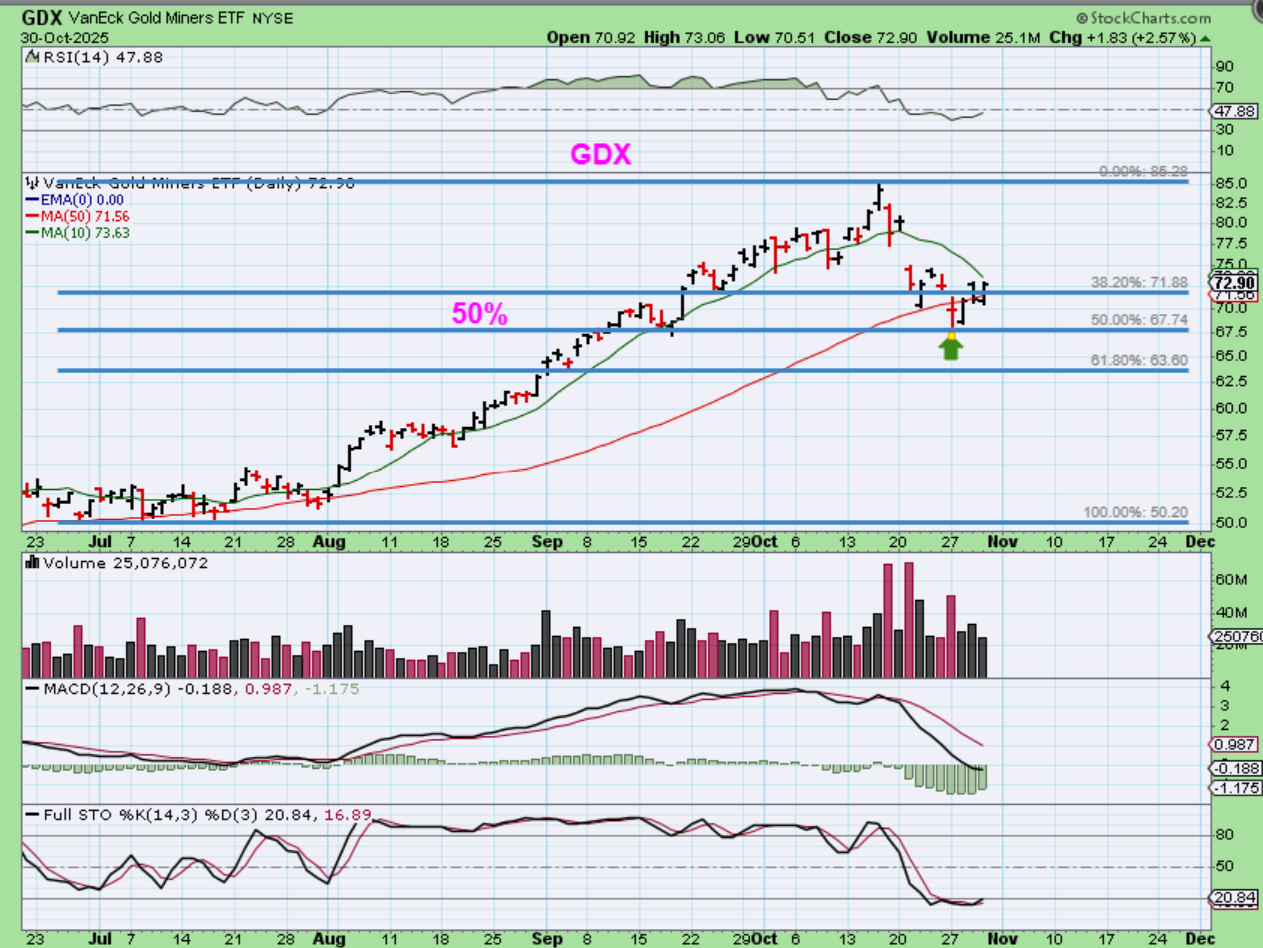
GDX
1. Has a swing low, but it gets fully confirmed when it moves above the 10sma. The drop was sharp, so it is just now pushing against that 10sma.
2. GDX did reverse right at the 50% Fib line and is oversold, so that adds to this as a bullish looking set up.
3. GDX also regained the 50sma. So this is considered a buy, but it also may stall at resistance with that 10sma. I will discuss in the weekend report if this is a long-term buy or not.
.
MINOR PROGRESS: We are seeing a little buying taking place, so the higher this gets from the lows, the better off things will be. Right now I am seeing several Miners have stopped right tat the 10sma, and that may be resistance for now.
.
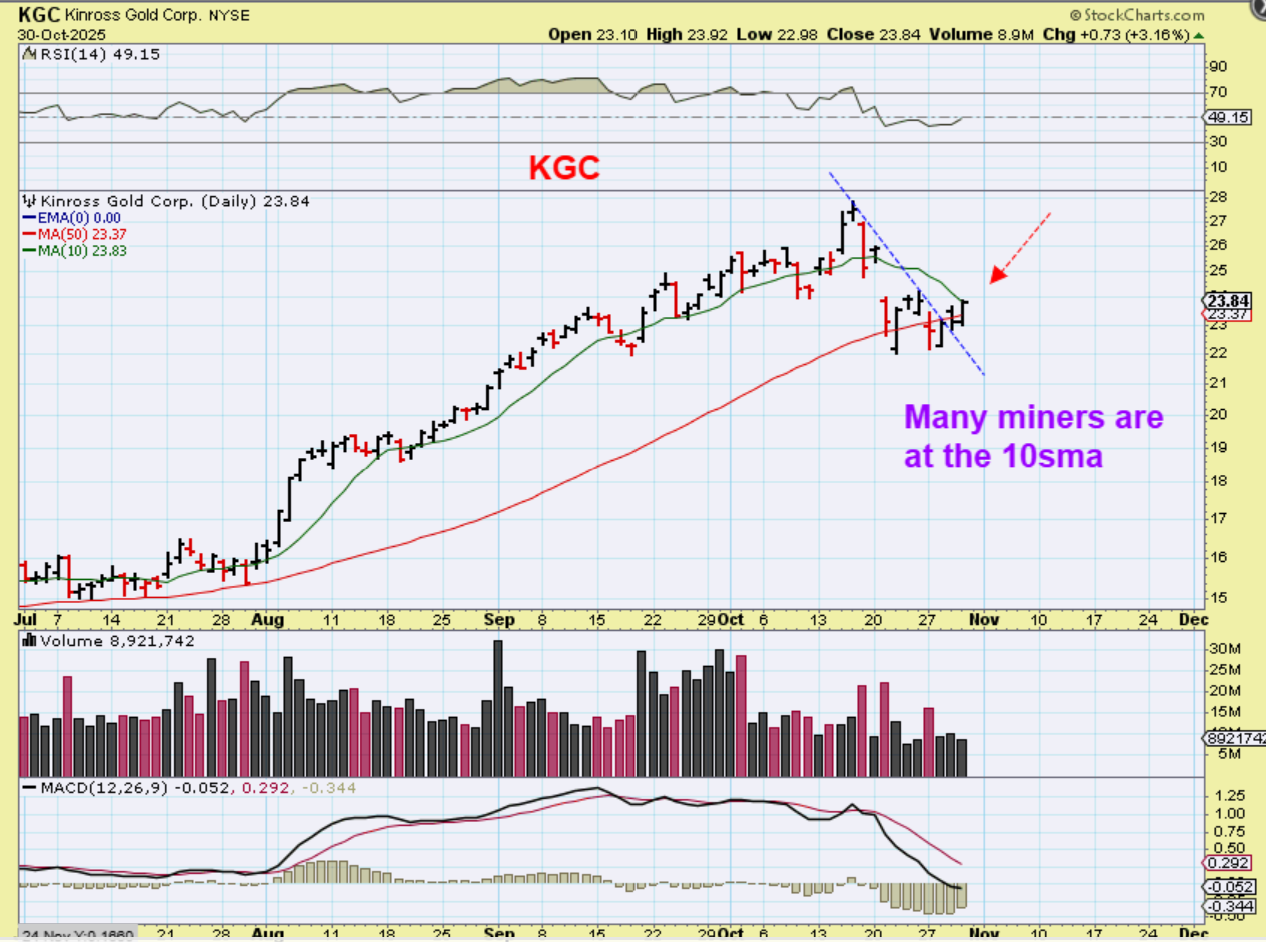
KGC, for example, is pushing on the 10sma, so unless Gold is a lot higher on Friday, it may stall. Notice that it bottomed before the Fed Meeting though.
.
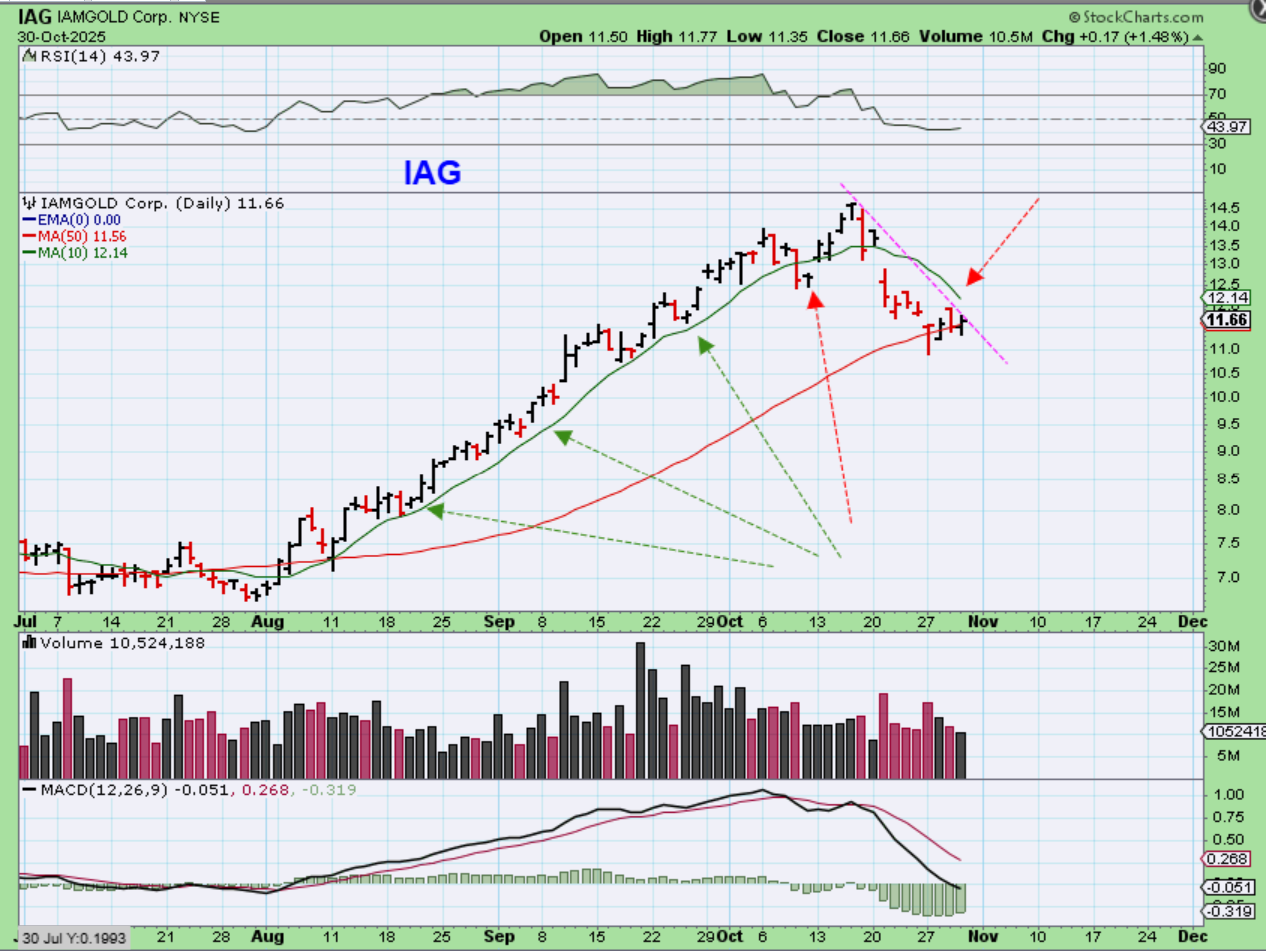
IAG is under the 10sma and at a trendline, so these are not ‘surging’ higher at this point, but hopefully they’ll pick up the pace if Gold or Silver starts to push higher too.
.
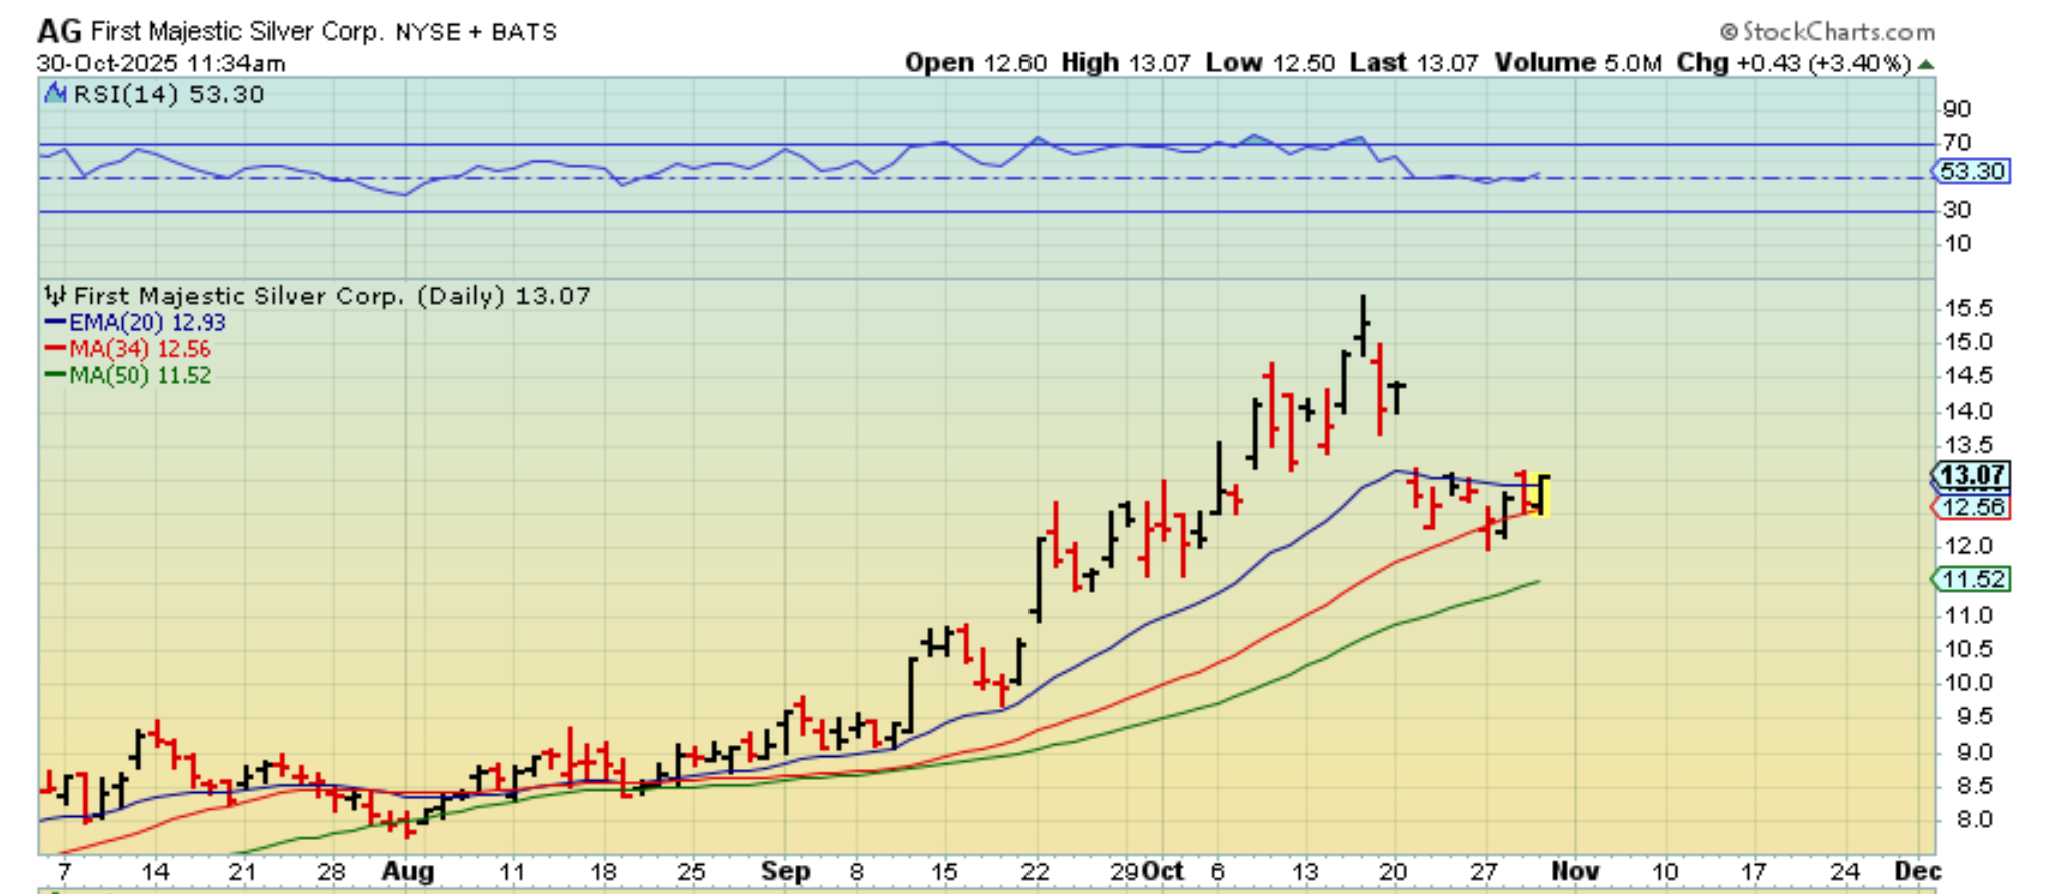
AG has been climbing along the 34 sma for a couple of days now, so this is a bullish set up that the Fed day did not compromise.
.
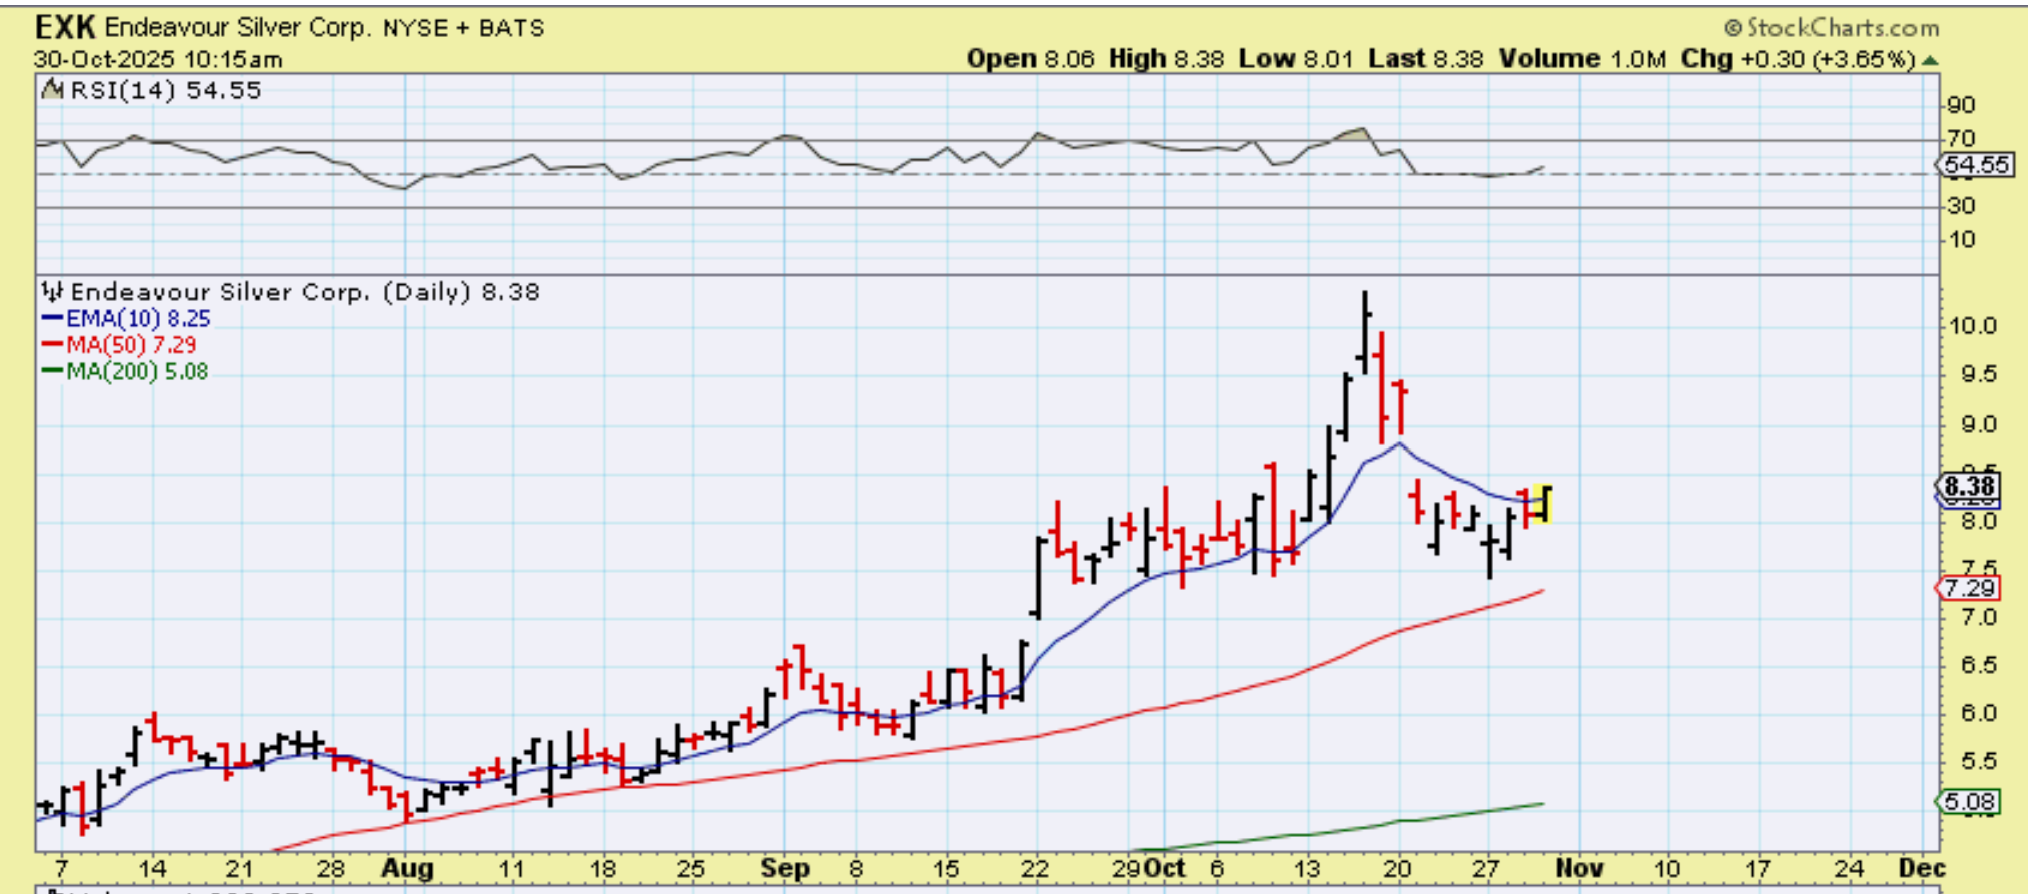
EXK reversed above the 50sma on Monday, before the Fed Wednesday Mtg, and then this one actually did break above the 10 sma on Thursday. This seems to be confirming that EXK has a swing low in place, but if Silver dips on Friday, it will likely lose that 10sma too.
.
Review:
The General Markets gapped up 3 times into that Fed rate cut prospect, and now it sold off on Thursday. This is day 14 and a normal half cycle dip to support could be taking place, and then price would move higher again. Stocks still look ok, so we could still see the markets rally in this 4th daily cycle, but it is month #7 and an ICL dip may start to weigh on the markets. Use stops.
Precious Metals/Miners have started to find support around this Fed Week, at day 28/29, but the 10sma is near term resistance and we are waiting to see id that last strong rally in Miners is experiencing a dcl and then a second leg up that is just as strong (or is the euphoric buying coming to an end). You can buy with a stop or wait for a break above the 10sma.
.
Today is Friday, the last trading day of the Fed rate cut week and so far things seem rather normal. Enjoy your Friday trading and your upcoming weekend!
.
~ALEX
.
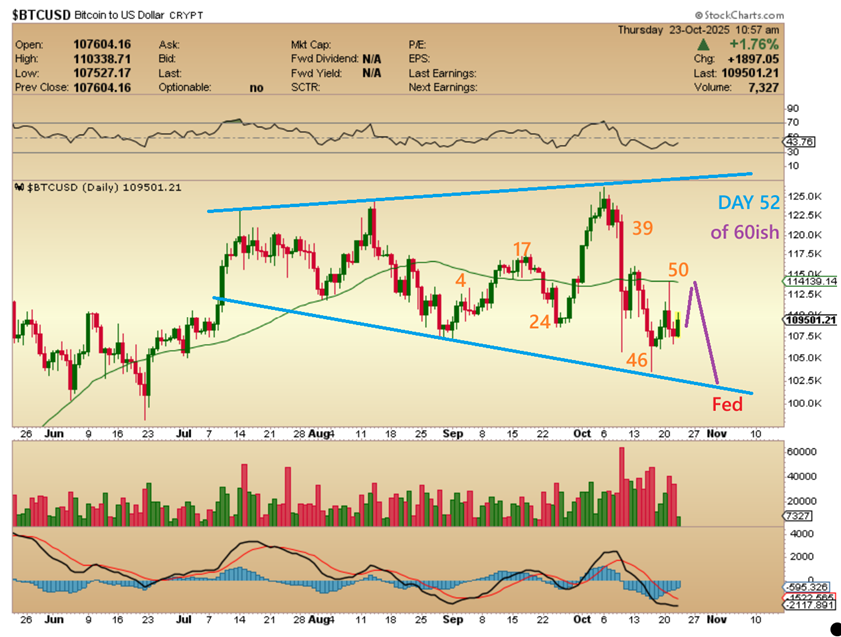
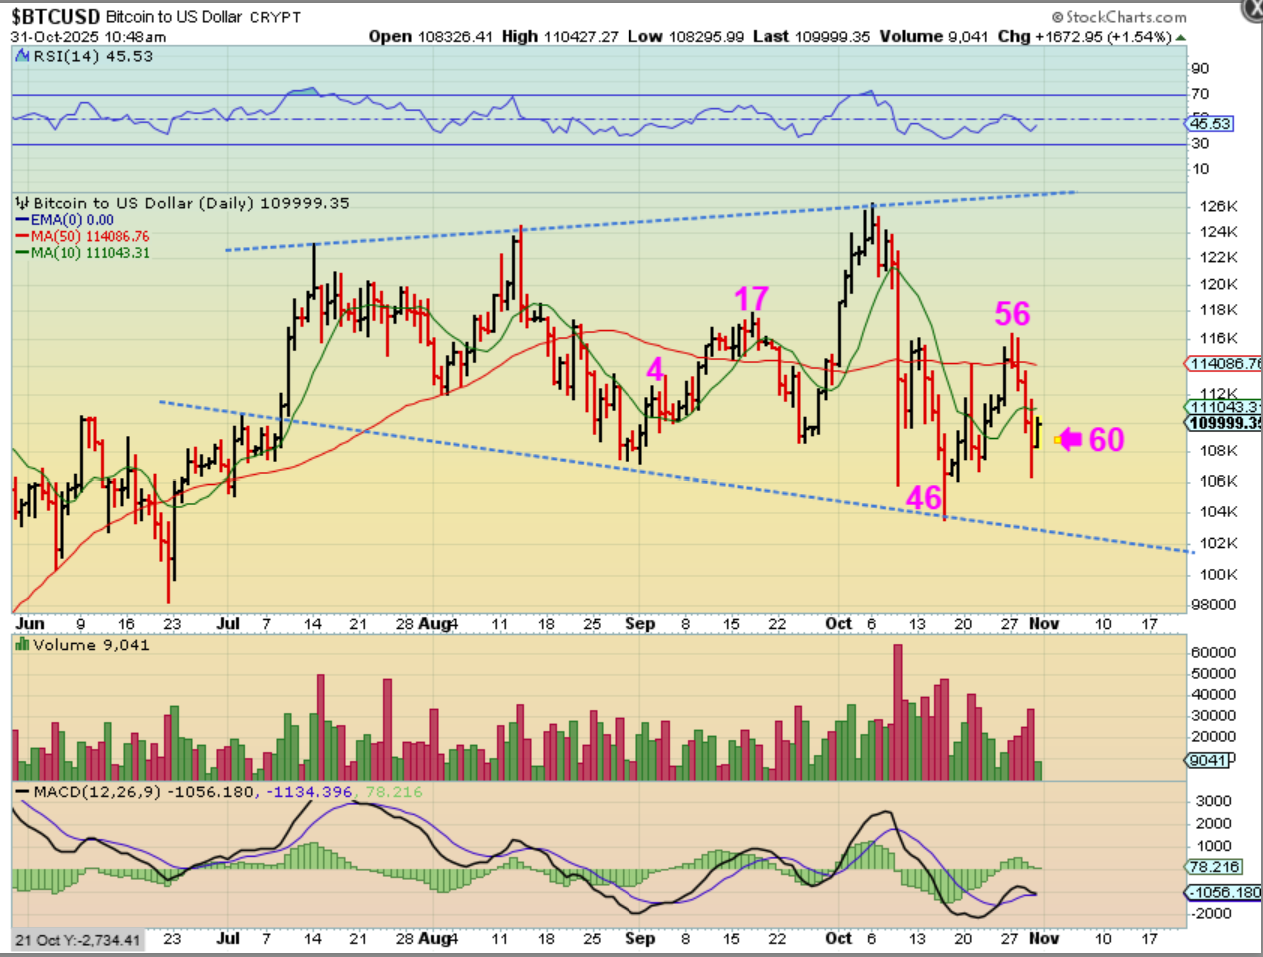
Let’s run through that Bitcoin progression one more time.
.
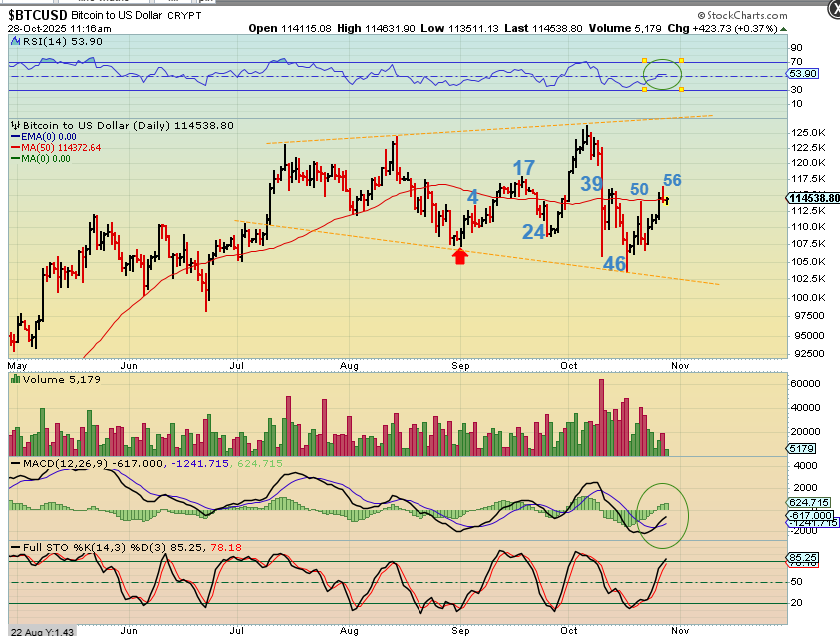
Bitcoin has a 60-day cycle, so last week I was expecting a bounce to the 50sma, and then that drop. I thought that Bitcoin could bottom on the Fed day (I used the chart here last week)
.
Bitcoin had a low at day 46, but that seemed too early. I said that a day 60+ low still seemed necessary, even though this looked quite bullish. I still had to expect a drop even though we were now back above the 50sma on day 56.
.
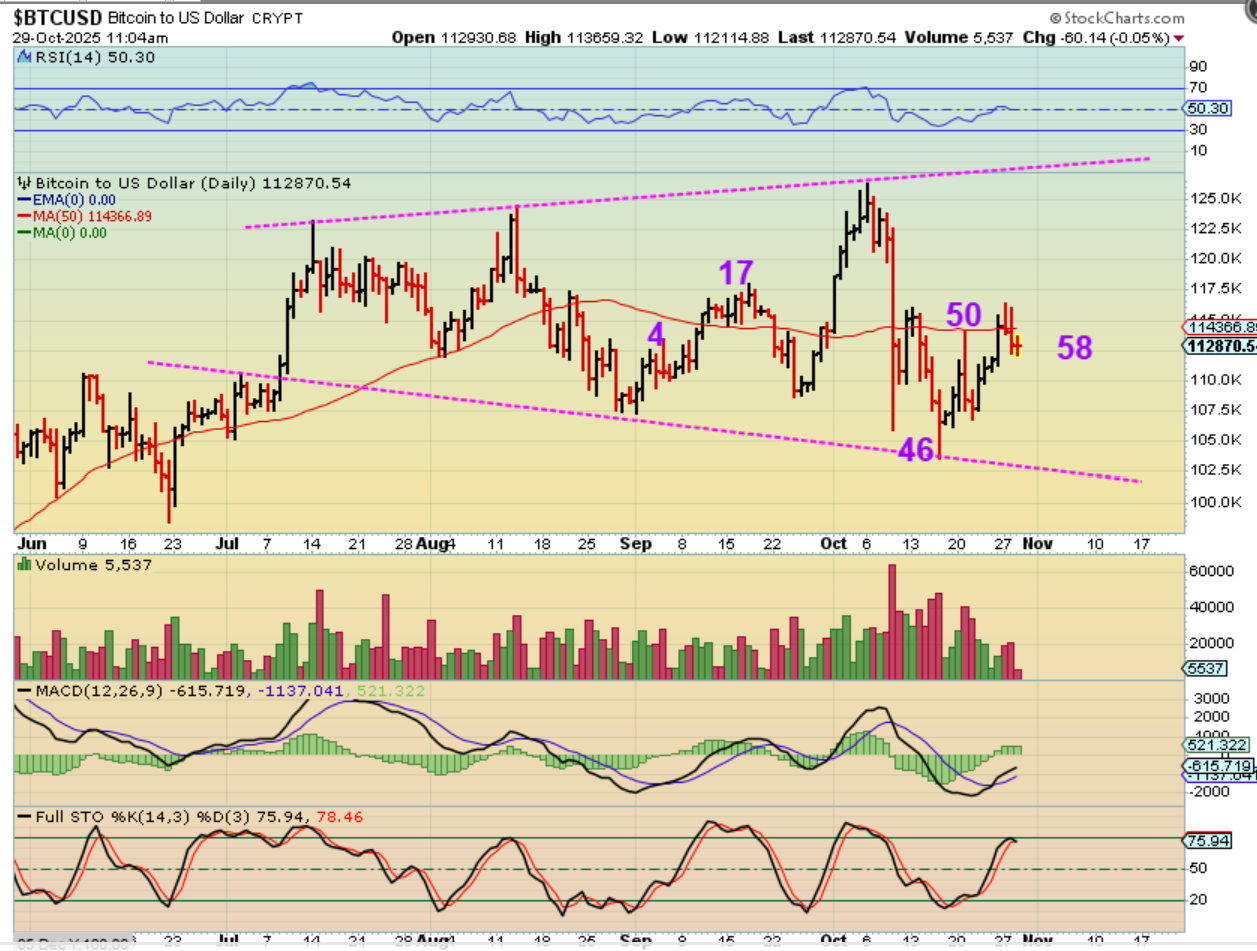
Bitcoin did start to drop on day 58 Wednesday, but it still looked strong. I want to buy crypto stocks, possibly even heavily, if we get that drop, so I’m trying to just be patient…
.
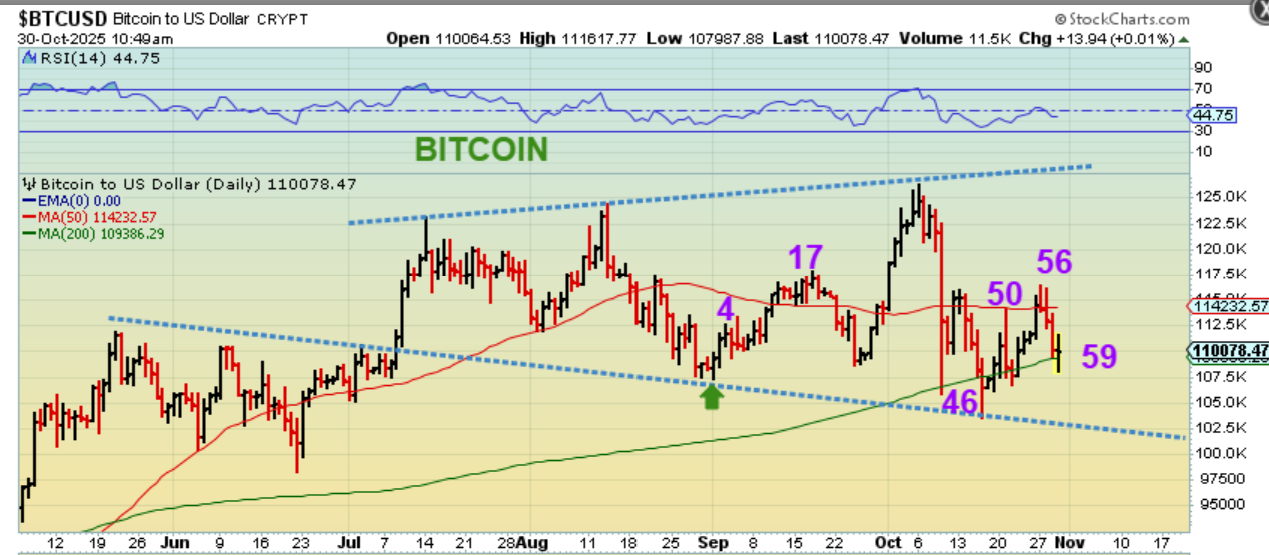
Bitcoin did drop, but found support at the 200sma yesterday on day 59! This is trying my patience for sure! 😉 Is day 46 possibly going to be that low?
.
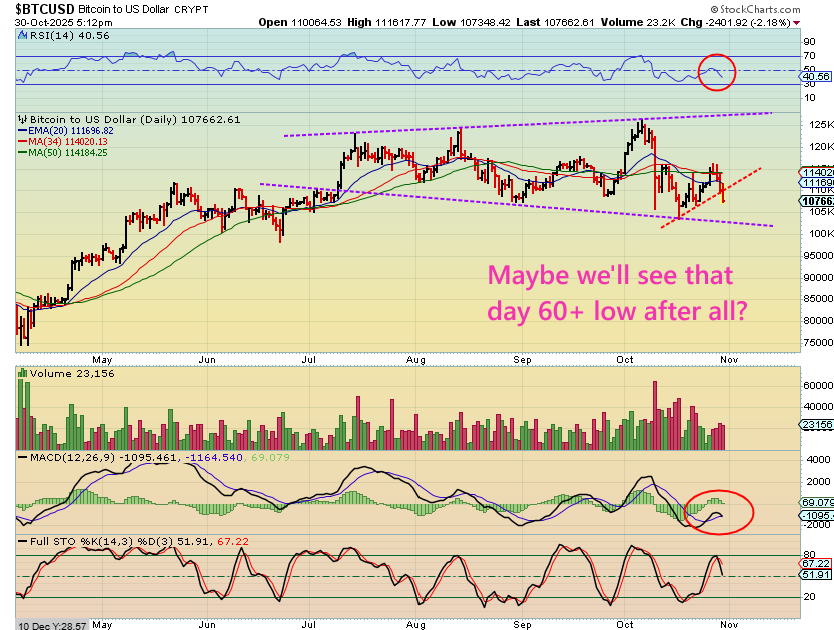
Bitcoin then started to sell off and broke the short uptrend line. MAYBE THIS IS MY DROP ?? 🙂
.
Bitcoin is on day 60 and bouncing??
I have to laugh, because just when I think I’ll see that new low near day 60, Bitcoin strengthens. This is Friday day 60 and this bounce is taking place right before the weekend. Bitcoin does trade 24/7 over the weekend, so this obviously makes it tricky.
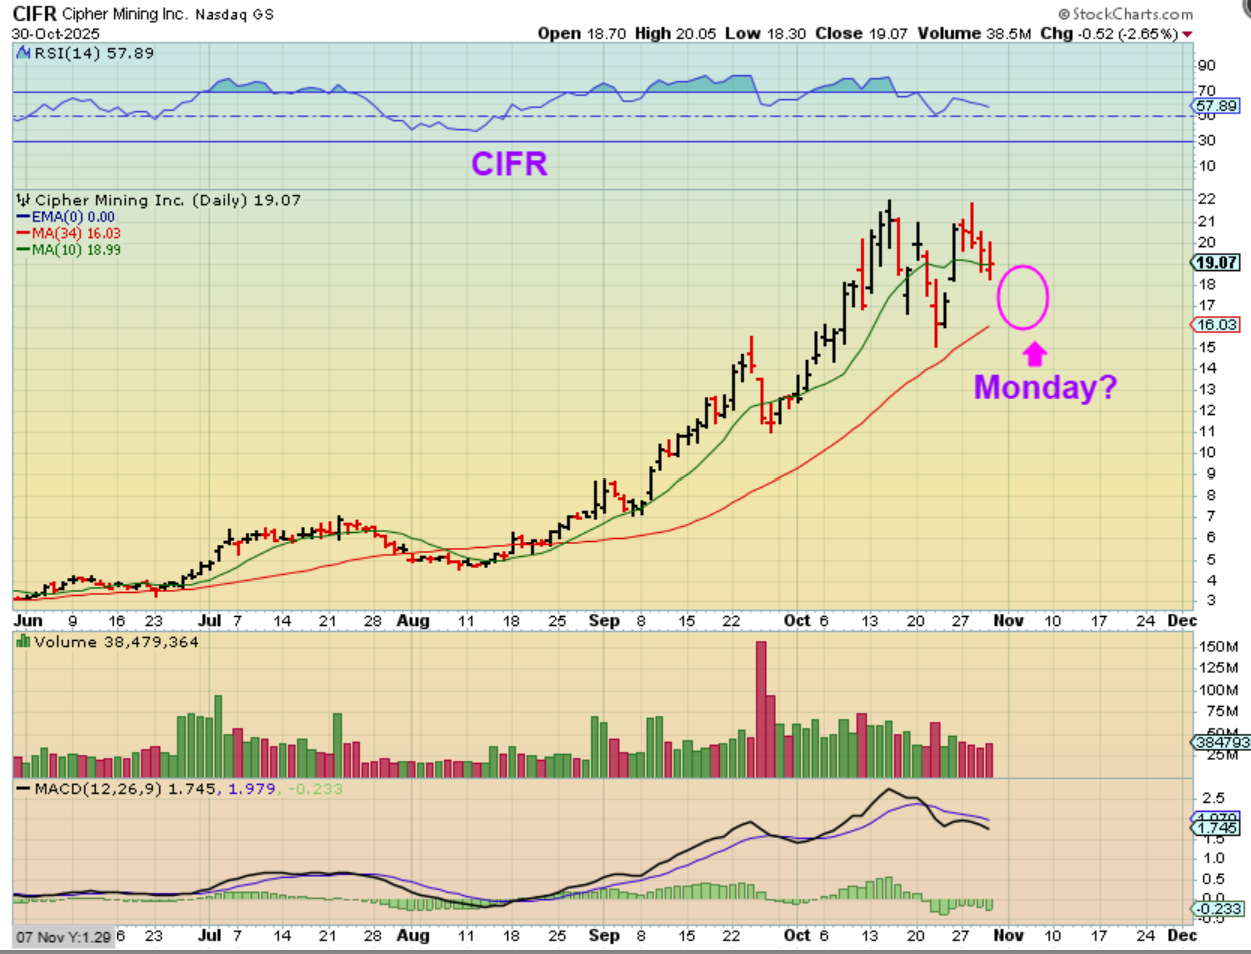
1. Will this bottom and rally over the weekend and leave us with Crypto stocks gapping up higher on Monday? We could rally one final time, with Buyers eager to get in. Or…
2. Will that low come on day 61 or 62 over the weekend or even on Monday, with a gap down on Monday for crypto stocks and then a rally? Time will tell, but I will say this…
.
Will that low come on day 61 or 62 over the weekend or even on Monday, with a gap down on Monday for crypto stocks and then a rally? It may happen that way, but I will say this:
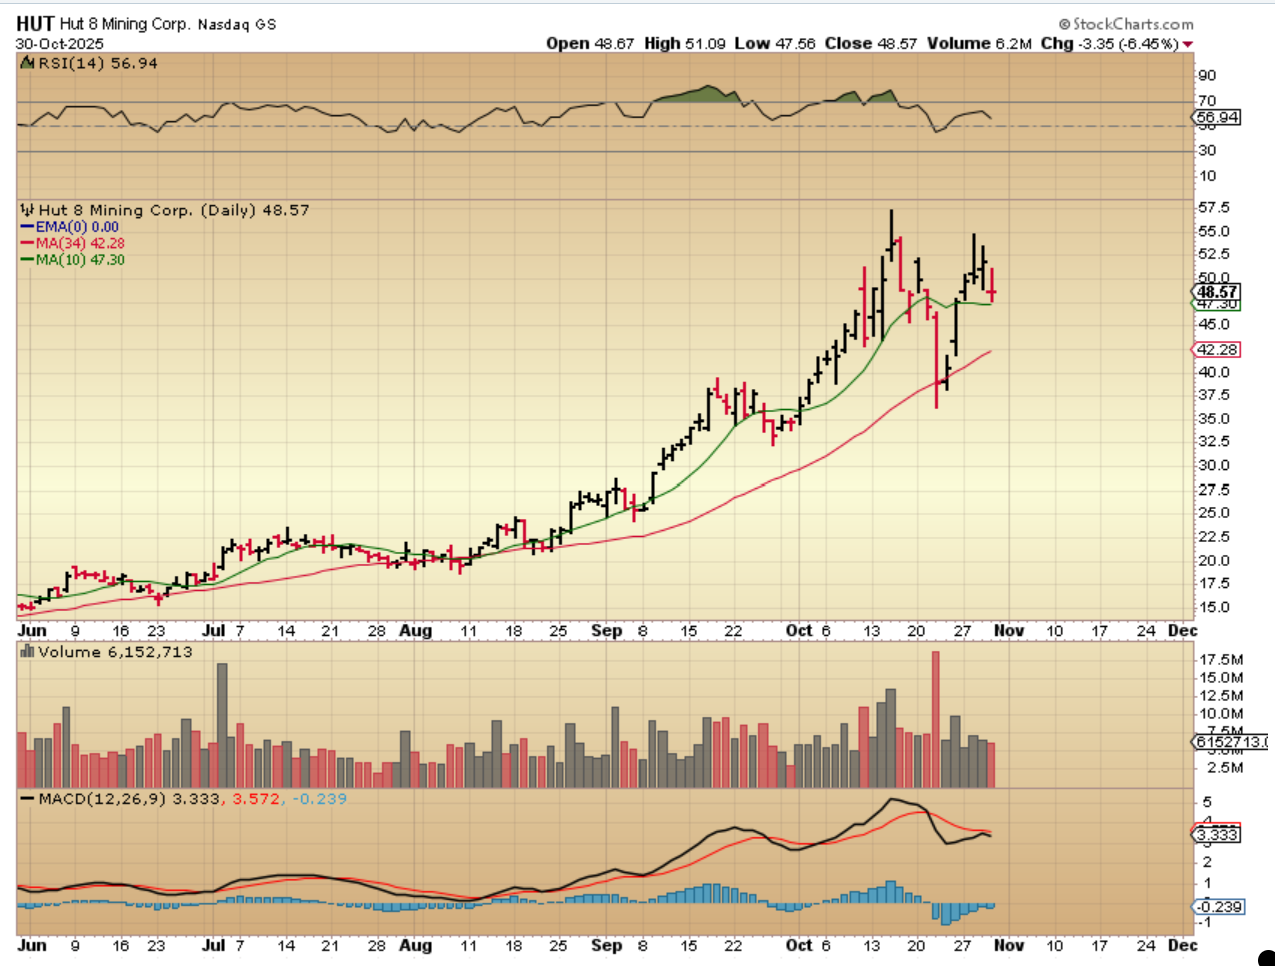
Many crypto stocks like DGXX, CIFR, HUT, IREN, WULF, etc are holding up quite nicely. The MACD is divergent, but that can change if this drops and chops higher. If not, this looks like a classic double top.
.
HUT – You can see that the stronger ones look similar.
This could be a double top, and that MACD seems to show a cautionary flag going up, but with Bitcoin at day 60 and at least a good bounce coming, I would expect these to rally again and then we’ll see more divergence or an easing of the divergence. Just so you know though, Normally, I would say that this looks more like a topping process.