Friday October 17th
.
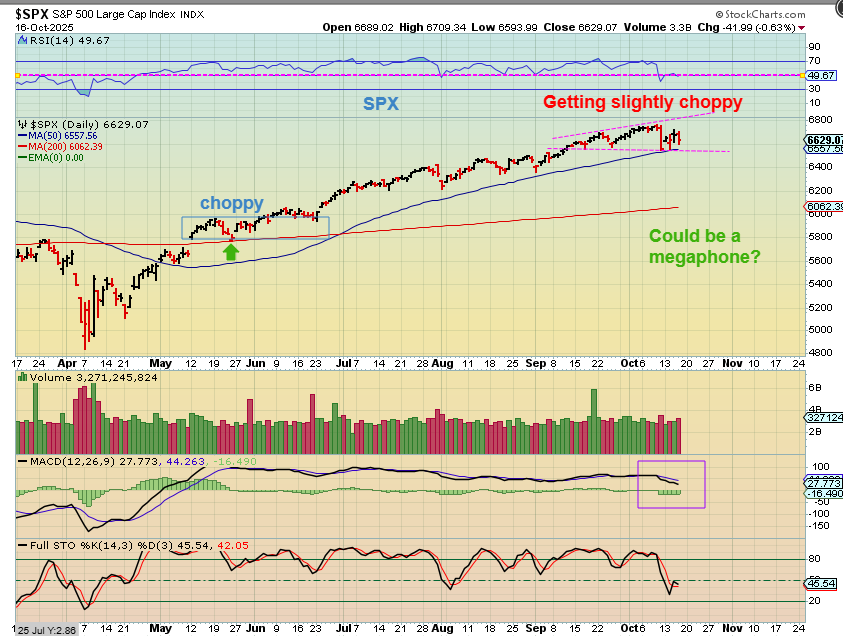
THE SPX dropped and the stock market has become a bit choppy again. If you look over at May and June, you can see that this kind of price action is normal, and it is not really bearish unless the lows are broken. I’ll be watching those lows.
.
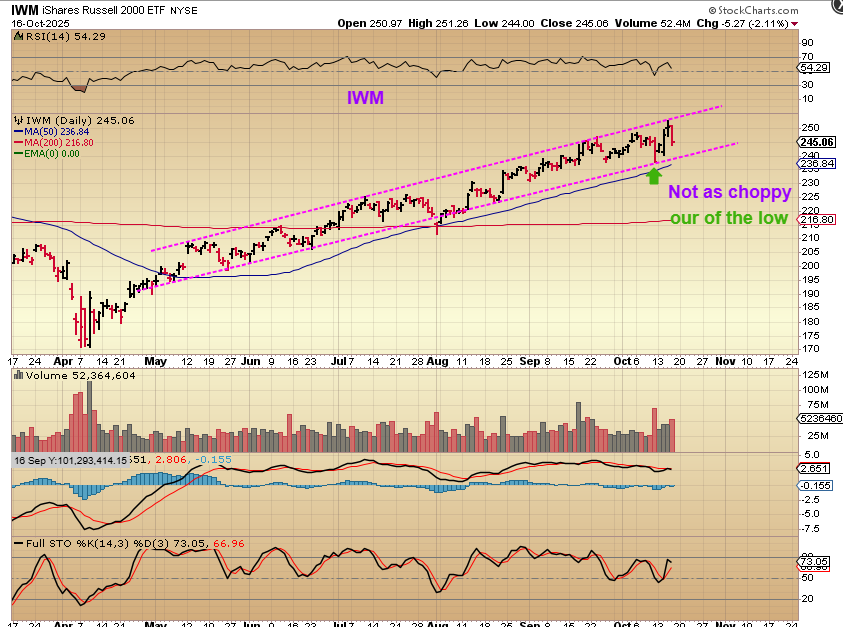
The IWM looks differently from the SPX & NASDAQ choppiness. It popped strongly on Tuesday and also dipped lower on Thursday, but it is less choppy and doesn’t look bad at all. That said…many of our Strong Bullish stocks took a sharp dive on Thursday, so it’s worth watching closely going forward.
.
.
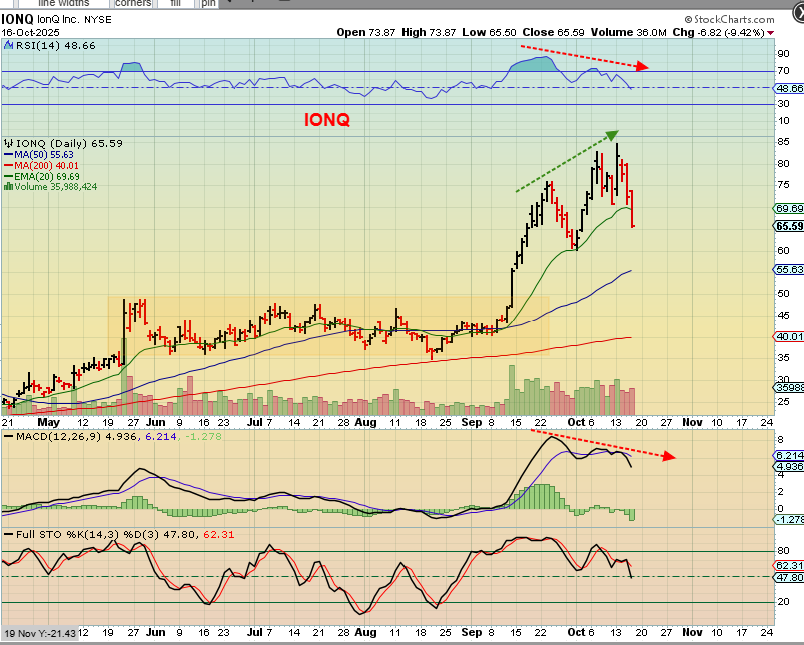
IONQ – I’ll be honest with you, this does not look good for several reasons. It lost the 20ema, the RSI did not confirm strength in the new high and the MACD also showed me a lack of momentum. It ‘Could’ bounce if the markets do, but I think that the highs are in for now and it may just become choppy. It actually looks ready to drop to $55. I’ll be watching this for more clues as to what may be happening.
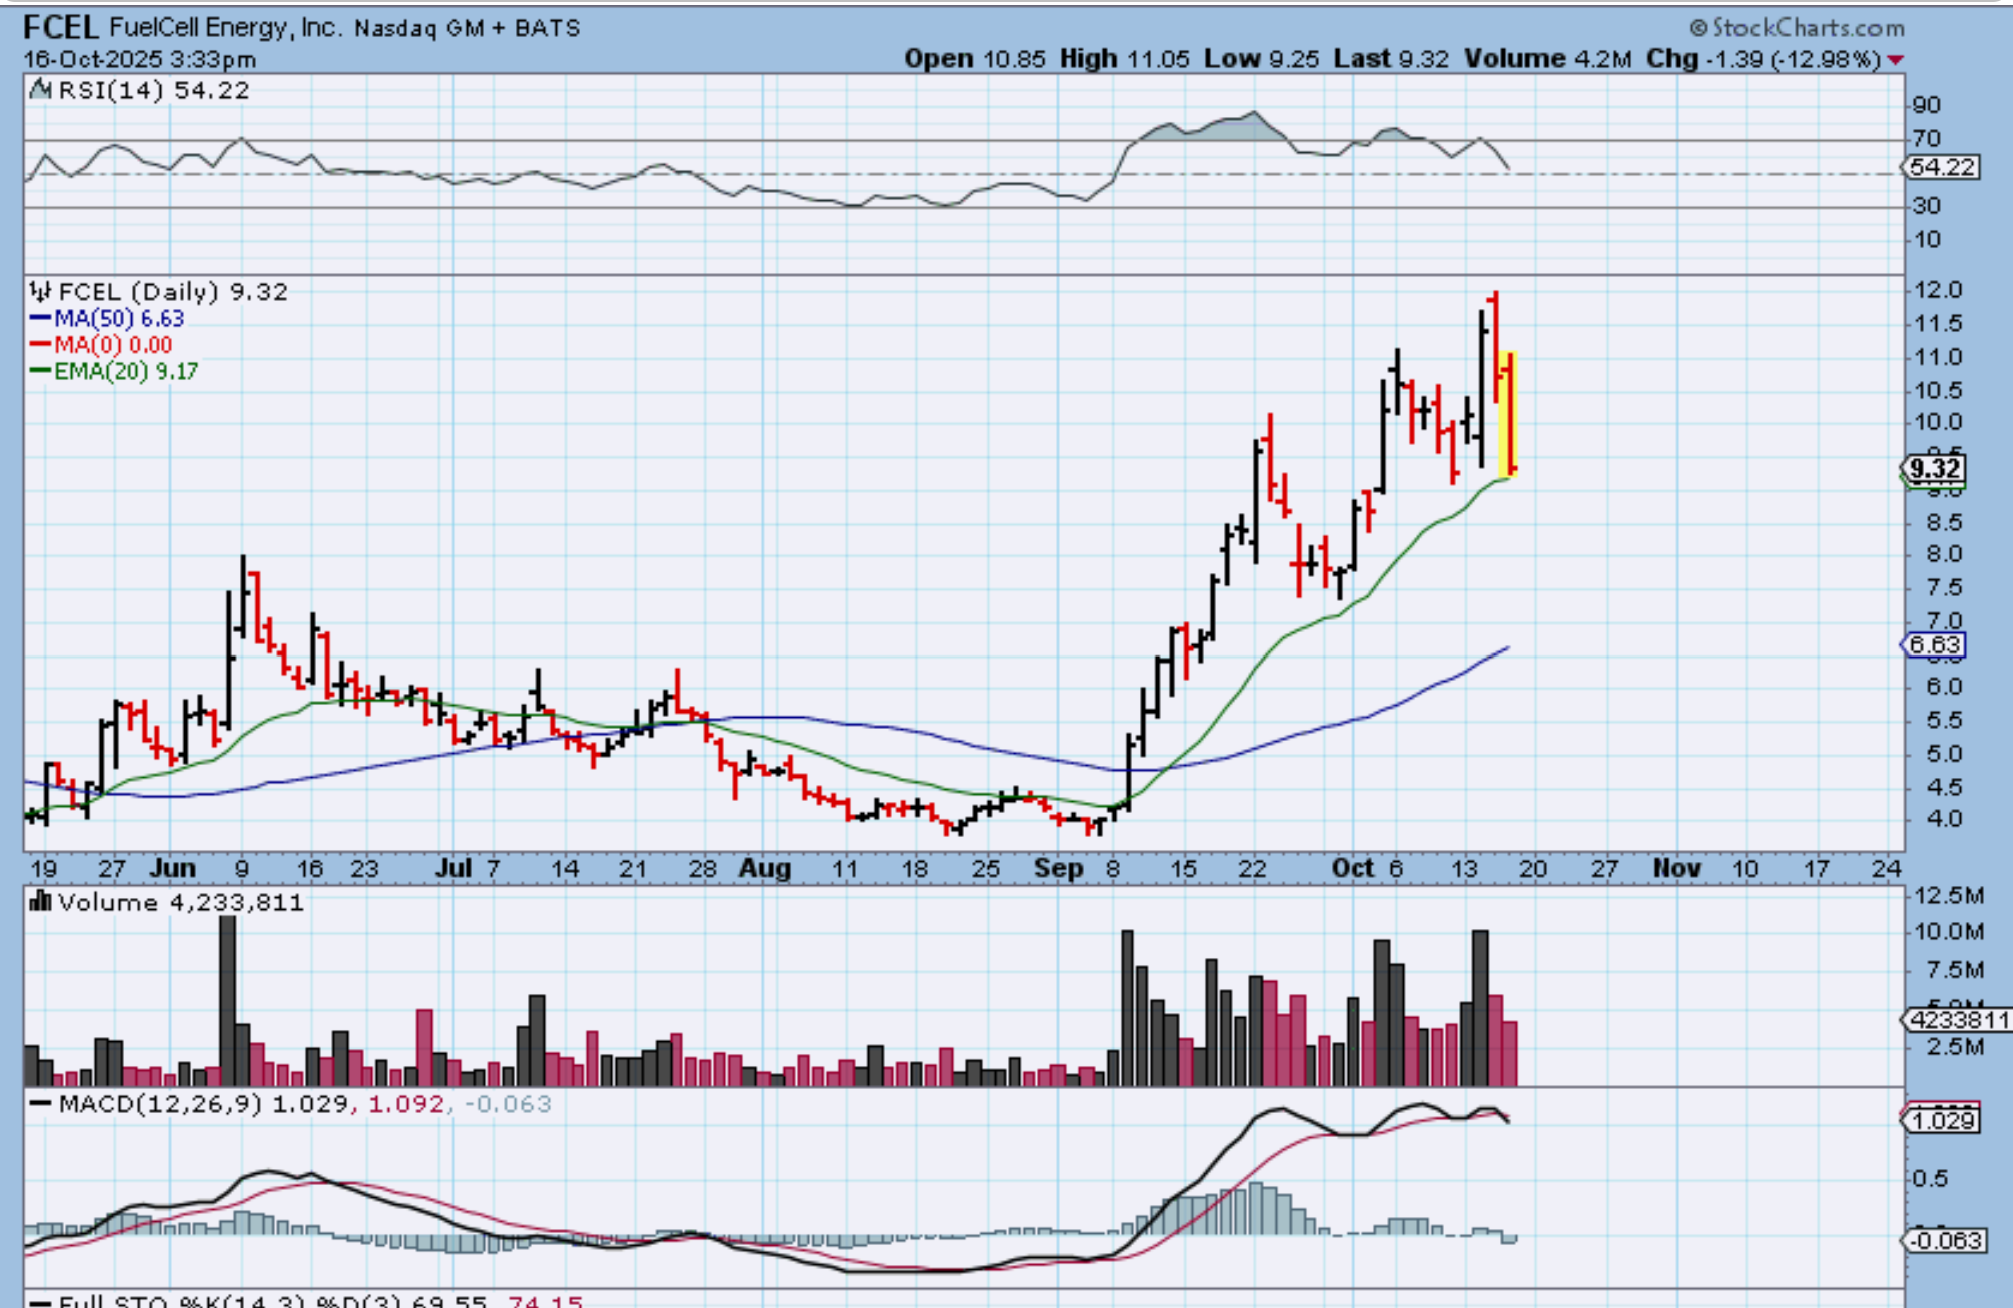
FCEL dropped 13% Thursday, and this chart doesn’t look bad if it reverses and the 20 ema, but with the recent chop and weakness, I wonder if it will? So I will be watching closely, especially because…
.
I will be watching closely, especially because other big winners are breaking down more than expected. Take a look at WWR for example…
.
I admit:
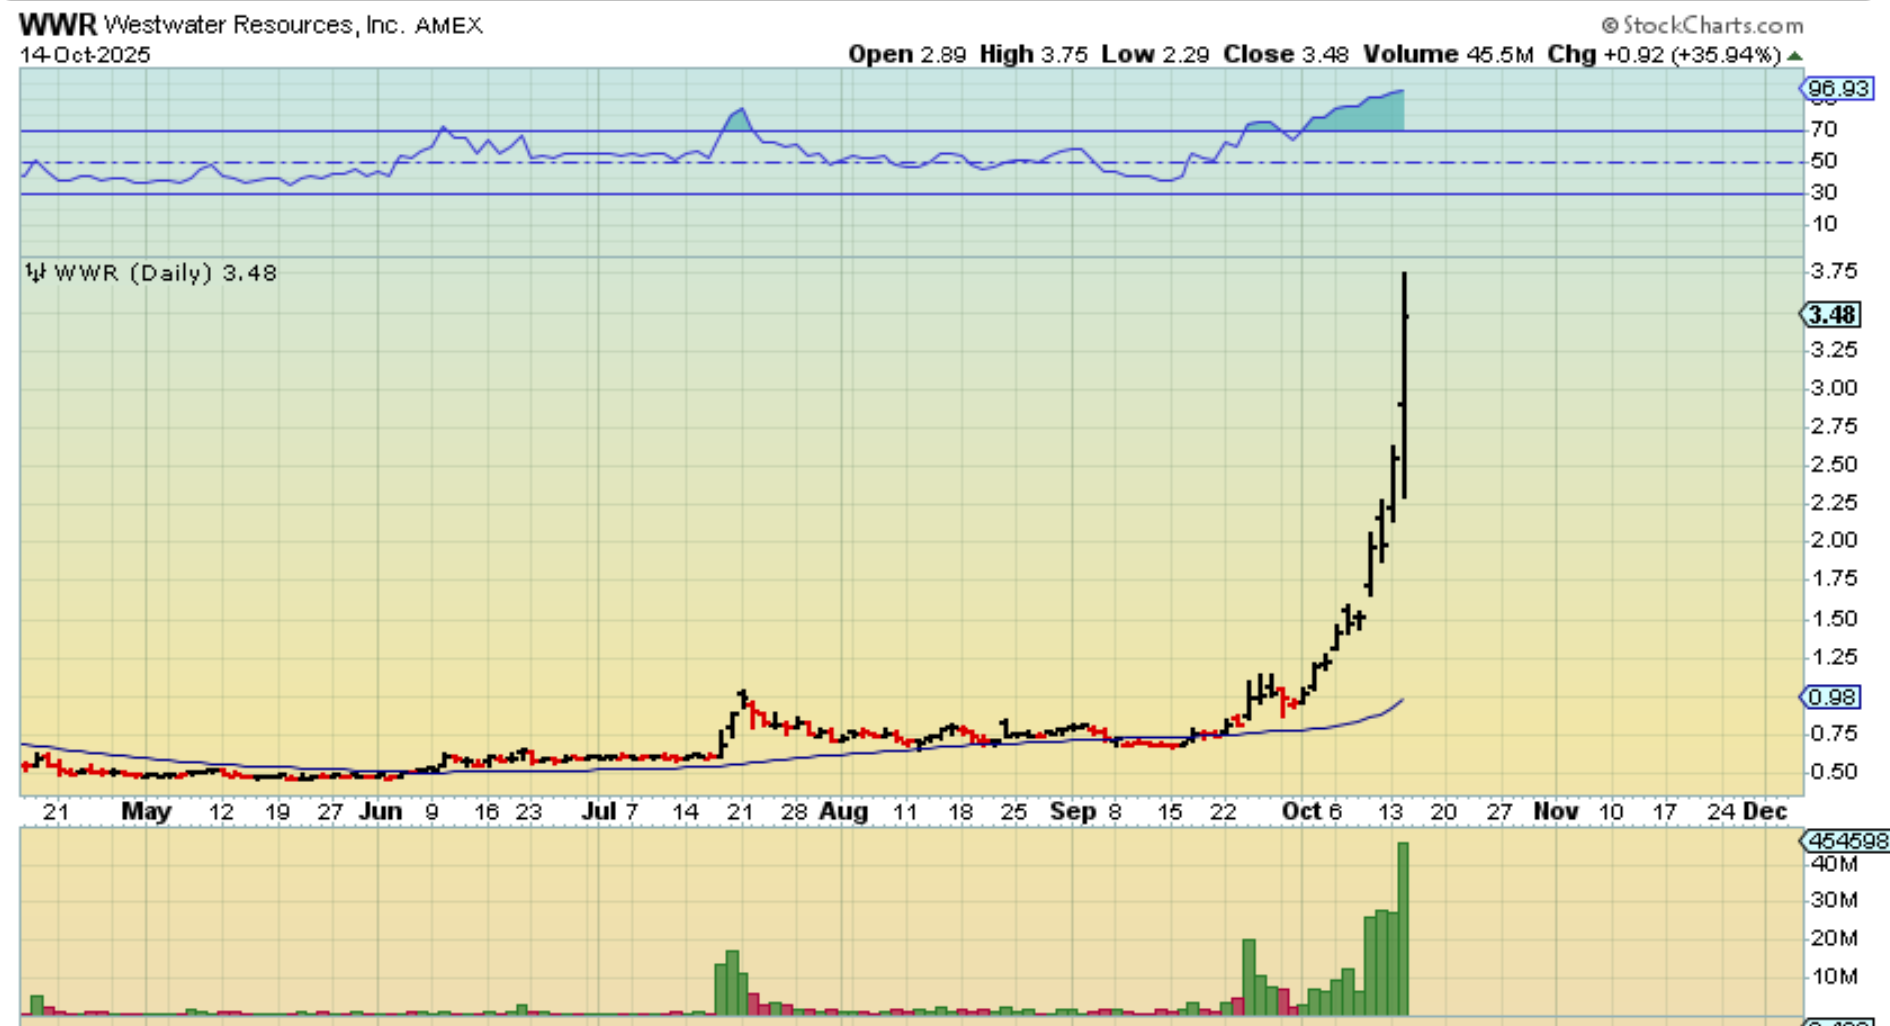
WWR did go a bit parabolic, so maybe I shouldn’t use this example, but this ramp up was steady until Tuesdays Burst higher, and then…
.
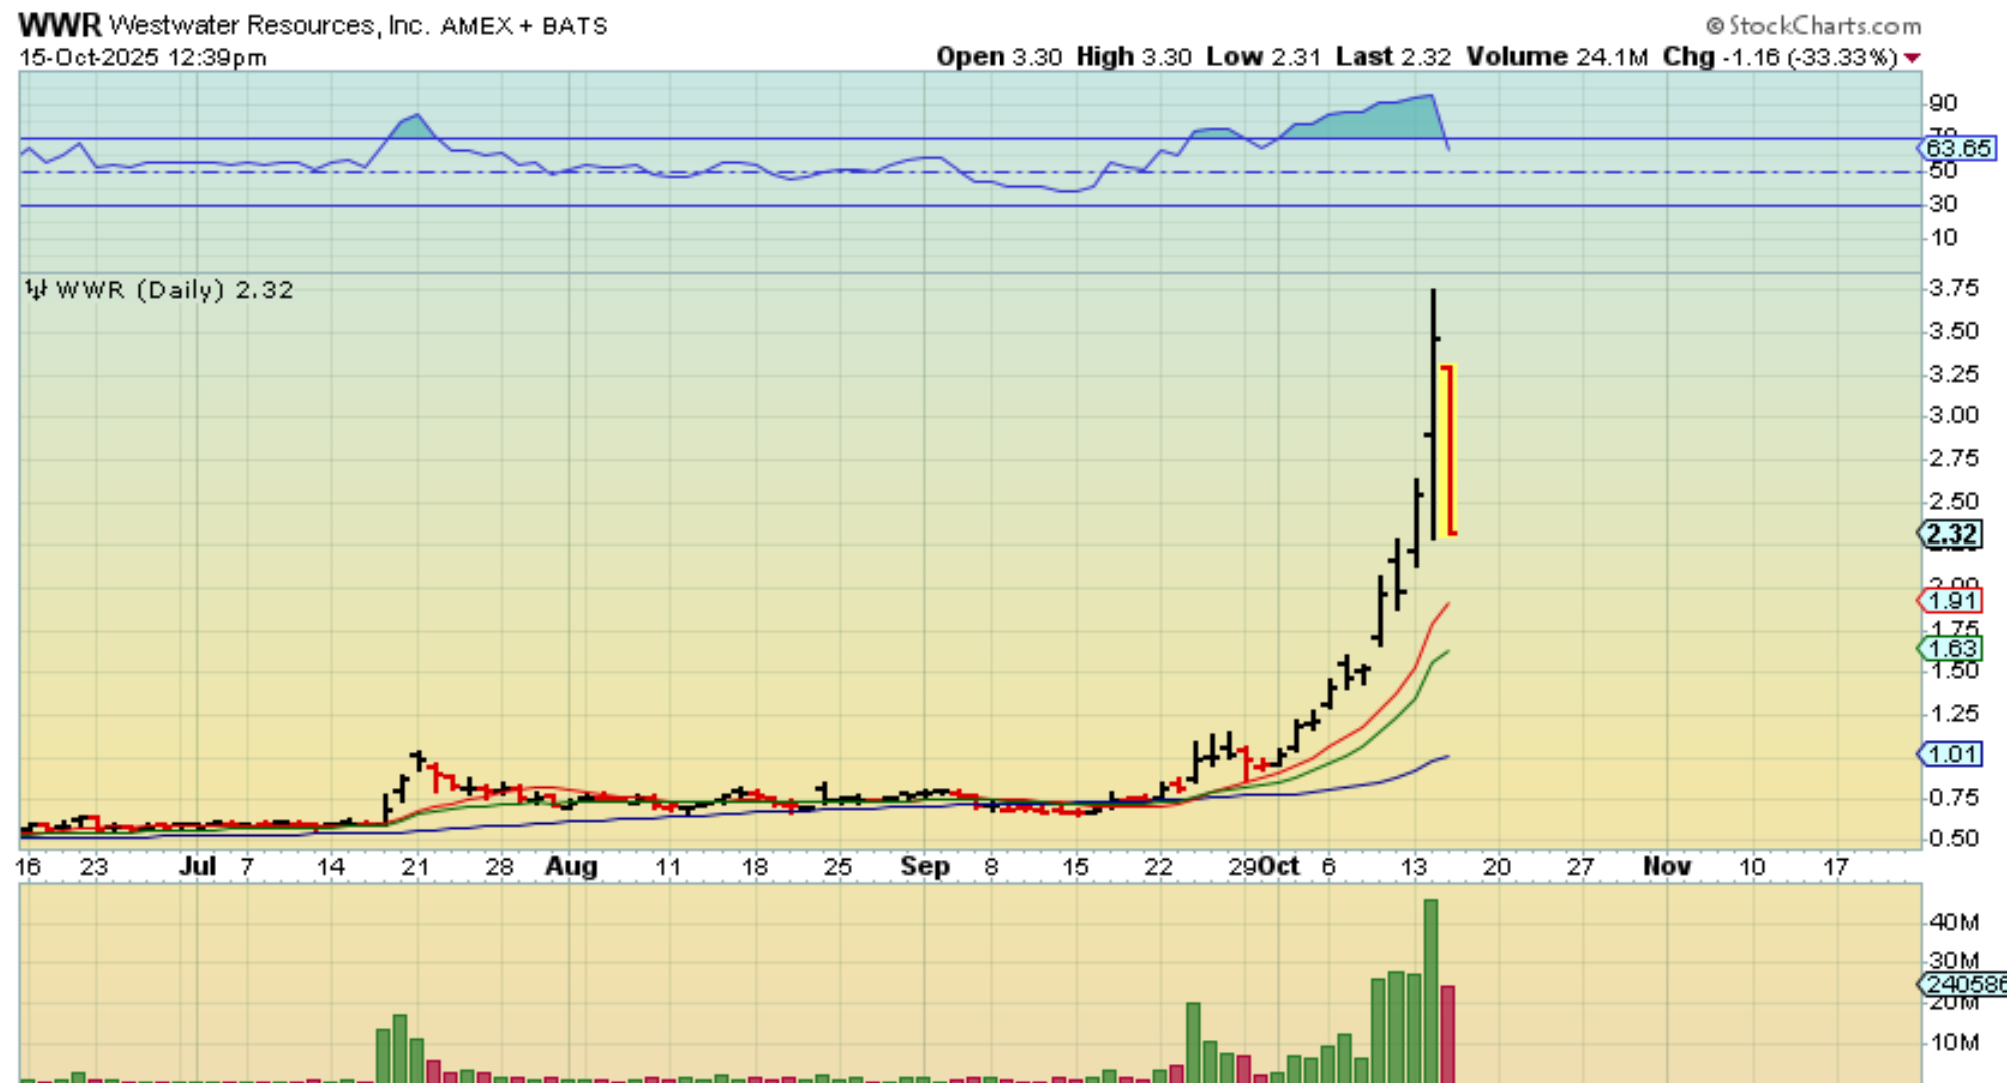
WWR – dropped Down 33%. Ok, so we have moving average support at $2, right? Maybe, we’ll see, because…
.
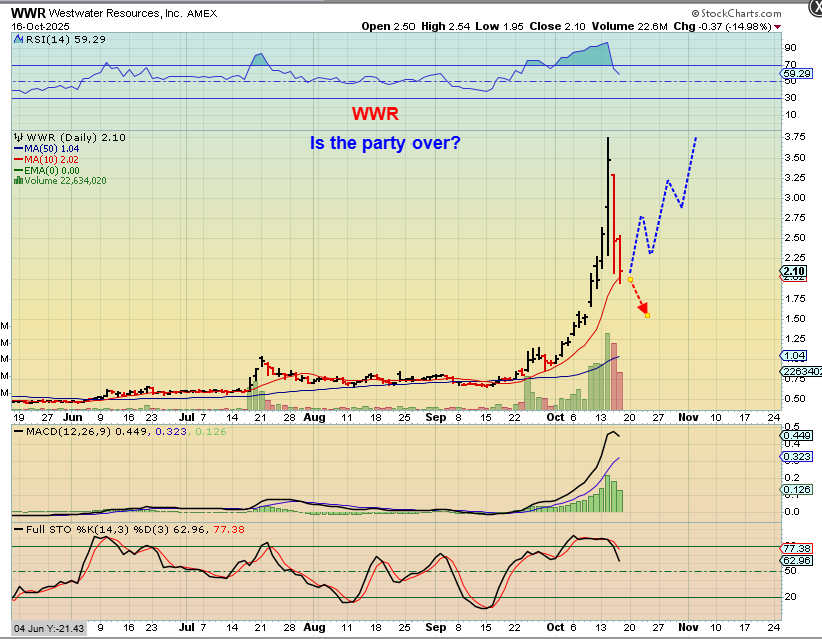
WWR lost another 15% Thursday and it is at that support area. This is do or die, so I’ll be watching.
.
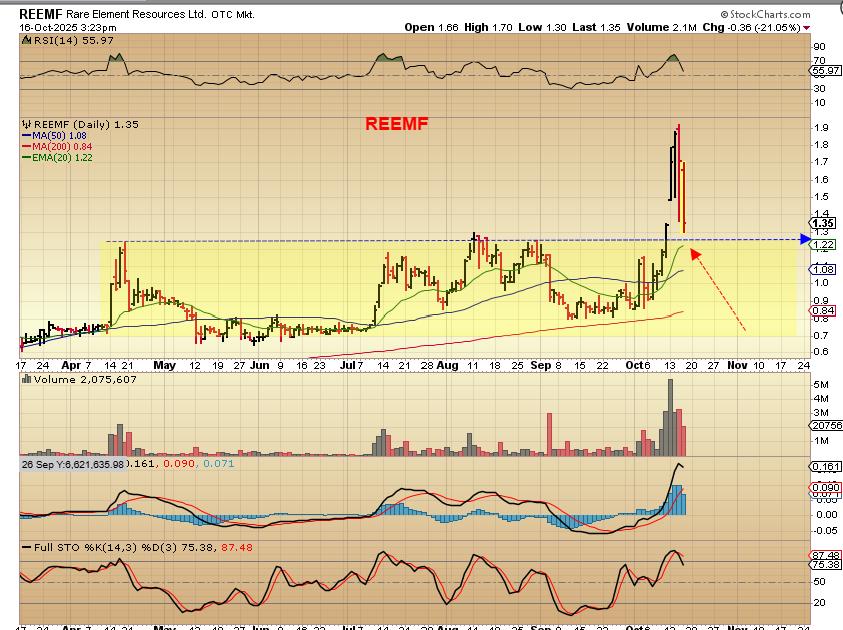
I also saw several Rare Earth and Uranium Stocks down 10%, 15%, and even over 20%. REEMF, ARRNF, TMRC, UURAF, AREC, NB, UAMY, UUUU, USAR, etc were down 15% to over 20%. So…
.
REEMF is an example of a breakout and POP higher on Monday and Tuesday. Wednesday and Thursdays drop took all of those gains away. Thursday saw REEMF lose 21%. IS this support, will it hold? If it chops as a back test and then reverses higher, you could buy it, but if it breaks down, this ramp up may be over.
.
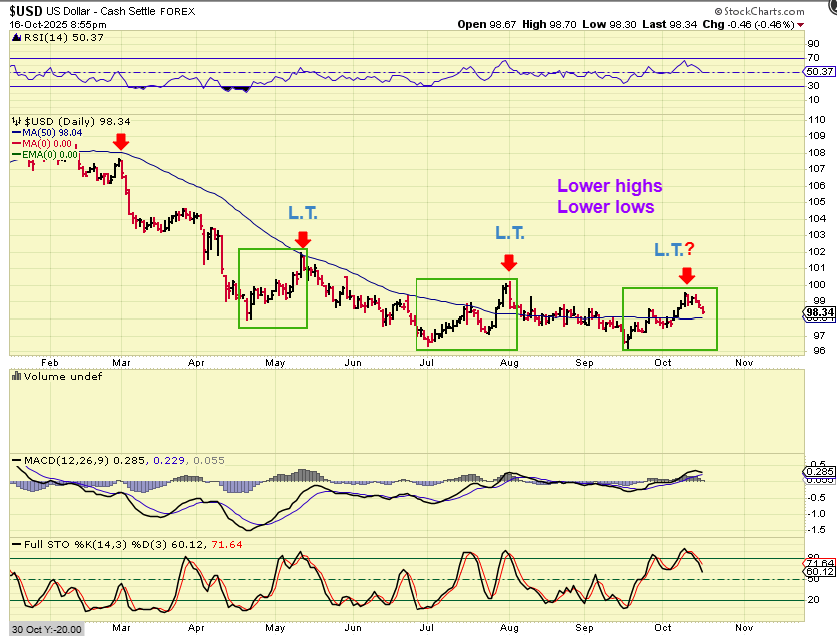
So far, The USD continues to act as expected. At this point it would become L.T. and also a lower high like the last 2 ‘peaks’, but we’ll see what it does at the next test of support, the 50sma. I know that it looks like that drop will repeat similar to the last 2 L.T. Peaks, but …
.
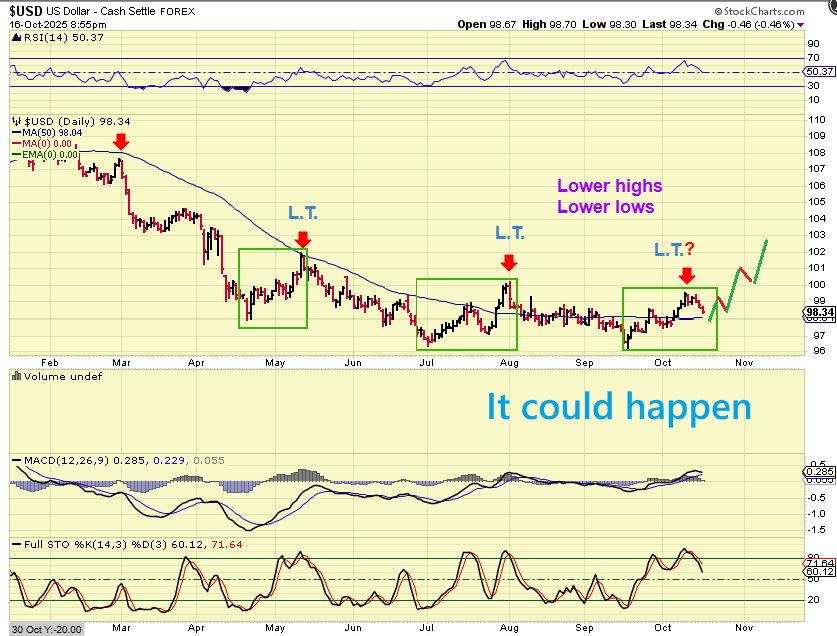
I know that it looks like that drop will repeat similar to the last 2 L.T. Peaks, but it is still possible that we could get a rounding bottom base and a strong USD with a bounce off of the 50sma. I’ll be watching this too!
.
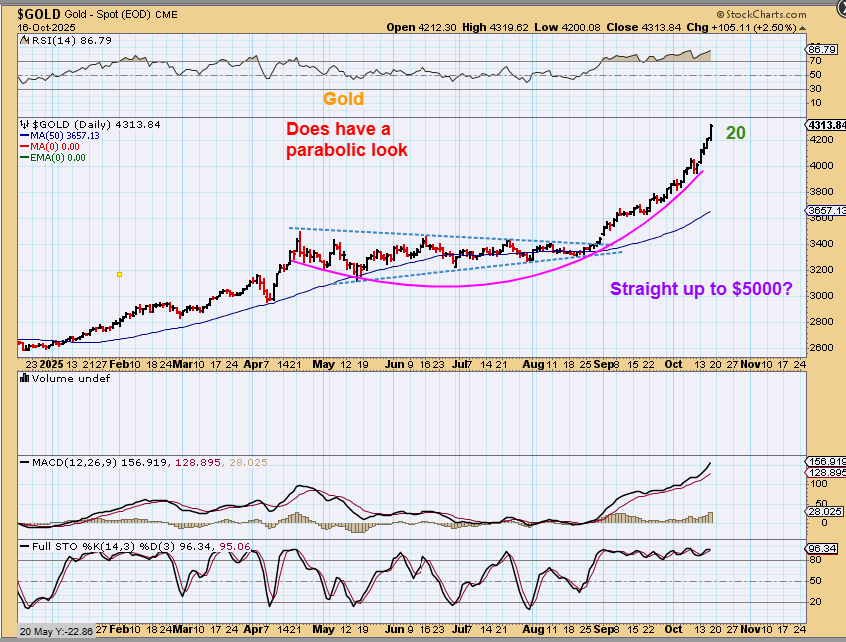
GOLD popped again, $105 on day 20. We know that we can get a dip into a dcl for day 23 or 26, and then run again, but we can also get that dip later for day 32. If this keeps on climbing like this day after day into the Fed meeting, then I think it could be a parabolic blow off top. I’m going to keep watching this one too.
.
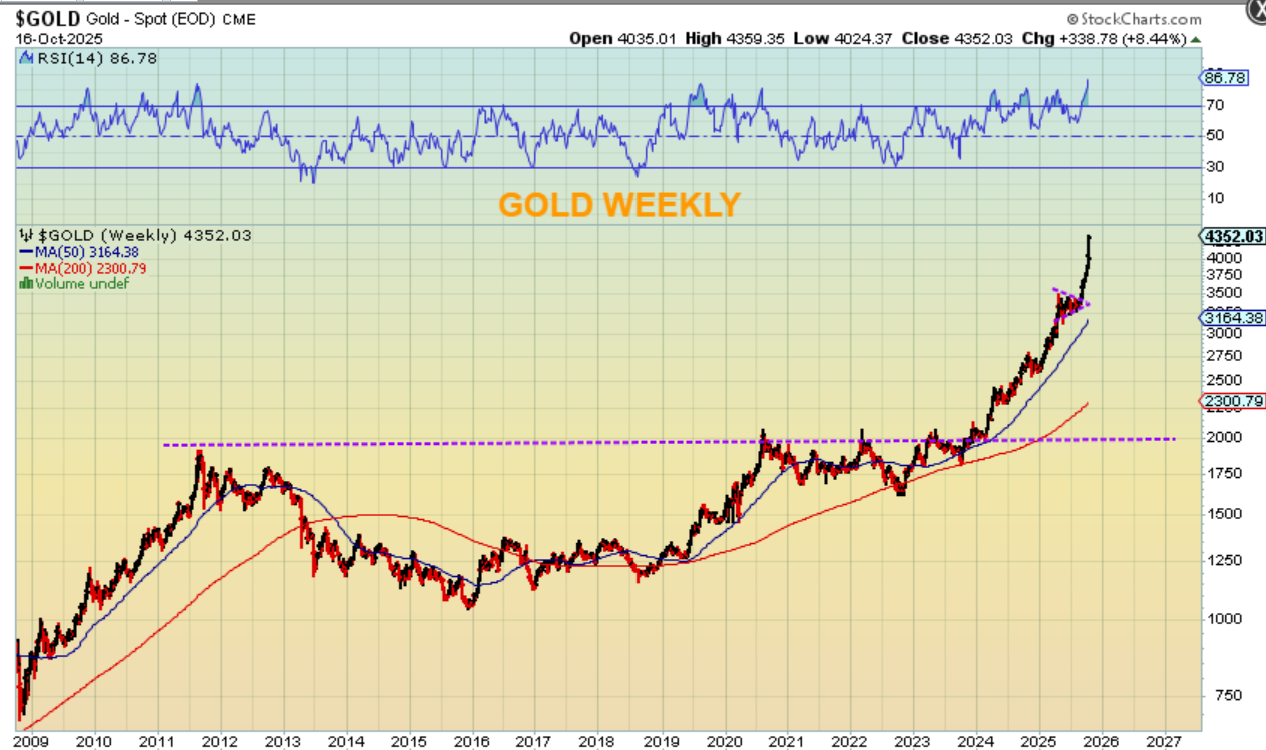
GOLD WEEKLY – When I say that Gold looks a bit parabolic, this is where Gold looks a bit parabolic. Can it go higher? It can, but will we get a dip into the Fed and then a final run or not? That remains to be seen.
.
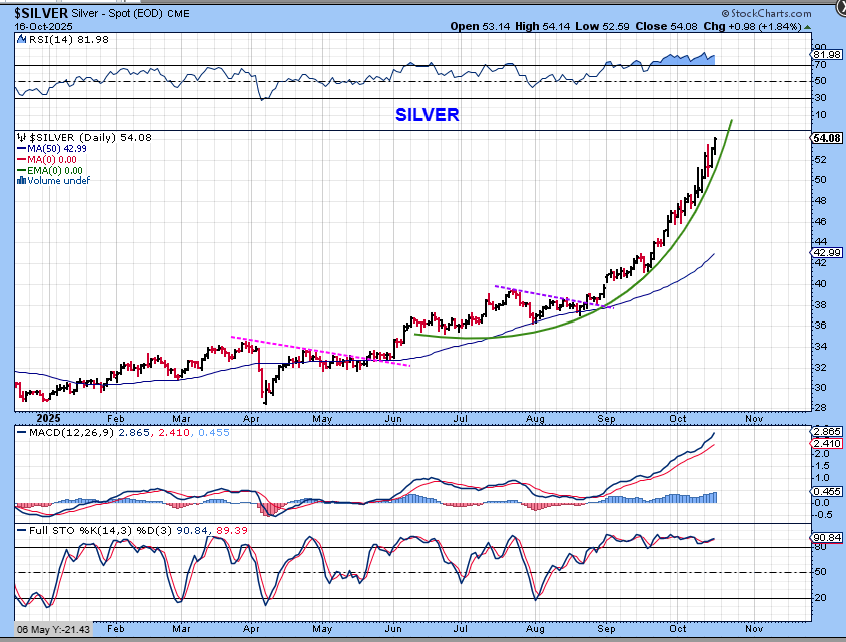
SILVER was choppy, but it has become a bit tighter in its run higher. I already showed these charts in the weekly report as going parabolic, but the question was: Do we get a dip and a final run, or is this a final parabolic run? I have been monitoring it, and I’ll continue watching, and you may remember what I’ve already said…
.
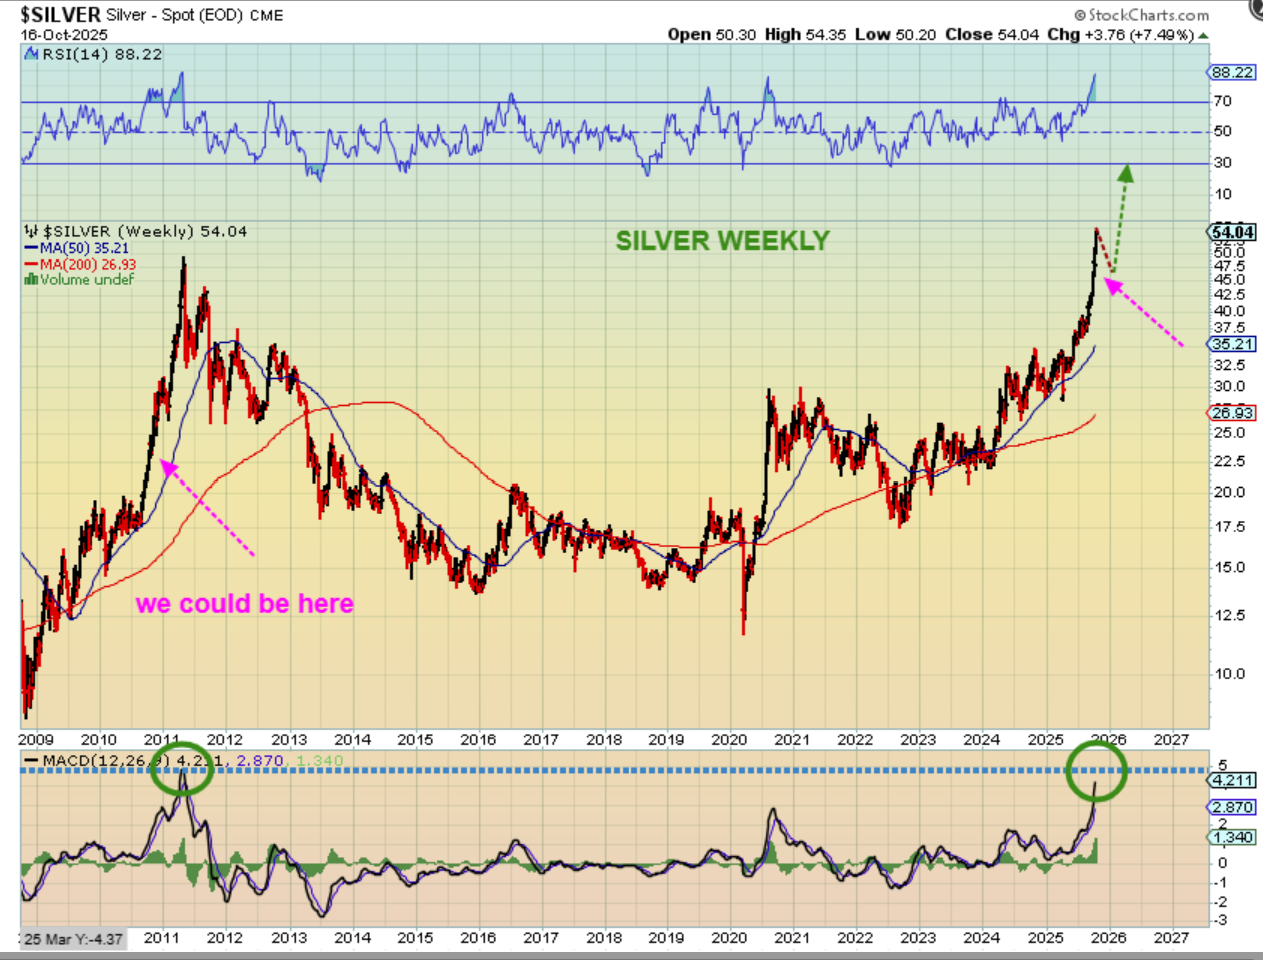
SILVER looks parabolic, but it may resemble the 2010 blow off top where it did go straight up, pulled back, and rallied up 1 more time. I drew that here. We’ll be watching this area too.
.
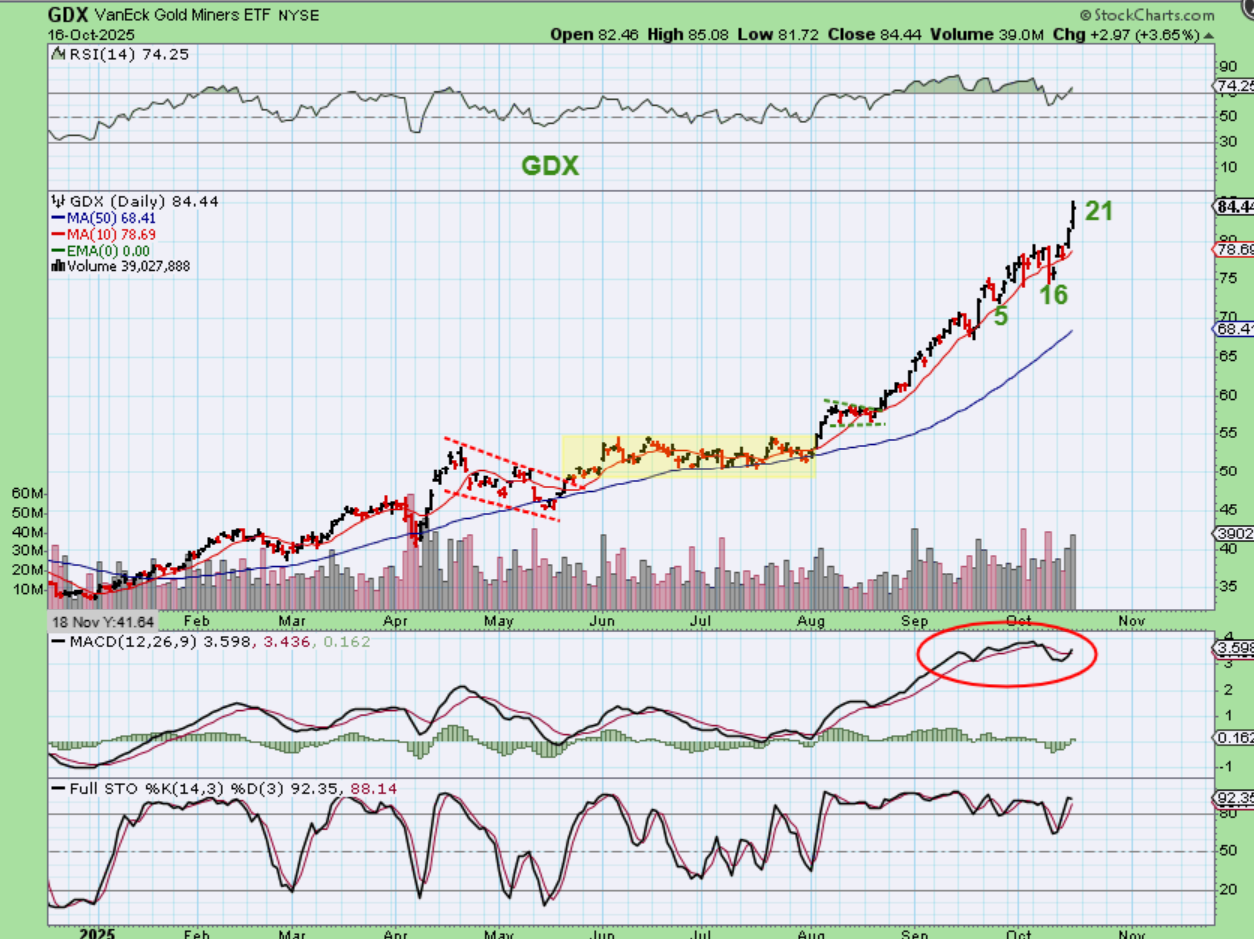
GDX popped on Wednesday and Thursday, giving it a new peak on day 21. This is R.T., so you would expect a dip and more strength to follow. We’ll see.
.
My opening picture is always put there for a reason. Why am I showing A man watching the distance, Bulls taking a rest, and a red sky in the background? Well, as stated in recent reports, things remain bullish, but the bulls will eventually need to take a rest.
1. I’m watching to see what happens in the General Markets, since we are due for an eventual drop into an ICL. Some of my stock picks that have rallied dropped sharply yesterday.
2. The Precious Metals (and Rare Earth, Uranium, etc) are on fire! If they go parabolic, however, they’ll need a good rest/consolidation soon. So far, soooo good though.
3. I have been saying for a while that with the Fed rate cut hope coming on Oct 29, we ‘MIGHT’ be seeing the old saying, ‘buy the rumor, sell the news’ playing out.
As time moves forward, closer to the Fed Mtg, We should be watching for signs of weakness or strength, and Bitcoin gave us a real sign of weakness overnight. I’ll discuss that below and the weekend report will cover it too. I want to say enjoy your Friday trading, but last Friday was the slam down, so I’m going to say, Stay Frosty my friends!
I am going out to breakfast with friends from 8a.m. to 10a.m., and will be back during morning trading. Enjoy your Friday and weekend!
.
~ALEX
.
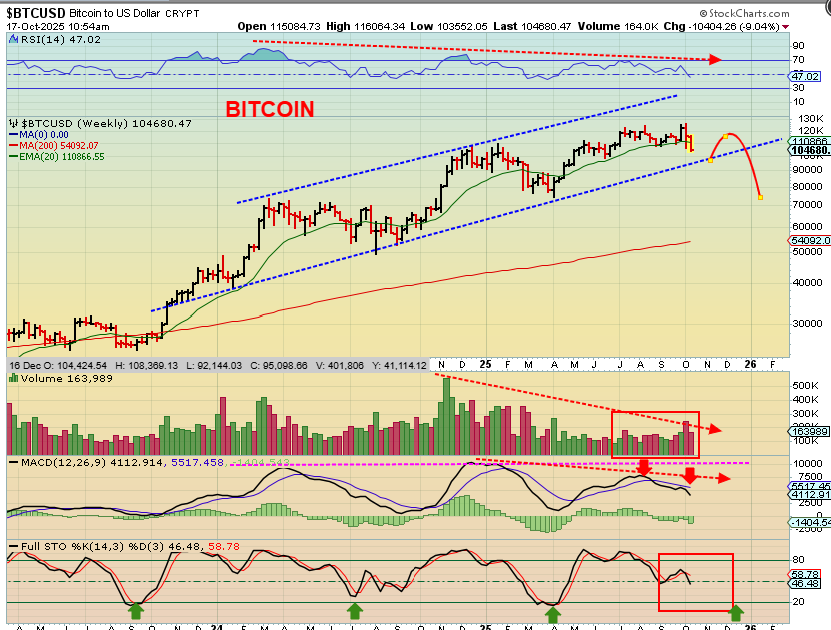
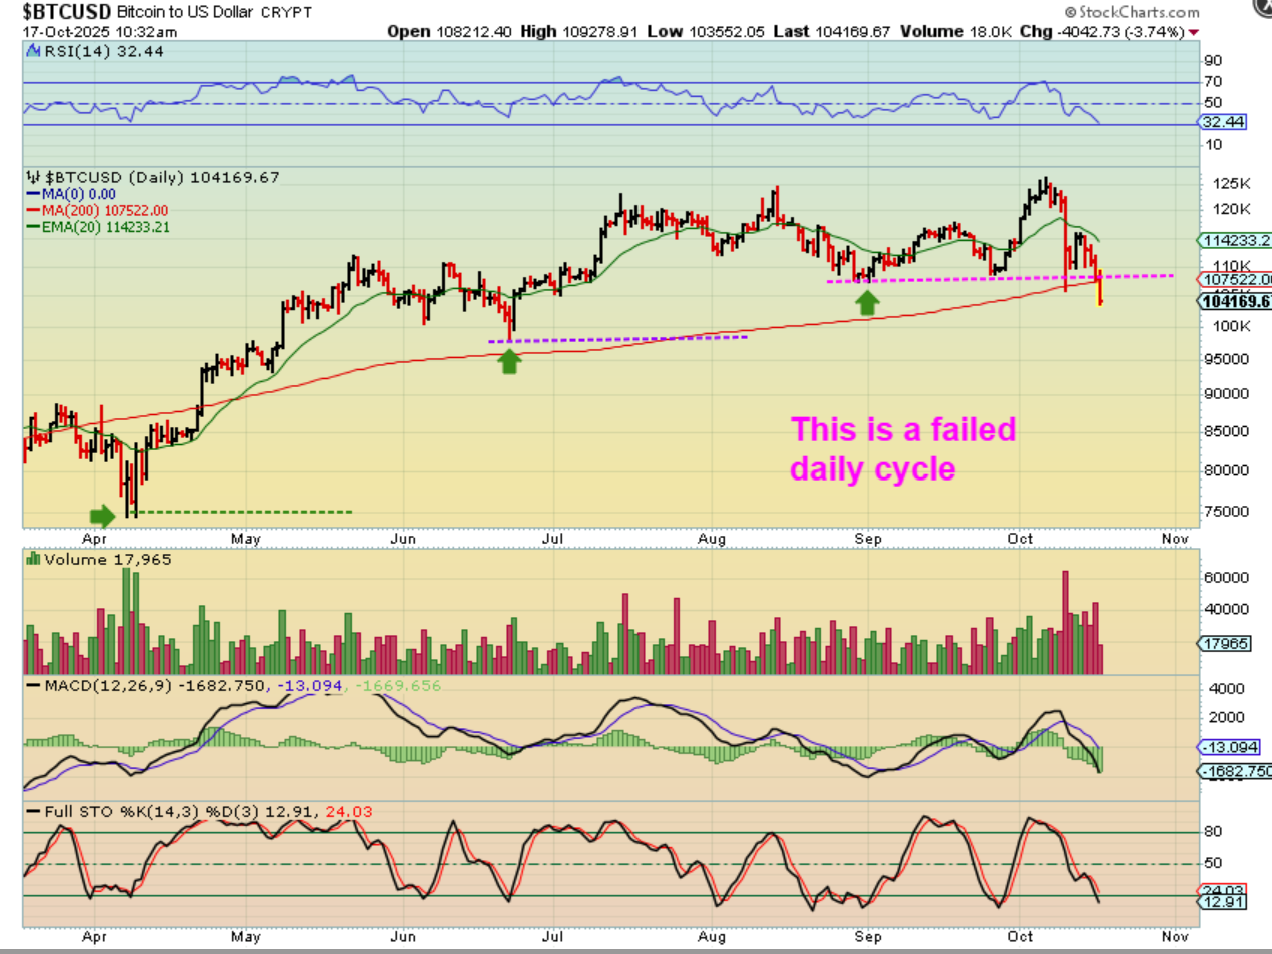
BITCOIN – The way I look at Bitcoin using cycles, this is a ‘failure’, because it broke the lows at the last green arrow (and it also broke the 200sma as a sidenote). $98,240 is the 2nd green arrow from the June low and it could even take that one out before this daily cycle is finished, unless we bounce first…
.
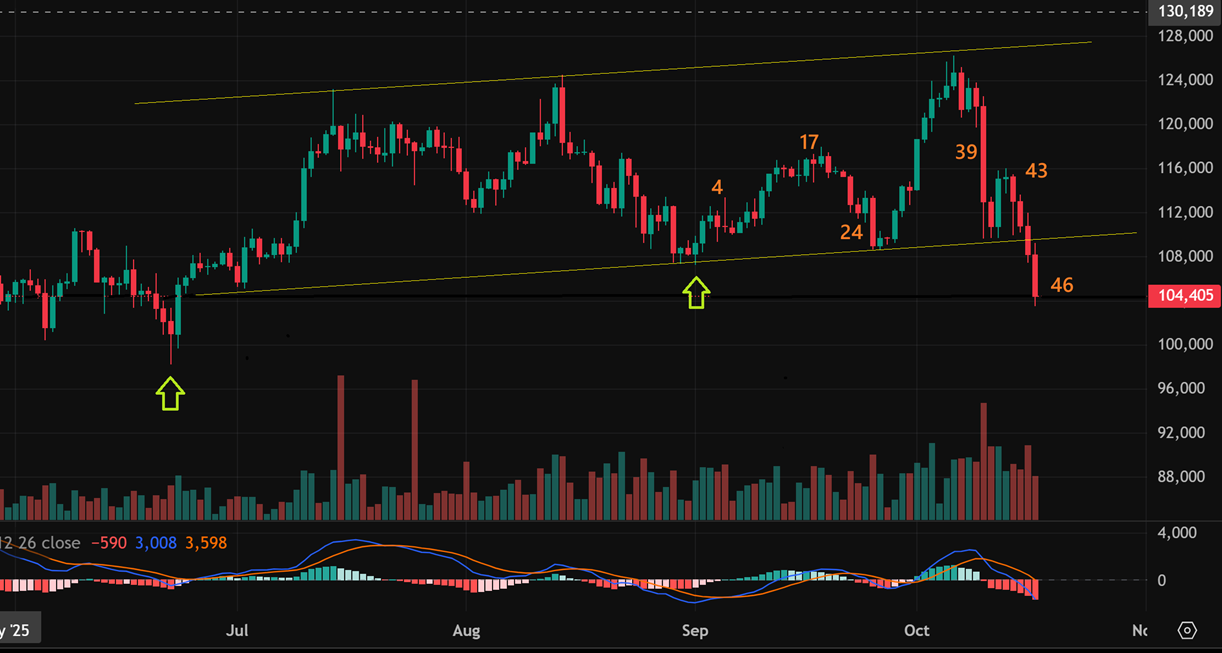
BITCOIN is on day 46 and since we look for the low to form around day 60, this looks like it will chop lower for the next 15 days or so. Again, that June low is $98, 240 and we know that Bitcoin could EASILY fall $6,165 over the next 15 days.
.
BITCOIN can bounce now and then drop into the day 60 period and bounce again, or it can just continue lower (choppy) and then bounce at day 60, but the next daily cycle should continue to show the weakness that I have been seeing in the weekly charts. IN THE WEEKEND REPORTS using weekly charts…
1. Do you remember when I said “I wish we had stronger volume on this last climb? It never came in strong on the upswing.
2. Do you recall when I showed weekly divergence in the MACD & RSI at the last high? That never strengthened in the MACD and RSI.
3. Do you recall when I said that we are in the 3rd year of a 4 year cycle and I see weakness? I was still hoping for 1 more run to the upper blue line, the $150,000 area. Now that hope is fading. We will have 1 more chance after this day 60 low is in place. I’ll discuss that in the weekend report.