.
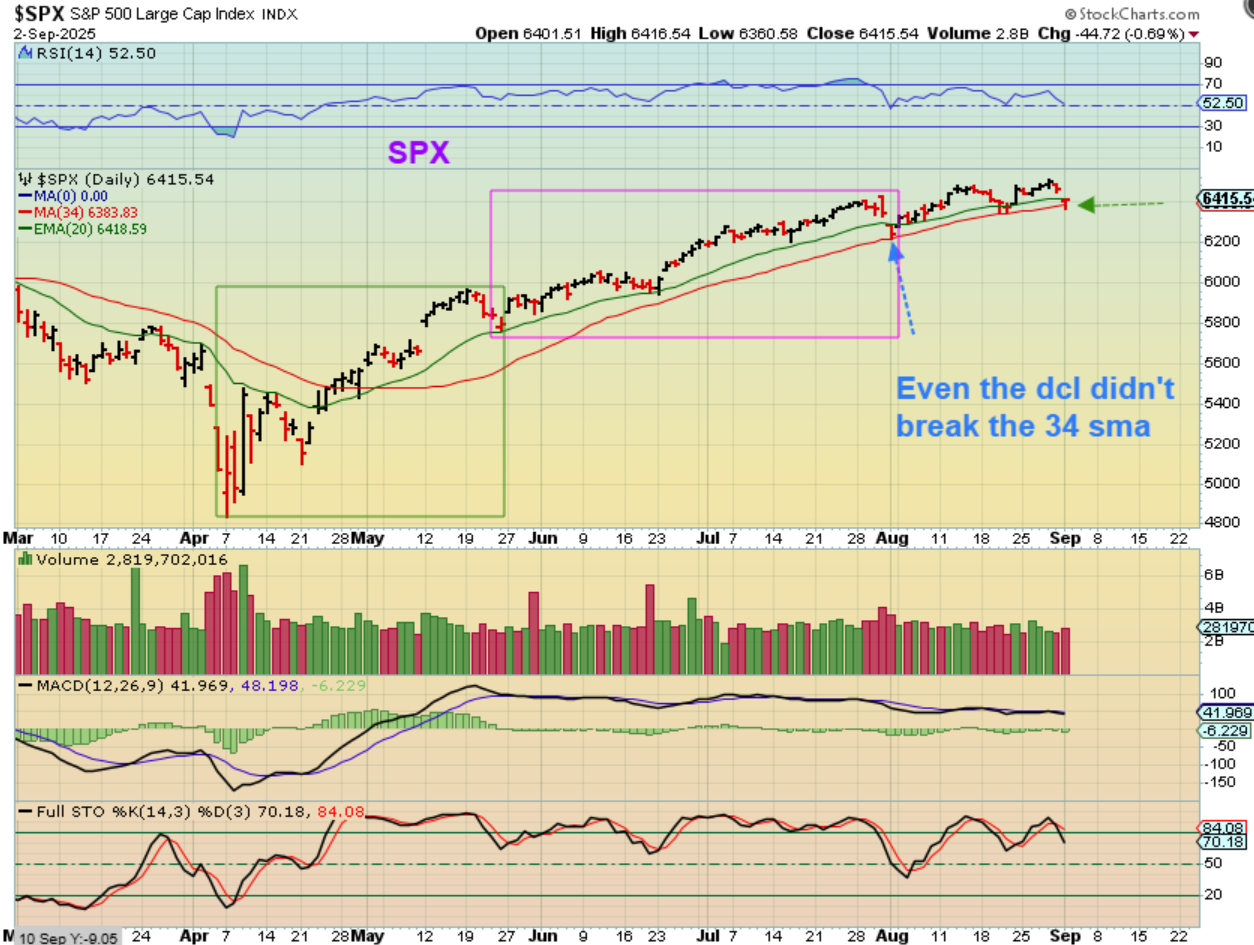
I’m still not quite sure why the markets gapped down, I didn’t see any big news, but they dropped and they started to recover into the end of the day. So The SPX has a reversal at the 34 sma. Please read the chart.
.
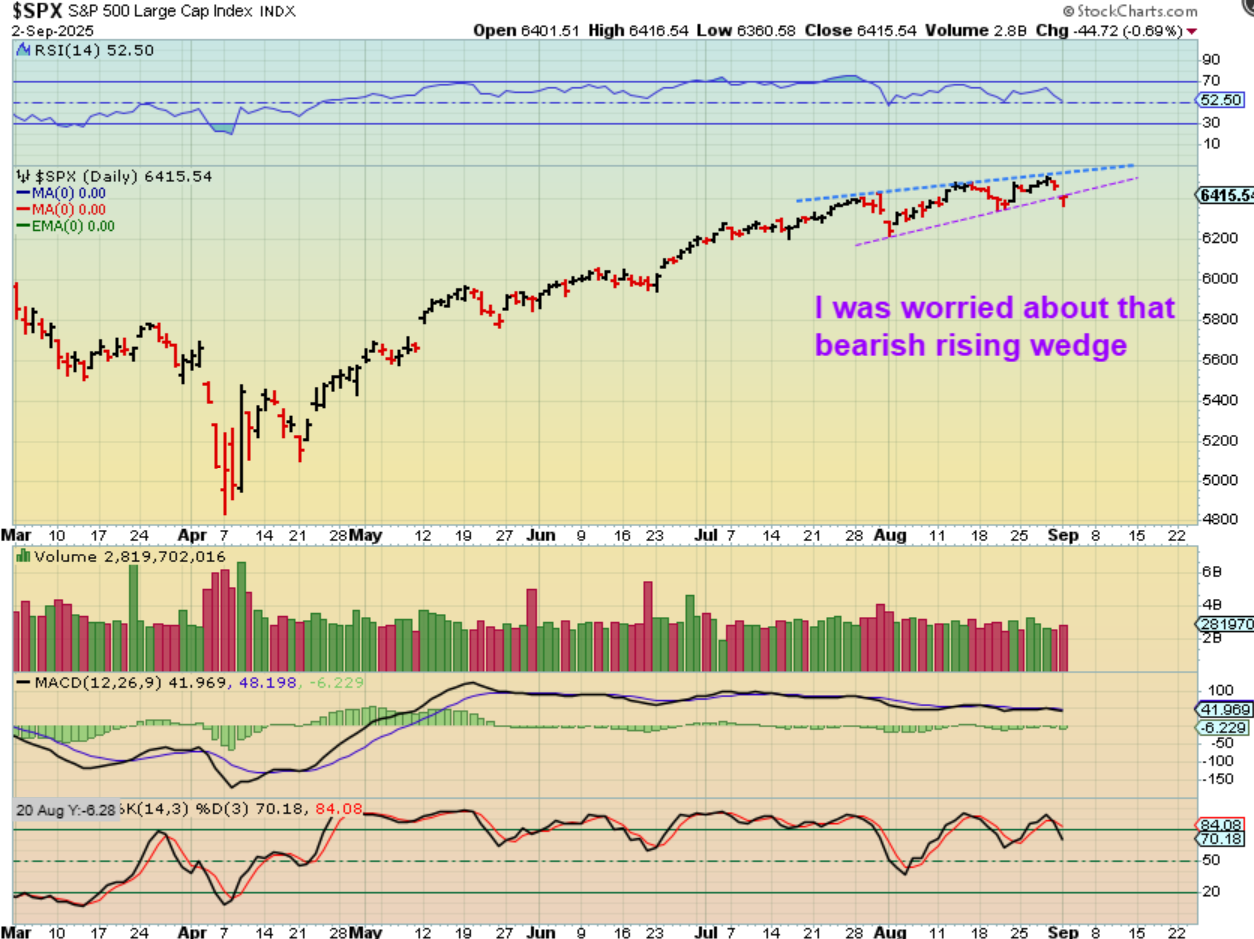
SPX -I was a bit worried about the bearish rising wedge, see the chart. I think that we may be alright now. I’ll show you why…
.
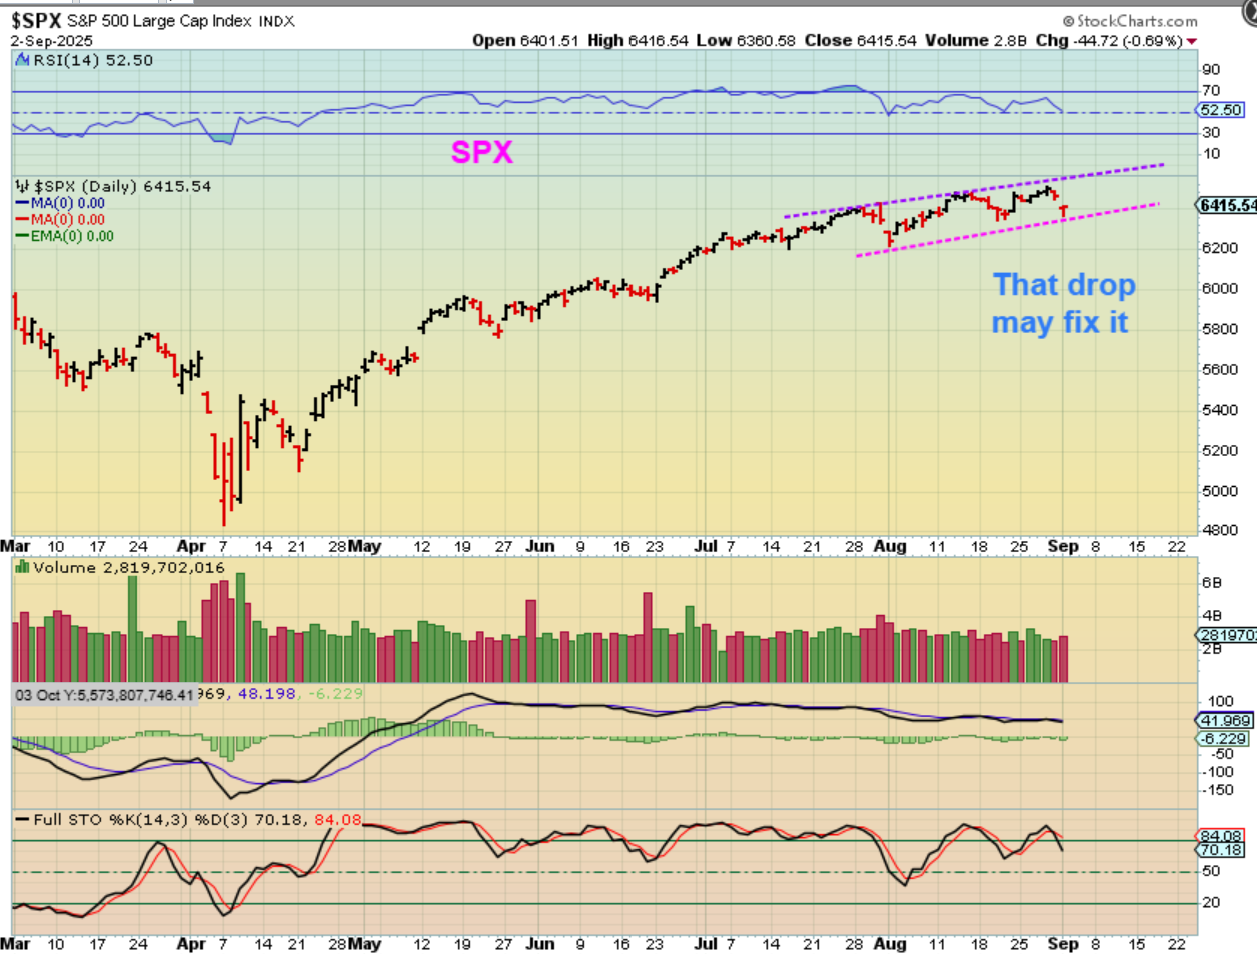
SPX – Tuesdays drop may have simply set up the lower trendline to be parallel and we can continue to chop higher. This is the 3rd daily cycle, however. We are seeing a little more choppiness, but it really doesn’t seem to be anything to worry about at this point.
.
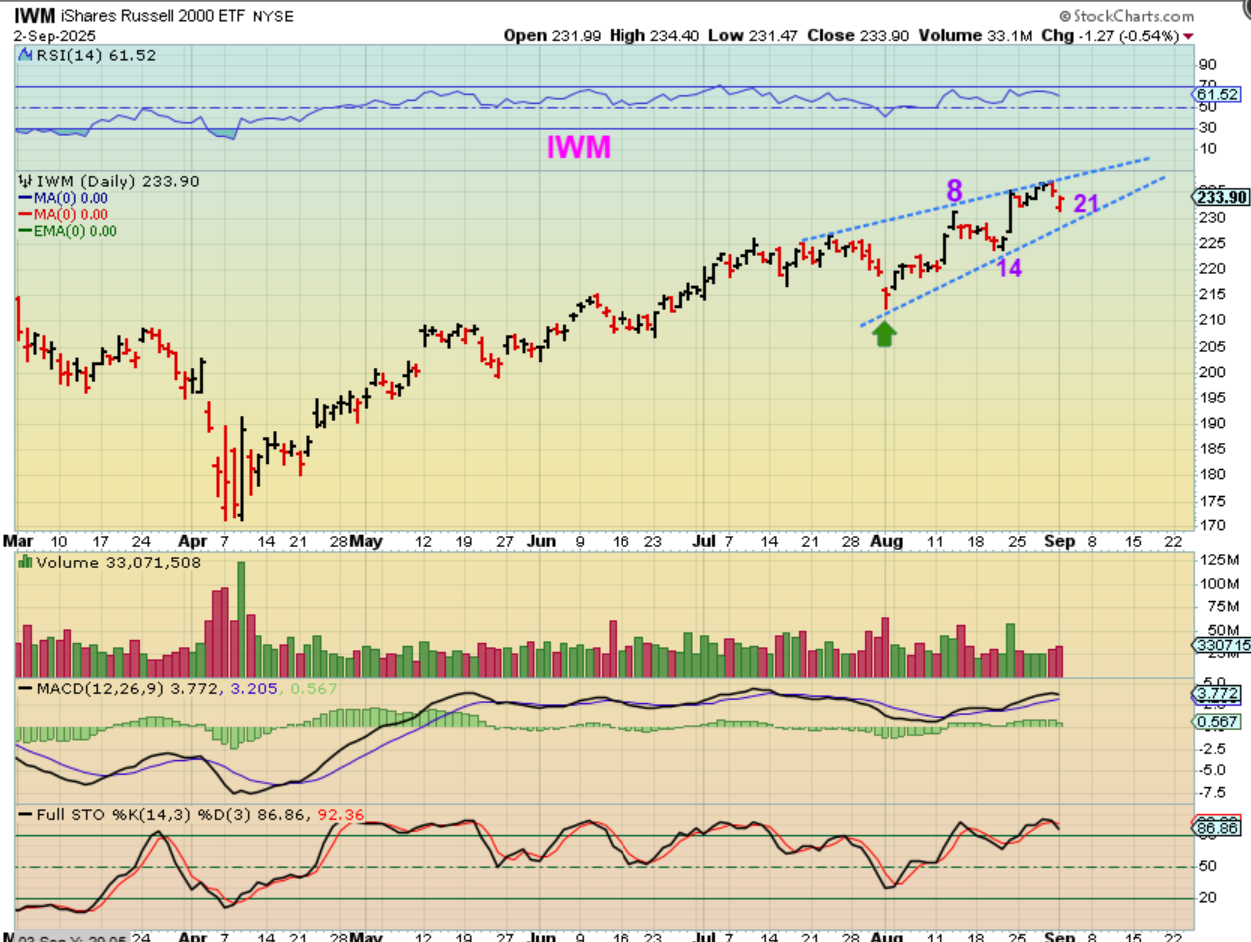
I do see a rising bearish wedge now forming in the IWM though, but on day 21 we could still rally higher and drop into a dcl later. It could also break right through the upper trendline and negate the wedge.
.
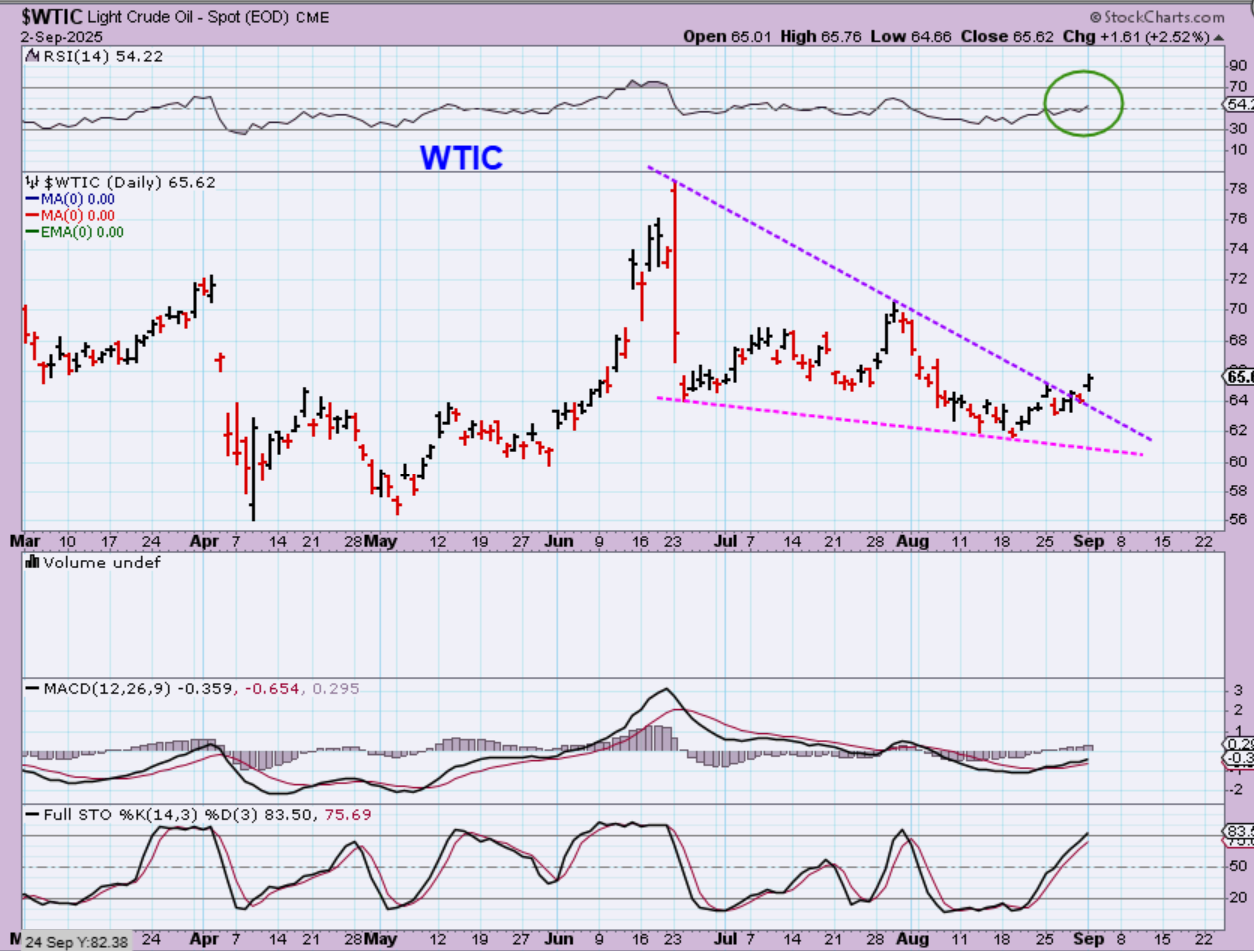
WTIC – Oil stocks were showing us bullishness, and Oil was lagging. Now it has broken through the downtrend line of what could be viewed as a large bullish descending wedge.
.
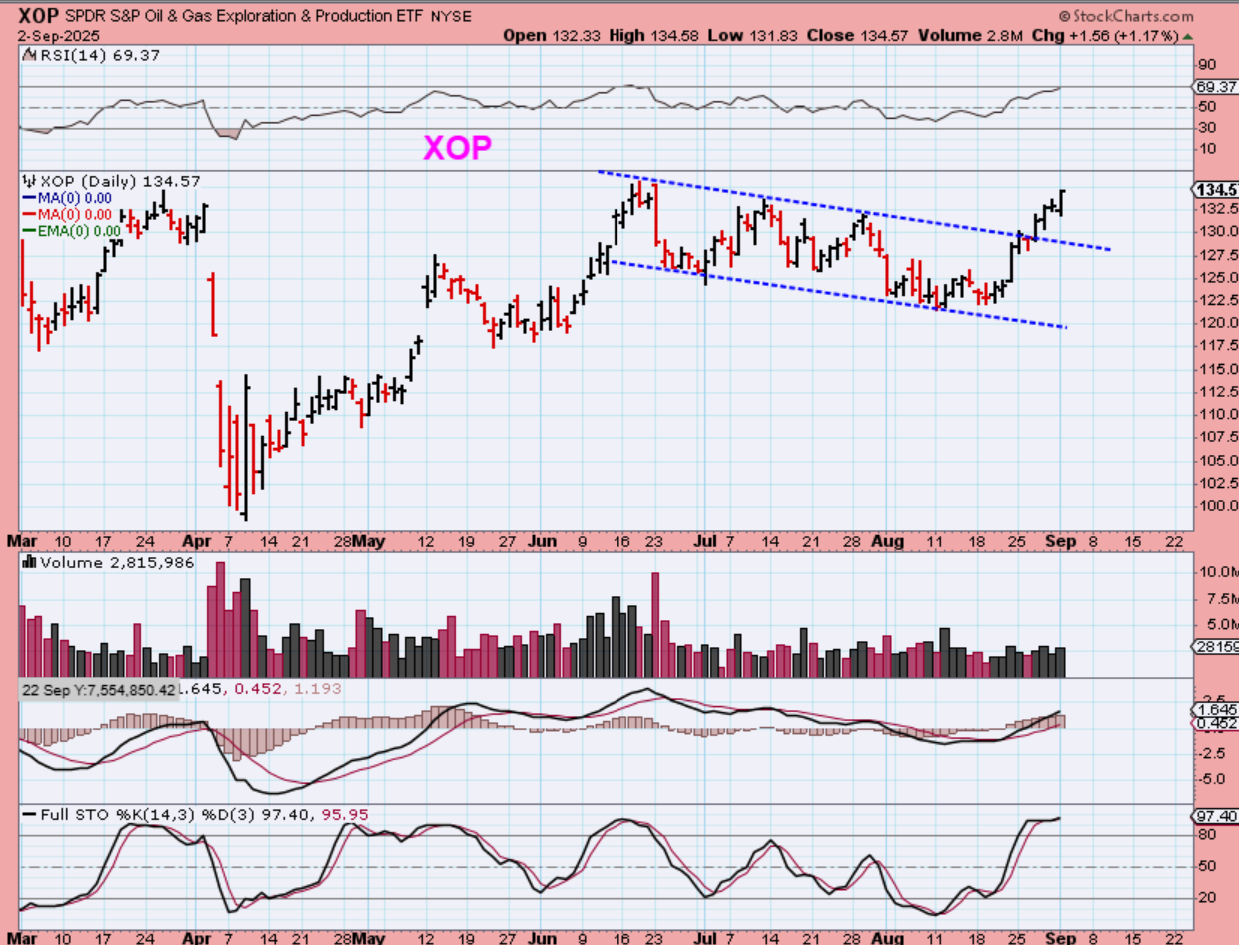
XOP – And the OIL stocks are now climbing at a steady pace. I just want to mention that many Gold Miners are doing this kind of a climb too, and if Bitcoin breaks out, I think that Crypto Miners will run steadily higher like this too. Let me show you what I mean…
.
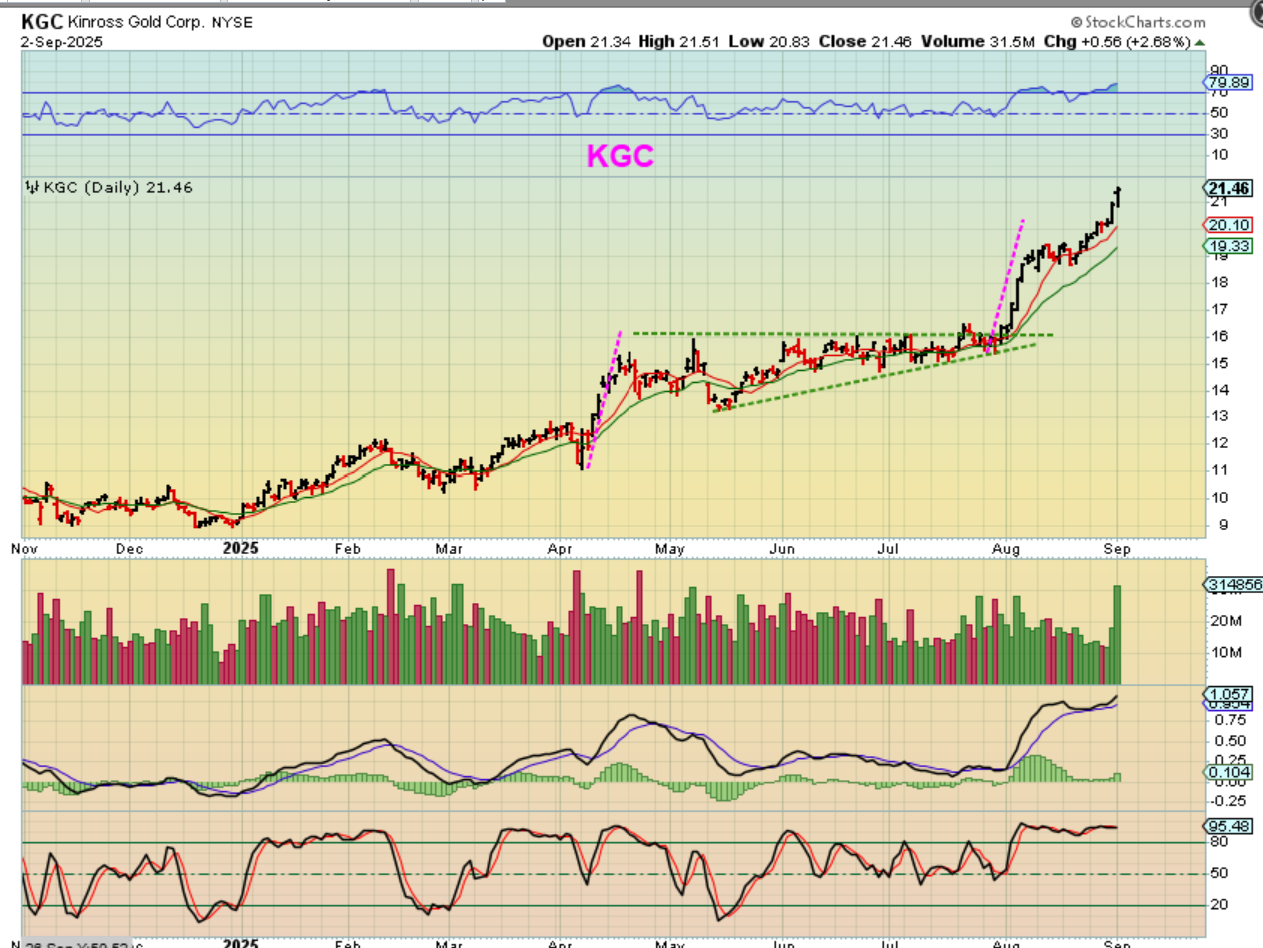
Let me show you what I mean by a steady climb….with KGC.
Once it broke out, it just took off upside, even though Gold was stuck inside of a triangle. We could see this with other Miners, Oil Stocks, and Crypto stocks if the buyers continue to grab the dips like they have been.
.
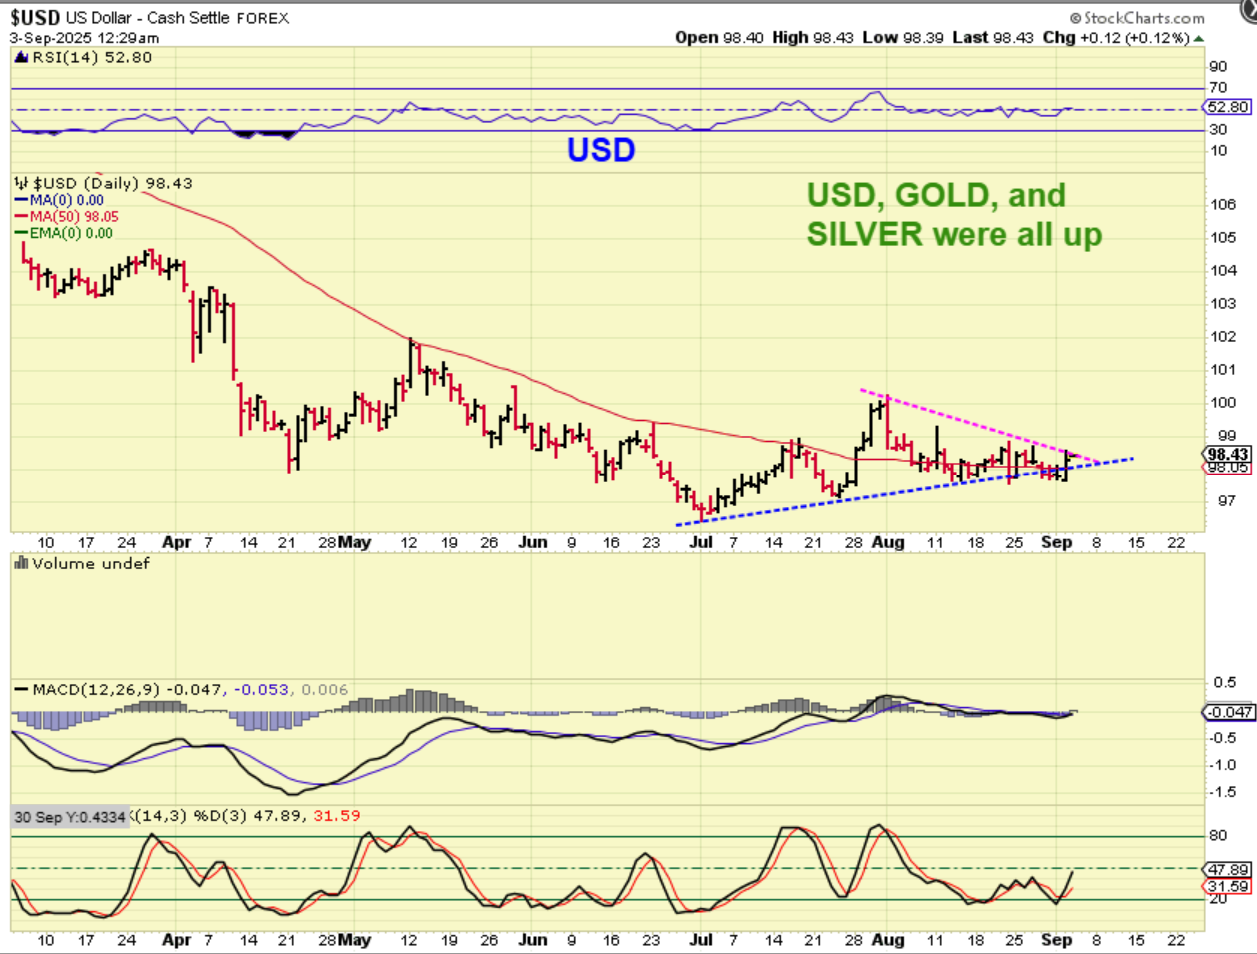
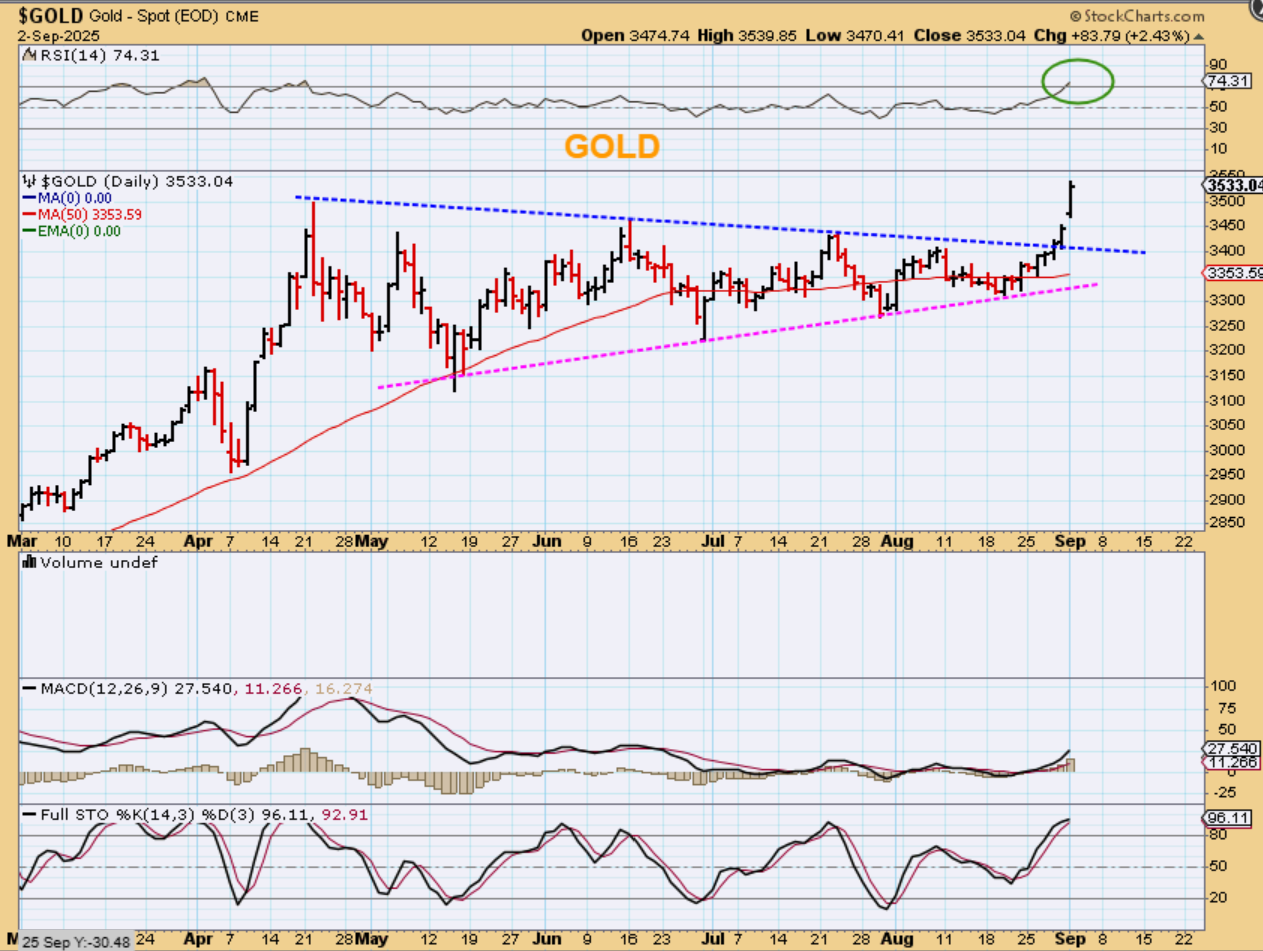
THE USD popped higher on Tuesday, but it’s important to note that Gold and Silver did too.
.
GOLD broke out on Friday and followed through on Monday and Tuesday. A break from a triangle consolidation can lead to a continuation higher.
.
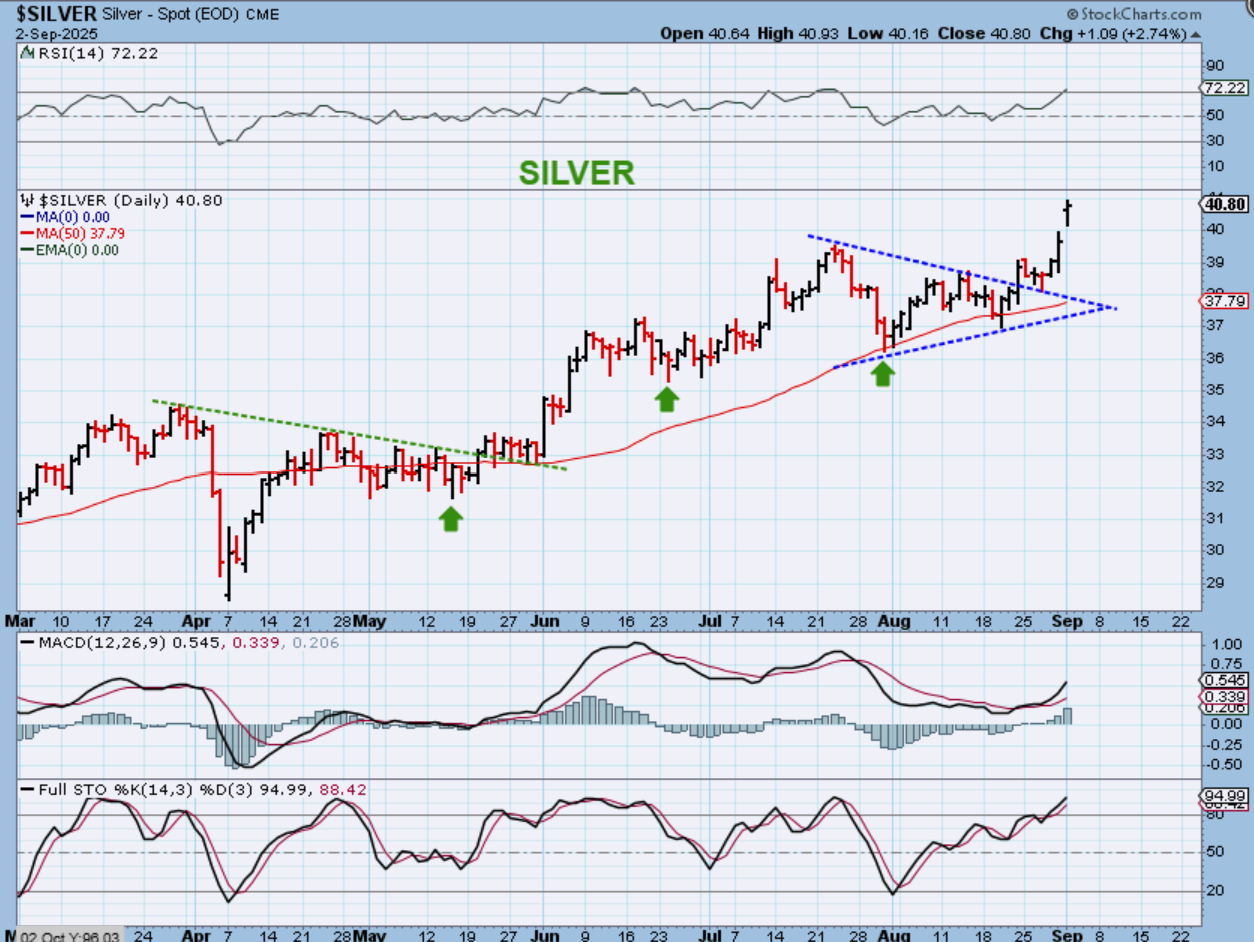
SILVER is very strong, especially considering that this would be the 4th daily cycle and its also day 22. In technical analysis, this was a buy at the 50sma and a break of the triangle. We discussed the breakout and back test of that triangle last week and Silver just continues to move higher.
.
In a bull market where ‘surprises come to the upside’, we could see this kind of action continue. It is a 4th daily cycle, but it could be 4 of 6 or MAYBE the Triangle is enough of a low to be an ICL (That is hard to believe, but this is a bullish breakout, so we have to wait and see how the buyers treat it).
.
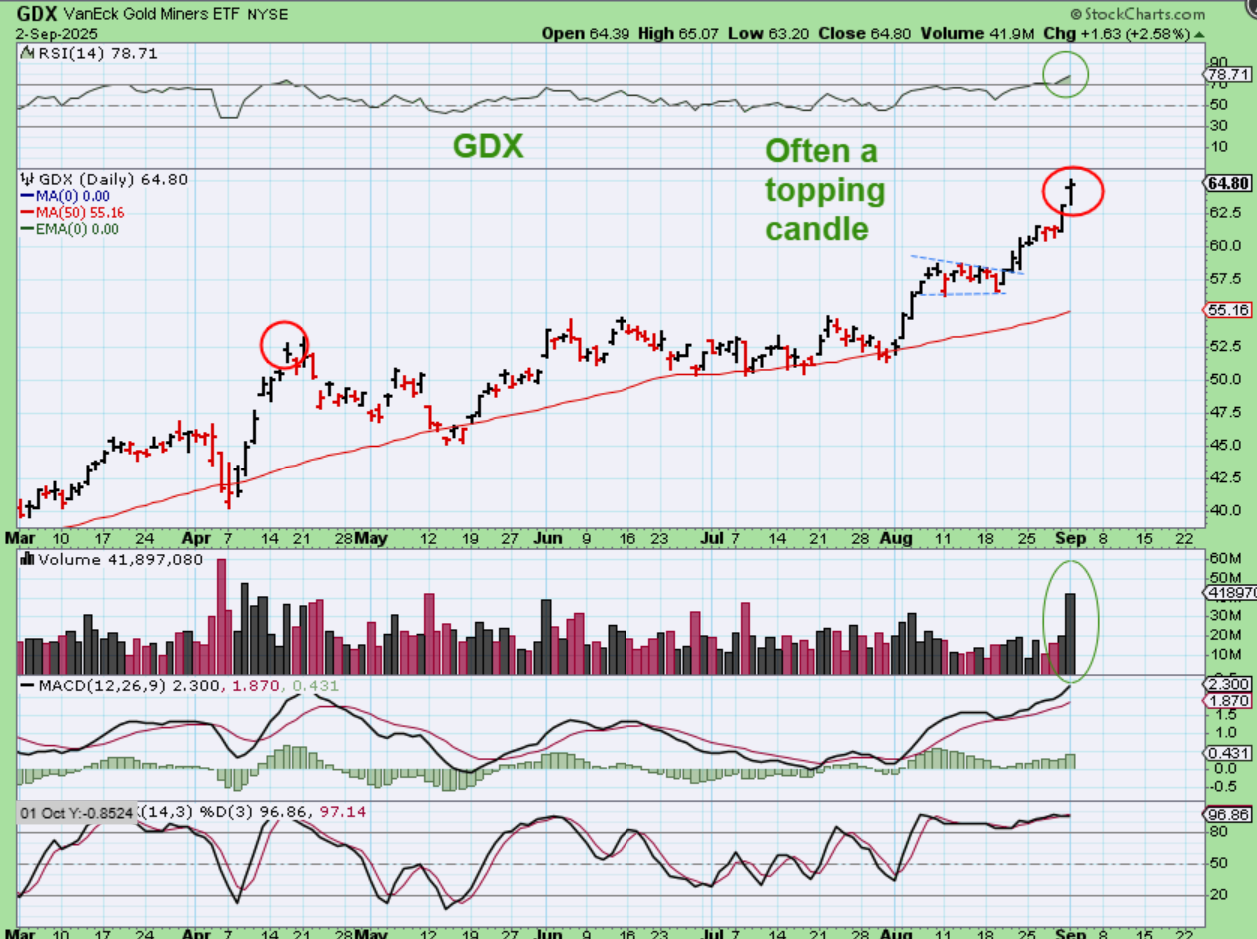
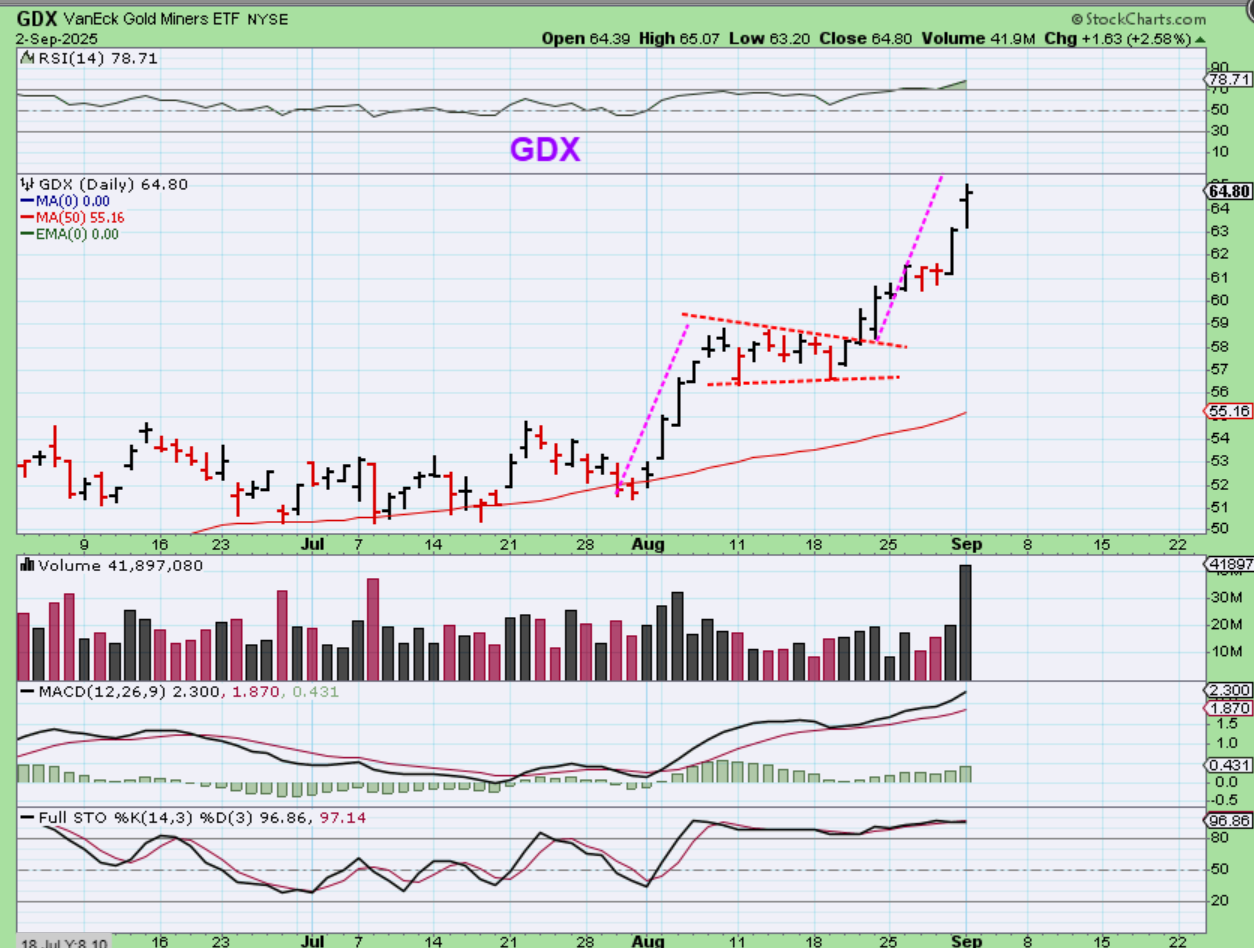
GDX – And Miners have been rocketing higher even when Gold was in the triangle. Miners have been a ‘buy & hold’ while raising stops, but they were very choppy and boring heading into July-August.
.
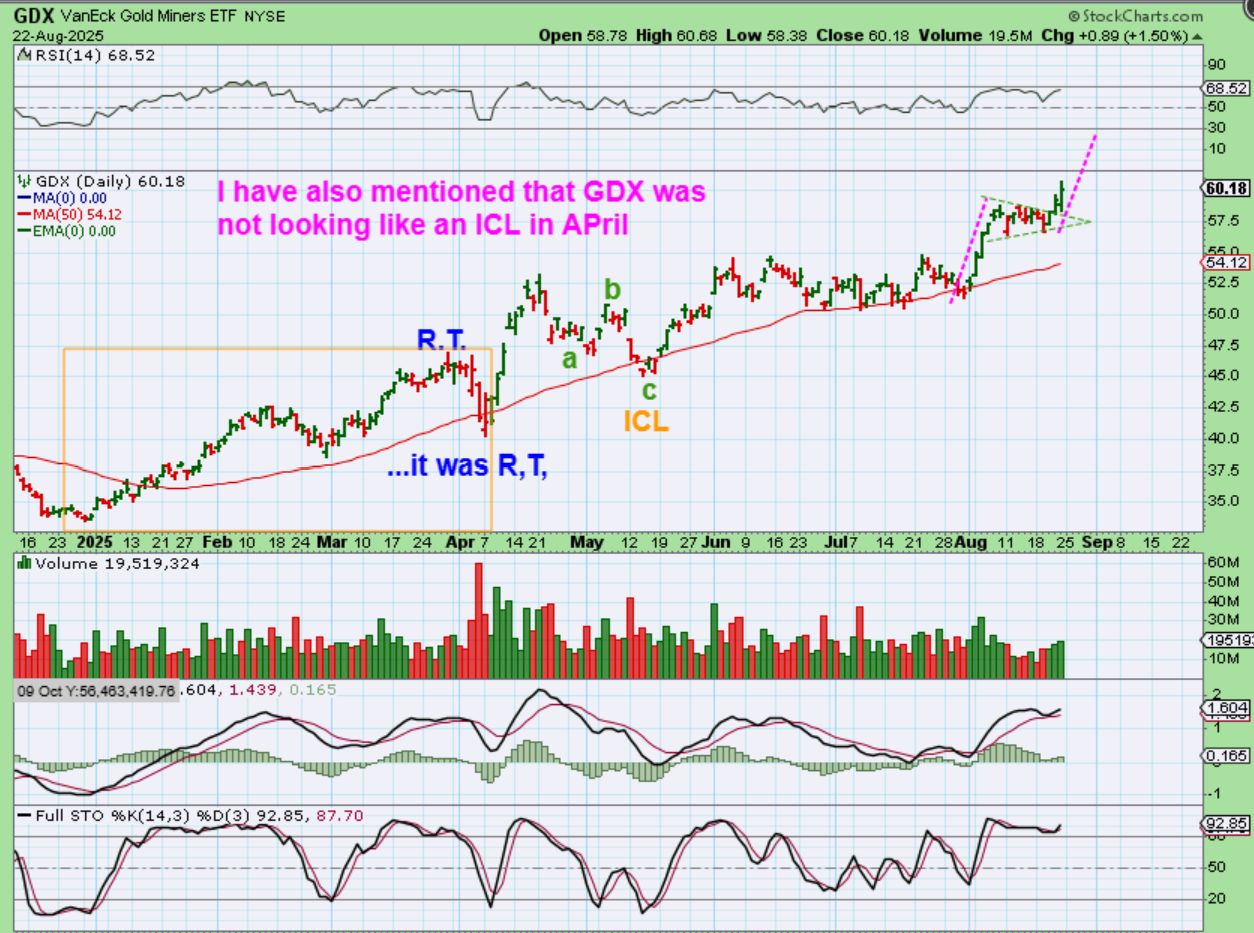
GDX broke out and I showed that it had an ICL in May and now a measured could take place. It seemed like this was too high, right?
.
GDX has actually reached the measured target, even when I start the 2nd leg on TOP of the tringle rather than inside of the apex. That MIGHT be a high volume topping candle, but it’s hard to know since Gold broke out of that triangle. This can keep running.
.
Some of these bullish set ups are running swiftly, and I showed that with that KGC chart. There are others and in precious metals, a lot of the smaller 5 letter explorers have been finding buyers too, so those that bought and hold that part of the sector are enjoying an additional push higher. Crypto may be ready to run and the General Markets can continue higher too. Enjoy your Wednesday trading!!
.
~ALEX
.
THE CYCLE COUNT WAS IN THE WEEKEND REPORT WITH THIS CHART:
.
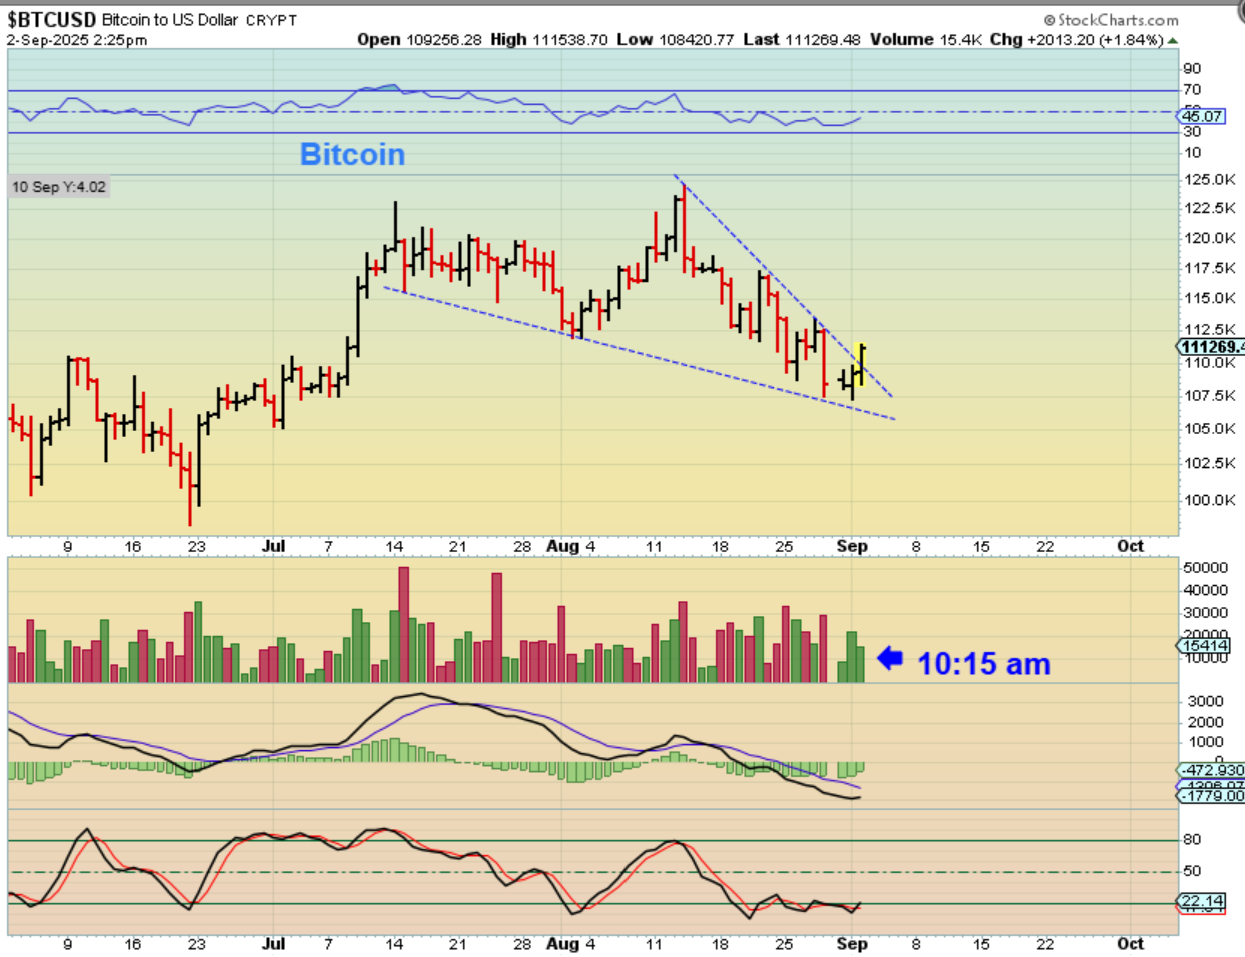
BITCOIN DAILY -A new low formed on Saturday, so that gives us Day 69, of what is usually a 60 day – daily cycle. Normally I would say that this must be failing, and it must be showing real weakness, but some crypto stocks are NOT dropping in August with Bitcoin.
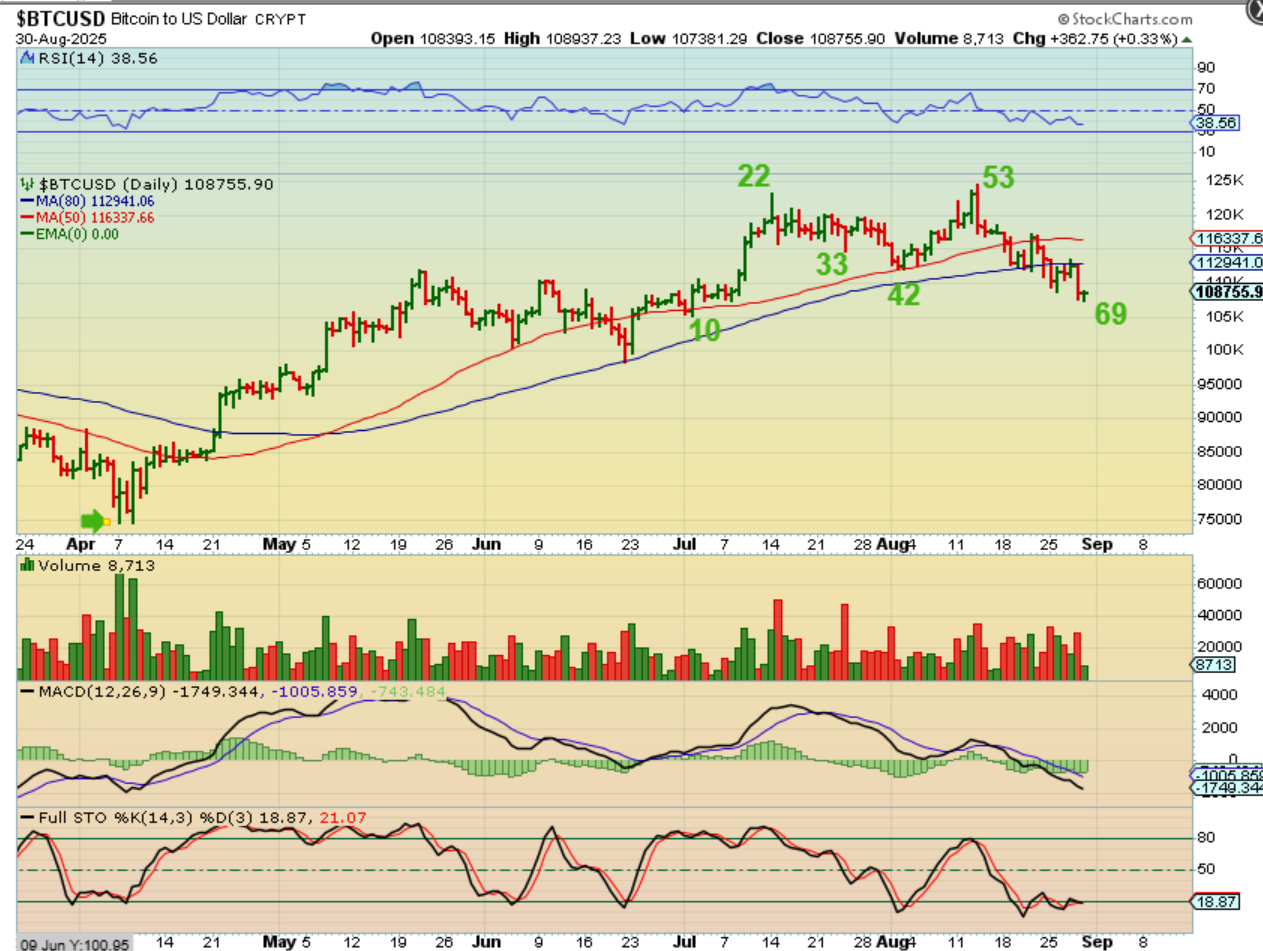
BITCOIN was on day 70 when it put in a low & reversed higher. On Tuesday it started breaking out, so I pointed this out along with the crypto stocks, which have been bullish as Bitcoin dropped.
.
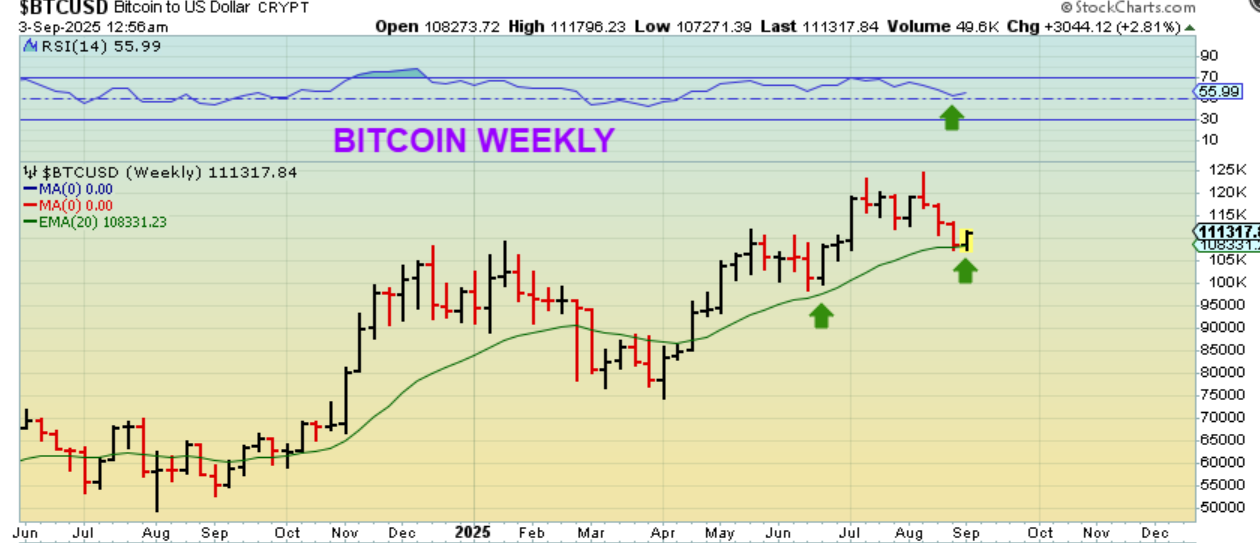
The WEEKLY CHART OF BITCOIN now shows a reversal at the 20 week ma.
.
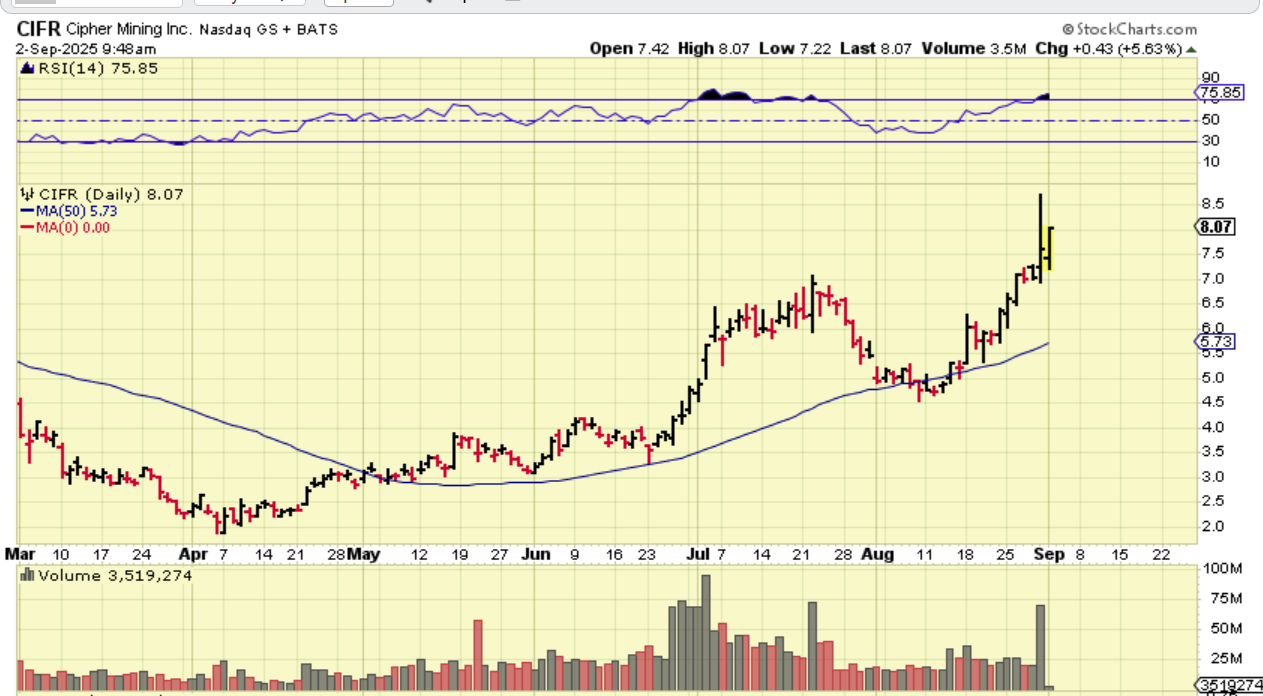
CIFR actually dropped at the open and then started to run higher so I posted this chart of it up 5% in the first 20 minutes.
.
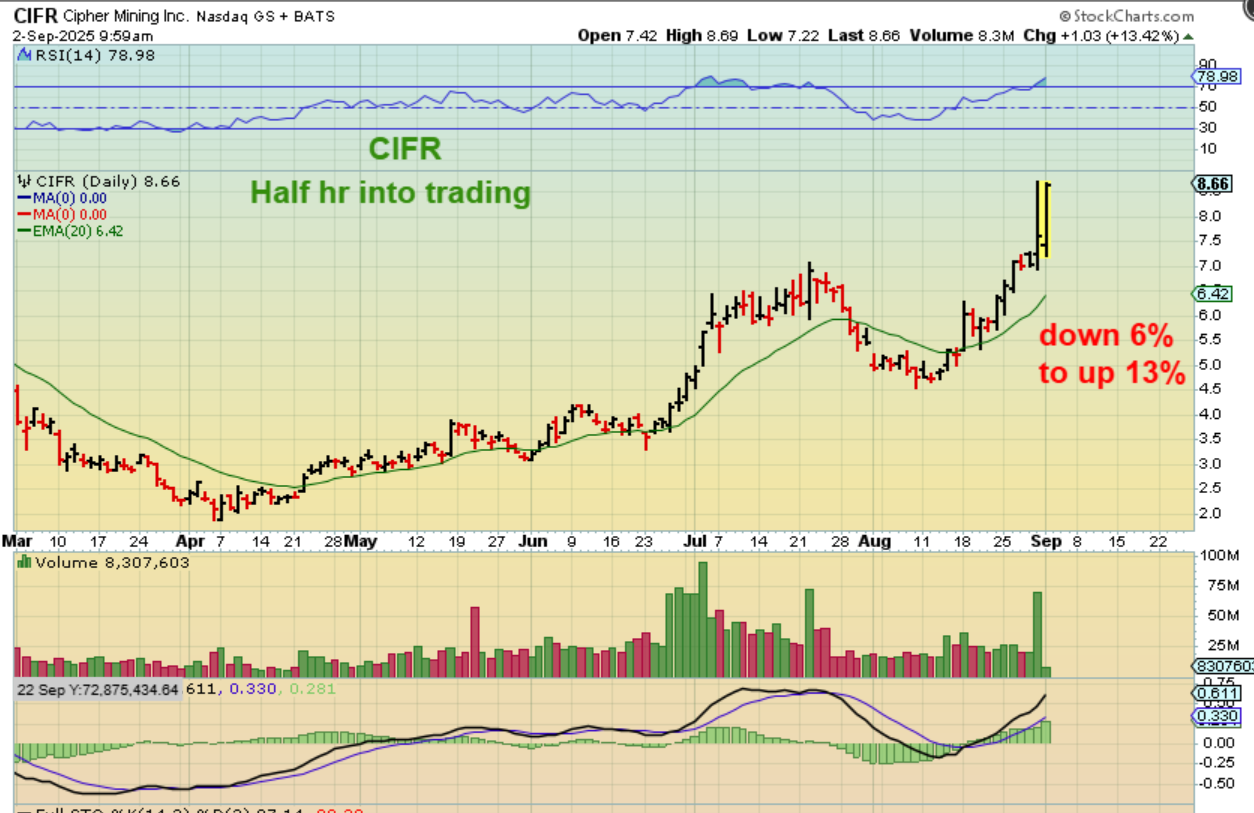
CIFR then continued higher and was up 13% in the first half hour. As mentioned before and in the past reports, CIFR, IREN, WULF, HUT, etc were acting bullishly as Bitcoin dropped.
.
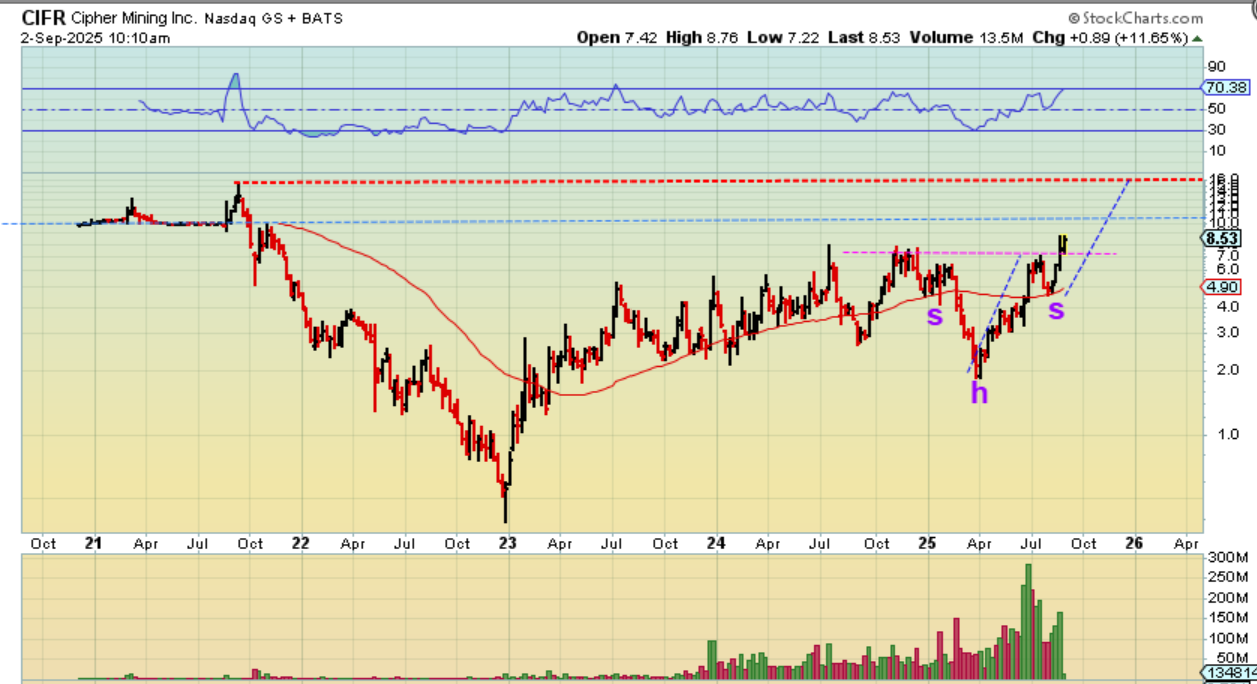
I was asked for a possible price target for CIFR. When they start to run, it may not have an obvious target, but the weekly chart is interesting. If this is an inverse H&S breaking out, it can run to former highs over time.
.
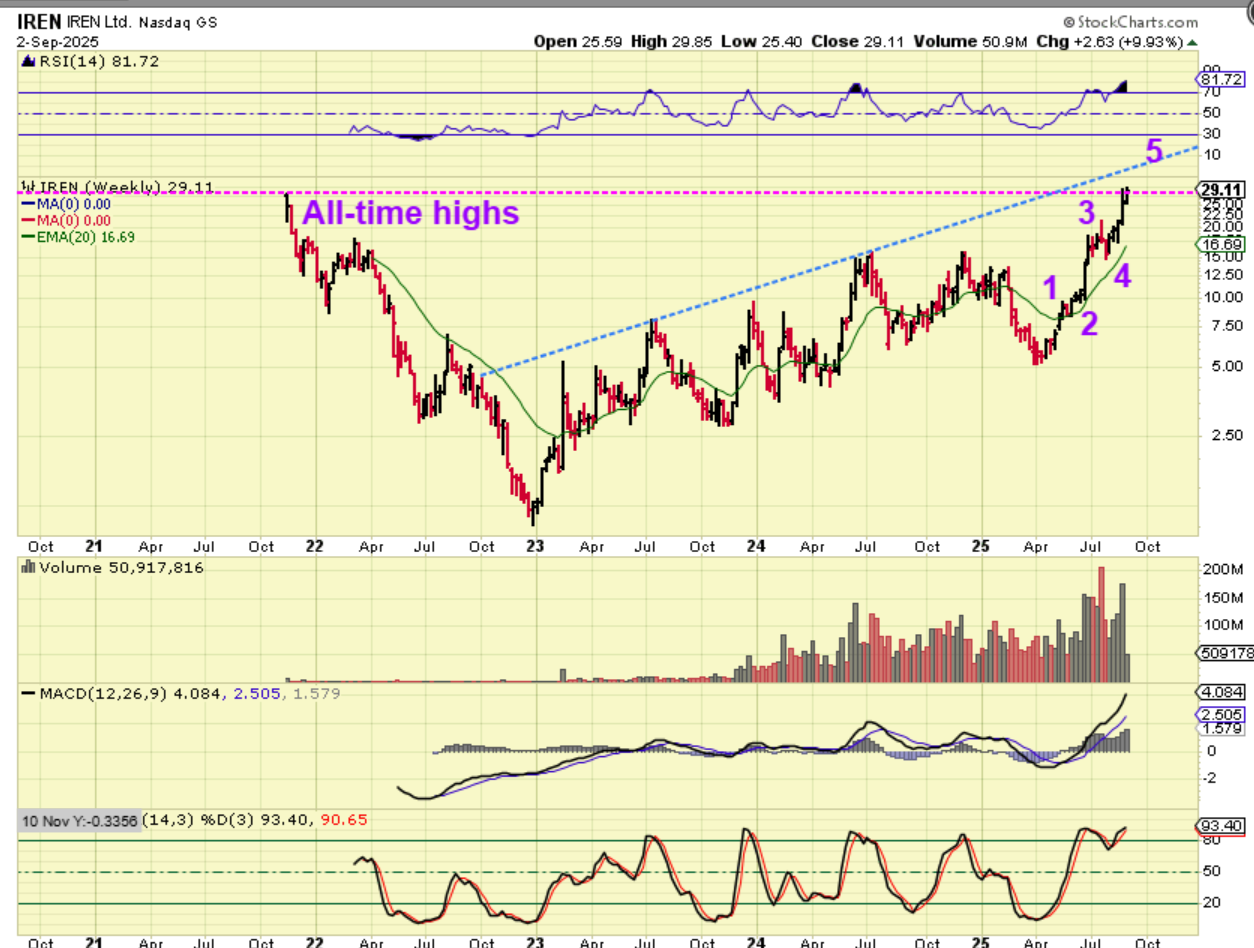
IREN broke to new all-time highs on Tuesday. With no resistance to the left, Iren can have less sellers and could run swiftly higher if Bitcoin takes off. It is a bit overbought on the RSI & Stochastics, but it can stay that way.
.
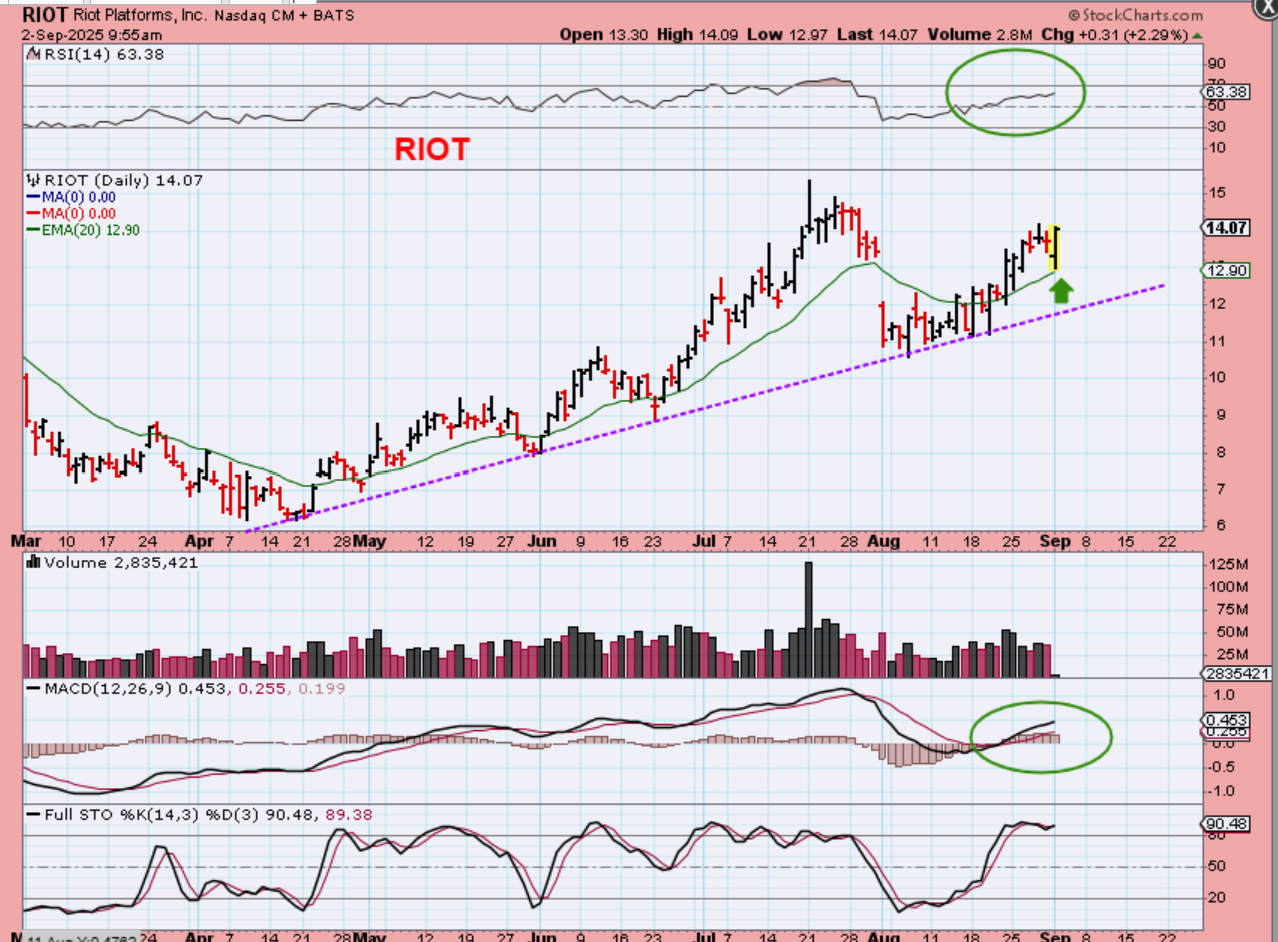
RIOT dropped and started to recover on Tuesday too. It has been doing that a lot lately, and it has been doing that as Bitcoin sold off into the recent low. That makes me think that this will do well if Bitcoin is ready to run higher.
.
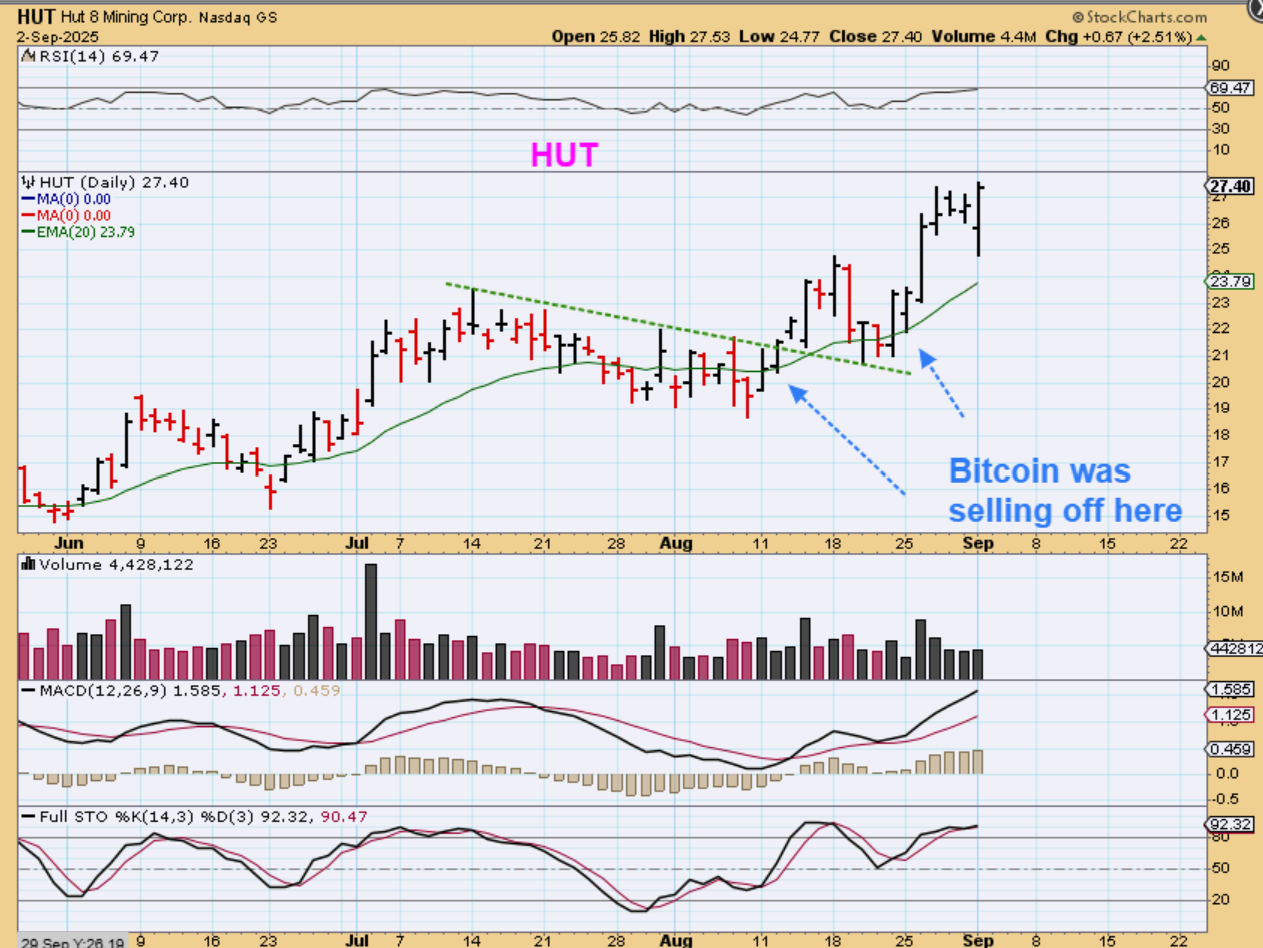
HUT has also been strong while Bitcoin sold off. It also sold off deeply on Tuesday and recovered.
.
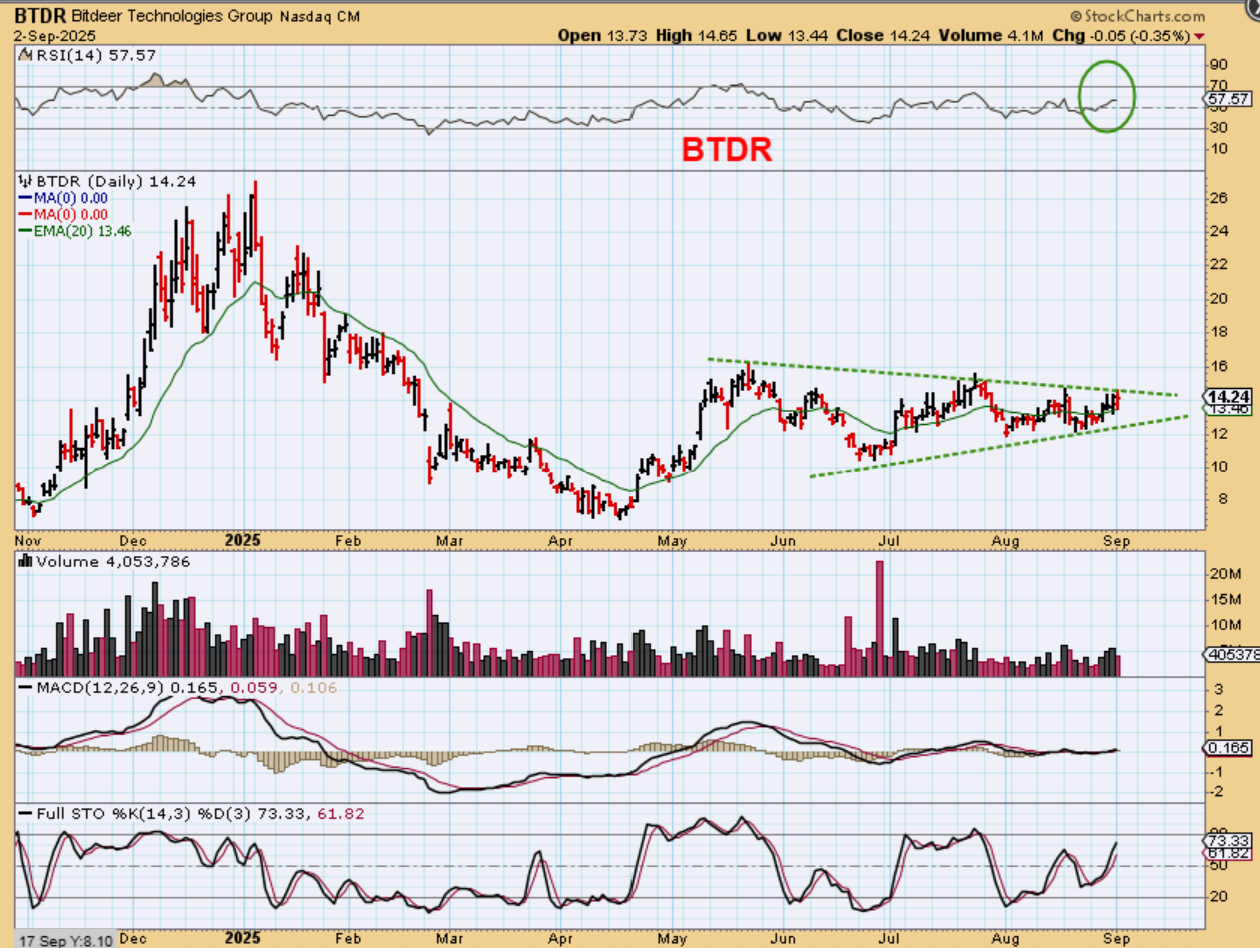
BTDR we have also discussed this bullish triangle for BTDR that formed as bitcoin sold off day after day.
August 30 WEEKEND REVIEW 
 Thursday September 4th – Buy The Dips
Scroll to top