September 27th Weekend Review
FROM FRIDAYS REPORT: Friday is day 39 (or day 1?)…
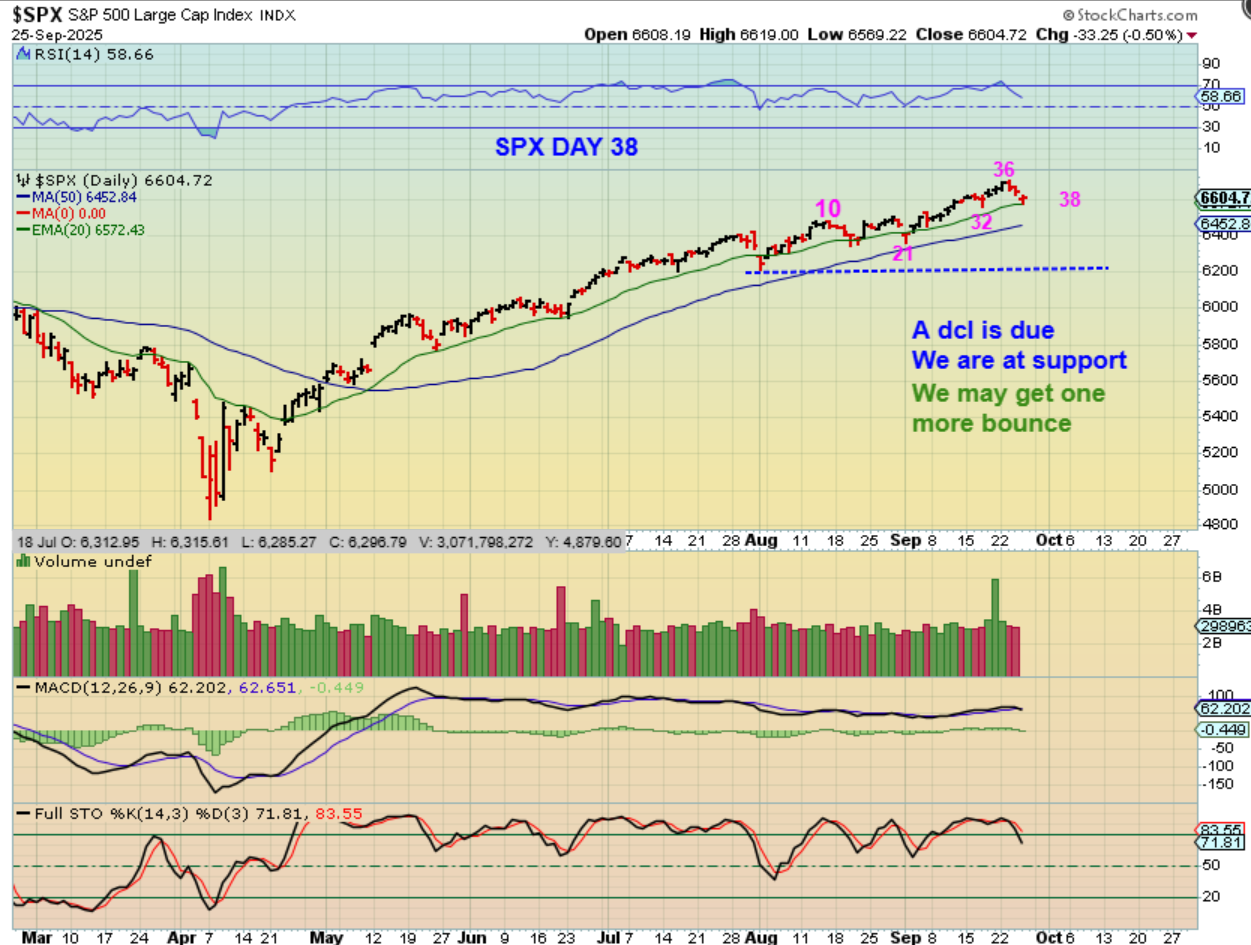
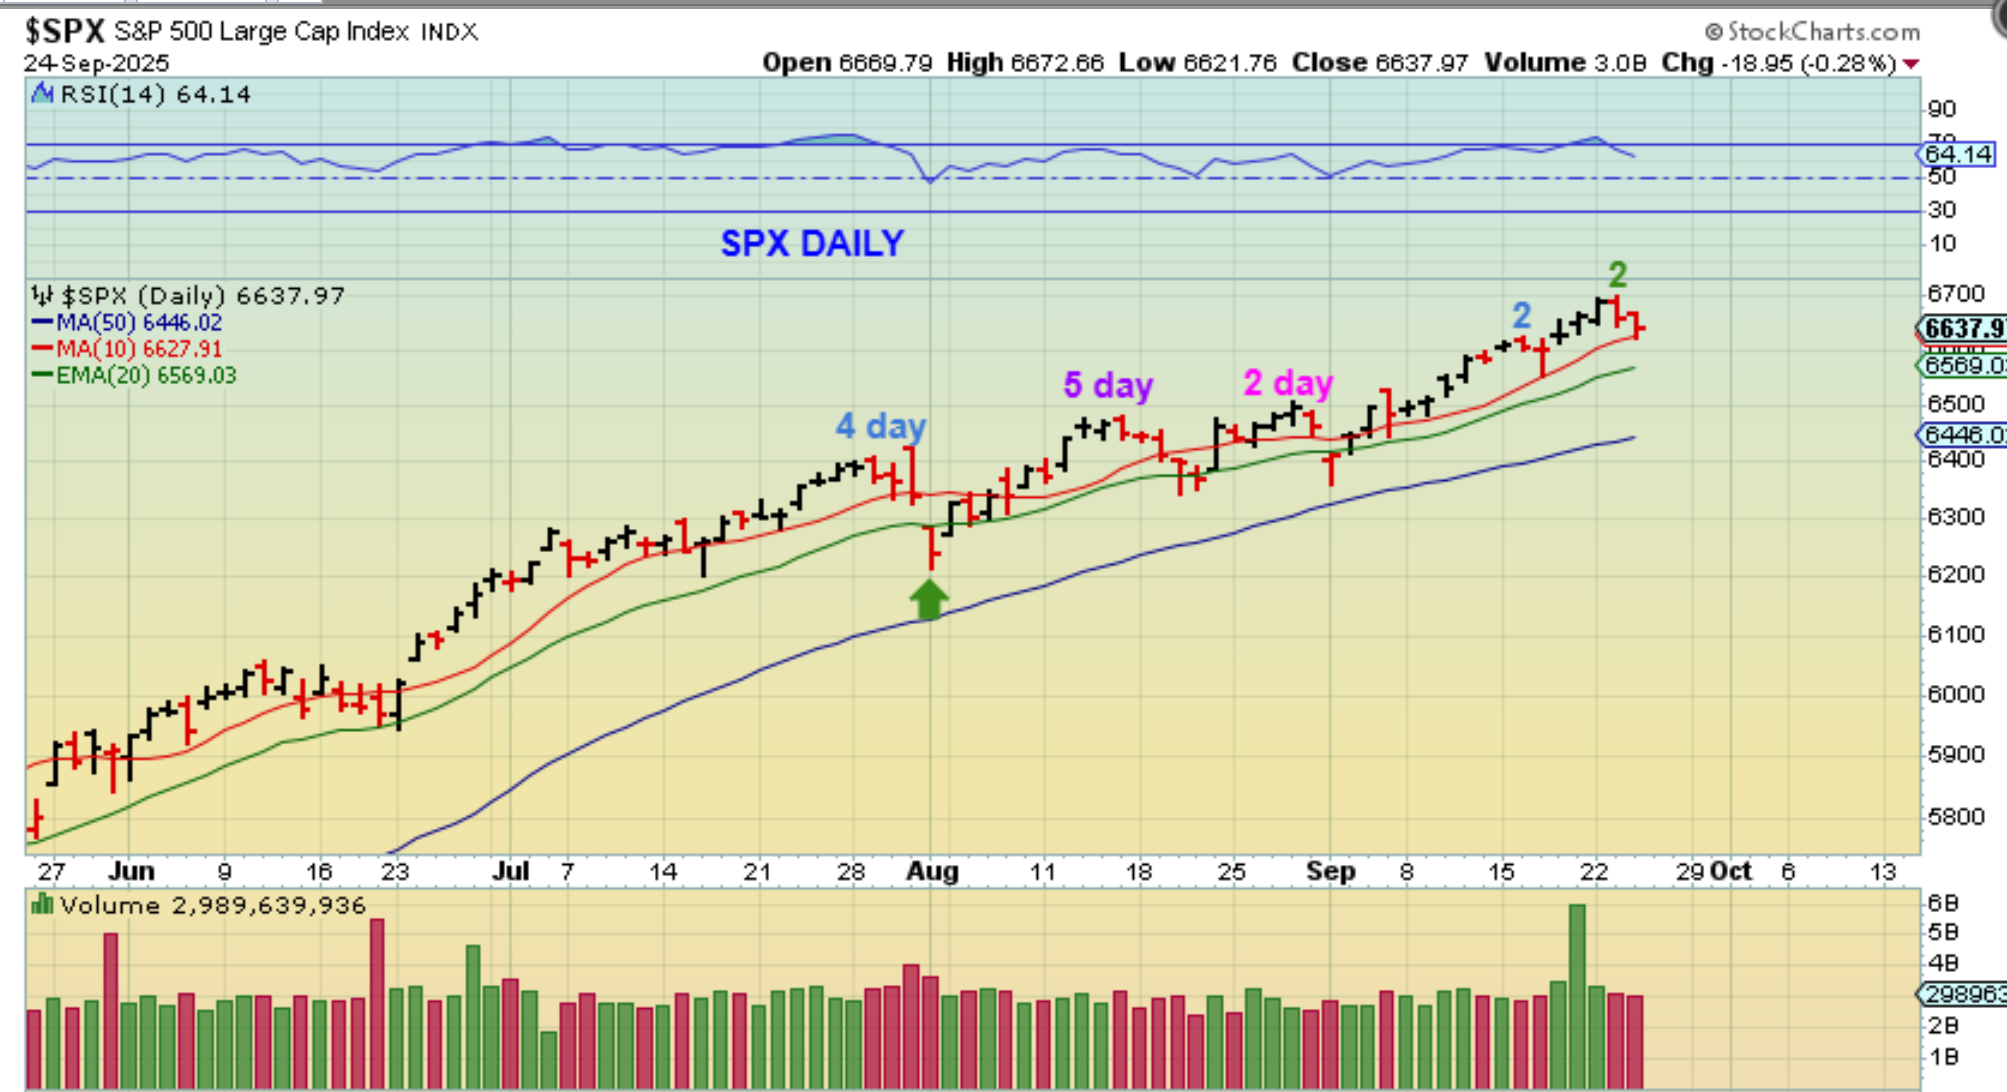
THE SPX landed on the 20 ema and started to reverse higher. At day 38, one more push higher is within the timing for a 50 day daily cycle, but many end right about here with a dcl at day 40+. We’ll see what Friday brings, but a drop to a dcl here may only tag the blue 50sma.
.
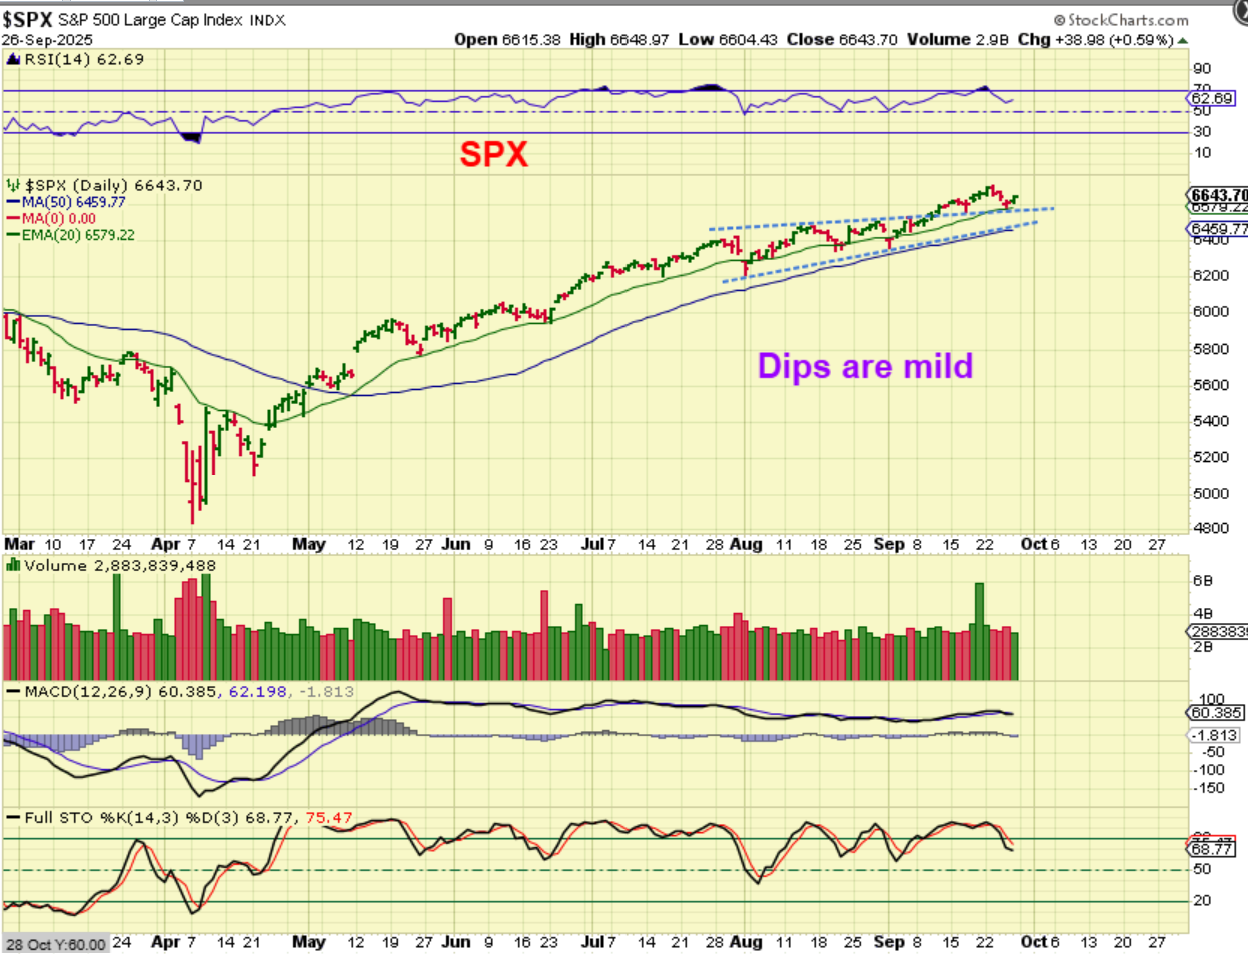
SPX DAILY – We got our reversal, so is this Day 39 with another bounce and a drop into a dcl near day 50? Or was this a 3 day dip into a dcl, that is very mild? We don’t really know, but so far the dips have been mild. We stay long above the 20ema. THAT was a choppy end to the week (3 day drops).
.
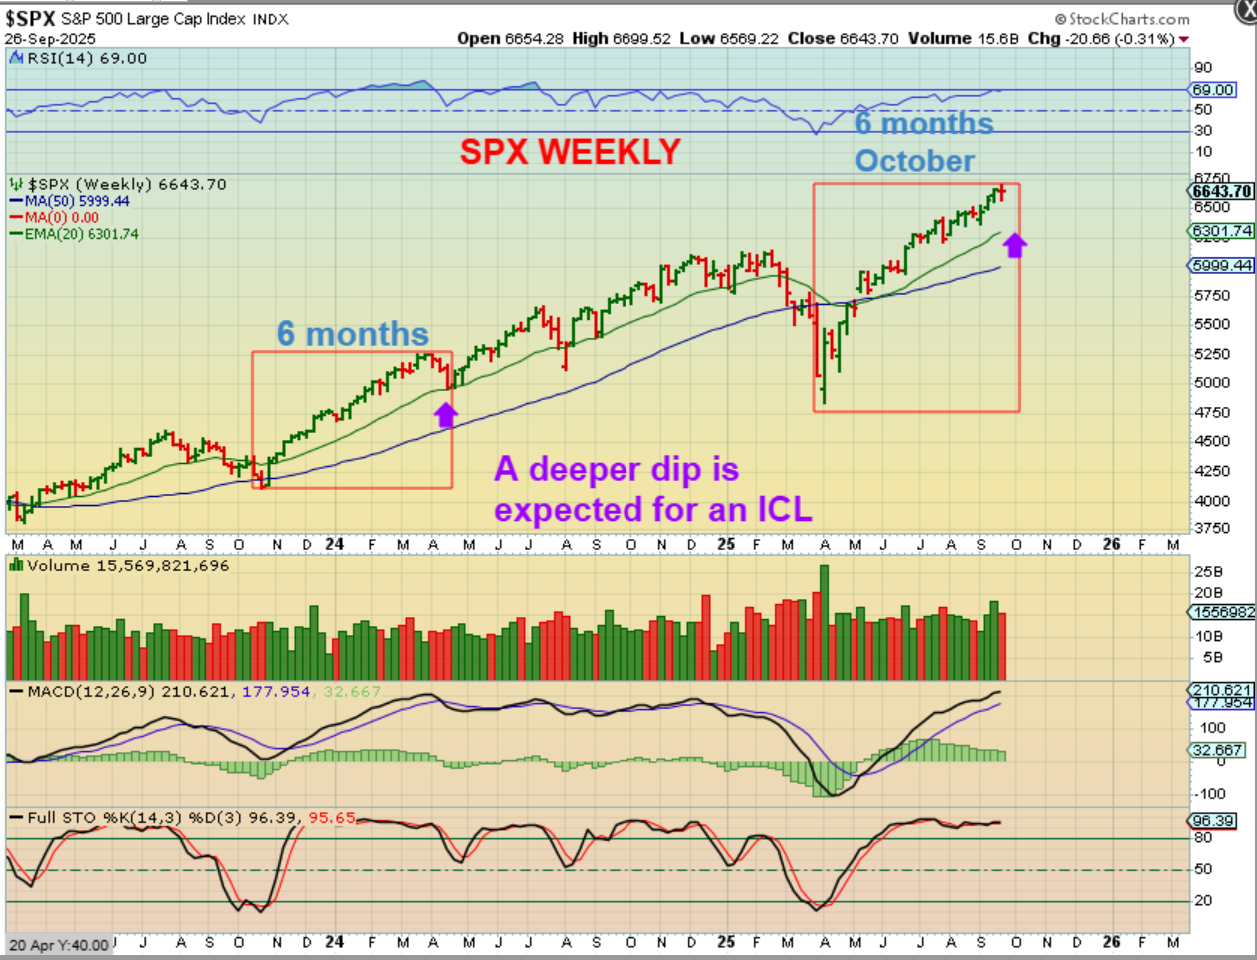
SPX WEEKLY– We are really coming due for an ICL drop being 6 months out from the April ICL, so I have been saying that we may get a Sell off October. That has happened in the past – we have seen October crashes. From there that drop could be down to the green 20 week ma. Take a look at how that first orange box ended. It had a 3 week drop, so…
.
Looking at the first orange box, we see that a drop like that from here could get us down to the green 20 week ma. If you thought that the last 3 days were uncomfortable (Our Bucket with the holes in it), imagine what 3 weeks lower in October could feel like. The daily reports will cover the coming pull back, and I want to lighten up for that drop just in case it is an ICL drop. THAT THEN MAKES FOR A GREAT RE-ENTRY/BUY POINT.
.
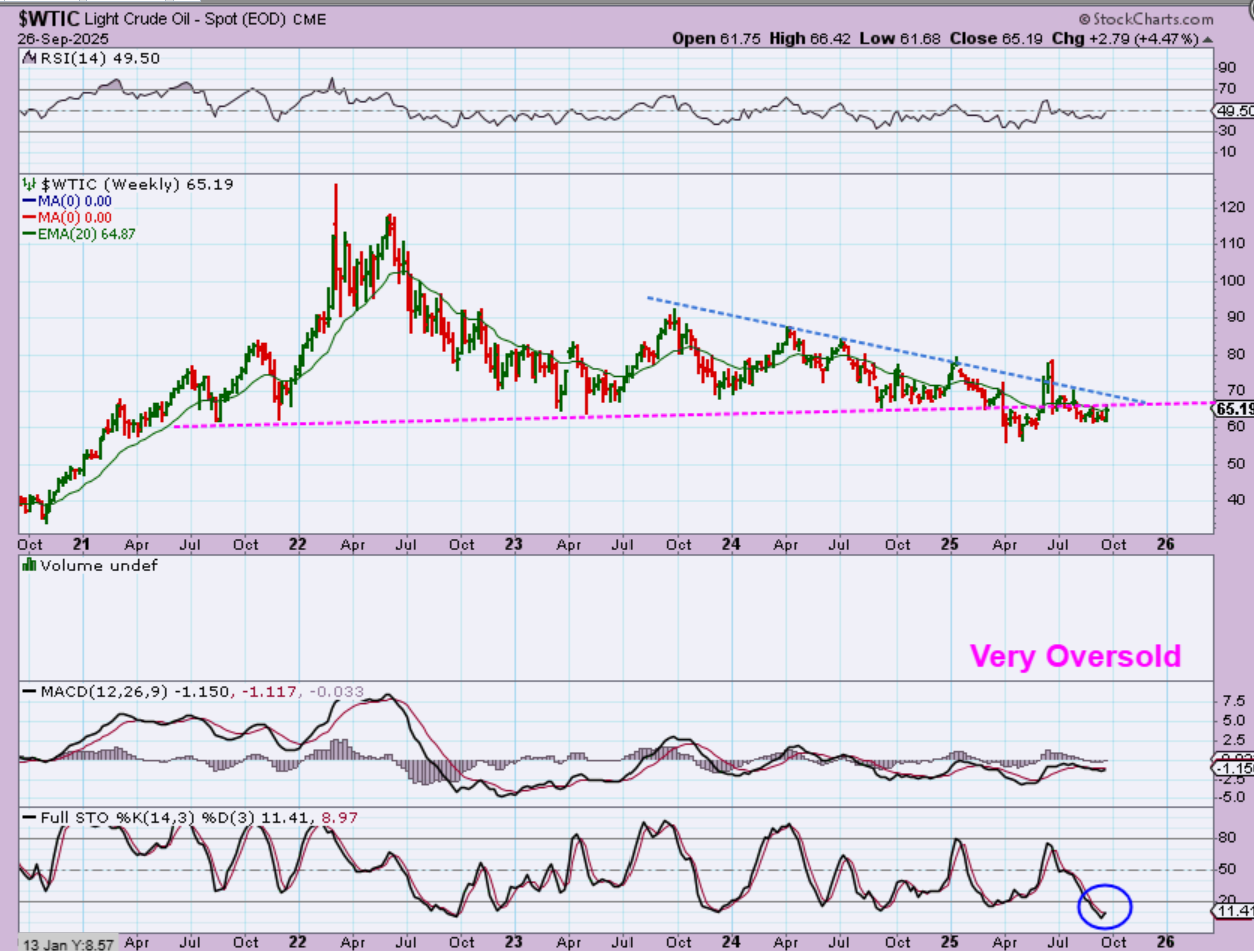
WTIC -Oil still has not recovered that break down, but Oil stocks are starting to run again, so that may be pointing to a recovery with Oil. The following are reasons that the Oil chart has started to look bullish.
1. Oil is very oversold on a weekly basis
2. Oil has a higher low and turned up last week
3. Oil has a sloppy bullish descending wedge.
4. Oil weekly RSI is almost 50
.
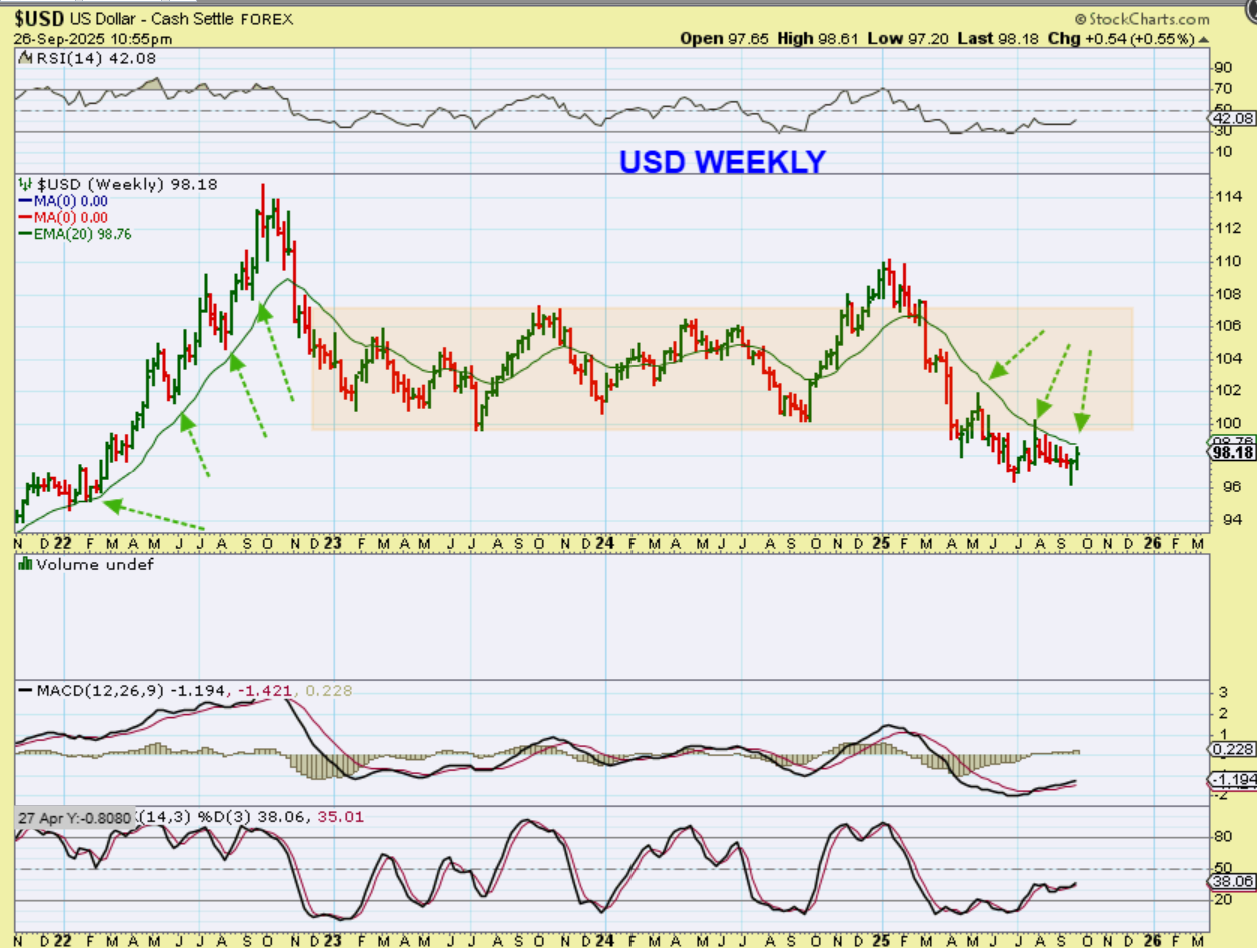
THE USD has a weekly swing low and had a good week, but that didn’t hinder Gold and Silver, so that was interesting to take note of. The USD has been bumping on and rejected at the green 20 week ema, so we’ll see if it can break through next week…or not. The MACD is bullish.
.
I WANT TO DISCUSS A FEW PHASES IN THE PRECIOUS METALS MARKETS. We have been ramping straight up lately, and it looks parabolic, but everyone wants to know—can it go higher? The short answer is yes, so let’s discuss that.
.
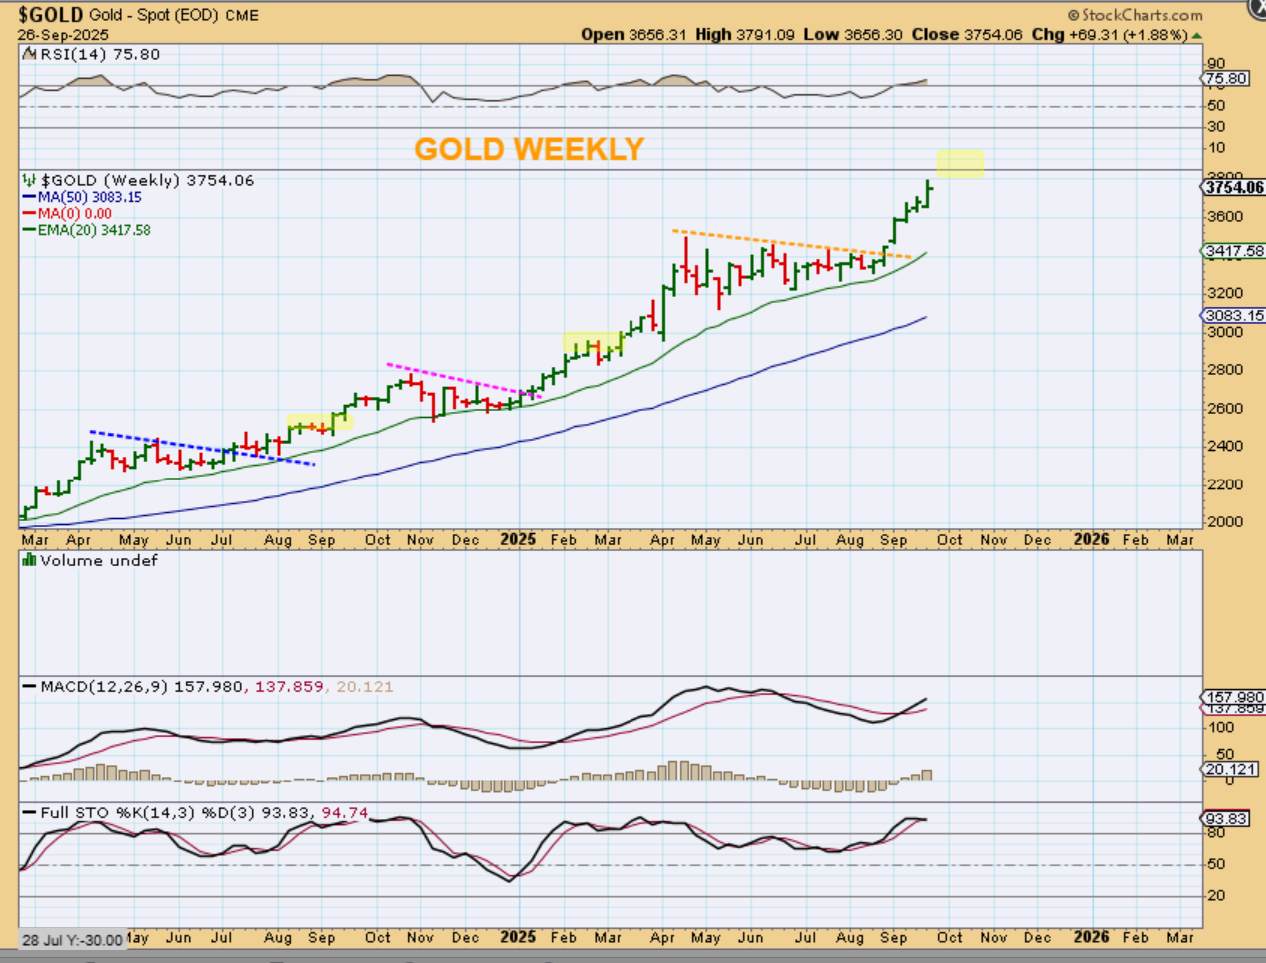
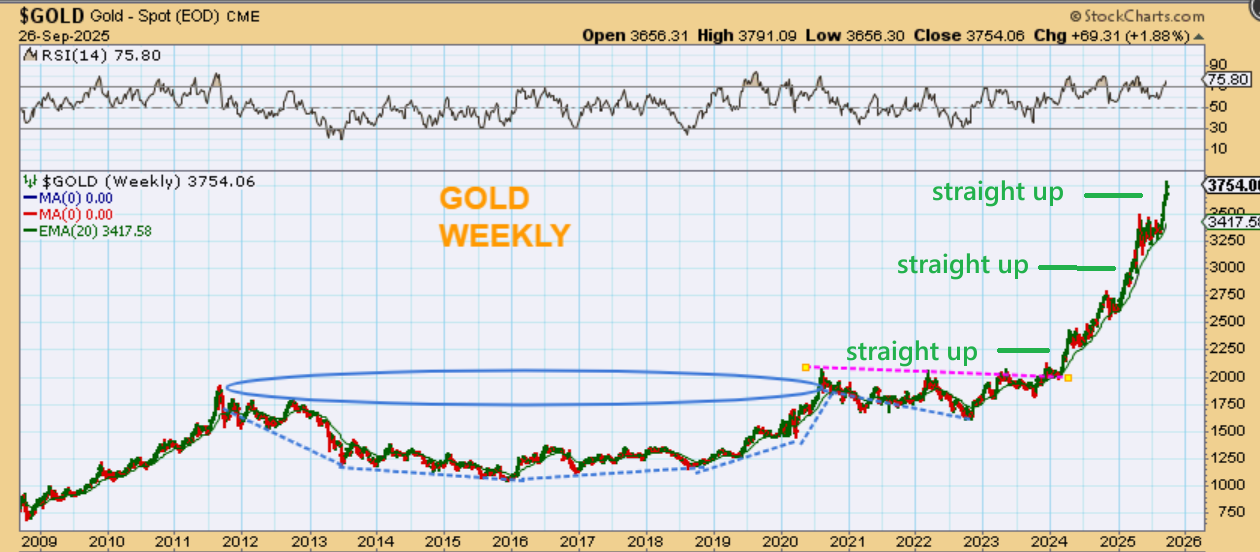
GOLD ignored the USD and pushed up another 2%. After the break from that Triangle, we discussed that it can have built up energy to run now, and that is exactly what it has been doing (6 green weeks in a row). In the past breakout and runs, it has ‘paused’ sideways (Yellow shading) and then continued higher. Those were likely dcls. Next …
.
NOW TAKE A LOOK AT THE TRIANGLES THAT FORMED ON THE RUN HIGHER. Those pauses are important, because they allow energy to rebuild, bullish sentiment to cool due to choppiness, and they allow the run to continue. They have been mild ICLs and believe it or not, we could run up higher (above $4000?) and then start another triangle ICL above the $4000. That is a possibility, but not a guarantee.
.
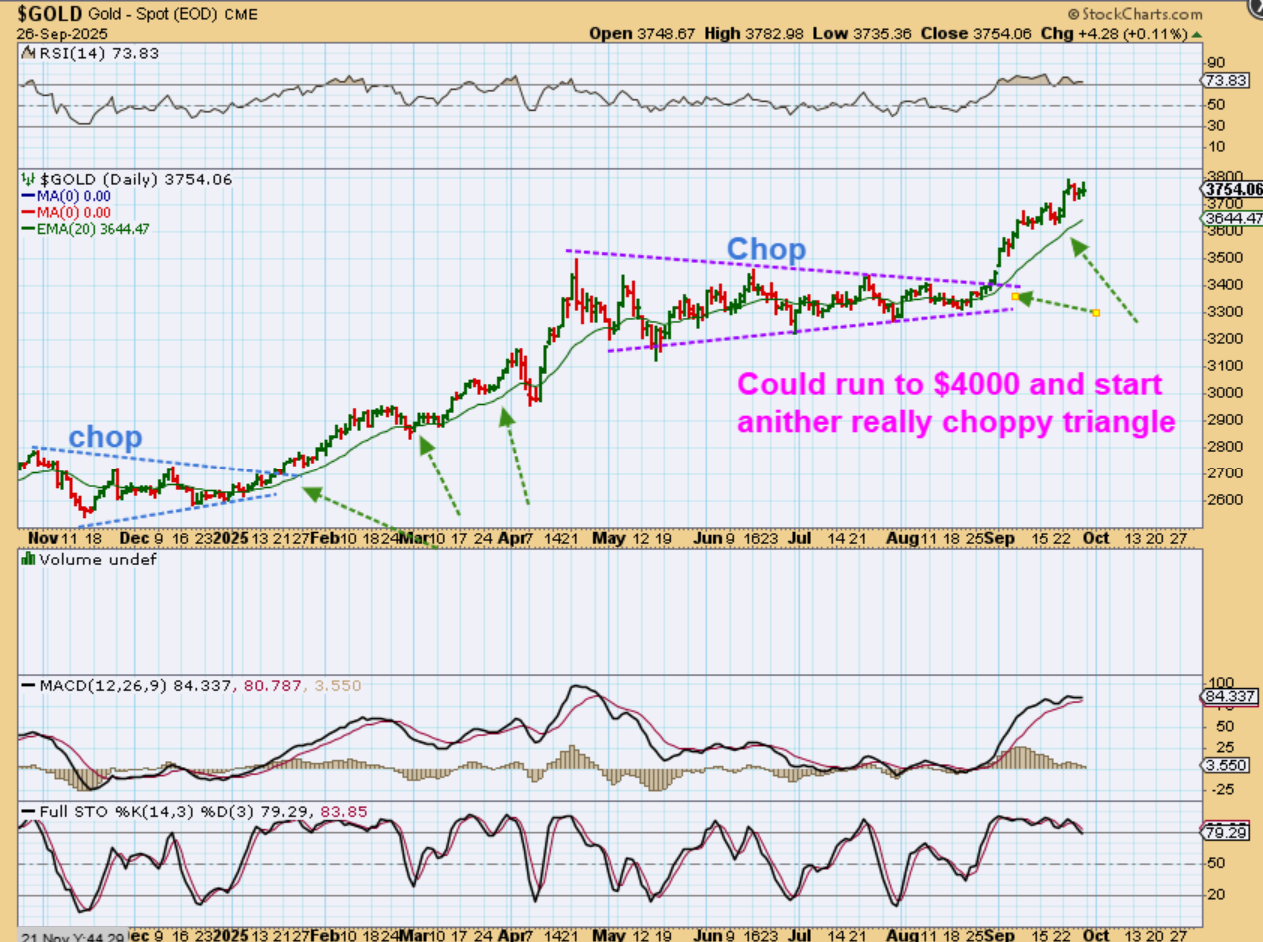
GOLD DAILY – Out of the triangles we get a slightly choppy run at first, and then it gets more choppy and starts to form another triangle. So it does make me wonder if Gold will run to a round number like $4000 and then give us another triangle consolidation.
.
So this is the good news:
GOLD With Golds big picture you can see that after breaking from the large cup and handle, Gold looked to be running straight up at times, but those ‘triangular consolidations’ can allow the run to continue. Gold now looks to be running straight up out of that triangle. IF IT DOES A BLOW OFF TOP NOW, the run is done for while. If it chops and consolidates in the 3rd daily cycle,however, it can form another triangular consolidation & then the Bull continues. Notice also what each triangle did for the RSI. RSI & Stochastics relax in consolidations.
.
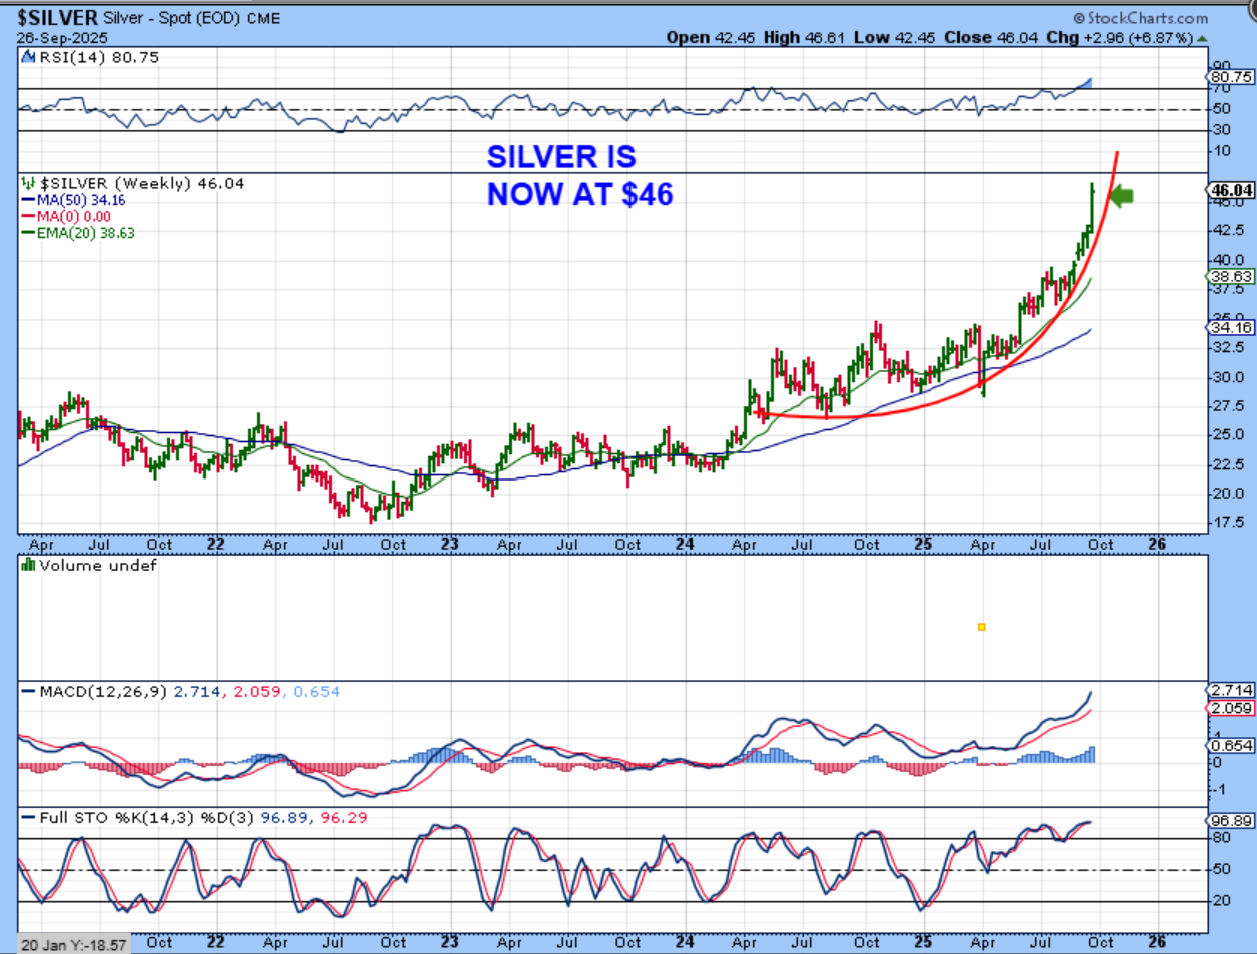
SILVER shot up last week and it shows on the chart. Suddenly Silver is at $46. We’ve been talking about it being able to run to the prior highs of 50 for years, but this isn’t looking parabolic, so we have to assume that Silver is going to break that $50 and move to new all-time highs like Gold & GDX have. We also know that Silver can shoot straight up, right? Well talk a look at the GDX next…
.
I WANTED TO SHOW YOU GOLDS TRIANGLE CONSOLIDATIONS, so that you’d understand that we are now either going to see a blow off top here -OR- maybe a consolidation and then a continuation higher. Let’s discuss that.
.
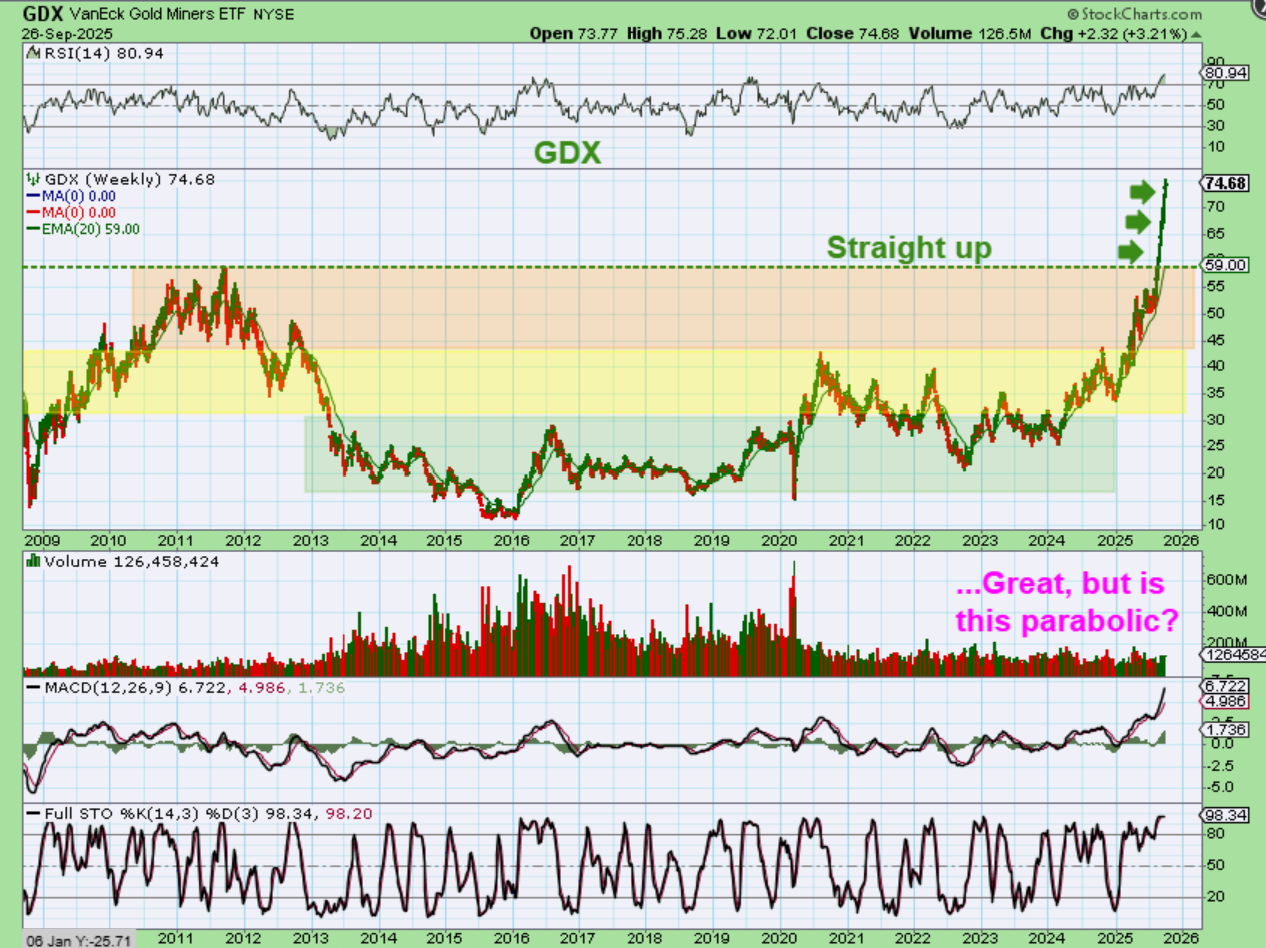
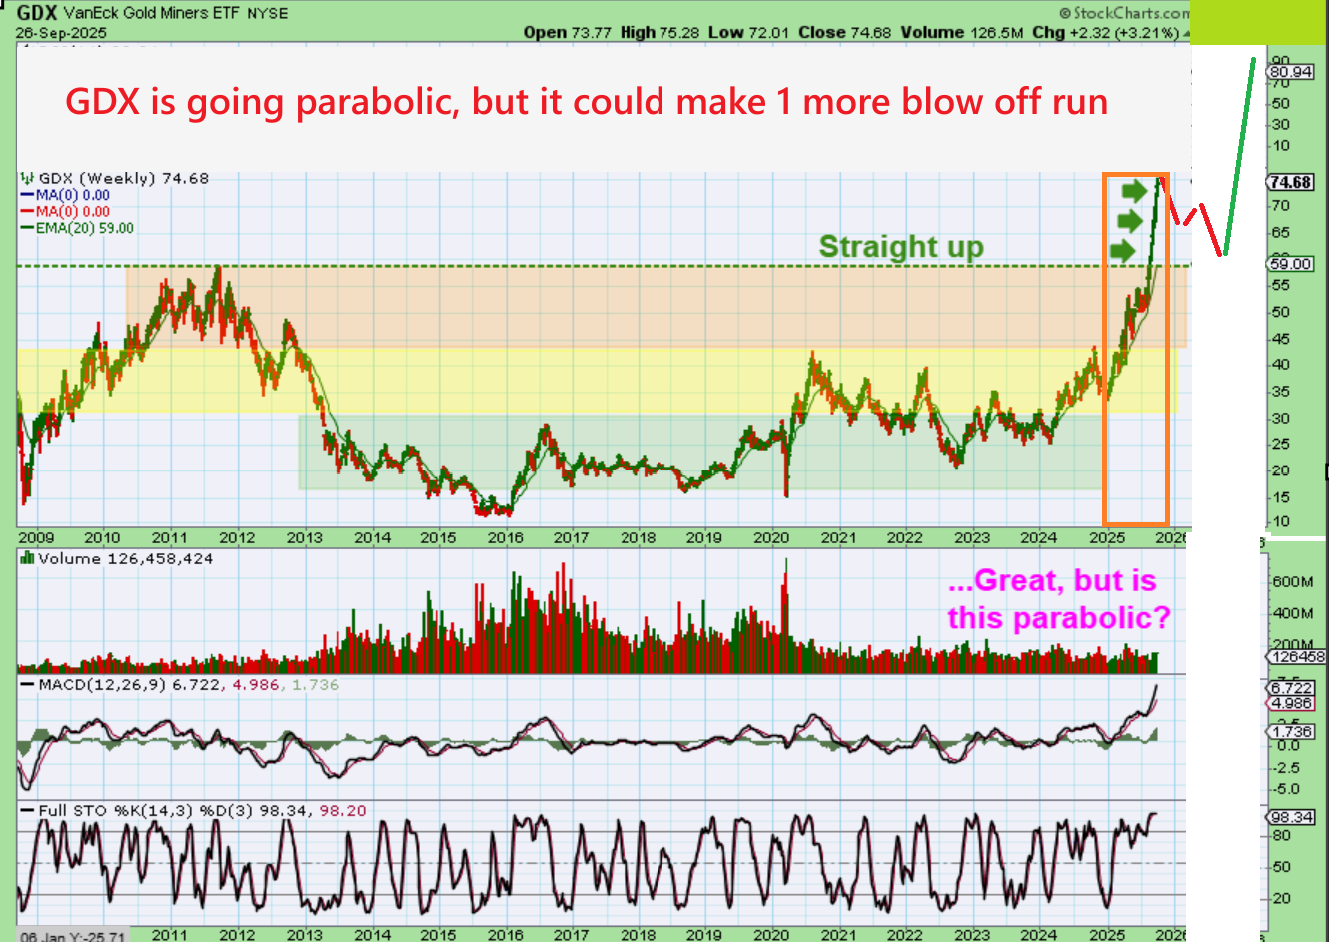
Once the GDX broke to new all-time highs, it had no resistance. I had been pointing that out with these colored charts of GDX resistance areas. Now that it broke out, it has been on a tear! I am slightly concerned with the GDX straight up rally though, because parabolic moves like that can become exhausted blow off tops that crash. I’d love to see GDX start to consolidate (maybe in October) and form a triangle like Gold does. THAT would become a strong buy for Miners as they dip lower, and then they might give a final blow off top into the year-end or beginning of 2026.
.
GDX -Even just a dip lower like this over time (into an ICL) could be enough of a pause to reset sentiment and start the run again. Next I will show you something that was a bit surprising …
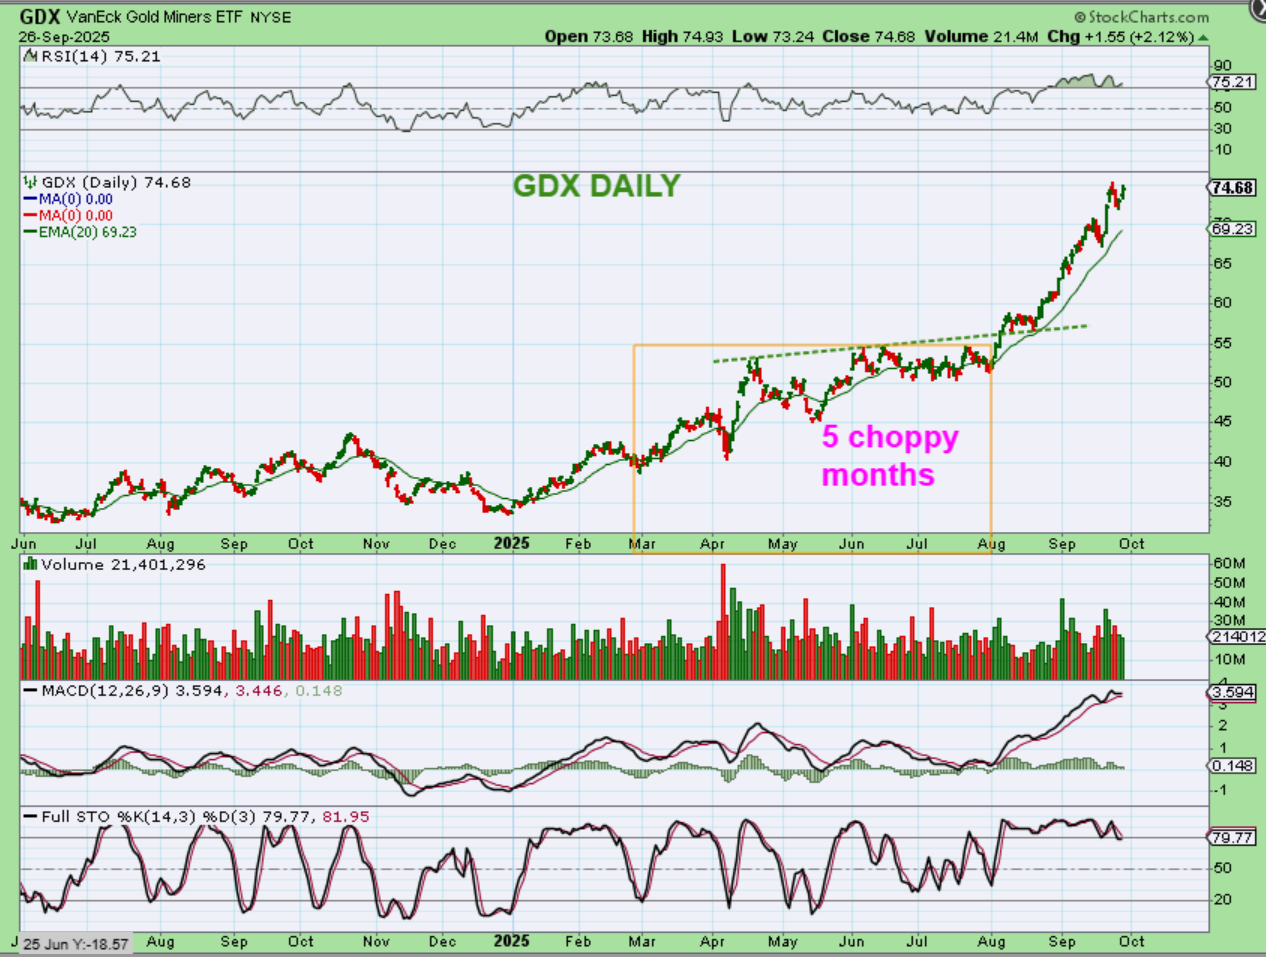
Next I will show you something that was a bit surprising . I want you to notice how choppy and difficult GDX was for 5 months in 2025. It would run up and then sell off, especially those dips in April and May. in June and July it was all sideways Chop, Chop, Chop. Now keep that in mind…
.
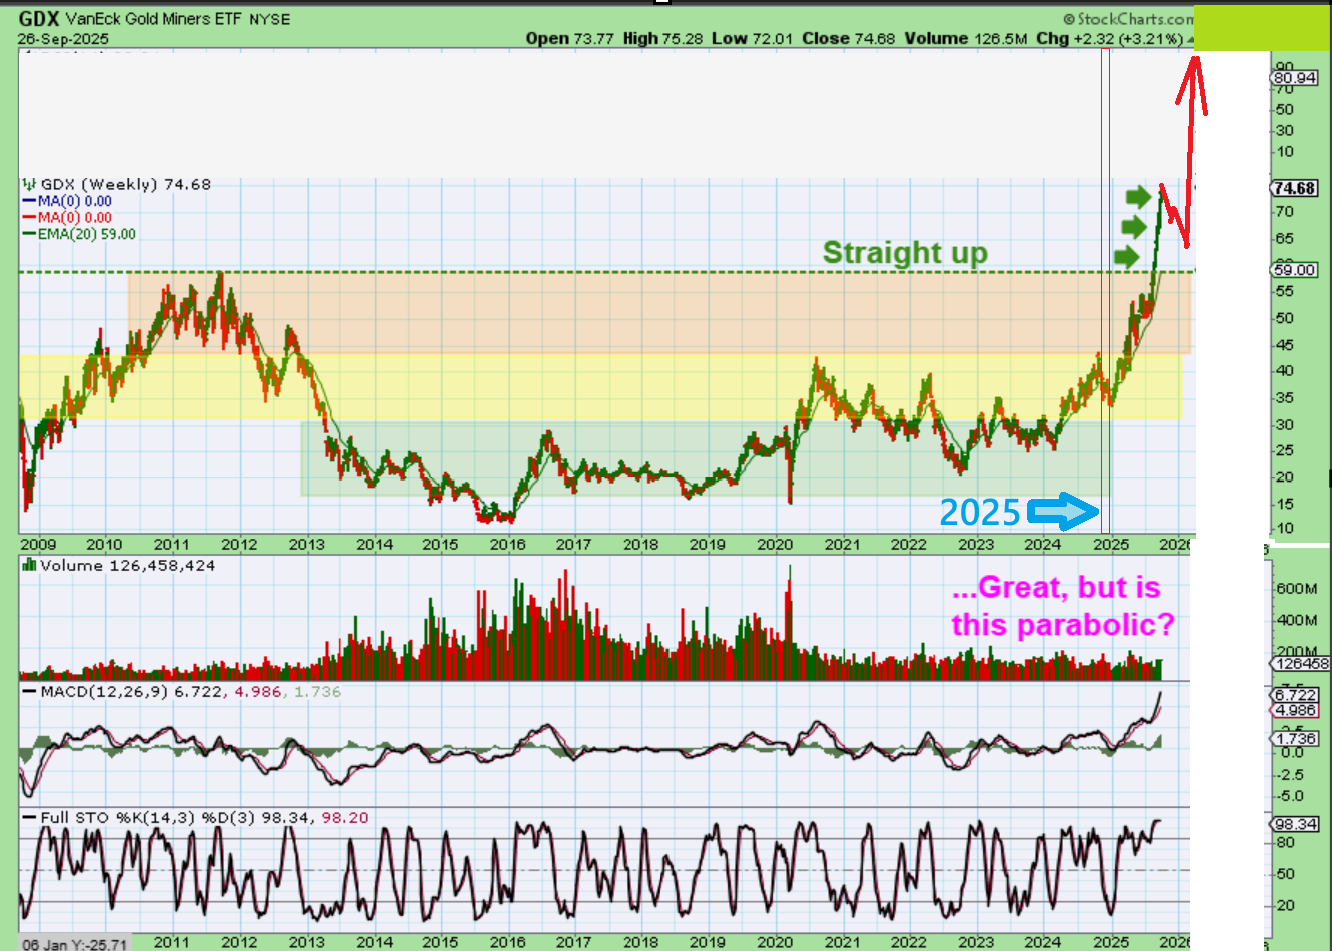
GDX was choppy and difficult in May -August on the daily chart, but it is surprising to see that with this Big Picture weekly chart of GDX, all of 2025 to be looking almost Straight up, right? But it wasn’t, it was sideways & choppy. Gold looked straight up until it formed triangles. So GDX could still form triangle consolidations and continue higher.
.
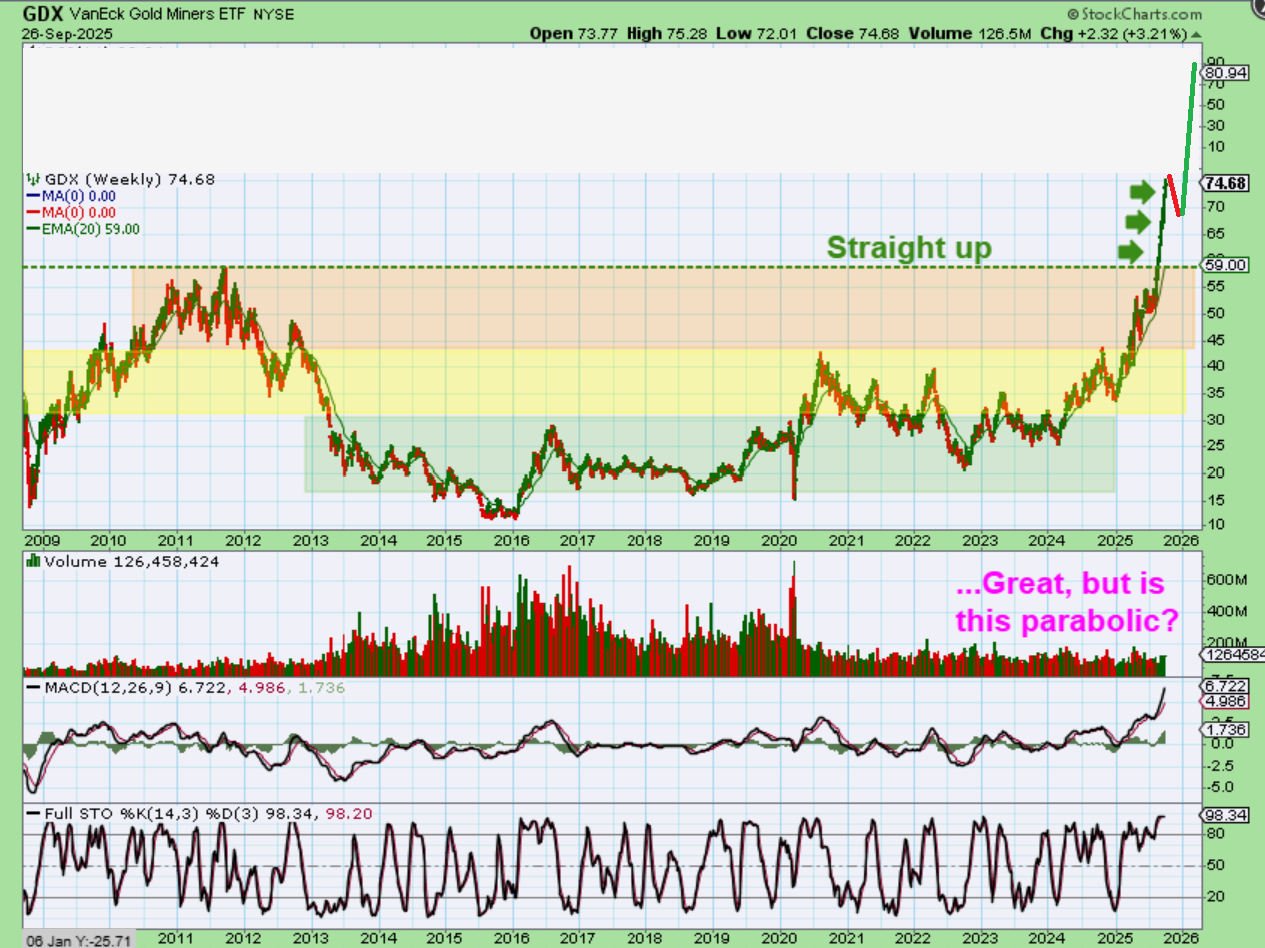
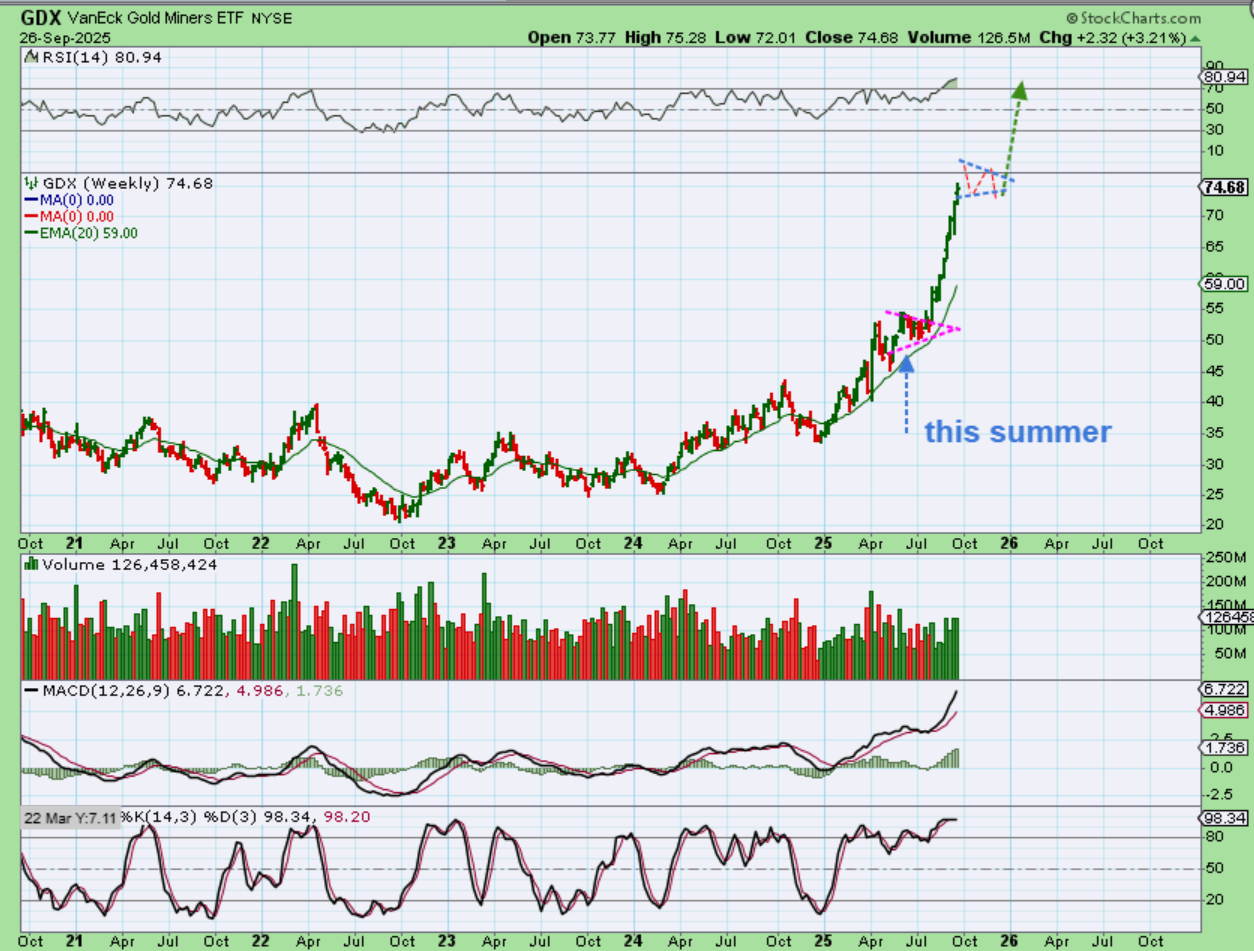
And this is why I think that another sideways choppy period (like last May, June, July above) could form a triangle like I drew here, and then that can continue higher. So my point is that…
1. Yes, We could just continue higher and higher and get a blow off top, or
2. We could pause eventually with a sideways consolidation as drawn here and then make a final run higher.
.
GDX – I drew a deeper dip here as a back test, but this is drawn as a long somewhat prolonged dip in Miners into the end of the year and into 2026. For this to happen, we’d probably need the USD to rally and for Gold to pull back quite a bit for a few months into an ICL too. This is less likley.
.
So the GDX is going straight up, but if it puts in a rest period into an ICL DIP or ICL TRIANGLE, it can go even higher. This is the question that I have been asked the most. IS THIS RUN IN A FINAL BLOW OFF TOP, OR CAN IT GO HIGHER? I think that the answer lies in whether or not we get a pause in 2025. The charts, the way that I have drawn them, are reasonable.
.
CONCLUSION:
So we had a 3 day sell off in the general market and we aren’t used to that. It felt uncomfortable, like a bucket of coins with some holes in it. 🙂 , We have had very strong gains over the past couple of weeks and it felt like we were giving some back, but you may recall that I had this in a recent report earlier this week too. The dips have been mild and short lived, but we do need to remember that as time goes on, we will eventually come due for a deeper dip into an ICL. We may need to lighten up in the 4th daily cycle if we see it ‘peek’ and start to break down.
.
We had a reversal higher on Friday and the bulls do still remain in full control. Oil looks to be perking up again, and Oil stocks seem to be strengthening ahead of Oil. The Precious Metals continued higher, despite the USD rise. I’ll cover Bitcoin below. Enjoy your weekend rest!
.
~ALEX
.
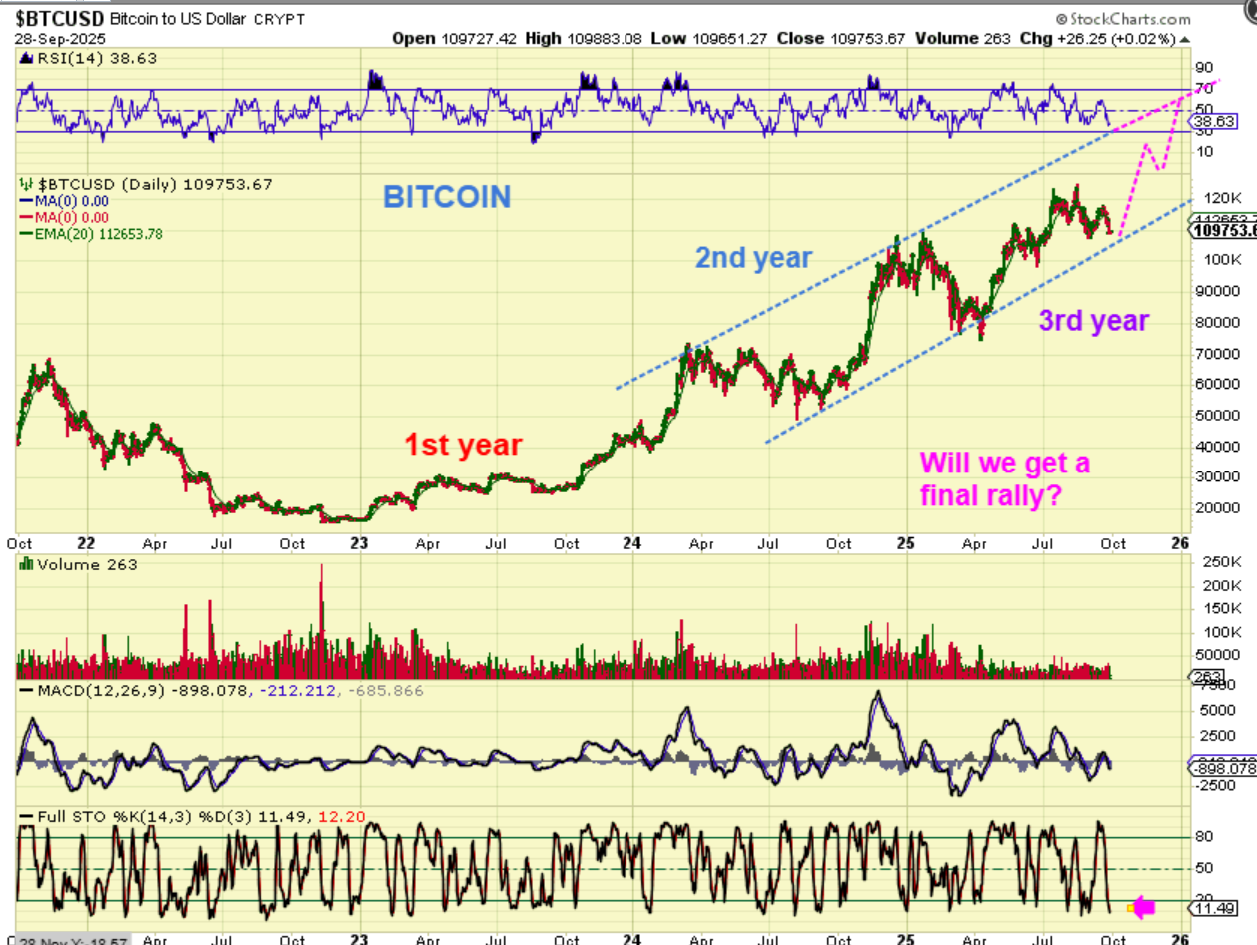
BITCOIN got weak last week, but it is not ‘broken’ by any means. I am Optimistic yet Cautious.
That said: We are getting late in the 3rd year of a 4 year cycle, and that 4th year can have deep crashes, so this is what I am watching. We DO have time for a rally as drawn here, and if this kicks into gear, it’ll be a very good one to reach the upper channel. Crypto stocks like IREN, CIFR, HUT, WULF, etc have already given us great rallies, I (we) have solid gains from those (& RIOT). Others started to follow, like BTDR, CLSK, MARA, HIVE, BKKT, etc., but they dipped with Bitcoin last week. CIFR and IREN fell too…
.
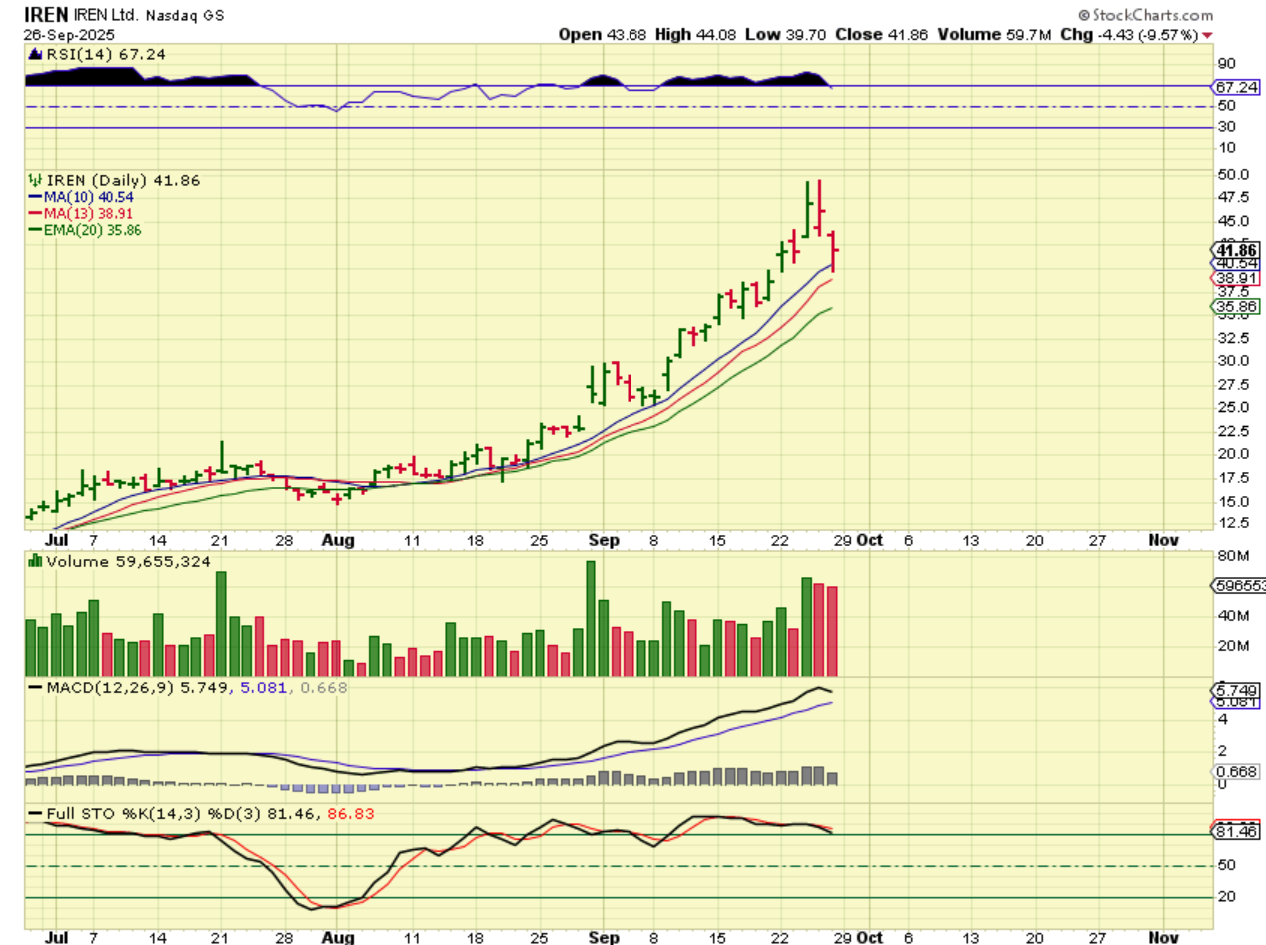
CIFR and IREN started dropping this week, so since they were leaders, I am watching them for clues. Are they ‘topping out’ first? Or are they pulling back for a sling shot move? Time will tell.
,
IREN dropped and this really isn’t bad when you consider the rally, but volume selling was a bit high. We’ll see. CIFR looks worse, but they did an offering, so we’ll see if that recovers.
.
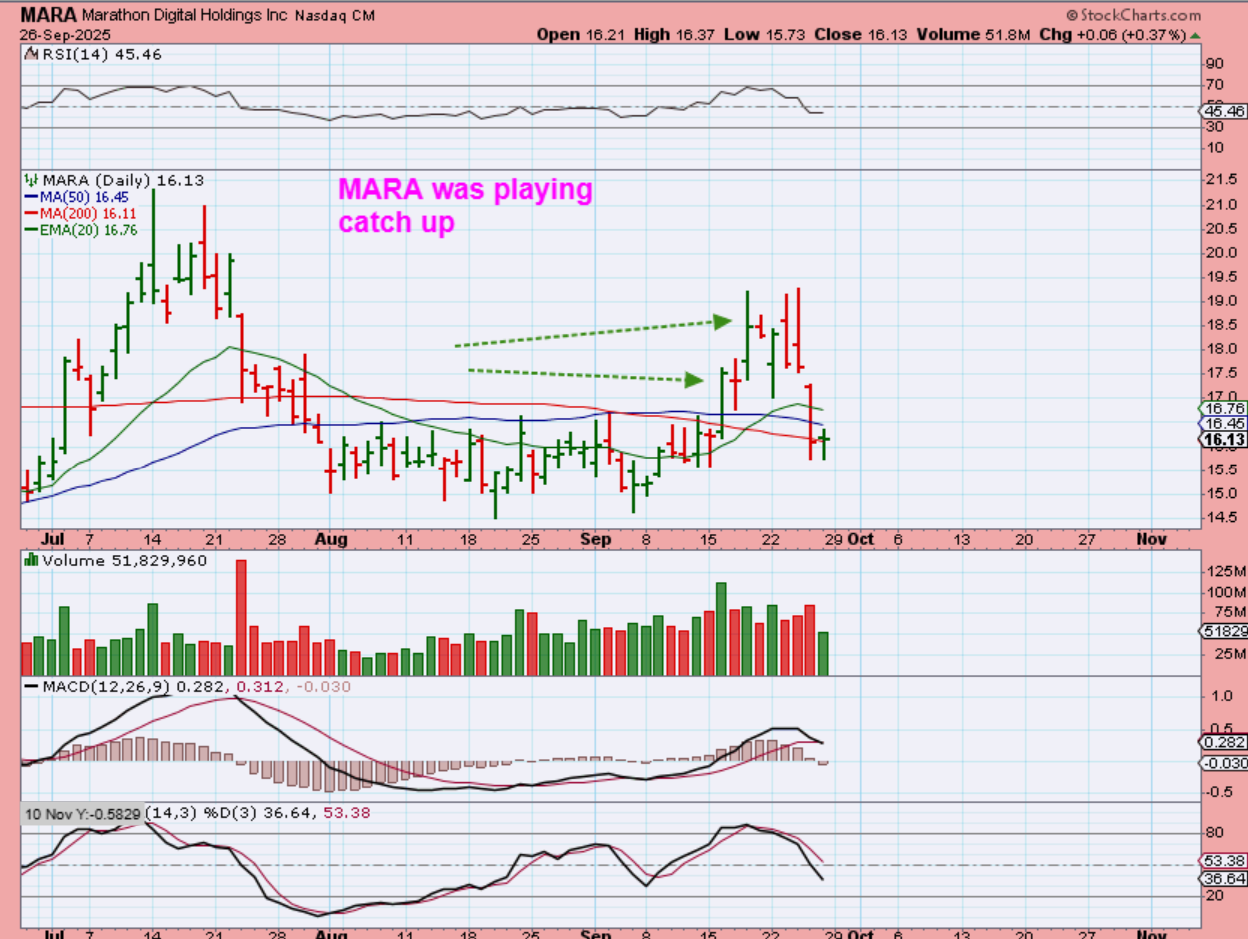
Some miners still look good, some looked a bit ugly. CLSK & MARA started to rally & play catch up. CLSK pulled back a little bit, but…
.
MARA on the other hand got beaten down. I owned it under the 50 & 200sma, so I’d be fine, but I then added heavily above the moving averages near $17.50, so I took a loss Thursday around $16.