I don’t see any really big changes yet, but this report will cover a couple of new developments. The weekend report will really be able to address things better too, because we now have daily, weekly, and monthly charts with the end of July behind us. 🙂
..
DOW JONES – Starting with the Dow, we looked at 2 daily cycles and that last dip seemed to be the dcl. It showed up on the Dow better than in other areas, so I am showing you that here, and…
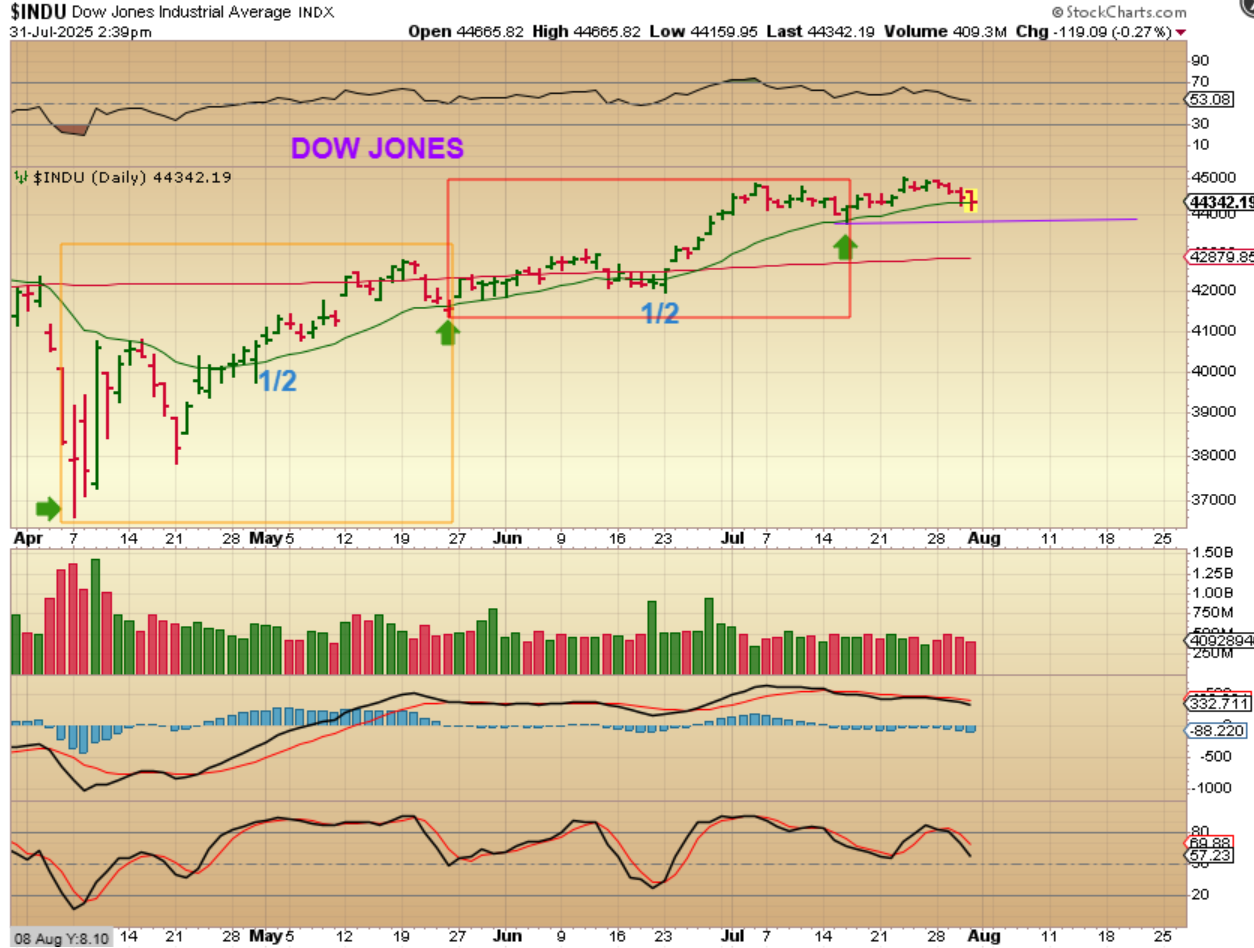
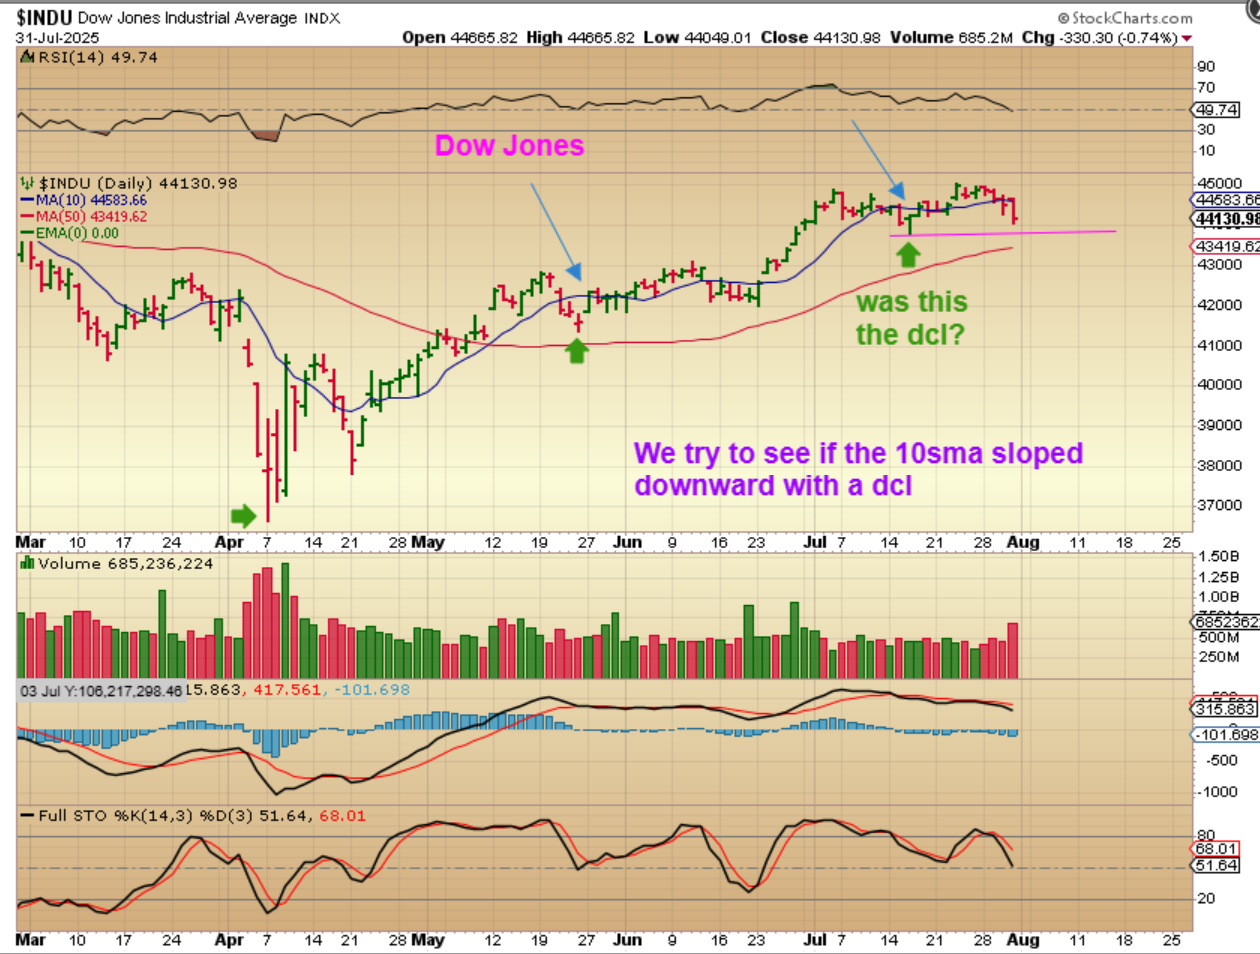
DOW JONES – We usually look for a dip in the 10sma and we did see a ‘slight’ dip on both of those areas, but as of yesterday we almost took that last low out. This makes me question this :
1. I wonder whether that WAS the dcl and we could fail here(?), or
2. Is the dcl really just ahead? I honestly think that either of those 2 scenarios could be the case if that low is broken, because the dip was shallow and ‘time’ does still allow for a dcl ahead.
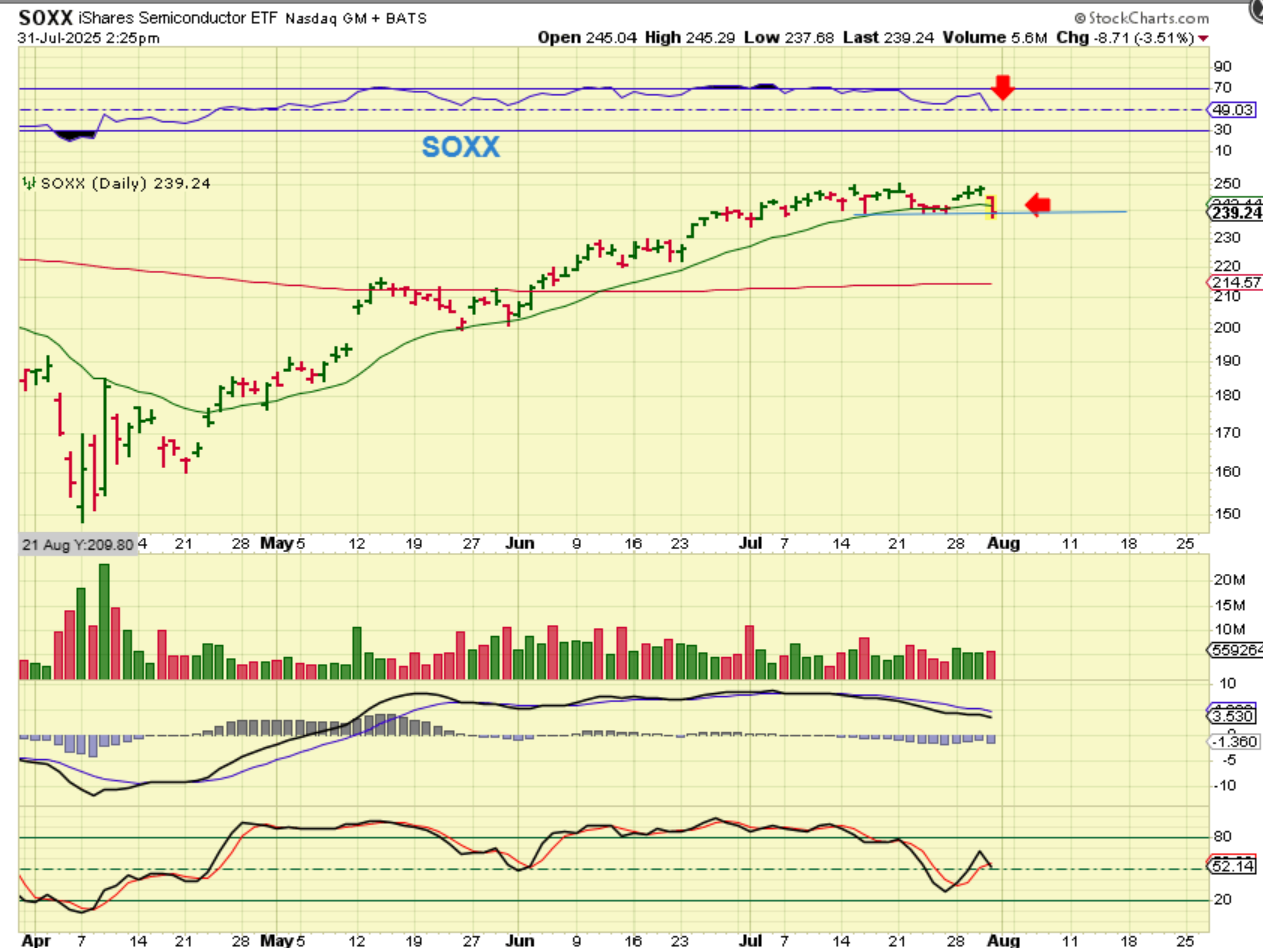
THE SOXX DID take out the prior low yesterday, but to be honest, that doesn’t really look like a dcl dip on the SOXX in mid July, does it? So this does make me wonder if we have the 2nd daily cycles low just ahead, but we’ll have to wait and see how things play out once we get a reversal higher.
.
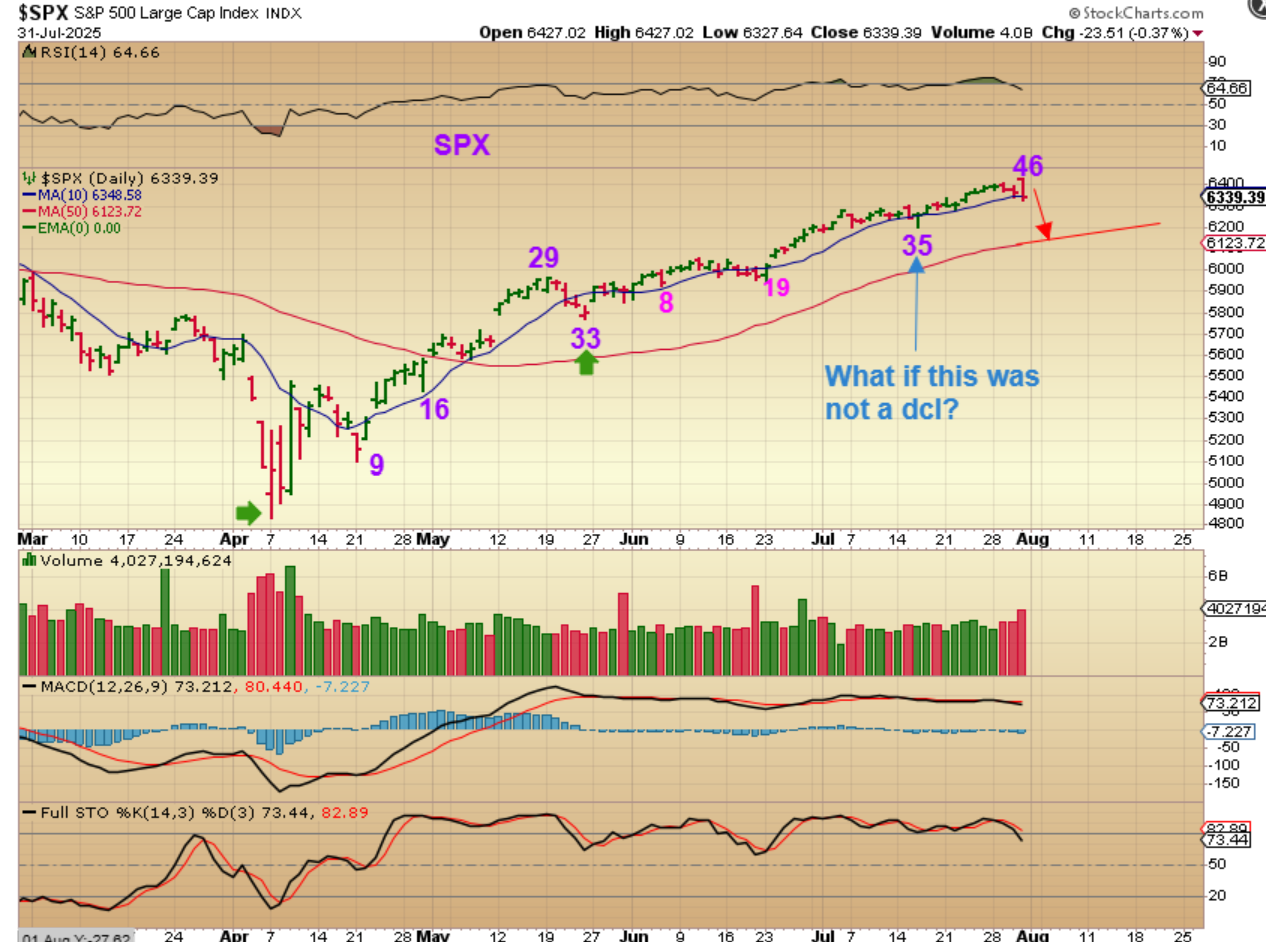
So now let’s take a look at The SPX to make my point:
I marked up a day 33 low as the dcl in May, and then we saw a very mild chop & tiny drop & recovery at day 35 and that was marked as a dcl, based on the way you could see it better with the Dow. When I look at this however, it is within the timing for a dcl, but was it? The SPX certainly doesn’t strongly resemble a dcl at day 35 and we have had dcls come at day 50 or so in the past, so it really makes me wonder: IF THIS LOW IS TAKEN OUT, does that give us a failed daily cycle or an extended run to the real dcl? We MIGHT really be on day 46 as of yesterday as shown here.
.
So, I just wanted to point that out and it is important, so I hope that you were able to follow that.
If we do dip below that last day 35 spike, I may not view it as a broken dcl and a failed daily cycle. Why? A failed daily cycle is usually an obvious sign of weakness, but breaking that tiny low would not take a moment of weakness, right? So if that low is taken out, I would still have to continue to view this as a strong bull market until we see additional evidence of weakness.
.
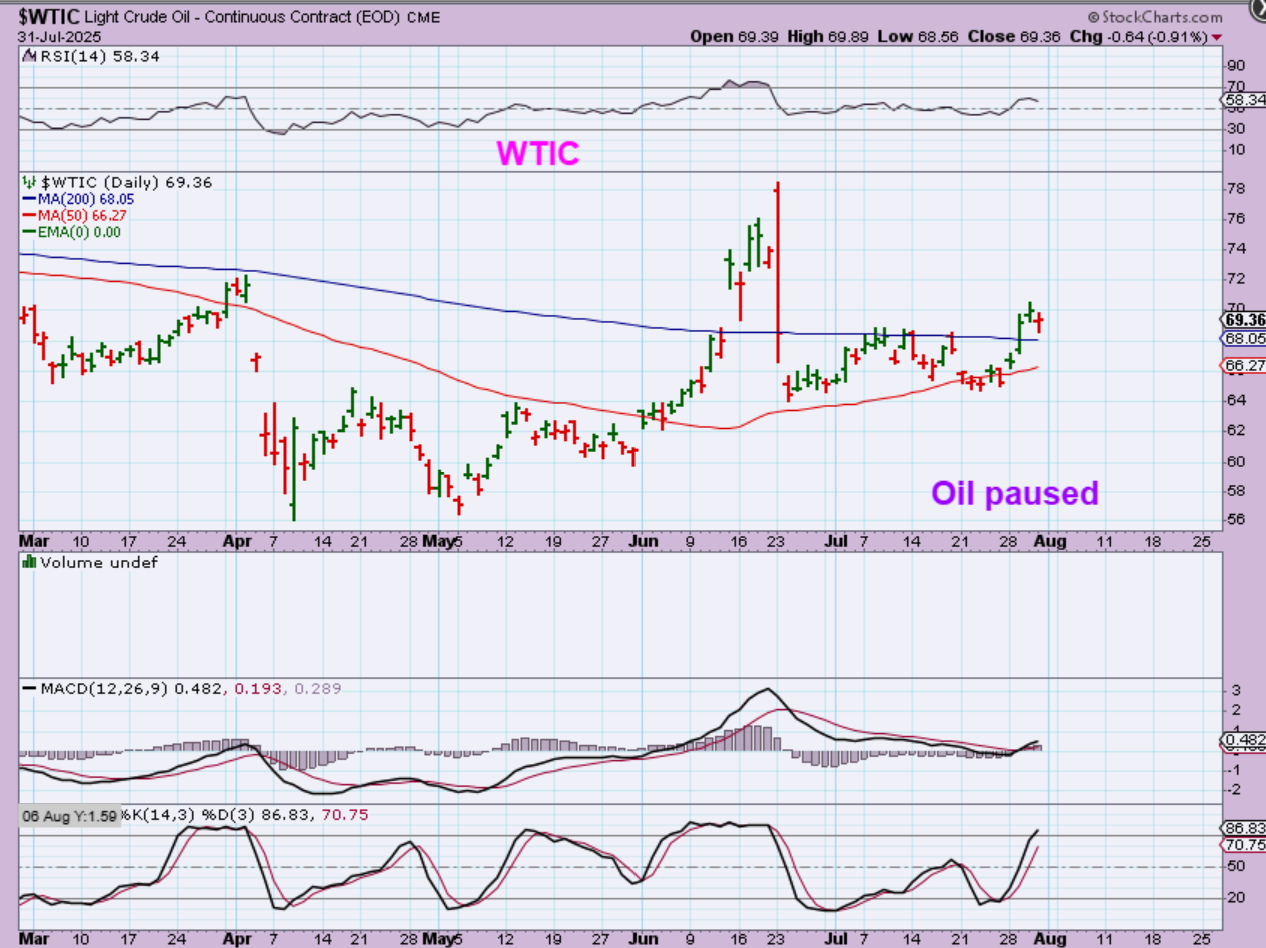
WTIC broke above the 200sma again and has paused, but it does still look progressive.
.
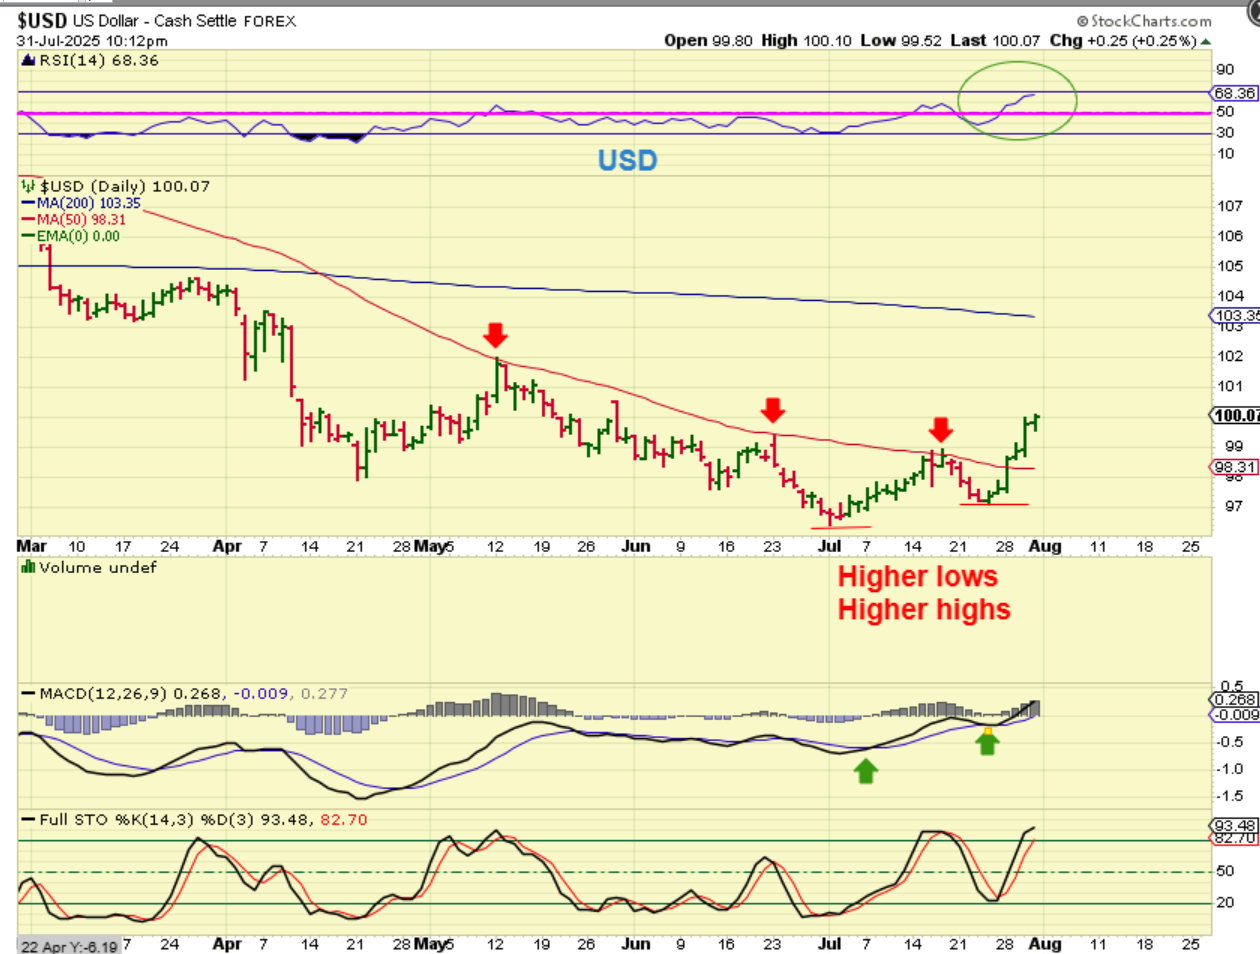
Speaking of looking progressive:
The USD has a higher low and a higher high, the MACD showed us strength weeks ago, and now the RSI is at a height that it hasn’t reached for 7 months. This should be able to make its way up to the 200sma, and that might be the ‘peak’, or it may continue to show strength after that. I will discuss the possibilities in the weekend report. We now have daily, weekly and monthly charts with the end of July behind us.
.
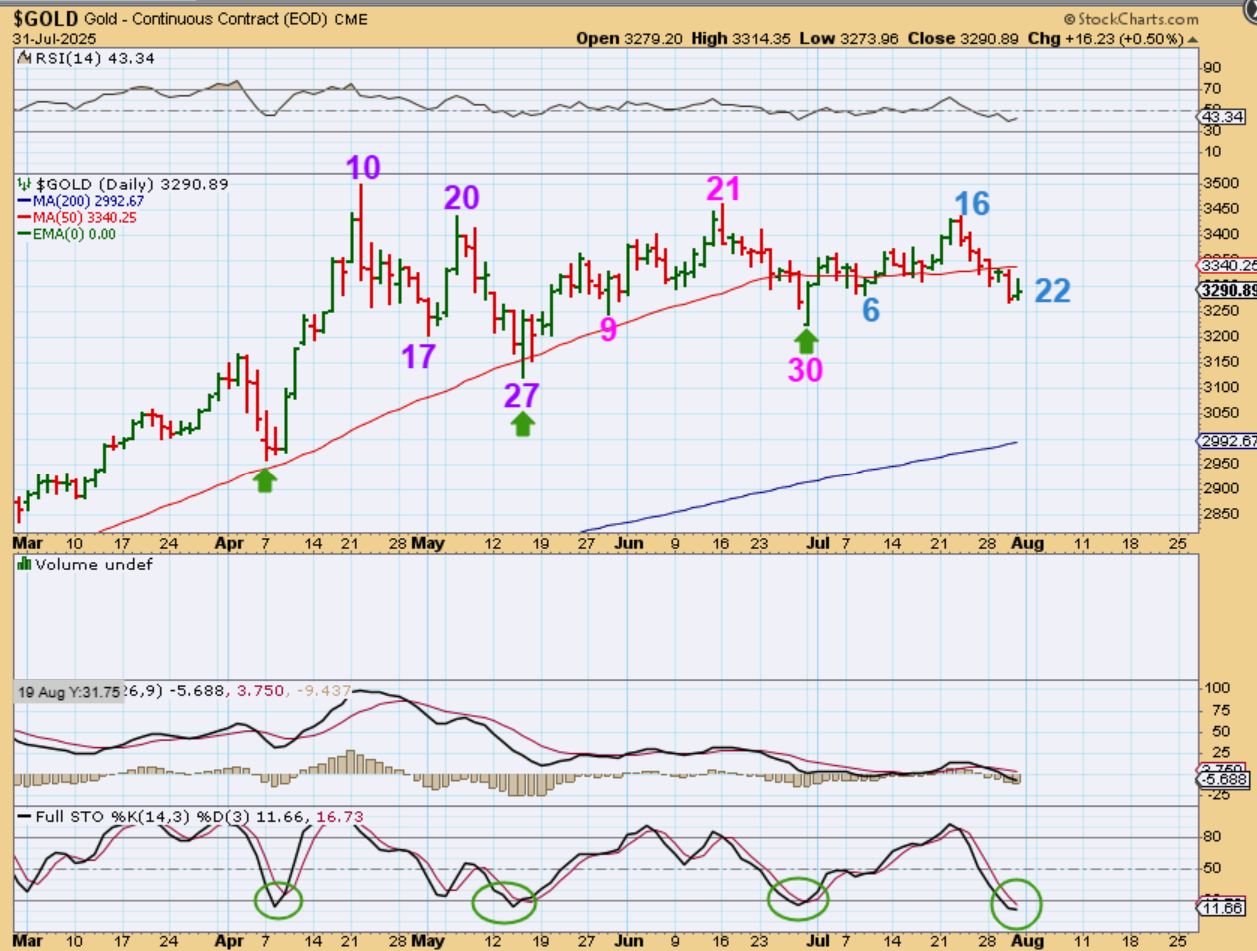
Notice that the last 2 dcl drops lasted 27 days and 30 days. They were fairly mild dips.
Now GOLD is on day 22, so it does have more ‘time’ available before putting in a dcl, right? The question that remains is, “What will Gold do during that remaining time?’. It can bounce & chop around and hold up well, or it can sell off into a low, so we just need to be aware of that. A break of the last day 30 low is a failed daily cycle and starts our drop into an ICL.
.
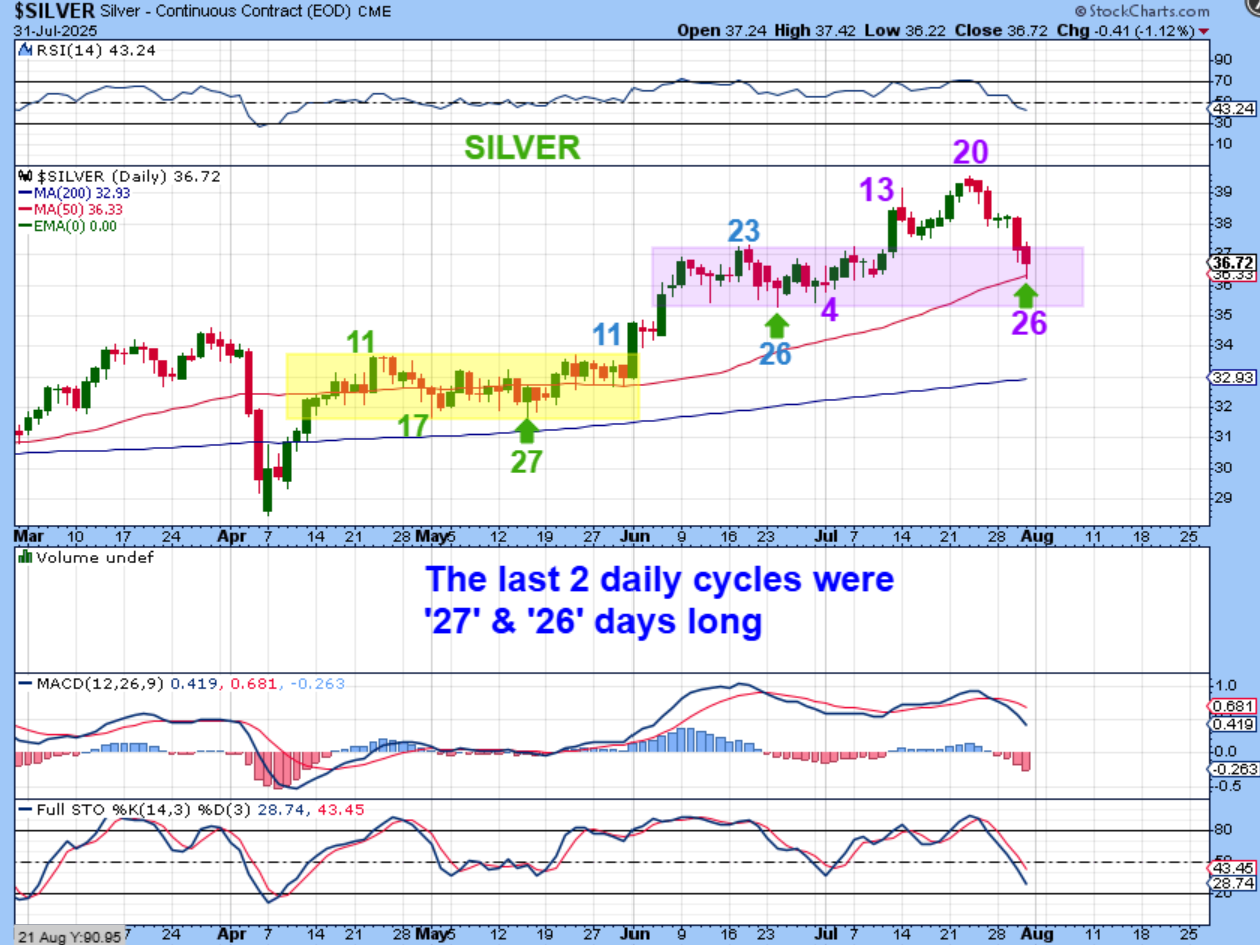
SILVER actually bounced off of the 50sma yesterday. Interestingly, the last 2 dcl’s were 27 days long and 26 days long. We are now on day 26, but we are not oversold yet.
.
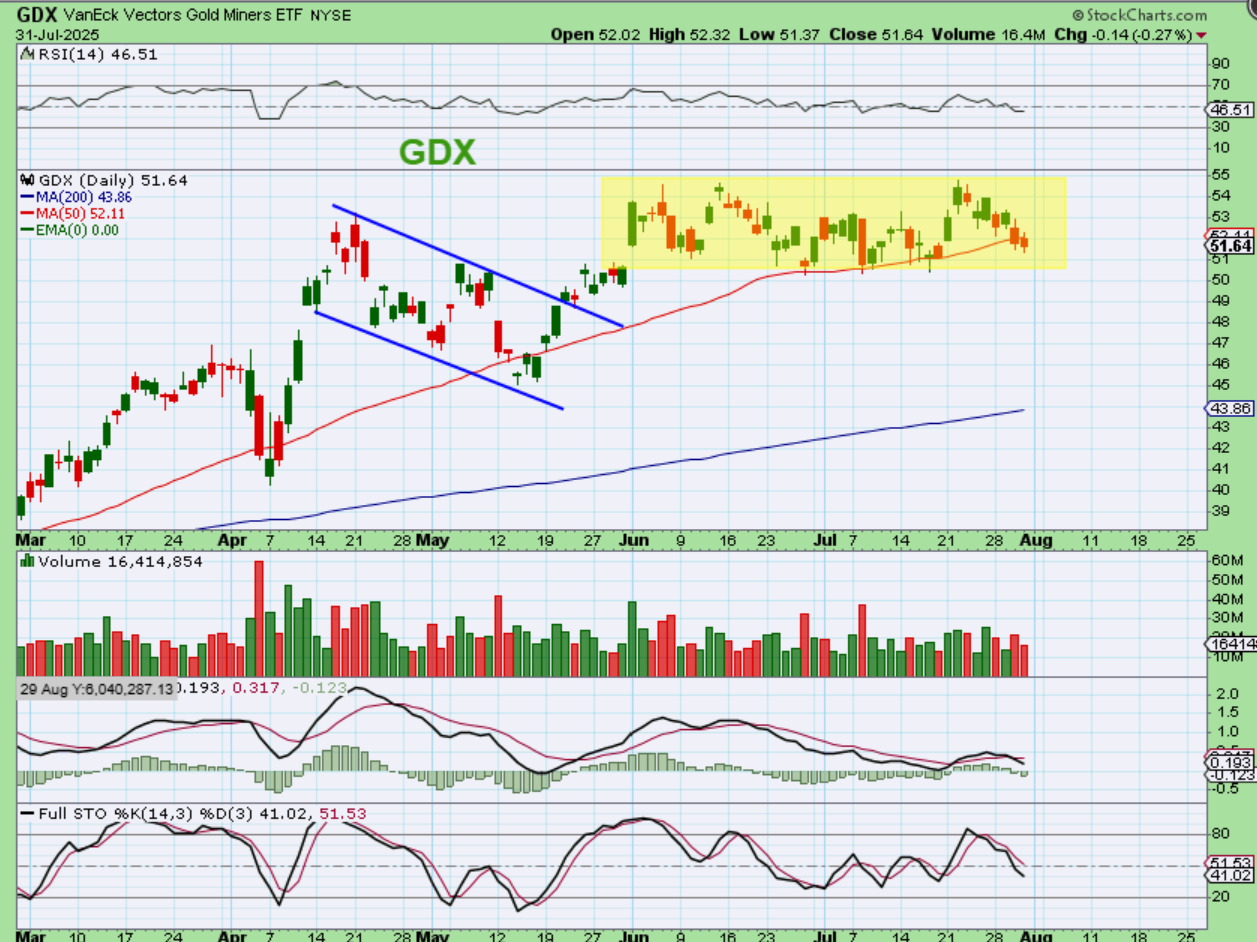
GDX is choppy and has been churning sideways like Gold. I feel that it is this choppy, partly because we have a mixture of GDX following Golds selling, and also GDX reacting bullishly to good earnings reports by some of the Miners like NEM, KGC, NG, etc.
.
As mentioned, today is August 1st, so we will have a chance to look at daily, weekly and monthly charts in the weekend report. The old saying used to be “Sell in May and go away”, but that has not been the case this year, since the bulls have remained in control. Enjoy your Friday trading and enjoy the weekend!
.
~ALEX
.
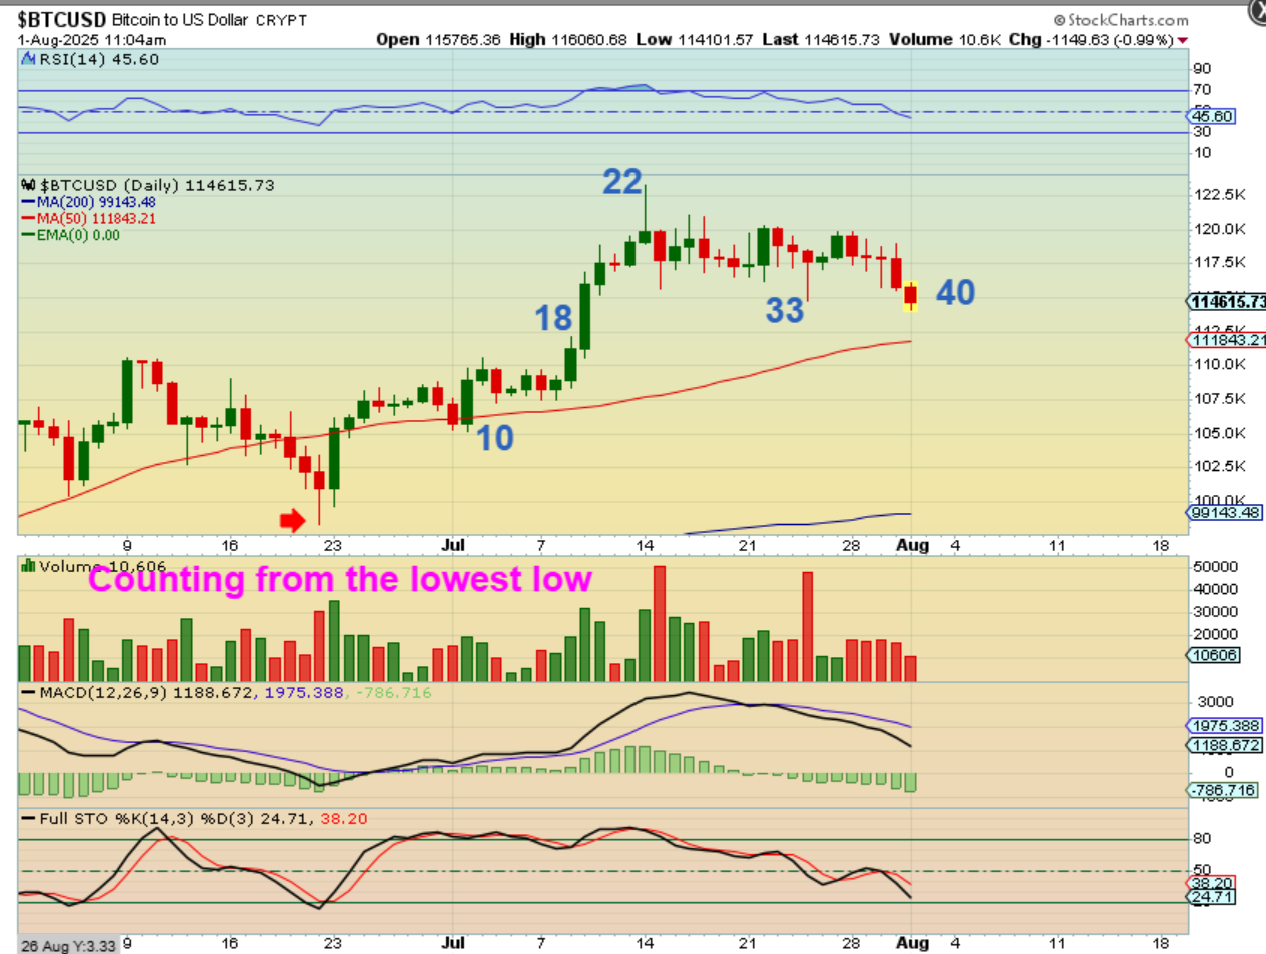
BITCOIN has started to look weaker than it did last week, so I decided to just count the days from the last deepest low. We would be on day 40 of a possible 60, so I think that we will continue to see bouncing and choppiness going forward. Another view is…
.
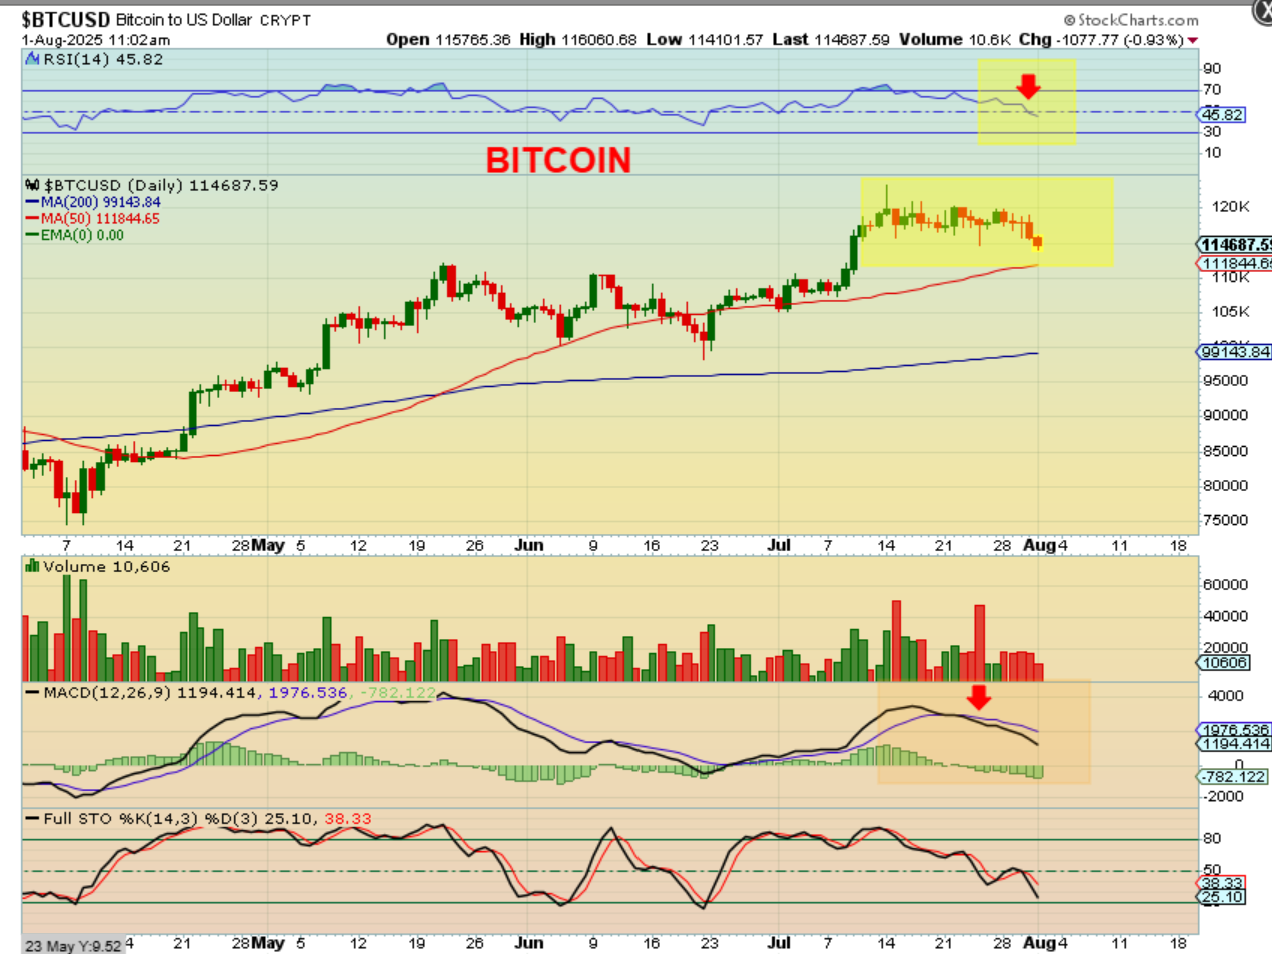
BITCOIN
Notice that Bitcoin is showing weakness in the RSI as well as the MACD now.
1. It may just drop to the 50sma, bounce and then dip lower again into day 60 at the 50sma again,
2. But this set up no longer looks like Bitcoin is ready to run above $130,000 ON THIS RUN. So…
.
So this set up no longer looks like Bitcoin is ready to run above $130,000 ON THIS RUN. We’ll have to see what happens after the next low is put into place. We could see a nice strong rally out of this consolidation after the next dcl, or more chop & even more weakness. I’ll discuss that in the weekend report too.
Wednesday July 31 – Post-Fed Markets 
 August 2 Weekend Report
Scroll to top